- 1Center for Development of Advanced Technologies (CDTA), Algiers, Algeria
- 2The Discipline of Physics, School of Chemistry and Physics, College of Agriculture Engineering and Science, University of KwaZulu Natal, Durban, South Africa
- 3National Institute for Theoretical and Computational Sciences, University of KwaZulu Natal, Durban, South Africa
In this study, space-borne remote sensing (Landsat-8, MODIS) was employed to evaluate the effects of forest fires occurring on 05 July 2021, over Khenchela province, Algeria. Our objective is to understand the severity of damage caused by the fire and its implications for vegetation and land cover. Utilizing the Normalized Difference Vegetation Index (NDVI) from MODIS data and Landsat-8 imagery, we report changes in vegetation health and land cover. To identify areas affected by forest fires and evaluate the severity of damage, the Normalized Burn Ratio (NBR) and Differenced Normalized Burn Ratio (dNBR) were calculated. Analysis showed that −1825.11 ha (1.21%) of the total area experienced severe burns, 3843.54 ha (2.54%) moderate to high severity burns, 3927.97 ha (2.59%) moderate to low severity burns and 9864.45 ha (6.51%) low severity burns. The area covered by vegetation decreased from 2014 to 2021, indicating a negative trend in vegetation cover over the study period.
1 Introduction
Every year, forest fires destroy vast areas globally thereby resulting in severe environmental consequences including the daily destruction of large amounts of forests and vegetation. Fire emissions also significantly impact atmospheric composition, directly affecting climate, human health, and security (Voulgarakis and Field, 2015). Additionally, such forest fires have the potential to change the physical and chemical characteristics of organisms inhabiting the forest ecosystem (Ayoubi et al., 2021). These uncontrolled fires are often initiated by heating and combustion and can rapidly increase in size, covering substantial areas. Furthermore, these fires can lead to a decrease in the surface albedo and an increase in solar radiation reaching the soil layer. Such an increase in the amount of absorbed energy from incoming solar radiation may increase ground temperature (Dintwe et al., 2017). On-site visual inspection or satellite and aerial images have previously been used to quantify fire severity over extensive areas and are currently the only method available to determine fire severity (Kato et al., 2019).
Remote sensing technology is crucial in forest fire detection systems and monitoring and is used in a variety of ways including terrestrial, airborne, and spaceborne-based systems. In order to monitor and detect wildfires, terrestrial-based systems are often ground-based and placed within or close to forested areas. Local firefighting operations and early warning systems frequently use such technologies (Bouakkaz et al., 2021; Ferreira et al., 2020). Satellite remote sensing has evolved to offer increasingly sophisticated methods for environmental monitoring, including forest fire detection (Farhadi et al., 2023). Satellites equipped with thermal infrared sensors can identify the heat signature of fires. These sensors play a crucial role in the identification of fires, particularly under conditions where smoke or clouds block the visible contribution from the fire (Ding et al., 2023). Advancements in satellite technology have also facilitated the development of enhanced spatial resolution, thereby enabling more thorough evaluations of areas affected by fires and their environs (Da et al., 2017). Finally, geospatial parameters and higher spatial resolution satellite data, such as Sentinel-1 radar satellite data, have allowed for the calculation of subindices for fire danger assessment with spatial resolutions between 250 m and 1 km (Mazhar et al., 2016).
The ability to identify and evaluate fires is improved when data from various spectral bands (such as visible, near infrared, or shortwave infrared) are combined. These data fusion methods provide a more thorough understanding of the features of the fire (Mohsenifar et al., 2021). Time series analysis is also possible due to satellite networks’ ability to collect data over time and this technique is employed to determine fire development, spread, and recovery over days, weeks, or years (Hostert et al., 2015; Woodcock et al., 2020; Kotawadekar, 2021; Roodsarabi et al., 2023). Artificial intelligence and machine learning may also be applied to satellite data to automatically detect and anticipate fires. Machine learning techniques are particularly useful in fire monitoring systems because of their enhanced pattern recognition capabilities (Kang et al., 2019; Khankeshizadeh et al., 2022). GIS (a computer-based system) can be employed in the analysis of spatial data in order to facilitate decision making (by both individuals and organizations) and highlight areas of concern (Durmaz et al., 2006). Integrating satellite data with GIS therefore allows for spatial analysis and mapping of fire-prone areas, vulnerability assessments, and development of fire management strategies (Kolios et al., 2017; Sadiku et al., 2017).
Comprehensive monitoring and evaluation of geospatial applications is facilitated through the combination of data from multiple satellite sources, including Landsat, MODIS, VIIRS, and Sentinel. Each satellite is characterized by a distinctive data type thereby enabling an increased understanding of land cover (Forestier et al., 2009). This data combination technique is employed in this investigation.
Forests in the Khenchela province, Algeria, cover a significant portion of the mountainous area within it. Coniferous trees such as Aleppo pine, together with deciduous species such as oak and cork oak, compose the majority of the species found (Hani et al., 2020). Furthermore, desertification and forest fires are two environmental issues that negatively impact local ecosystem and communities within this location. Previous researchers have estimated and mapped the forest fire risk in the Aures region (Khenchela province together with other provinces) of northeast Algeria using the Analytical Hierarchy Process (AHP) method through the integration of geographic information systems (GIS) and remote sensing data. They created a risk map with four different classifications based on percentage area covered, namely, very high-risk (18.28%), high-risk (42.42%), moderate-risk (5.24%), and low-risk (34.05%), respectively (Rahmani and Benmassoud, 2019). In order to map forest fire risk in the Bouhmama region, situated west of Khenchela city (Eastern Algeria), Erten et al. (2004) developed the Turkish model, which included a number of parameters, a GIS application, and remote sensing. There are four susceptibility classes based on the main factors that regulate forest fires. The extremely high vulnerability class is largely found in the northern half of the research zone, where there a combination of human activity, infrastructure (such as roads), and topographic features (steep slopes) (Bouhata et al., 2022). A more recent investigation mapped the extraordinary wildfires in the Aures Mounts System (Khenchela province), that occurred on 5 July 2021. The differenced Normalized Burn Ratio (dNBR) and its Relativized dNBR (RdNBR) were utilized to extract and assess the burned areas from multidate Sentinel 2 images (Boulghobra., 2021).
The present study focuses on examining the outcomes of the forest fire that occurred in Khenchela Province on 5 July 2021, utilizing data from various satellite sources, including MODIS, Landsat-8, Sentinel-2, and Sentinel-5. Through the use of a multi-satellite approach, this research aims to comprehensively understand the environmental dynamics in Khenchela Province. Additionally, it seeks to address key questions including how satellite data can be effectively harnessed to assess the ecological impacts of forest fires on biodiversity and habitat recovery, monitor the environmental effects on air quality and carbon emissions, and evaluate the economic and human health consequences. This study also aims to leverage the insights gained through data analysis to inform and enhance forest management strategies, bolster community resilience, and contribute to policies for fire prevention and climate change mitigation in the region. By addressing these questions, this research provides a comprehensive perspective on the intricate environmental dynamics and far-reaching consequences of the forest fire in Khenchela Province thereby offering valuable insights for environmental management and policy development.
2 Study location, data and methods
2.1 Study area
The province of Khenchela is located in northeast Algeria (35.4269° N, 7.1460° E), approximately 530 km from Algiers, at an altitude of 1,200 m (see Figure 1). Khenchela has a Mediterranean climate with dry, warm summers and cold, rainy winters, and an average annual precipitation of 446 mm (17.6 in). Agricultural land and forest cover account for 89% of the province’s total area with agriculture forming the primary source of income. In the hills and plains, arboriculture is common and plantations cover an area of ∼3.56 kha. For the period from 2001 to 2021, 1.13 kha of tree cover was lost. This is equivalent to 5.6% over the entire 20-year period with an average of approximately 56 ha per year.
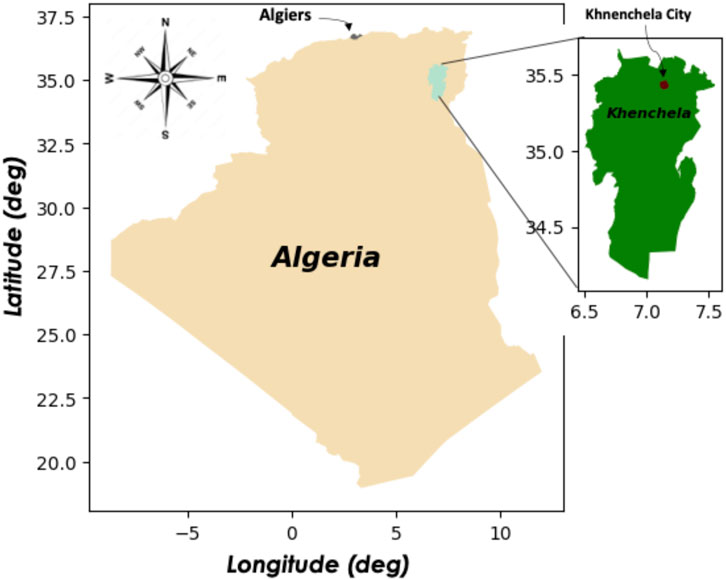
FIGURE 1. Geographical location of Khenchela province in Algeria the enlarged view of the province is also given within the figure. Reproduced from Google Earth Engine. Maps Data: Google, ©2023 TerraMetrics.
2.2 Data and method used
The study utilizes a multi-satellite approach, incorporating data from MODIS, Landsat-8, Sentinel-2, and Sentinel-5, to provide a comprehensive analysis of the region. This approach is distinctive in this geographical context and allows for a more in-depth assessment of the affected areas. Furthermore, this study employs advanced numerical analysis techniques to assess land cover and vegetation. This includes the utilization of the Normalized Difference Vegetation Index (NDVI) from Landsat-8 data, as well as the Normalized Burn Ratio (NBR) for burn area classification. Additionally, by integrating data from Sentinel-2 and Sentinel-5, carbon monoxide (CO) emissions may be monitored. This approach offers a fresh and detailed perspective for understanding the extent and severity of the impact of this fire on the environment.
2.2.1 MODIS data
MODIS (obtained from Terra and Aqua satellites), provides data of multiple spatial resolution over spectral bands covering both visible and thermal-infrared regions. In this analysis it is employed to detect burnt surface area and to facilitate land cover classification. In this study, MCD12Q1 V6 product is used to provide land cover information, aiding in global land cover analysis (Remer et al., 2005; Friedl et al., 2010; Patrick et al., 2014). Unlike a passive microwave sensor that can detect microwave energy through clouds, MODIS is unable to observe the surface under cloudy conditions. Furthermore, sensors in the visible region are only utilized during the day as reflectance is the principal technique used to detect snow and ice. It is therefore limited in its ability to observe snow and sea ice due to the nature of its optical sensors (Olsson et al., 2016; Bussalleu et al., 2022).
2.2.2 Landsat-8 data
Landsat-8, operating in a sun-synchronous near-polar orbit at an altitude of 750 km, provides high-resolution Earth observation data. These data are organized into 185-km swathes using the Worldwide Reference System-2 (WRS-2). Landsat 8 data, processed into Level 1 terrain corrected (L1T) products, features a spatial resolution of 30 m, making it a valuable resource for various applications. The Global Operational Land Imager (GOLI) technique leverages Landsat 8′s capabilities, particularly the higher reflectance in Band 7 for active fire identification. This approach employs contextual fire detection methods and multi-temporal analysis, enhancing its accuracy in identifying active fires (Roy et al., 2016; Kumar and Roy, 2018). One limitation of using Landsat-8 data for fire detection and severity assessment is the limited temporal resolution of the satellite. Landsat-8 has a revisit time of approximately 16 days, which means that it may not capture all fire events or provide timely updates on ongoing fires.
2.2.3 Sentinel-2 and Sentinel-5
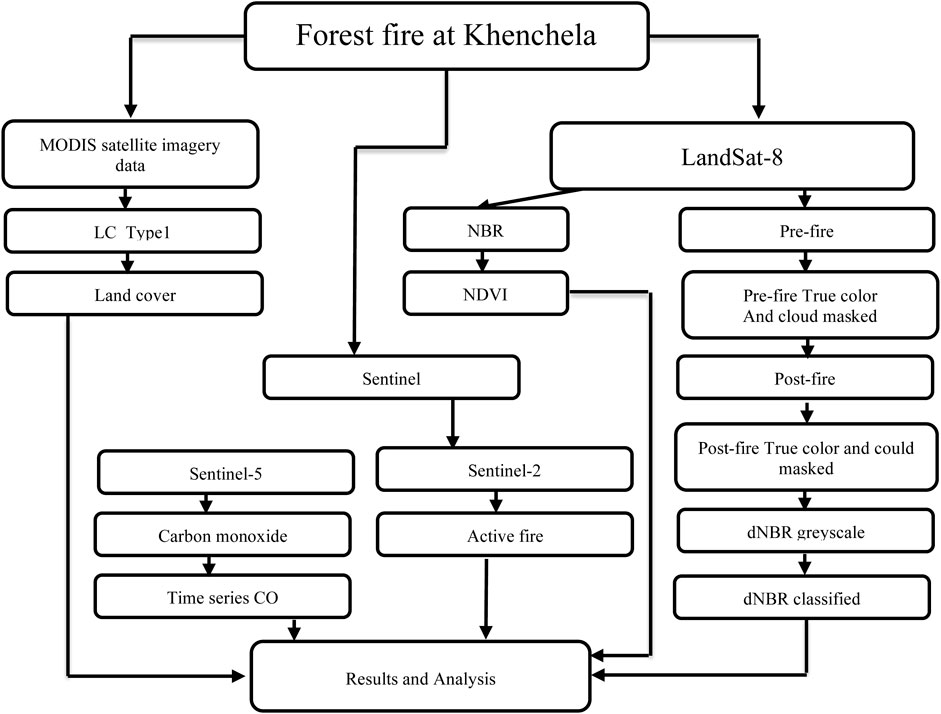
Sentinel-2, with high spatial resolution and frequent revisit intervals, supports land monitoring studies, including land cover and water observations. The present study showcases its utility in fire detection. Additionally, Sentinel-5 Precursor (S5P) with the TROPOMI instrument is used to measure carbon monoxide (CO) emissions, adding an important dimension to fire-related research (Drusch et al., 2012; Veefkind et al., 2012; Landgraf et al., 2016; Shikwambana et al., 2019; Corbane et al., 2020). Sentinel-2 data has limitations, including orthorectification errors, challenges in cloud and shadow masking, and medium spatial resolution that may not be suitable for studying fine-scale river features. The limitations of Sentinel-5 data include coarse spatial resolution, daytime-only observations, occasional data gaps due to orbital patterns. The flow chart presented below in Figure 2 provides an overview of the different datasets used in this study.
3 Results
3.1 Estimation of the land cover over Khenchela province
Before the analysis of burnt areas can be completed, levels of land cover and vegetation in the Khenchela province must be evaluated. To achieve this, a thorough analysis of satellite data must be conducted. Satellite imagery from various sources such as Landsat, Sentinel-2, or MODIS can be used to assess the vegetation cover and land use patterns of the region (Hu et al., 2023). The vegetation indices NDVI (Normalized Difference Vegetation Index) and EVI (Enhanced Vegetation Index) created from these images using remote sensing techniques, can then be used to determine the health and density of the vegetation in the region. In this section, the land cover over Khenchela province is examined, using MODIS satellite.
Figure 3 shows the spatial distributions of different types of land cover over Khenchela province for the years 2010–2020 from MODIS data. Inspection of Figure 3 reveals that Khenchela is characterized by three or more dominant land cover types. This finding suggests that the global land cover distribution depicted in the figure is representative and realistic. The large-scale distribution of land types matches the predicted distribution of a warm-summer Mediterranean climate (barren, open shrublands, croplands, and grassland). A significant number of toggles shifts between distinct land cover types in subsequent years in areas with two or more land cover types, shows that over 36% of Khenchela is predominantly characterized by a single land cover type, namely, barren. This implies that a significant portion of the provincial area, representing more than one-third, is classified as barren land, with the majority of pixels exhibiting this specific land cover type. Additionally, more than 30% of pixels in the remaining land types contain two or more toggles, except the previously listed three stable land types (urban, barren, and evergreen broadleaf). From 50% to 55% of all pixels undergo two or more toggles in the least stable land cover classifications, such as., grasslands, croplands and open shrublands (Broxton et al., 2014).
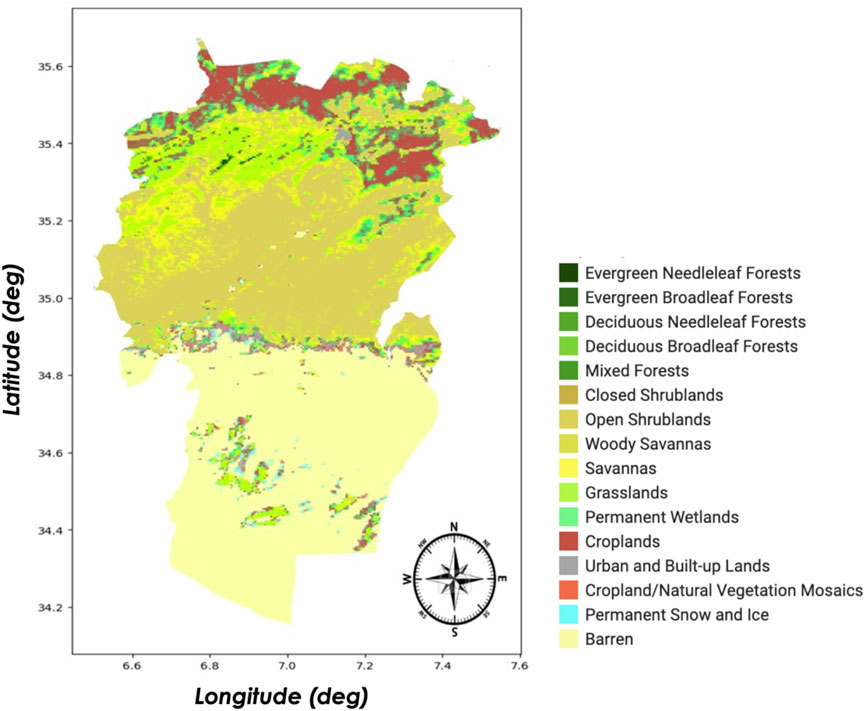
FIGURE 3. Land cover over Khenchela province for ten years (2010–2020). Reproduced from Google Earth Engine. Maps Data: Google, ©2023 TerraMetrics.
The classification map in Figure 3 displays the location and distribution of the various land cover categories for Khenchela between 2010 and 2020. The predominant ecological types of Khenchela (Table 1) are barren (36.71%) and open shrublands (32.31%) and this is a direct result of low precipitation. Such barren terrain and open shrublands prevent the growth of trees. It should be noted that urban class dominance is only 0.18% (18134 ha), (see Table 1).
The data suggests that Khenchela province is facing environmental challenges due to low levels of precipitation, which has resulted in a landscape dominated by barren terrain and open shrublands. This information highlights the need for effective land management practices to conserve the region’s ecosystems and prevent further degradation.
The land cover categories in the province are accurately and reliable represented by the classification map created for Khenchela using MODIS data collected over a 10-year period. It is possible that the land types in Khenchela are dynamic and susceptible to change over time given that more than 30% of pixels in the majority of land cover types contain two or more toggles. This variation may result from natural factors (such as climate variation) and human activities (for example, changing land use). This emphasizes the significance of tracking changes in land cover classification over time to better understand their causes and possible effects on environments and the impact on the livelihoods of individuals,.
The distribution of various land types in the province over an 8-year period is shown in the classification map in Figure 3 (2014–2021). According to Table 1, the two main types of land cover are open shrublands, which make up 32.31% of the total area and 36.71% of barren land. While trees require more moisture to grow, the low levels of precipitation in the area are responsible for the prevalence of these land types. Due to their low stability, land types such as confined shrubland and deciduous needleleaf, may require more concerted conservation efforts.
3.2 The normalized difference vegetation index
Normalized Difference Vegetation Index (NDVI) plays a pivotal role in the realm of remote sensing and environmental monitoring as, it relies on the fundamental principle that healthy vegetation strongly reflects near-infrared (NIR) light and absorbs red light. By quantifying the difference between these spectral bands, NDVI provides a numerical value that signifies the “greenness” and health of vegetation, with values ranging from −1 to 1. In this manner, NDVI empowers researchers and environmental scientists to track long-term changes in vegetative cover, recognize regions under stress or experiencing degradation, and identify the influence of various factors, including climate shifts, land-use changes, and human activity.
The Normalized Difference vegetation index (NDVI) is determined by dividing the total of the near-infrared (NIR) and red spectral regions of a satellite image by their difference (Hu et al., 2023). The NDVI formula is given by:
To provide a more detailed view of the vegetative cover, we classified the NDVI values into distinct categories. This classification system ranged from −1 to 1, with higher values denoting plant cover that is healthy and dense. NDVI may be utilized to monitor long-term changes in vegetation cover and to identify regions where it is under stress or declining. For instance, variations in NDVI values might indicate drought, deforestation, or other changes in land cover.
In this section, we employed a robust methodology to comprehensively analyze the vegetative cover within the Khenchela province of northeastern Algeria over an 8-year period (2014–2021). The Landsat-8 data product offers a rich dataset with high spatial and spectral resolution, making it a valuable resource for monitoring vegetative changes. Normalized difference vegetation index (NDVI) was extracted and processed using JavaScript code editor in the Google Earth Engine (GEE) platform. Additionally, the United States Geological Survey (USGS) online allows users to download Landsat-8 images from 2013 to 2022 at no charge. The GEE platform (https://earthengine.google.com, Mountain View, CA, United States) offers parallel computing and significant data processing opportunities for even vast study areas. Figure 4 shows a collection of the NDVI index averaged over Khenchela province from 2014 to 2021 using the Landsat-8 data product. In Figure 3, greener regions are characterized by higher NDVI value while brown areas indicate lower NDVI values.
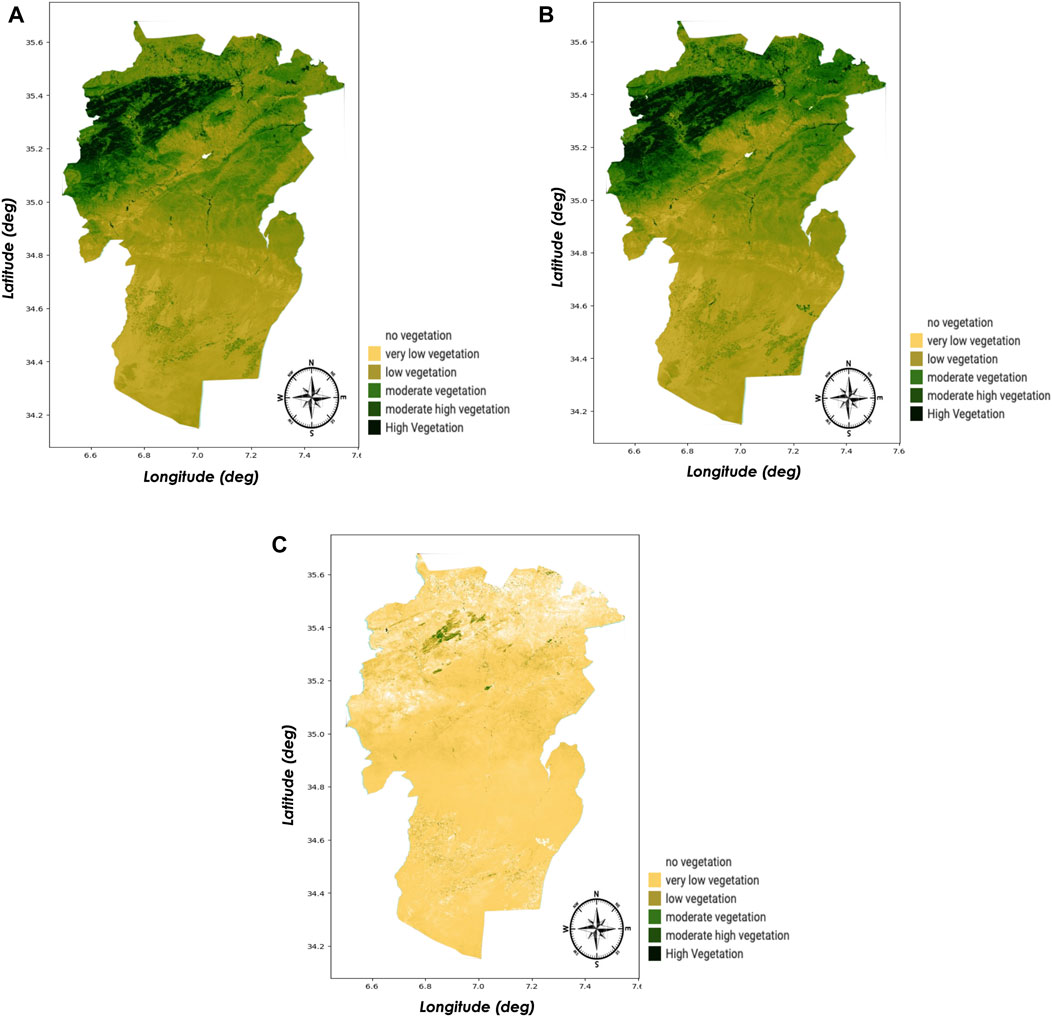
FIGURE 4. The NDVI over Khenchela province using Landsat-8 data (A) 2014 (B) 2021 and (C) difference between 2021 and 2014. Reproduced from Google Earth Engine. Maps Data: Google, ©2023 TerraMetrics.
The results illustrated in Figure 4 suggest that there has been a NDVI variation in the Khenchela province between 2014 and 2021. Figures 4A,B show the observed NDVI for the year 2014 and 2021, respectively, while Figure 4C shows the apparent difference between the two. Over the study period, a shift in NDVI values (either positive or negative) is observed. This is because the vegetation within the area in which there has been no change, is dominated by a forest made up mostly of local trees that are thought to maintain and protect the region’s ecology. Additionally, this area is situated at high altitude.
Using NDVI values, a classification system may be developed that ranges from −1 to +1 and is as follows: very low vegetation (0.0), low vegetation (0.1, 0.2), moderate vegetation (0.3, 0.4), and moderate high vegetation (0.5–0.7). Over the 8 years 2014–2021, the area covered by vegetation decreased. In 2014, there was 951535.17 km2 of low-density and very low vegetation cover, which accounted for 81.72% of the region’s total vegetation. Khenchela is located in the east, where the weather is hot and dry, particularly in the summer, thereby resulting in decreased vegetation. Moderate high vegetation showed a slight increase, namely, 5.48%–5.99% (2014–2021), while moderate vegetation increased from 13.25% to 18.13% for the same period.
The comparison between 2014 and 2021 reveals fluctuations in vegetation density, with certain areas showing signs of recovery while others experience a decline. This dynamic nature of vegetation cover within the province underscores the importance of continued monitoring. This analysis suggests that the Khenchela province is facing challenges in maintaining vegetation cover due to its hot and dry climate. Such changes could be the result of varying climatic conditions, increased urbanization, and land-use changes.
The positive difference in NDVI values between 2014 and 2021 where NDVI in 2014 is greater than that observed in 2021, indicates a change in vegetation across the province. This supports the conclusion that vegetation in the Khenchela province has been declining over time.
The observed frequency range of NDVI over the Khenchela province is presented in histogram form in Figure 5 using Landsat-8 data in 2014 and 2021. The overall distribution of vegetation cover for the Khenchela province can be determined from this histogram. According to the frequency values, the NDVI values range from 0 to 0.5. Figure 5A shows the distribution of NDVI values for 2014, indicating that in the Khenchela province during this time, there were areas with very low vegetation (NDVI value of 0). This might result from factors such as bare soil, bodies of water, or urban areas. The second bin NDVI = 0.1 corresponds to a frequency of 175,000, thereby indicating areas with low vegetation cover which might be due to barren and open shrublands, the third bin NDVI = 0.2 corresponds to a frequency of 25,000 and corresponds to areas with marginally more robust vegetative cover. Compared to the previous bin, these areas might be populated by croplands or healthier more dense vegetation. The lower frequency of 10,000 in the fourth bin NDVI = 0.3 indicates areas with even more robust vegetative cover that might be associated with grasslands. Figure 5B shows the histogram of NDVI during 2021 and the NDVI value that was most often observed in both years was 0.1. This shows that the vegetation growth patterns in the Khenchela province were largely static over time. Additionally, NDVI values of 0.2 and 0.3 occurred more frequently in 2021 compared to 2014, suggesting that the vegetation cover may have improved. However, in 2021, there was a decrease in the frequency of NDVI values of 0.4 and 0.5, indicating a decline in the vegetation cover at these levels.
The impact of environmental factors on vegetative cover in Khenchela province is multifaceted and dynamic. The combination of climatic conditions, human activities, ecological resilience, and seasonal variations collectively shapes the vegetative landscape. The NDVI analysis provides valuable insights into the repercussions of these factors, highlighting the challenges and opportunities for preserving and enhancing vegetative cover in the region. To address these challenges effectively, a comprehensive understanding of the intricate relationship between environmental factors and vegetative dynamics is crucial.
3.3 Burned area estimates
Forest fires are classified by the size of the area burned and the severity of the fire. The quantity of vegetation burned by fire and the pace of plant regrowth after a fire are directly proportional to fire severity (Hudak et al., 2007). Detecting burned areas is not the only issue, determining the severity of soil damage is also essential for post-fire land management and plant regeneration. Forests usually regenerate following forest fires, however, some severely burned areas may not regrow naturally in short periods of time. This may necessitate the identification of such areas where soil enrichment is required to promote the growth of forest and other flora (Keeley, 2009; Sazayya et al., 2020).
As accurate detection and mapping of fires are crucial for effective fire control, remote sensing provides a precise and efficient methodology for mapping burnt regions and measuring burn severity levels. Although satellites (such as those discussed above) are widely used, they have low spatial resolution which makes active fire detection challenging. It is therefore recommended that spaceborne sensors with increased spatial resolution, such as Landsat-8 and Sentinel l-2, are employed.
The detection of localized forest fires during the period March—May, over Khenchela was carried out using spectrally sensitive Landsat-8 OLI orthorectified surface reflectance data. Shortwave infrared (SWIR) and vegetation health or greenness fluctuation responsive to vegetation burn scar Landsat-8 OLI’s near-infrared (NIR) and red bands were used to calculate fire-scarred spectral indices or NBR.
A burned area from Landsat-8 images is shown in Figure 6 together with (a) pre-fire, (b) post-fire, and (c) the spatial distribution of burned area highlighted in the study region using NBR. The pre-fire image shows type of vegetation and other land cover features that were present before the fire (Figure 6A). The areas that were most severely burned were seen in the post-fire image, where there is little or no vegetation cover remaining (Figure 6B). In the near-infrared and shortwave infrared bands of the Landsat-8 data, these regions are often identified by high reflectance values. In the post-fire image, burn scars are clearly seen. Charcoal and ash remnants, the absence of vegetation, and changes to the structure of vegetation, are characteristics of burned areas of land. In next section, burnt areas are determined together with the severity of burning events.
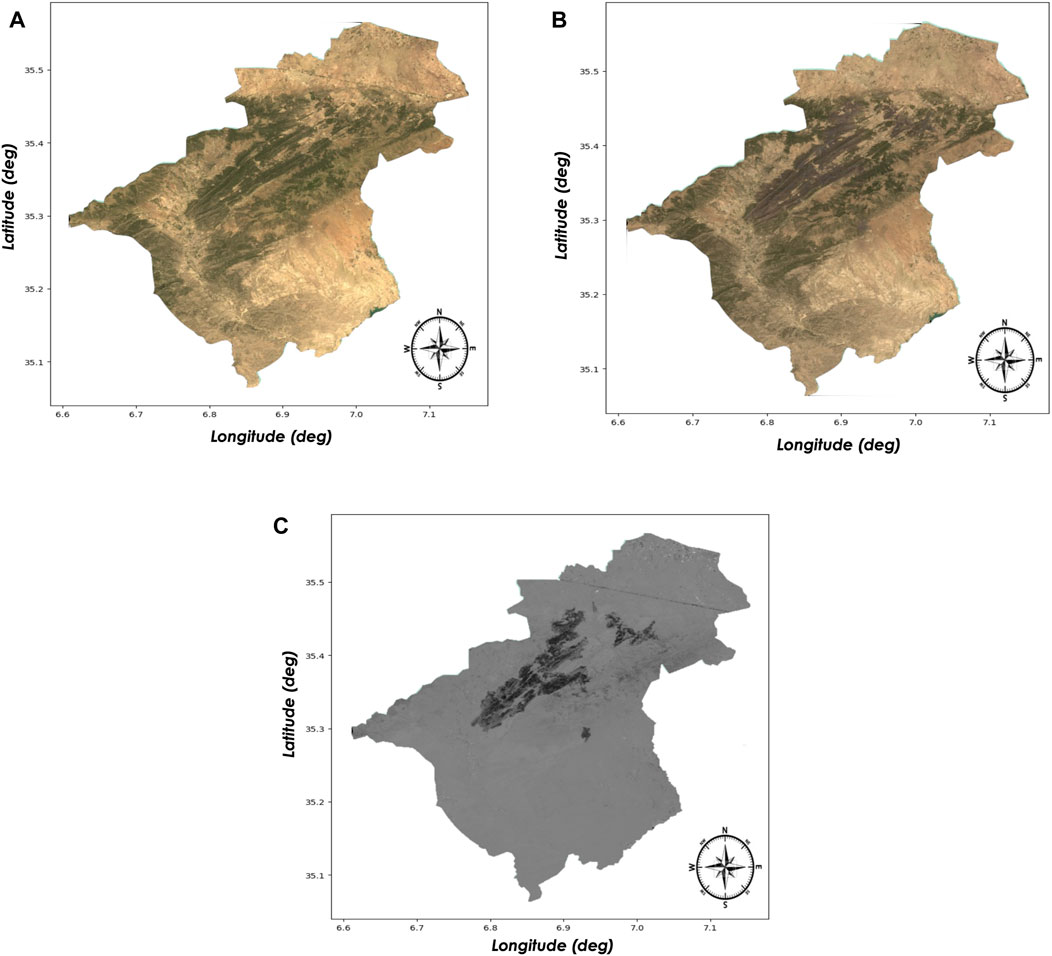
FIGURE 6. Burned area mapping with Landsat; (A) pre-fire image; (B) post-fire image; (c) detected burned areas in the study area greyscale. Reproduced from Google Earth Engine. Maps Data: Google, ©2023 TerraMetrics.
3.4 Burn severity assessment
In this section, results obtained using two widely employed spectral indicators, the Normalized Burn Ratio (NBR) and dNBR are compared for a sample of burned regions from several forest fires (van Wagtendonk et al., 2004). Various remote sensors (e.g., MODIS, Landsat-8, and Sentinel-2) have been examined for their ability to match field severity measurements, with the Landsat thematic map-per sensor regarded as the best for this purpose (Keeley, 2009).
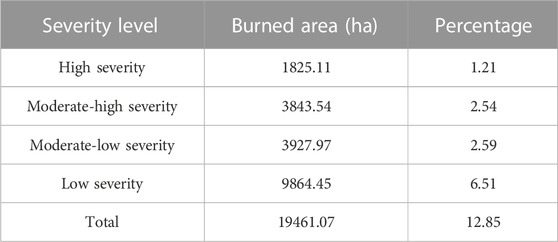
The effects of the forest fire that broke out on 5 July 2021 in Khenchela province, are seen on the burn severity map created using Landsat-8 satellite images (Figure 7). The size of the fire is indicated on the map together with the degree of burn damage for various regions, ranging from completely unburned to severely burned. The affected municipalities included Tamza, Chelia, Elhamma, and Bouhmama. Figure 7 provides important details for the determination of the extent of the fire’s devastation. Results indicate that 1825.11 ha (1.21%) of the area experienced severe burning, 3843.54 ha (2.54%) was covered by moderate-high severity burns, 3927.97 ha (2.59%) by moderate-low severity burns, and 9864.45 ha (6.51%) by low severity burns. Based on the classification of dNBR (Figure 7), rates and distribution of burn severity levels are summarized in Table 3.
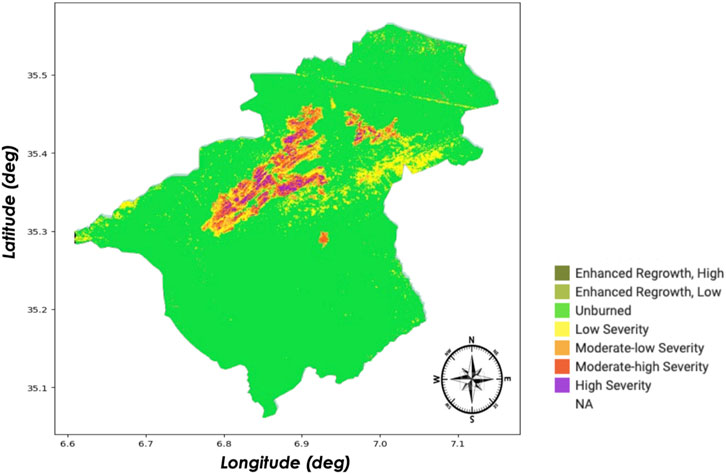
FIGURE 7. Spatial distributions of burned area by severity class. Reproduced from Google Earth Engine. Maps Data: Google, ©2023 TerraMetrics.
The burn severity map provides crucial details of the impact of the forest fire on the study area and facilitates in post-fire management choices. Areas that need immediate attention and restoration can be easily identified using the information provided on spatial distribution and severity of burns. For example, areas with severe burns may require more intensive rehabilitation efforts, while regions with low-severity burns may need less intervention. Understanding the burn severity helps to inform the development of appropriate management strategies and allocate resources effectively.
Burn severity maps of the fire incidents in the Khenchela province in the east of Algeria were created using the most precise classification techniques (dNBR) derived from Landsat-8 satellite data. When compared with a previous study, the severity maps produced for the same fire occurrence using (dNBR) from the Sentinel-2 satellite, Boulghobra (2021) highlighted a few differences. The differenced Normalized Burn Ratio (dNBR) and relativized dNBR (RdNBR) were utilized to extract and assess the burned areas from multidate Sentinel 2 images. Results show that the fire occurring on 5 July caused dNBR: low 8.929 kha, moderate low 3.407 kha, moderate high 2.715 kha and high 5.459 kha, while the RdNBR results found low 9.442 kha, moderate low 3.077 kha, moderate high 3.953 kha and high 2.654 kha. Comparing dNBR from Landsat-8 data to RdNBR and dNBR derived from Sentinel-2 data, this study shows that RdNBR provided a more precise and reliable estimation of burn severity.
Due to its high spatial resolution, multispectral images and regular coverage, Landsat-8 satellite data is an invaluable resource for analyzing the severity of burned areas. For researchers intending to understand the ecological effects of wildfires and direct post-fire management and restoration activities, it is a popular choice (Soverel et al., 2010; Veraverbeke et al., 2010).
While Landsat-8 satellite data has several advantages for burned area severity analysis, recent research has shown that Sentinel-2 data generally outperforms Landsat-8 data for four spectral indicators of burn intensity (Howe et al., 2022). Comparison of maps generated using different methodologies demonstrate the impact of the chosen approach on the thematic representation of burn severity. This highlights the importance of considering the methodology used and acknowledging the limitations of the information derived from it, as outlined by Howe et al. (2022). Moreover, the choice between using NBR (Normalized Burn Ratio) derived from Landsat-8 data and NBR derived from Sentinel-2 data may be influenced by the different associations of these indices with various vegetation types. Each satellite sensor has its own spectral characteristics and resolution, which can affect how it captures and represents vegetation health and burn severity.
3.5 Variation of CO
During smouldering fires, numerous trace gases are typically emitted, and their release is often associated with carbon monoxide (CO) (Koppmann et al., 2005). Fossil fuel combustion, biomass burning, and atmospheric oxidation of methane and other hydrocarbons are the primary sources of carbon monoxide (CO). While burning fossil fuels is the primary source of CO in northern mid-latitudes, isoprene oxidation and biomass burning are significant contributors in the tropics (Zhong et al., 2017). Applying the Cross-Sectional Flux (CSF) approach to the TROPOMI CO product (2019–2021), the emission estimates for the studied Algiers city (the Algeria capital) are 0.213 Tg yr-1 (Leguijt et al., 2023).
Figure 8A displays fires burning in plantation woods in the Khenchela province, as seen in Sentinel-2 data obtained for 6 July 2021. As demonstrated in Figure 8B, active fires and the associated rising smoke plume may be detected by utilizing SWIR, NIR, and red spectral bands. Sentinel-2 data footage was taken during this fire incident since its 5-day temporal cycle may have prevented it from detecting other active fires. As previously mentioned, all currently available active fire detection devices are fitted with sensors with a coarse spatial resolution of 250 m, making it extremely difficult to identify smaller fires (Roteta et al., 2019).
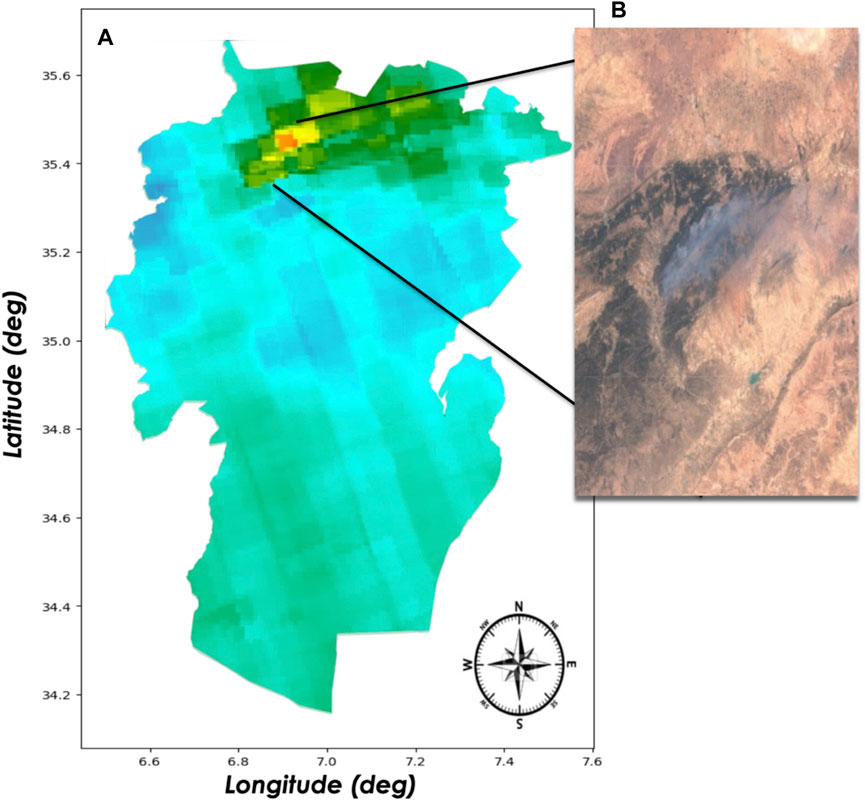
FIGURE 8. (A) The forest fire burning in the Khenchela forest during July 2021 as recorded by the Sentinel-2 satellite; (B) Carbon Monoxide column density as measured by Sentinel-5. Reproduced from Google Earth Engine. Maps Data: Google, ©2023 TerraMetrics.
While small fires typically result in less damage than larger ones, they nonetheless affect the dynamics of the environment and the atmosphere (Hantson et al., 2013), According to Roteta et al. (2019), when cloud identification as the primary source of commission errors was corrected, the high resolution output of Sentinel-2 data increased the amount of the overall burnt area observed.
Trace gases like CO and other combustion products are released into the atmosphere during forest fires (Andreae, 2019). Sentinel-5 data was used to map the CO column density across South Africa during the research period. The findings are shown in Figure 8A. Figure 8B indicates that the study area reporting the most significant CO levels (scattered tiny red patches within the figure) and medium-low to medium-high (yellow/purple) levels was seen in the north-eastern regions.
Figure 9 shows the CO column density time series, which exhibited a decrease in the study region from 1 June to 15 August 2021. During this time, the column density of CO was typically 0.025 mol/m2. The significant rise in CO from 0.032 mol/m2 on 5 July to 0.035 mol/m2 on 7 July and peaking at 0.043 mol/m2 on 8 July 2021, is related to a large fire that destroyed several hectares of plantation forest nearby.
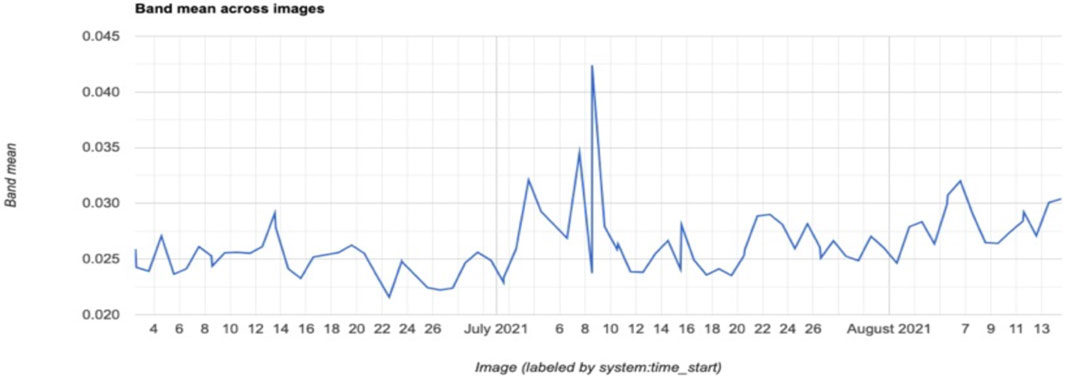
FIGURE 9. Daily Carbon Monoxide column density over the study area between June 1, 2021, and July 15, 2021.
4 Discussion and concluding remarks
The results of our study indicate a concerning trend in land cover dynamics in Khenchela province, namely, that over 68% of the province is classified as either barren land or open shrublands. The observation that over 30% of land cover pixels exhibit changes underscores the importance of continuous monitoring to comprehend the underlying causes. Urban areas comprise only 0.18% of the total (Table-1). The classification map generated from the 10-year MODIS dataset demonstrates the dynamic nature of land cover types in the region, highlighting their susceptibility to change over time due to both natural factors and human activities. Furthermore, the high incidence of forest fires in the area poses a considerable risk, necessitating robust fire prevention and management strategies (Xuegang et al., 2015). The agreement of this study with global datasets enhances the accuracy of our land cover classification, contributing to a deeper understanding of arid region dynamics. Studies conducted in arid regions (Mihi et al., 2022; Zerouali et al., 2023), observed a significant prevalence of barren land and open shrublands in arid and semi-arid regions, distinguished by low precipitation levels. In a similar manner, this study highlights a landscape susceptible to ecological challenges due to low precipitation.
In the northern part of the province, the danger of wildfires poses a significant threat to existing forests (Bouhata et al., 2022; Mihi et al., 2022), however in the southern and central regions of the province, desertification is recognized as a major concern (Zerouali et al., 2023). These contrasting threats reflect the diverse ecological challenges faced by different parts of the province, necessitating region-specific conservation and management strategies.
The present investigation included an in-depth analysis of the vegetative landscape in Khenchela province, Algeria, over an 8-year period from 2014 to 2021 using Landsat-8 satellite data to calculate the Normalized Difference Vegetation Index (NDVI). Due to the dynamic character of the land cover in Khenchela, it is crucial to track temporal changes in order to better understand their cause and potential implications for the environment and impact on individual livelihoods. Our findings indicate a complex relationship between environmental factors and vegetation dynamics. In 2014, the low-density and very low vegetation cover was 81.72% of the region’s total vegetation, moderate vegetation 13.25% and moderate high vegetation corresponded to 5.48% (Table 2). The positive difference in NDVI values between 2014 and 2021, with NDVI in 2014 higher than that in 2021, indicated a change in vegetation across the province, namely, that vegetation has been declining over time. Our study’s findings align with the research conducted by Bouzekri et al. (2023), who investigated desertification in the south of Khenchela province. They reported a 12% desertification rate during 2013–2019. This decrease in vegetation, as highlighted in their study, corresponds with our findings, further emphasizing the ecological challenges posed by reduced vegetation and the dominance of barren land in the region. In a study conducted by Zerouali et al. (2023), their results revealed significant changes in the north of Algeria land cover over 2 decades. The forested area experienced a substantial decrease of 64.96% during the period from 2000 to 2020. By contrast, the barren land classification exhibited a significant increase of 40% during the same timeframe. These findings are in agreement with our observations, which emphasize the prevalence of barren land and the dynamic nature of land cover in the region, particularly in relation to vegetation changes. Mihi et al. (2022) highlighted the desertification risk changes increasingly along a North-to-South gradient of the whole research area that shares a border with Khenchela province. The utilization of NDVI data derived from Landsat-8 data over Khenchela provides valuable insights into understanding the region’s ecological dynamics and land cover changes. This contributes to the broader body of knowledge regarding arid and semi-arid environments, highlighting the influence of low precipitation and desertification on land cover composition.
In the face of ongoing environmental changes, the assessment of land use and vegetation health in Khenchela province serves as a crucial reminder of the intricate relationship between environmental factors and ecosystem dynamics. The dominance of open shrublands and barren terrain highlights the stark impact of a hot and arid climate. Low vegetation density and loss of vegetation cover, are influenced by climate variations as low precipitation, and desertification and human activities, To identify and map forest fires, the assessment of burned areas employed using Landsat-8 data. A direct relationship is observed between the severity of forest fires and the extent of vegetation loss. For instance, severe burns are associated with a significant reduction in vegetation cover. Remote sensing technologies such as Landsat-8, with their higher spatial resolution, enhance the precision of detecting burned areas. Spectral indices such as NBR and dNBR quantify burn severity effectively. The resulting maps indicate that 1.21% of the area experienced severe burning, 2.54% had moderate-high severity burns, 2.59% exhibited moderate-low severity burns, and 6.51% showed low severity burns (Table 3). These findings have tangible implications for post-fire land management, facilitating resource allocation based on specific burn severity levels. The spatial distribution of burns plays a pivotal role in shaping tailored strategies for ecosystem recovery, contributing to ecological resilience enhancement. Previous analysis conducted by Boulghobra (2021) on the same fire event using dNBR from the Sentinel-2 satellite dataset, offered valuable insights that closely align with our findings. Forest fires can have diverse causes, both natural and human induced (Rahmani and Benmassoud, 2019), and as reported by Zerouali et al. (2023) the forest area over northern Algeria decreased by 64.96% during the period from 2000 to 2020. The present study demonstrates that the use of Landsat-8 data and spectral indices are a valuable and precise method for identifying and mapping forest fires. This analysis provided clear evidence of the link between the severity of forest fires and the extent of vegetation loss, offering critical insights for post-fire land management over Khenchela province. Additionally, the spatial distribution of burn severity plays a crucial role in tailoring strategies for ecosystem recovery, contributing to ecological resilience enhancement. The study highlights the importance of remote sensing technology in monitoring environmental changes resulting from forest fires. Overall, this research reinforces the understanding of the impact of forest fires on ecosystems and the utility of advanced technology in addressing environmental challenges.
This investigation has highlighted the importance of monitoring CO levels as an indicator of forest fire activity and aided in the understanding of the impact of changes in CO concentration on the broader ecosystem and public health. High CO concentrations are a marker for overall air quality as well as a measure of the size and intensity of fire. In order to effectively respond to and mitigate environmental and health risks associated with forest fires, CO data is extremely valuable for air quality monitoring and early fire warning systems. This study offers important new insights into the significance of forest fires for both natural ecosystems and human wellbeing, and adds to the understanding of the relationship between CO emissions and forest fires.
In conclusion, the factors influencing land cover and vegetation in Khenchela province primarily revolve around three key elements: low precipitation, desertification, and forest fires. These factors collectively shape the landscape and impact vegetation health. Additionally, the environmental impact of carbon monoxide, a byproduct of forest fires, further contributes to the complex dynamics affecting the region’s ecosystems and environment. Understanding and addressing these factors are crucial for effective land management and environmental conservation in Khenchela province.
Data availability statement
The raw data supporting the conclusion of this article will be made available by the authors, without undue reservation.
Author contributions
RG: Conceptualization, Data curation, Formal Analysis, Software, Visualization, Writing–original draft, Writing–review and editing. VS: Supervision, Writing–review and editing.
Funding
The author(s) declare that no financial support was received for the research, authorship, and/or publication of this article.
Acknowledgments
The authors gratefully acknowledge the MODIS data support team for processing data via the GES-DISC interactive online visualization and analysis infrastructure (GIOVANNI), as a part of NASA. Authors equally acknowledge the other satellite data products used here through Google Earth Engine and other platforms. The authors would also like to thank Dr. Barbara Lynn Duigan for proofreading this article.
Conflict of interest
The authors declare that the research was conducted in the absence of any commercial or financial relationships that could be construed as a potential conflict of interest.
Publisher’s note
All claims expressed in this article are solely those of the authors and do not necessarily represent those of their affiliated organizations, or those of the publisher, the editors and the reviewers. Any product that may be evaluated in this article, or claim that may be made by its manufacturer, is not guaranteed or endorsed by the publisher.
References
Andreae, M. O. (2019). Emission of trace gases and aerosols from biomass burning–an updated assessment. Atmos. Chem. Phys. 19, 8523–8546. doi:10.5194/acp-19-8523-2019
Ayoubi, S., Rabiee, S., Mosaddeghi, M. R., Abdi, M. R., and Afshar, F. A. (2021). Soil erosion and properties as affected by fire and time after fire events in steep rangelands using 137 Cs technique. Arab. J. Geosci. 14, 113. doi:10.1007/s12517-020-06351-1
Bouakkaz, F., Wided, A., and Makhlouf, D. (2021). Forest fire detection using wireless multimedia sensor networks and image compression. Immunotechnology 20 (1), 57–63. doi:10.18280/I2M.200108
Bouhata, R., Aida, B., and Yahyaoui, H. (2022). “Vulnerability mapping of forest fires risk in the Bouhmama region, Khenchela (east Algeria),” in Research developments in geotechnics, geo-informatics and remote sensing. CAJG 2019. Advances in science, technology & innovation. Editors H. El-Askary, Z. A. Erguler, M. Karakus, and H. I. Chaminé (Cham: Springer). doi:10.1007/978-3-030-72896-0_88
Boulghobra, N. (2021). Sentinel 2 imagery and burn ratios for assessing the july 5, 2021 wildfires severity in the region of khenchela (northeast algeria). Geogr. Tech. 16, 2, pp 95 to 104. doi:10.21163/GT_2021.162.08
Bouzekri, A., Alexandridis, T. K., Aliat, T., Rebouh, N. Y., Chenchouni, H., Kucher, D., et al. (2023). Assessment of the spatial dynamics of sandy desertification using remote sensing in Nemamcha region (Algeria). Egypt. J. Remote Sens. Space Sci. 26, 642–653. doi:10.1016/j.ejrs.2023.07.006
Broxton, P. D., Zeng, X., Sulla-Menashe, D., and Troch, P. A. (2014). A global land cover climatology using MODIS data. J. Appl. Me- Teor. Climatol. 53, 1593–1605. doi:10.1175/JAMC-D-13-0270.1
Bussalleu, A., Kees de, H., Hoek, G., and Kloog, I. (2022). Modeling MODIS LST at European scale. Environ. health Perspect. 2022 (1), 2022. doi:10.1289/isee.2022.p-0304
Corbane, C., Politis, P., Kempeneers, P., Simonetti, D., Soille, P., Burger, A., et al. (2020). A global cloud free pixel-based image composite from Sentinel-2 data. Data Brief. 31, 105737. doi:10.1016/j.dib.2020.105737
Da, Y., Mei, G., Gong, D., Liu, J., Xu, D., Li, G., et al. (2017). High-resolution video satellite imaging system.
Ding, Y., Wang, M., Fu, Y., Zhang, L., and Wang, X. (2023). A wildfire detection algorithm based on the dynamic brightness temperature threshold. Forests 14, 477. doi:10.3390/f14030477
Dintwe, K., Okin, G. S., and Xue, Y. (2017). Fire-induced albedo change and surface radiative forcing in sub-Saharan Africa savanna ecosystems: implications for the energy balance. J. Geophys. Res. Atmos. 122, 6186–6201. doi:10.1002/2016JD026318
Drusch, M., Del Bello, U., Carlier, S., Colin, O., Fernandez, V., Gascon, F., et al. (2012). Sentinel-2: ESA's optical high-resolution mission for GMES operational services. Remote Sens. Environ. 120, 25–36. doi:10.1016/J.RSE.2011.11.026
Durmaz, B. D., Ertuğrul, B., Ali İhsan, K., Bülent, S., Ömer, K., and Başkent, E. Z. (2006). Spatial fire potential analysis and mapping using landsat satellite imagery and gis. For. Ecol. Manag., 234. doi:10.1016/J.FORECO.2006.08.040
Erten, E., Kurgun, V., and Musaoglu, N. (2004). “Forest fire risk zone mapping from satellite imagery and GIS,” in XXth ISPRS congress, youth forum, July 12–23, 2004 (Turkey: Istanbul), 33–39.
Farhadi, H., Ebadi, H., and Kiani, A. (2023). Badi: a novel burned area detection index for sentinel-2 imagery using google earth engine platform. ISPRS Ann. Photogramm. Remote Sens. Spat. Inf. Sci. X-4/W1-2022, 179–186. doi:10.5194/isprs-annals-X-4-W1-2022-179-2023
Ferreira, L. M., Coimbra, A. P., and de Almeida, A. T. (2020). Autonomous system for wildfire and forest fire early detection and control. Inventions 5 (3), 41. doi:10.3390/INVENTIONS5030041
Forestier, G., Wemmert, C., Gancarski, P., and Inglada, J. (2009). “Mining multiple satellite sensor data using collaborative clustering,” in 2009 IEEE International Conference on Data Mining Workshops, Miami, FL, USA, 501–506. doi:10.1109/ICDMW.2009.42
Friedl, M. A., Sibley, A., Annemarie, S., Navin, R., Adam, S., and Xiaoman, H. (2010). MODIS Collection 5 global land cover: algorithm refinements and characterization of new datasets. Remote Sens. Environ. 114 (1), 168–182. doi:10.1016/J.RSE.2009.08.016
Hani, I., Rached-Kanouni, M., Khamar, H., and Menasri, A. (2020). Study of the dynamics of natural stands of pinus halepensis in the beni oudjana forest (Khenchela, Algeria). Eco. Env. Cons. 26 (3), 21–26.
Hantson, S., Padilla, M., Corti, D., and Chuvieco, E. (2013). Strengths and weaknesses of MODIS hotspots to characterize global fire occurrence. Remote Sens. Environ. 131, 152–159. doi:10.1016/j.rse.2012.12.004
Hostert, P., Patrick, G., van der Linden, S., and Pflugmacher, D. (2015). “Time series analyses in a new era of optical satellite data,” in Remote sensing time series. Remote sensing and digital image processing. Editors C. Kuenzer, S. Dech, and W. Wagner (Springer, Cham), 22, 25–41. doi:10.1007/978-3-319-15967-6_2
Howe, A. A., Parks, S. A., Harvey, B. J., Saberi, S. J., Lutz, J. A., and Yocom, L. L. (2022). Comparing sentinel-2 and landsat 8 for burn severity mapping in western north America. Remote Sens. 14, 5249. doi:10.3390/rs14205249
Hu, Y., Raza, A., Syed, N. R., Acharki, S., Ray, R. L., Hussain, S., et al. (2023). Land use/land cover change detection and NDVI estimation in Pakistan’s southern Punjab province. Sustainability 15, 3572. doi:10.3390/su15043572
Hudak, A. T., Morgan, P., Bobbitt, M. J., Smith, A. M. S., Lewis, S. A., Lentile, L. B., et al. (2007). The relationship of multispectral satellite imagery to immediate fire effects. Fire Ecol. 3, 64–90. doi:10.4996/fireecology.0301064
Kang, L.-W., Wang, I.-S., Chou, K.-L., Chen, S.-Y., and Chang, C.-Y. (2019). “Image-based real-time fire detection using deep learning with data augmentation for vision-based surveillance applications,” in Conference: 2019 16th IEEE International Conference on Advanced Video and Signal Based Surveillance (AVSS), 1–4. doi:10.1109/AVSS.2019.8909899
Kato, A., Moskal, L. M., Batchelor, J. L., Thau, D., and Hudak, A. T. (2019). Relationships between satellite-based spectral burned ratios and terrestrial laser scanning. Forests 10, 444. doi:10.3390/F10050444
Keeley, J. E. (2009). Fire intensity, fire severity and burn severity: a brief review and suggested usagefire severity and burn severity: a brief review andsuggested usage. Int. J. Wildland Fire 18, 116–126. doi:10.1071/WF07049
Khankeshizadeh, E., Mohammadzadeh, A., Moghimi, A., and Mohsenifar, A. (2022). FCD-R2U-net: forest change detection in bi-temporal satellite images using the recurrent residual-based U-net. Earth Sci. Inf. 15, 2335–2347. doi:10.1007/s12145-022-00885-6
Kolios, S., Andrei, V., Gulnara, R., Chrysostomos, D., et al. (2017). Geographic information systems, 3–45. doi:10.1007/978-3-319-53086-4_1
Koppmann, R., von Czaplewski, K., and Reid, J. S. (2005). A review of biomass burning emissions, part 1: gaseous emissions of carbon monoxide, methane, volatile organic compounds, and nitrogen containing compounds. Atmos. Chem. Phys.Discuss. 5, 10455–10516. doi:10.5194/acpd-5-10455-2005
Kotawadekar, R. (2021). Satellite data: big data extraction and analysis. Artif. Intell. Data Min., 177–197. doi:10.1016/B978-0-12-820601-0.00008-2
Kumar, S., and Roy, D. P. (2018). Global operational land imager Landsat-8 reflectance-based active fire detection algorithm. Int. J. Digital Earth 11 (2), 154–178. doi:10.1080/17538947.2017.1391341
Landgraf, J., de Brugh, J., Scheepmaker, R., Borsdorff, T., Hu, H., Houweling, S., et al. (2016). Carbon monoxide total column retrievals from TROPOMI shortwave infrared measurements. Atmos. Meas. Tech. 9 (10), 4955–4975. doi:10.5194/AMT-9-4955-2016
Leguijt, G., Maasakkers, J. D., Denier van der Gon, H. A. C., Segers, A. J., Borsdorff, T., and Aben, I. (2023). Quantification of carbon monoxide emissions from African cities using TROPOMI. Atmos. Chem. Phys. Discuss. in review. doi:10.5194/acp-2023-35
Mazhar, A., Farhan, H., Muhammad, R., Anjum, M. R., Saher, M., and Saleem, M. A. (2016). High resolution image processing for remote sensing application, 302–305. doi:10.1109/INTECH.2016.7845047
Mihi, A., Rabeh, G., and Daoud, wissal. (2022). Mapping potential desertification-prone areas in North-Eastern Algeria using logistic regression model, GIS, and remote sensing techniques. Environ. earth Sci. 81 (15), 385. doi:10.1007/s12665-022-10513-7
Mohsenifar, A., Ali, M., Moghimi, A., and Salehi, B. (2021). A novel unsupervised forest change detection method based on the integration of a multiresolution singular value decomposition fusion and an edge-aware Markov Random Field algorithm. Int. J. Remote Sens. 42 (24), 9376–9404. doi:10.1080/01431161.2021.1995075
Olsson, P.-O., Kantola, T., Lyytikäinen-Saarenmaa, P., Jönsson, A. M., and Eklundh, L. (2016). Development of a method for monitoring of insect induced forest defoliation – limitation of MODIS data in Fennoscandian forest landscapes. Silva Fenn. 50 (2), 1–22. doi:10.14214/SF.1495
Patrick, D., Zeng, X, William, S., and Peter, T. (2014). A MODIS-based global 1-km maximum green vegetation fraction dataset. J. Appl. Meteorology Climatol. 53 (8), 1996–2004. doi:10.1175/JAMC-D-13-0356.1
Rahmani, S., and Benmassoud, H. (2019). Modelling of forest fire risk spatial distribution in the region of 397 Aures, Algeria. Geoadria 24/2, 79–91. doi:10.15291/geoadria.2846
Remer, L. A., Kaufman, Y. J., Tanré, D., Mattoo, S., Chu, D. A., Martins, J. V., et al. (2005). The MODIS aerosol algorithm, products, and validation. J. Atmos. sciences—special Sect. 62, 947–973. doi:10.1175/JAS3385.1
Roodsarabi, Z., Sam-Khaniani, A., and Kiani, A. (2023). Investigation of post fire vegetation regrowth under different burn severities based on satellite observations. Int. J. Environ. Sci. Technol. 20, 321–340. doi:10.1007/s13762-022-04500-5
Roteta, E., Bastarrika, A., Padilla, M., Storm, T., and Chuvieco, E. (2019). Development of a sentinel-2 burned area algorithm: generation of a small fire database for sub-saharan Africa. Remote Sens. Environ. 222, 1–17. doi:10.1016/j.rse.2018.12.011
Roy, D. P., Kovalskyy, V., Hankui, K., Zhang, H. K., Vermote, E. F., Yan, L., et al. (2016). Characterization of Landsat-7 to Landsat-8 reflective wavelength and normalized difference vegetation index continuity. Remote Sens. Environ. 185 (1), 57–70. doi:10.1016/J.RSE.2015.12.024
Sadiku, M. N. O., Tembely, M., and Musa, S. (2017). Geographic information systems: a primer. 7(3):47–48. doi:10.23956/IJARCSSE/V7I3/01303/
Sazayya, K., Sugano, T., and Kuramitz, H. (2020). Highheat effects on the physical and chemical properties of soil organic matter and its watersoluble components in Japan’s forests: a comprehensive approach using multiple analytical methods. Anal. Sci. 36 (5), 601–609. doi:10.2116/analsci.20SBP14
Shikwambana, L., Ncipha, X., Malahlela, O. E., Mbatha, N., and Sivakumar, V. (2019). Characterisation of aerosol constituents from wildfires using satellites and model data: a case study in Knysna, South Africa. Int. J. Remote Sens. 40 (12), 4743–4761. doi:10.1080/01431161.2019.1573338
Soverel, N. O., Perrakis, D. D. B., and Coops, N. C. (2010). Estimating burn severity from Landsat dNBR and RdNBR indices across western Canada. Remote Sens. Environ. 114, 1896–1909. doi:10.1016/j.rse.2010.03.013
Van Wagtendonk, J. W., Root, R., and Key, C. H. (2004). Comparison of AVIRIS and Landsat ETM+ detection capabilities for burn severity. Int. J. Wildland Fire 92, 397–408. doi:10.1016/j.rse.2003.12.015
Veefkind, J. P., Aben, I., McMullan, K., Forster, H., de Vries, J., Otter, G., et al. (2012). TROPOMI on the ESA Sentinel-5 Precursor: a GMES mission for global observations of the atmospheric composition for climate, air quality and ozone layer applications. Remote Sens. Environ. 120, 70–83. doi:10.1016/J.RSE.2011.09.027
Veraverbeke, S., Verstraeten, W. W., Lhermitte, S., and Goossens, R. (2010). Evaluating Landsat Thematic Mapper spectral indices for estimating burn severity of the 2007 Peloponnese wildfires in Greece. Int. J. Wildland Fire 19, 558–569. doi:10.1071/wf09069
Voulgarakis, A., and Field, R. D. (2015). Fire influences on atmospheric composition, air quality and climate. Curr. Pollut. Rep. 1, 70–81. doi:10.1007/s40726-015-0007-z
Woodcock, C. E., Loveland, T. R., Martin, H., and Bauer, M. E. (2020). Transitioning from change detection to monitoring with remote sensing: a paradigm shift. Remote Sens. Environ. 238, 111558. doi:10.1016/J.RSE.2019.111558
Xuegang, M., Li, Z., Fan, W., Li, M., and Yu, Y. (2015). Land cover classification method based on MODIS time series data.
Zerouali, B., Santos, C. A. G., do Nascimento, T. V. M., and Silva, R. M. D. (2023). A cloud-integrated GIS for forest cover loss and land use change monitoring using statistical methods and geospatial technology over northern Algeria. J. Environ. Manag. 341, 118029. doi:10.1016/j.jenvman.2023.118029
Keywords: forest fire, Algeria, Khenchela province, satellite data, vegetation, burning area forest fire, normalized difference vegetation index (NDVI)
Citation: Guehaz R and Sivakumar V (2023) A case study about the forest fire occurred on 05 July 2021 over Khenchela province, Algeria, using space-borne remote sensing. Front. Remote Sens. 4:1289963. doi: 10.3389/frsen.2023.1289963
Received: 06 September 2023; Accepted: 27 November 2023;
Published: 12 December 2023.
Edited by:
Ali Mohammadzadeh, K. N. Toosi University of Technology, IranReviewed by:
Armin Moghimi, Leibniz University Hannover, GermanyWillian Ney Cassol, Laval University, Canada
Abbas Kiani, Babol Noshirvani University of Technology, Iran
Nilanchal Patel, Birla Institute of Technology, India
Copyright © 2023 Guehaz and Sivakumar. This is an open-access article distributed under the terms of the Creative Commons Attribution License (CC BY). The use, distribution or reproduction in other forums is permitted, provided the original author(s) and the copyright owner(s) are credited and that the original publication in this journal is cited, in accordance with accepted academic practice. No use, distribution or reproduction is permitted which does not comply with these terms.
*Correspondence: Riad Guehaz, cmd1ZWhhekBjZHRhLmR6
 Riad Guehaz
 Venkataraman Sivakumar