 Giacomo Giorli
 Matthew H. Pinkerton
- 1NATO Science and Technology Organization, Centre for Maritime Research and Experimentation (STO CMRE), La Spezia, Italy
- 2National Institute of Water and Atmospheric Research (NIWA), Wellington, New Zealand
We investigated the seasonal and spatial occurrence of sperm whale (Physeter macrocephalus) in the Ross Sea region of the Southern Ocean derived from passive acoustic data. Two Autonomous Multichannel Acoustic Recorders (AMARs) moored about 10 m above the seabed were deployed in the austral summer of 2018 and recovered 1 year later. The northern AMAR (A3) was located on the Pacific-Antarctic Ridge at 63.7°S and the southern AMAR (A1) at 73.1°S on the Iselin Bank, part of the continental slope of the Ross Sea. Sperm whale echolocation signals were detected using signal processing scripts and validated by visual inspection of spectrograms. Our results demonstrate that sperm whales are present in the Ross Sea region year-round. At A1, sperm whale vocalisations were detected in every month between February and November, but absent in December and January. Whales were detected most often in February with an average of 0.310 detections per hour. Sperm whale vocalisations were detected at station A3 in every month except February when we had no observations. Our results contrast to a paucity of reported sightings of sperm whales from fishing and research vessels in the Ross Sea region between December and February. Probabilities of detecting sperm whales at A3 were on average 14.2 times higher than at A1 for the same month and monthly mean detections per hour were an average of 74.4 times higher at A3 than A1. At A1, we found a significant preference for day-time foraging rather than during the night or nautical twilight. In contrast, at A3, no clear day/dusk/night/dawn differences in sperm whale occurrence were found. Low sea-ice concentration (< 80%) and open water within ∼50 km were necessary but not sufficient conditions for higher detection rates of sperm whales (>0.1 detections per hour). Overall, our research provides baseline information on sperm whale occurrence and establishes a method to track long-term change to help evaluate the conservation value of the Ross Sea region Marine Protected Area.
1 Introduction
The sperm whale (Physeter macrocephalus) is the largest of the toothed whales (Odontocetes) and, being highly migratory, is also the most widely distributed, occurring from the tropics to the ice-edge in both the Arctic and Antarctic (Whitehead, 2003; Taylor et al., 2019). Sperm whale populations were severely reduced by commercial whaling during the 20th century until a moratorium came into effect in 1986 (Whitehead et al., 1997; Whitehead, 2002; Carroll et al., 2014). The species is currently assessed as “Vulnerable” under the International Union for Conservation of Nature (IUCN) Red List of Threatened Species criteria (Taylor et al., 2019). The present trend of sperm whale numbers globally is currently unknown and knowledge of population structure, abundances or trends for sperm whales in the Southern Ocean remains poor (Whitehead, 2002; Whitehead, 2003).
This study is focused on sperm whale in the Ross Sea region of the Southern Ocean. The Ross Sea region is defined as lying between 160°E and 150°W meridians, and south of 60°S latitude and is recognized as one of the most pristine and distinct marine ecosystems on Earth (Halpern et al., 2008; Ainley, 2010). Primary production in the Ross Sea region is higher than elsewhere in the Southern Ocean (Smith and Gordon, 1997; Arrigo et al., 1999; Arrigo et al., 2008; Smith et al., 2011) and leads to a rich assemblage of air-breathing predators including at least four species of seal, seven species of baleen and toothed whales, and high numbers of Adélie and emperor penguins (Ainley, 2002; Pinkerton et al., 2010; Lyver et al., 2014).
The Ross Sea region also supports the largest abundance of Antarctic toothfish (Dissostichus mawsoni) in the Southern Ocean. A commercial fishery for Antarctic toothfish has operated in the Ross Sea region since 1997 taking catches of ∼3,000 tonnes annually (Hanchet et al., 2008; Hanchet et al., 2015b). The Ross Sea region is now major fishing area for Antarctic toothfish in the Southern Ocean, accounting for ∼85% of total catches of Antarctic toothfish (CCAMLR, 2020). In contrast, less than 1% of catches of Patagonian toothfish (D. eleginoides) in the Southern Ocean are taken from the Ross Sea region (CCAMLR, 2020) because this species has a much lower-latitude distribution. Fisheries in Antarctic waters are managed according to the Antarctic Treaty (CAMLR Convention, 19801) which requires that the ecological relationships between harvested, dependent and related species, including sperm whales, be maintained.
While female sperm whales live in large groups (which often include calves and immature adults) mainly in tropical and subtropical waters, adult males leave these pods and migrate seasonally between the tropic/subtropics and polar regions for feeding (Gaskin, 1970; Whitehead, 2003). These large adult male sperm whales have been reported to occur near the Ross Sea continental slope in summer (Matsuoka et al., 2005), with the southernmost sighting of sperm whales in the Ross Sea region at 74°S on the continental slope (Kasamatsu and Joyce, 1995). In fact, International Whaling Commission (2001) sighting surveys between 1976/77 to 1987/88 during mid-December to mid-February showed that the highest densities of sperm whales in the Southern Ocean occurred in subregion V-EM (Ross Sea slope and north of slope; Kasamatsu and Joyce, 1995). In contrast, the same IWC study reported no sightings of sperm whales over the Ross Sea continental shelf in subregion V-ES (Ross Sea shelf). These occurrence patterns are similar to acoustic detections of sperm whale made using sonobuoys during the IWC cruises (Shabangu et al., 2018). With no correction for sighting efficiency, the number of sperm whales sighted in the Ross Sea region between December and February corresponds to about 10% of the estimated total Southern Ocean2 summer population of sperm whales (Kasamatsu and Joyce, 1995).
Sperm whales are deep divers and hunt for prey using echolocation (Whitehead, 2002; Møhl et al., 2003; Watwood et al., 2006). Sperm whales produce regular clicks during the search phase of their dives, while the foraging phase of the dive is associated with the presence of short series of rapid clicks termed “creaks” or “buzzes” (Miller et al., 2004; Watwood et al., 2006). A wide variety of prey items are consumed, but cephalopods (squid and octopuses), and fish (especially demersal fish) are the major prey items (Yukhov, 1971; Yukhov, 1972; Nemoto et al., 1985; Abe and Iwami, 1989; Whitehead, 2003). Some data suggests that sperm whale diet is almost exclusively cephalopods (Laws, 1977; Northridge, 1984). Sperm whales in the Southern Ocean, and Pacific subantarctic are reported as feeding primarily on squid and secondarily on fish (Clarke, 1980; Evans and Hindell, 2004; Knox, 2007). Knox (2007) gives the ratio of squid to fish in their diet as 9:1 in the Southern Ocean.
Yukhov (1971); Yukhov, (1972) examined large numbers of sperm whale stomachs from 12 to 18 m individuals caught by Russian whaling vessels in the Pacific Ocean sector of the Southern Ocean between 1965 and 1969 and found that Antarctic toothfish (97–160 cm total length) were frequently present. Sperm whale stomachs containing Antarctic toothfish were recorded from 58°S to 73°S, and from about 160°E to 100°W (i.e., from the Antarctic Convergence to the northern slope of the Ross Sea; Yukhov, 1971; Yukhov, 1972). In fact, sperm whales are one of only three known predators of toothfish in the Ross Sea region, along with ecotype-C killer whales, Orcinus orca, and Weddell seals, Leptonychotes weddellii (Ponganis and Stockard, 2007; Pinkerton et al., 2010; Ainley and Ballard, 2012; Pinkerton and Bradford-Grieve, 2014).
From commercial fishing data, the abundance of Antarctic toothfish is known to be especially high along the Ross Sea continental slope and over the Pacific-Antarctic Ridge in the northern Ross Sea region (Hanchet et al., 2008). However, intriguingly, despite high abundances of toothfish, sperm whales are very rarely reported as being sighted anywhere in the Ross Sea region from fishing vessels (Fenaughty pers. com); sightings of sperm whales from research vessels in the area are also scarce (e.g., Hanchet et al., 2008; Bowden, 2018; O’Driscoll, 2019; O’Driscoll, 2021). Also, despite sperm whales and killer whales being known to depredate toothfish from longlines in other parts of the Southern Ocean (Hucke-Gaete et al., 2004; Purves et al., 2004; Kock et al., 2006; Towers et al., 2019) this has not yet been observed in the Ross Sea region (though we note that interactions with fishing gear, in particular those involving sperm whales, are often difficult to identify: Purves et al., 2004). The amount of spatial and temporal overlap in fishing and killer and sperm whale occurrence is a key factor in the risk of this behaviour developing in the Ross Sea region (Delegations of New Zealand and the USA, 2013).
In 2017, a Marine Protected Area (MPA) came into effect in the Ross Sea region of Antarctica (CCAMLR Conservation Measure 91-05, 2016). At the time it was established, the Ross Sea region MPA was the largest MPA in the world with an area of 1.55 million km2. The Ross Sea region MPA (Figure 1) includes three General Protection Zones (GPZi, GPZii, and GPZiii) where all toothfish fishing is prohibited, a Special Research Zone (SRZ, where fishing is permitting at a reduced level and research requirements are increased), and a Krill Research Zone (KRZ). Outside the MPA, fishing for toothfish is permitted and other conservation measures and catch limits apply (Hanchet et al., 2008). The research and monitoring plan of the Ross Sea region MPA (Dunn et al., 2017) articulates the requirement to establish baseline ecological conditions in the region and establish methods to track change in key species, including sperm whales. The MPA was established for a duration of 35 years, and over this period, the effectiveness of the MPA in mitigating adverse ecosystem effects of fishing and climate change must be studied.
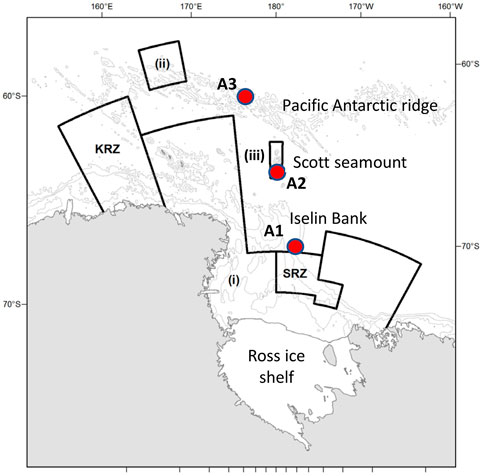
FIGURE 1. Location of the three moorings containing the AMARs (red circles, A1, A2, and A3). Also shown are the boundaries of the Ross Sea region marine protected area, which comprises: the General Protection Zone, composed of areas (i), (ii), and (iii), the Special Research Zone (SRZ), and the Krill Research Zone (KRZ). Depth contours are shown at 500, 1,500 and 2,500 m.
For these reasons it is important to understand the spatial and temporal patterns of sperm whale occurrence in the Ross Sea region. Acoustic measurements from a research voyage in summer 2015 detected vocalizations of sperm whales through most of the northern Ross Seas region Sea slope but only over a short period (O’Driscoll and Double, 2015). Miller and Miller (2018) used data from long-term acoustic recorders to show the seasonal occupancy and diel behaviour of Antarctic sperm whales in east Antarctica, including the effects of sea-ice and daylight on sperm whale presence. The present study used a similar approach to Miller and Miller (2018), employing long-term, moored acoustic recorders to investigate patterns of presence of sperm whales in the Ross Sea region and similar analysis methods.
2 Materials and methods
2.1 Location of moorings
Passive acoustic data analyzed in the present study were collected using Autonomous Multichannel Acoustic Recorders (AMARs; Jasco Applied Sciences, Dartmouth, Canada). Three AMARs were deployed in the austral summer of 2018 during a research voyage led by the National Institute of Water and Atmospheric Research (NIWA, Wellington, New Zealand) from the research vessel Tangaroa. Only two could be recovered the following summer in February 2019 (Table 1).
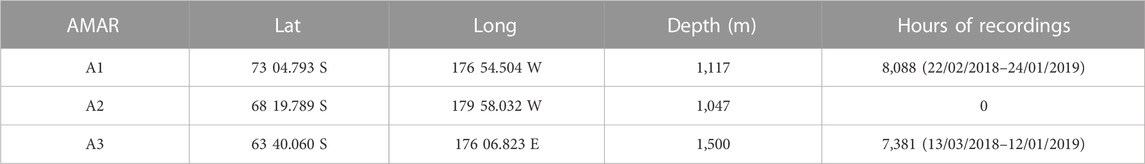
TABLE 1. Location and hours of recording of stations A1, A2, and A3.
Station A1 was deployed on Iselin Bank (part of the continental slope of the Ross Sea) and station A3 was deployed on the Pacific-Antarctic Ridge (Figure 1). These two sites are both close to areas where fishing for toothfish occurs each year. The sites are about 1,100 km apart, with A3 situated in an area where sea-ice cover occurs only during winter and ice concentrations are generally low, while A1 is covered in nearly-complete sea-ice for much of the year. The third mooring, A2 near Scott Island failed to be recovered in 2019 and this paper only reports results from A1 and A3.
2.2 Instrumentation
The AMARs were deployed on short moorings (∼10 m) positioning them close to the seabed where detection of echolocation sounds from diving sperm whales was deemed most likely (Miller and Miller, 2018), (Figure 2). Both AMARs used a M36-V35-100 hydrophone (Geospectrum Technologies Inc., Dartmouth, Canada) with a relatively flat frequency response (± 3 dB re 1 V/μPa) between 100 Hz and 80 kHz and a sensitivity of −165 dB re 1 V/μPa. The AMARs Analogue-to-Digital converter include a first-order high-pass filter with a 1.7 Hz cutoff frequency and an anti-aliasing filter with a −3 dB cutoff frequency equal to half the sampling frequency. AMARs were calibrated before deployment using a pistonphone calibrator (GRAS 42AC, GRAS Sound and Vibration A/S, Denmark) and programmed to record at a sampling rate of 48 kHz for 5.7 min after every 12.3 min. The moorings themselves were made acoustically quiet by weaving rope through the mooring chains and binding this with nylon string.
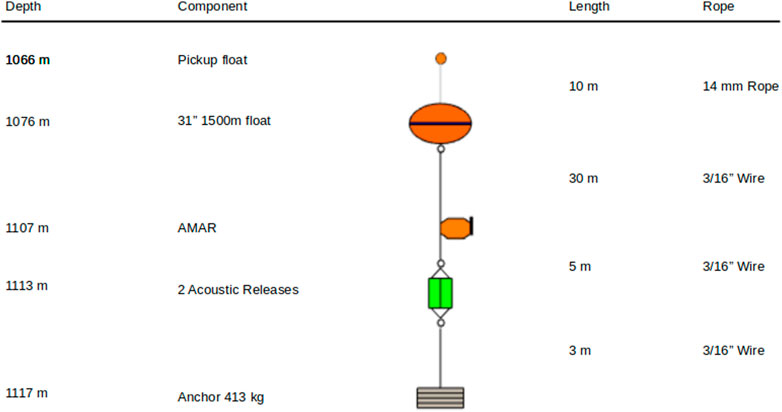
FIGURE 2. Mooring design (all stations) and depths (station A1).
2.3 Environmental data
Daily values of sea-ice concentration at the mooring locations were sourced from the Integrated Climate Data Center (University of Hamburg, Germany; Kern et al., 2020). Special Sensor Microwave/Imager (SSM/I) and Special Sensor Microwave/Imager Sounder (SSM/IS) data were used by IFREMER (Brest, France) to estimate circumpolar Antarctic sea-ice concentration by applying the ARTIST Sea Ice (ASI) algorithm (Kaleschke et al., 2001; Spreen et al., 2008). The data were gridded onto a polar-stereographic grid true at 70° with 12.5 km grid resolution and a 5-day median smoothing filter was used to reduce the weather influence (Kern et al., 2020). So far there are no estimates of uncertainties available for the product. Areas were considered ice-free when the ice concentration was less than 15% (following Arrigo and van Dijken, 2004; Comiso, 2003). To take into account the effect of spatial variation in sea-ice, we extracted the mean and standard deviation (sd) sea-ice concentration from all pixels within three different maximum distances of each mooring corresponding to different detection distances for sperm whale vocalisations (see below): 15, 30, and 80 km. For each day, we also calculated the minimum distance between the mooring site and ice-free water. The daily data were combined by calendar month for comparison with monthly-mean detection metrics (see Section 2.6).
2.4 Detection range estimation
The detection range for a sperm whale echolocation signal was estimated using the following simplified passive sonar equation (Urick, 1983):
where RL is the Received Level in decibels (dB), SL is the theoretical Source Level of a sperm whale echolocation signal (in dB), TL is the Transmission Loss (in dB), and NL is the background ambient Noise Level (in dB). Since sperm whale produce very directional signals (Zimmer et al., 2005; Moehl et al., 2006) and source level differences of 35 dB for the same click at different on-axis orientations were reported (Mohl et al., al 2000), two values of SL where used in order to estimate a maximum detection range in the case of on-axis echolocation signals (236 dB, 1 µPa RMS; Møhl et al., 2003) and in the case of off-axis signals (188 dB, 1 µPa RMS; Møhl et al., 2000). TL was estimated using both the Bellhop ray tracing tool (Porter, 2011) and a spherical spreading loss model:
where α is the sound absorption for a sound with a frequency of 15 kHz and R is the range (km). For this model a frequency of 15 kHz was used since sperm whale echolocation signals have a centroid frequency of 15 kHz (Mohl et al., 2003). NL were measured for each day of the study (Giorli and Pinkerton, 2019). Measurements in the deicedade band with center frequency of 16 kHz were used in this model. Water column oceanographic conditions were obtained from conductivity, temperature, depth data sourced from the U.S. Antarctic Program (USAP) Data Center (Stammerjohn, 2019) combined with pH data extracted from Rivaro et al. (2014). Average measurements of temperature, salinity and pH were used to estimate α using Ainslie and McColm (1998). The detection range was computed for each station as the distance at which the RL equaled the NL.
TL at the depth of each recorder was also estimated using Bellhop for each season. Bellhop is a beam tracing approach for predicting acoustic pressure fields in ocean environments (Porter, 2011; Dong and Dong, 2014). In this case, the sound attenuation was modeled for a sound at 15 kHz emitted at a depth of 200 m. Sound velocity profiles (SVP) from the 2009 World Ocean Atlas were used to model the transmission loss at both location for winter (average SVP for December-January-February), spring (average SVP for March-April-May), summer (average SVP for June-July-August) and fall (average SVP for September- October-November). The daily NL levels were also averaged to obtain mean NL in each season. For the Bellhop we only used the on-axis SL.
2.5 Detection of sperm whale presence
Acoustic data were analyzed using signal processing scripts to detect sperm whale echolocation signals as in Giorli and Goetz (2019); Giorli and Goetz, (2020) and validated using visual inspection of spectrograms. The algorithm was developed to detect only the regular echolocation clicks that sperm whales use during the “search” phase of their foraging dives (Watwood et al., 2006) and is now briefly described. First, the hydrophone data were band-pass filtered between 2 and 20 kHz using a sixth order Butterworth filter (Mohl et al., 2003). After filtering, a detection threshold was calculated as 4 dB above the average ambient noise level of the recording file under analysis. Echolocation signals were then grouped in click-trains of consecutive echolocation clicks with Inter-Click-Interval (ICI) shorter than 3 s (Madsen et al., 2002; Wahlberg, 2002; Douglas et al., 2005; Laplanche et al., 2005; Teloni et al., 2008; Fais et al., 2015). Consistent with previous studies, only click trains with more than five signals were retained to strengthen the classification certainty (Au et al., 2013; Giorli et al., 2015; Giorli and Goetz, 2019). The ICI, click duration, and peak frequency of each click train detected were used together to determine if a positive sperm whale detection was returned (Giorli and Goetz, 2019).
The Receiver-Operator Characteristic (ROC) was used to select the detector parameters that yielded the best performance in terms of precision (P), recall (R) and F-score (F) (Davis and Goadrich, 2006; Powers, 2011; Kowarski et al., 2018). From each AMAR, a training dataset of 200 WAV files recordings were selected to fine tune the detector. Of these, 100 WAV files contained identified sperm whales click trains and 100 WAV files did not contain any identified sperm whales click trains (although they contained echolocation signals and vocalizations from other species). The detector was run on the training datasets in order to assess true positive, false positive, true negative and false negative detection rates needed to compute F-scores. The detector was applied to the training dataset at station A3 twice. The second run returned a very accurate performance (see Results). The detector parameters for station A3 were: 1) 4–15 kHz for peak frequency; 2) 0.2–2 s for ICI; and 3) 500–1,200 μs for signal duration. The A1 detection performance during the ROC trials (n = 10) was not satisfactory because the A1 acoustic data included broadband noise generated by tidal forcing on the sea-ice that characterize this area for most of the year (Giorli and Pinkerton, 2019) (Figure 3). However, using the same detector parameters as for station A3, the A1 detector returned no false negatives (see Results and Discussion). Hence, for station A1 the same detector parameters of station A3 were used but all detections were validated using spectrograms to remove false positives.
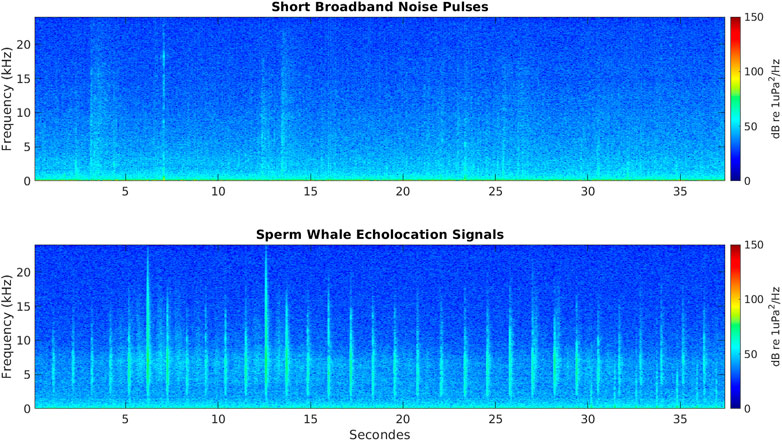
FIGURE 3. Spectrogram of a 37.5 s of data showing short broadband noise pulses in the bandwidth of sperm whales’ echolocation signals (top panel); and spectrogram of a 37.5 s of data showing echolocation signals of a sperm whale (bottom panel).
2.6 Data analysis
Two indices were calculated to summarize the click-detection results. First, the average probability of detection within a 1-h period “P (detection)” was calculated as the number of hours where at least one sperm-whale click train was detected divided by the hours observed. This indicates the probability that at least one sperm whale is present in a given hour (i.e., presence only). Second, we calculated the average number of sperm-whale click trains detected per hour of recording as an indication of total foraging intensity. This second metric will be affected by how actively individual sperm whales are foraging (as a single individual may give rise to multiple click-trains within an hour) and by how many different sperm whales are present and vocalizing. It is not possible to separate out the number of whales and their foraging activity, but together, the mean number of clicks detected per hour is indicative of the intensity of all sperm whale foraging in that period. We calculated these two detection metrics at both the daily and monthly scale and compared them with sea-ice concentration and distance to open-water.
For day-night analysis, we followed Miller and Miller (2018) in defining “day” as times when the solar elevation was greater than zero, “night” as the period when the solar elevation was less than −12°, and dawn and dusk as nautical twilight (i.e., when the solar elevation was between 0 and −12°). Solar elevation was calculated based on Kirk (1994). Akin to using the odds-ratio to assess the importance of time of day on sperm whale foraging (Miller and Miller, 2018) we considered the slope of the regression line between foraging during the day and other times (dusk, night, dawn). An F-test was used to test the null-hypothesis that the slope of the regression line did not differ from 1 (a slope not-significantly different from 1 meaning that there is no evidence of different foraging depending on time of day).
Data analysis was carried out in MATLAB 2019a (The MathWorks, Inc., Natick, United States) and in IDL 8.7 (Research Systems Inc., Boulder, United States).
3 Results
3.1 Detector performance
The detector performed well for station A3 (Table 2) yielding an F-score of 0.96. However, the detector did not generally perform as well at station A1, yielding a recall (true positive rate) of one but a precision of only 0.52; the detection performance at A1 had a high false positive rate, but returned no false negatives (Table 2). Hence, all the detections at A1 were visually inspected using spectrograms to assess their validity and remove false positives.
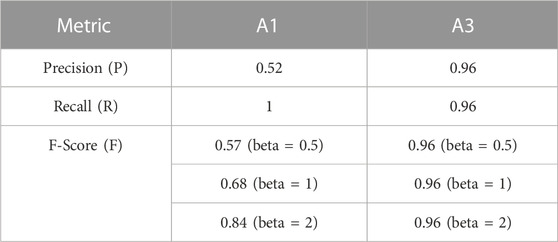
TABLE 2. Detector performance.
3.2 Detection range
The spherical spreading model returned similar detection ranges for both stations (Figure 4). The mean detection range for station A1 was 36.7 km with a standard deviation of 1.7 km for the on-axis signal case. Detection ranges for the off-axis signals was substantially lower with a mean of 26.3 km and a standard deviation of 1.6 km. At station A3 the mean detection range for on-axis signal was 36.1 km with a standard deviation of 1.4 km. At A3, off-axis signal had a substantially lower mean detection range of 24.9 km with a standard deviation of 1.3 km. Bellhop modeling for on-axis signals only returned ranges of detection similar but slightly larger (∼20% on average) that the spherical spreading model; the Bellhop detection range was estimated to vary between 44.8 and 46.8 km at station A1 and between 43.0 and 44.1 km at station A3 from winter through fall. Given the results for both on-axis and of-axis sounds modeling, for the analyses of sea-ice, we considered the average ice concentration within 30 km of the moorings (but show that the results and conclusions are robust to detection ranges 15–80 km).
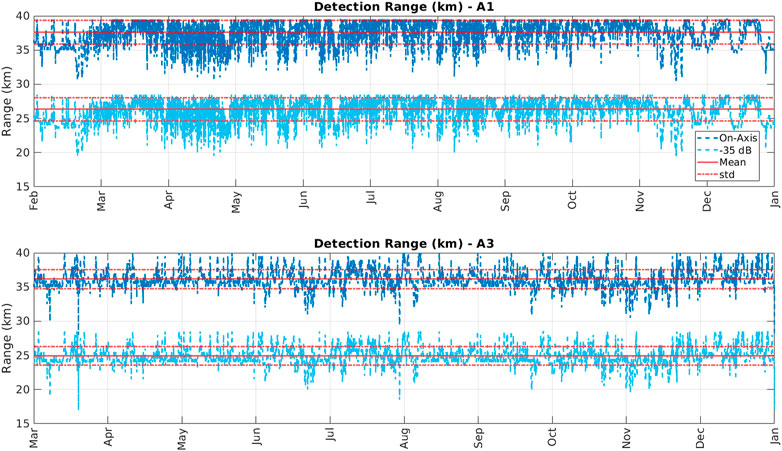
FIGURE 4. Modeled detection ranges for on-axis (dark blue) and off-axis (−35 dB; light blue) sperm whale echolocation signals at station A1 (top) and A3 (bottom). Red lines indicate the mean values; red dashed lines indicate the standard deviation from the mean.
3.3 Habitat occupancy
At A1, sperm whales were detected in every month between February and November, but absent in December and January (Figure 5; Table 3). Whales were detected most often at A1 in February when average monthly probability of detection in an hour was 0.149 and there was an average of 0.310 detections per hour.
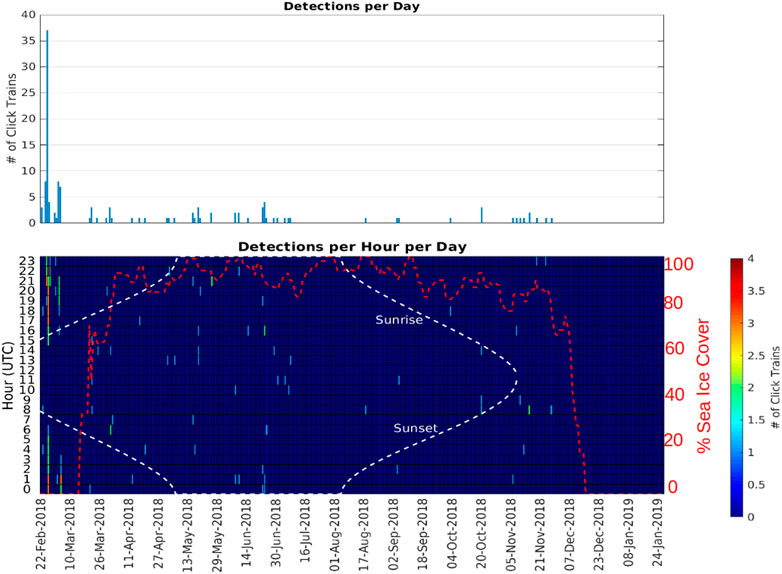
FIGURE 5. Number of echolocation click trains detected at station A1 (Iselin Bank) as a function of day (top panel) and as a function of day and hour of the day (bottom panel). The red dashed line indicates the sea ice percentage cover measured at the location of A1 (<15 km range).
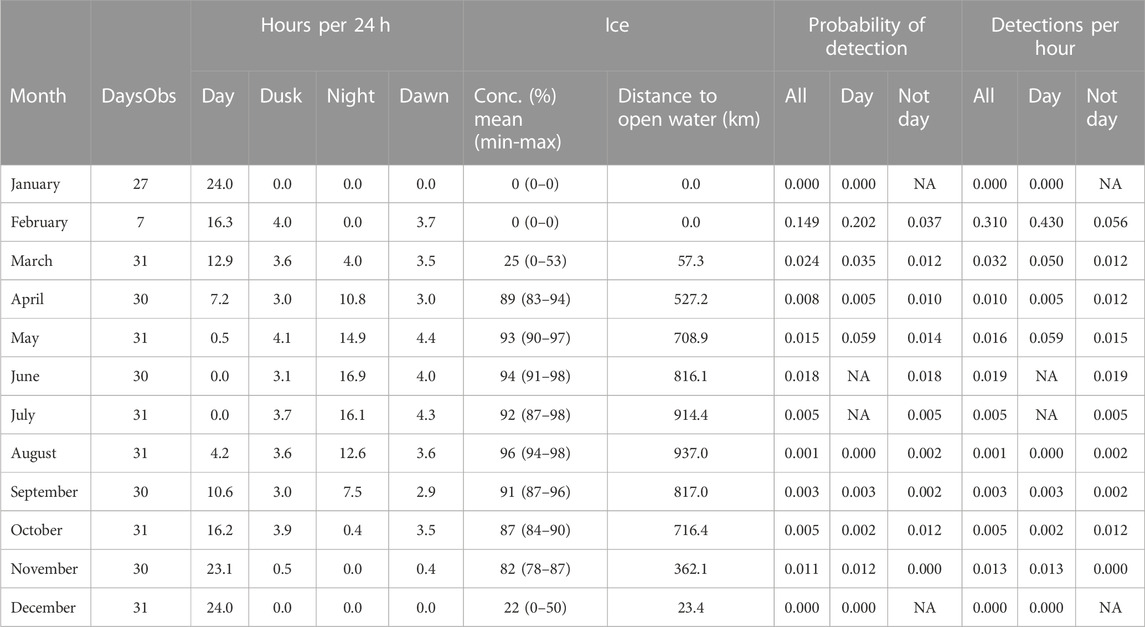
TABLE 3. A1 summary information by month. “DaysObs”: Number of days in the month during which acoustic data were measured. “Hours per 24 h”: Mean number of hours of day, dusk, night and dawn (see text for definitions). Ice: Concentration (“conc”) of sea-ice in the month as mean % (mean ± sd). Probability of detection: mean probability of detecting sperm whale in an hour in a given month. “Not day”: Dusk, night, dawn combined. Detections per hour: Mean number of sperm whale click-trains detected in an hour in that month. “NA”: No data.
Station A3 had generally higher probabilities of detection and higher detection rates than at A1 (Figure 6; Table 4) across all months of the year except June. Probabilities of detecting sperm whales at A3 were on average 14.2 times (range 0.9–46 times) higher than at A1 for the same month (Figure 7). On average, detection rates (mean detections per hour) were 74.4 times higher at A3 than for the same month at A1 (range 2.8–228 times higher). At A1, the monthly average of the number of click-trains detected per hour when sperm whales were present varied between 1.0 and 2.1 (median 1.1). At A3, when sperm whales were present average detection rates (click-trains per hour) were higher (1.9–7.8, median 5.0 clicks-trains per hour).
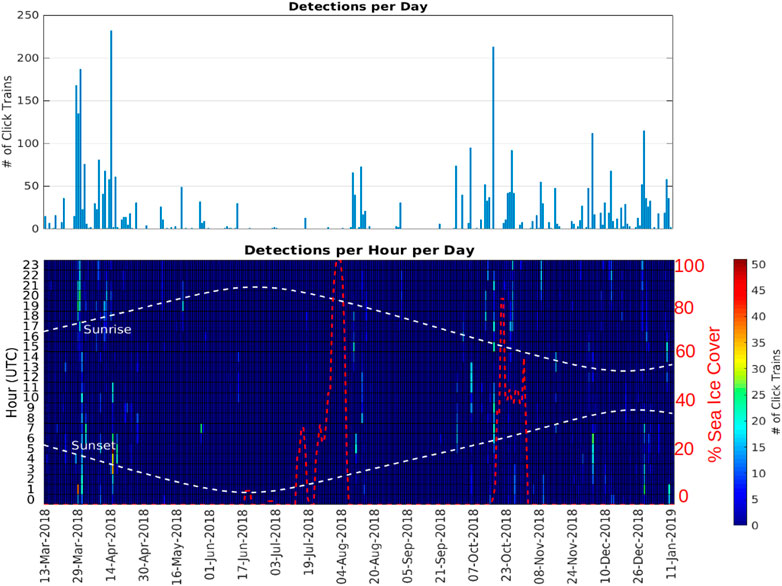
FIGURE 6. Number of echolocation click trains detected at station A3 as a function of day (top panel) and as a function of day and hour of the day (bottom panel). The red dashed line indicates the sea ice percentage cover measured at the location of A3 (<15 km range).
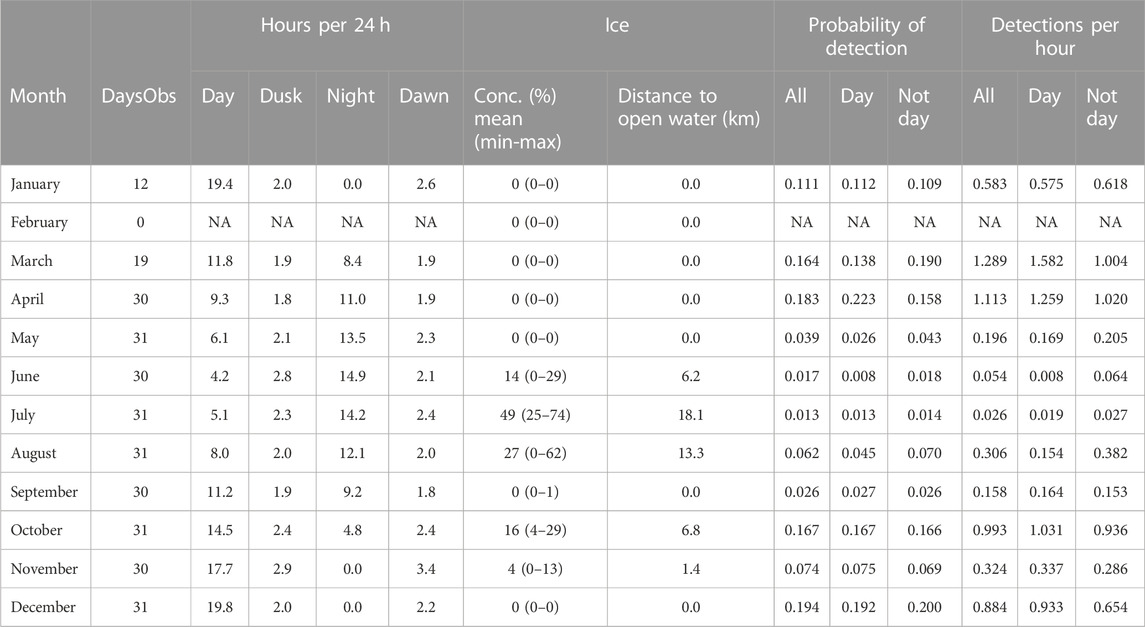
TABLE 4. A3 summary information by month. Other information as caption Table 3.
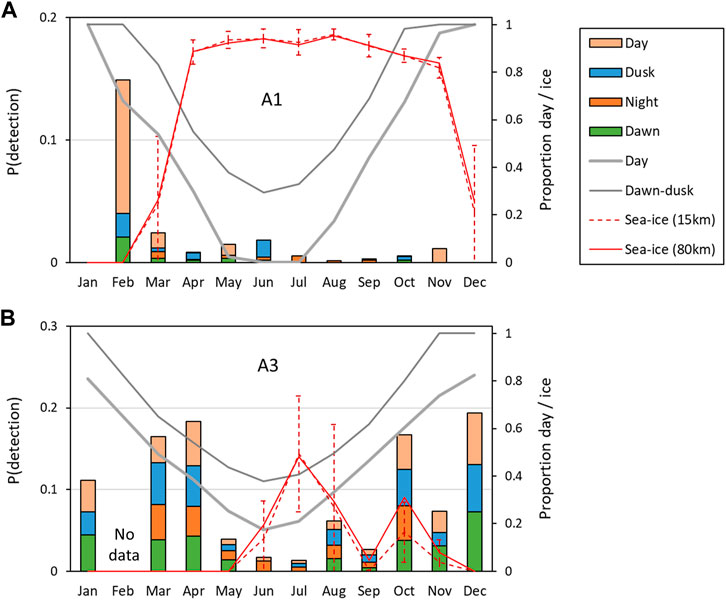
FIGURE 7. Average probability of detecting at least one sperm whale vocalization in an hour in a given month “P (detection)”. (A) Southern site A1; (B) northern site, A3. Overall probabilities of detection are shown on the left axis, and stacked-bar colours show the relative probabilities of detection during the day (sun above the horizon), nautical twilight (dawn and dusk) and at night (sun elevation <12°). The average proportion of daylight and twilight in the month is shown by the solid grey lines (right axis). The average monthly ice concentration (red lines) and standard-deviations within the month (red dashed vertical bars) are also shown on the right axis for two ranges (15 and 80 km).
At both sites, the seasonal patterns of detection rate (i.e., the average detections per hour) and the seasonal patterns of probability of detection were similar (Figure 7; Figure 8). Sea-ice concentrations were high (>80%) at A1 during the April–November period, but never reached more than 50% on average at A3. Similarly, there was much less variation in day-length over the year at A3 than A1.
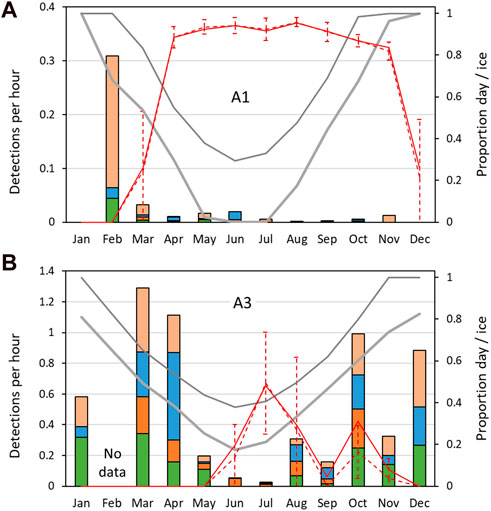
FIGURE 8. Mean sperm whale detection rate: mean number of sperm whale click-trains detected per hour, by month. (A) Southern site A1; (B) northern site, A3. Other information as Figure 7.
At A3, both the probability of detection and the mean detection rate were very similar between day and dusk/night/dawn (Figure 9A: A3 points lie close to the 1:1 line indicating no detectable difference in occurrence between day and dusk/night/dawn). In contrast, at A1, the probability of detecting sperm whales in an hour was substantially (mean 2.1 times) higher during day than at night or twilight (Figure 9A: A1 points lie below the 1:1 line). At A1, the mean number of detections per hour was also substantially higher (mean 2.5 times) during the day than at night (Figure 9B). F-tests of the null hypothesis that the regression lines have a slope of 1 (no change between day and dusk/night/dawn) were rejected for all dusk/day, night/day and dawn/day for both probability of detection and detection rate at A1 (Table 5) indicating a significant effect of time of day on occurrence. At A3, the null hypothesis could not be rejected at the 99% confidence level for either the probability of detection or the mean detection rate for all combinations except one: at A3, there was a significantly higher mean detection rate at dusk than dawn (Table 5). The probability of detection was also significantly higher at dusk than dawn at A1. The dusk/night and dawn/night analyses in Table 5 show that the probability of detection and the mean detection rate were not significantly different between night and twilight at either station.
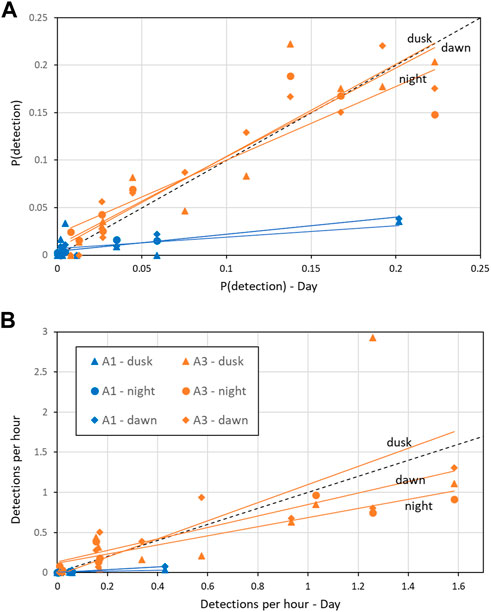
FIGURE 9. Effect of time of day on (A) Mean probability of detection in an hour; (B) Mean hourly detection rate. “Day” refers to measurements taken when the sun was above the horizon (x-axis) and “dawn”/“dusk” during periods of nautical twilight and “night” when the solar elevation is below −12° are shown on the y-axis for the corresponding month. Coloured, solid lines are the least-squares fit by site (A1 and A3). Black dashed line indicates 1:1 correspondence (i.e., no change between sperm whale occurrence between dusk/night/dawn and day). See Table 5 for statistics of regression lines.
TABLE 5. Effect of time of day on mean probability of detecting sperm whale in a given hour and mean detection rate (“detections per hour”) as described in the text. “Light regime” gives the comparison between the monthly detection in one period to that in another (see Methods for definitions of periods). “N months”: Number of month comparisons possible. No comparisons are possible if there is no data or zero detections in either period. “Slope”: Fitted slope of regression line (akin to adds ratio, Figure 9). “F”: F-value for null hypothesis that the slope = 1 (i.e., no effect of time on day on detection). “P”: Probability associated with F-test, significance: <0.001***; <0.01**; <0.05*.
Comparisons between sperm whale occurrence and sea-ice (in terms of both sea-ice concentration and distance to open water) gave more useful insights at the monthly than at the daily scale. At A1, the 8 months with high mean sea-ice concentration (>80%, April–November) had consistently low probabilities of detecting sperm whales acoustically and low mean detections per hour (Figure 10). In the other 4 months at A1 where sea-ice concentration was low, there were both low (December, January, March) and high (February) numbers of sperm whale detections. At A3, sea-ice was only intermittently present, with monthly mean sea-ice concentration always less than 50% and usually less than 20%. Sperm whale occurrence was both high and low in the months with sea-ice and in the months without sea-ice at A3. Taking both sites gave a consistent overall picture: low sea-ice concentration (< 20%) tended to be related to higher occurrence of sperm whales (but not always), whereas high sea-ice concentration (> 50%) always corresponded to low occurrence. In other words, low sea-ice concentration was a necessary but not sufficient condition for high detections of sperm whales. A consistent result was given when distance to open water was considered instead of mean ice concentration (Figure 11): low distance to open water (<50 km) was a necessary but not sufficient condition for high occurrence of sperm whales at both A1 and A3.
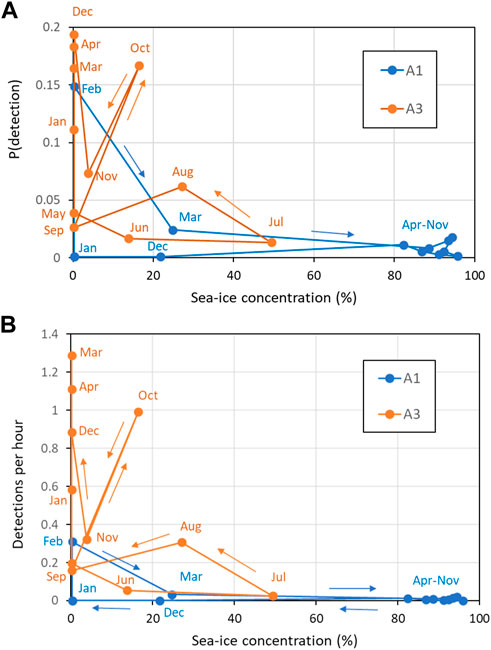
FIGURE 10. Effect of sea-ice concentration (30 km range) on (A) Mean probability of detection in an hour; (B) Mean hourly detection rate. Key months are labeled (see colour for site). Coloured lines connect months in date order as shown by the arrows.
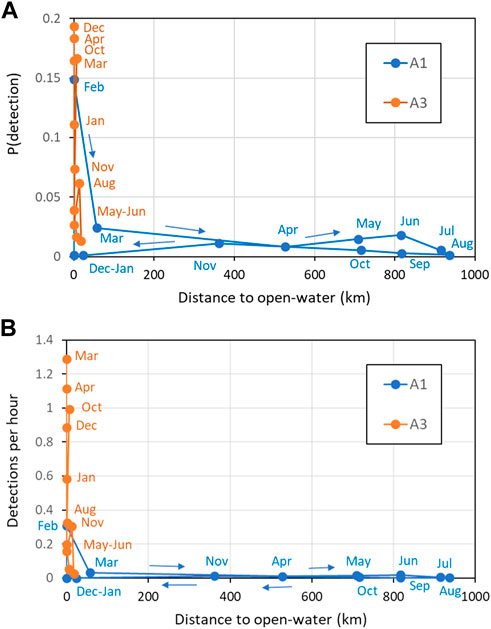
FIGURE 11. Effect of distance to open water (<15% ice concentration) on (A) Mean probability of detection in an hour; (B) Mean hourly detection rate. Key months are labelled (see colour for site). Coloured lines connect months in date order as shown by the arrows.
4 Discussion
The large spatial extent, heterogenous and highly seasonal nature of the Ross Sea region means that characterizing the ecology of the area and tracking changes over time requires multi-year observations. Given the high cost of research vessels and the fact that most of the area is only free of sea-ice for a few months a year, long-term acoustic moorings are a cost-effective and powerful way to detect the presence of animals that produce sounds, such as sperm whales. Better information on the seasonal and spatial occupancy of sperm whales in the Ross Sea region is particularly important because much uncertainty remains on the risk to predators of Antarctic toothfish from the effects of fishing (Pinkerton et al., 2010; Ainley and Pauly, 2014; Pinkerton and Bradford-Grieve, 2014). It has been suggested that sperm whales may target Antarctic toothfish as prey because they are large and have high energetic richness (e.g., Capdeville, 1997; Collins et al., 2010; Péron et al., 2016; Janc et al., 2018) which might make them an ecologically-important localized food source for predators in some locations at some times of the year (Pinkerton et al., 2007).
In this paper we report on the first year of data measured by two moored acoustic sensors in the Ross Sea region, both located close to areas of high toothfish abundance and high fishing effort. These two locations had very different sea-ice characteristics which meant that different algorithm were used to detect vocalizations of sperm whales at the two sites. Low-ice conditions at the northern station (A3, Pacific-Antarctic ridge) contrast to the southern station (A1, Iselin Bank) which had more than 80% ice cover for 8 months of the year. Differences in sea-ice between the sites lead to different ambient (background) soundscapes. At frequencies lower than 100 Hz, ambient noise at station A1 was 15 dB higher in general than at station A3 (Giorli and Pinkerton, 2019). The higher background noise levels at A1 were likely caused by high tides regimes causing the sea-ice sheet to move vertically and/or horizontally. The resulting cracking of the ice generates broadband impulsive sounds that can extend over many kHz in frequency that posed a challenge for the performance of a sperm whales sound detector/classificator based on a self-adjusting threshold like the one used in this study (Giorli and Goetz, 2019; Giorli and Goetz, 2020). Our algorithm returned an estimated recall >0.95 at both stations which means that the acoustic processing effectively detected sperm whales when they were present. However, the higher background noise at A1 caused many false positive detections (precision of 0.52, Table 2) so all detections at this southern station were visually inspected using spectrograms to assess their validity and remove false-positives.
After removing the false-positives, our results demonstrated that sperm whales forage in the Ross Sea region all year round: We found evidence of sperm whale presence at either A1 or A3 or both in all months of the year. However, there were substantial differences in the frequency of detection between A1 and A3. At A3 (northern area near the Pacific-Antarctic Ridge), the probability of detecting sperm whale click trains in an hour was 14 times higher on average than at A1, and the number of detections in an hour when they were present was 5 times higher at A3 than A1 on average. Together, this means that mean detection rates were between 2 and 200 times higher at A3 than A1 in the same month.
Overall, the present study partially agrees with the finding of Miller and Miller (2018) which found that in the Southern Ocean off East Antarctica, sperm whales were present in the austral summer (and occasionally in November, March, April and May). However, Miller and Miller (2018) did not detect sperm whales in the austral winter or spring months whereas our data at the Pacific-Antarctic ridge contained sperm whale sounds from June through to October, though detection rates were low in June and July.
We may expect a priori that sea-ice may be the major driver of spatial and seasonal variations of sperm whale occurrence because sea-ice in the Ross Sea region will generally be too thick for sperm whales to break through, and their large body size means that large gaps between floes will be needed for them to reach the surface. Some cetacean species are known to crack newly formed or thin ice to create breathing holes. For example, bowhead whales (Balaena mysticetus) in the Bearing Sea use their large heads to break holes into areas of thin ice (Ellison et al., 1987; Zapetis and Szesciorka, 2018) and the Antarctic minke whales (Balaenoptera bonaerensis) use the rostrum for breaking through newly formed sea ice to breathe (Thiele et al., 2000; Ainley et al., 2003). Weddell seals are known to be able to chew through sea ice to create their own breathing holes which allows them year-round occupancy of the extreme southern part of the Ross Sea (Harcourt et al., 2021). None of these opportunities are likely to apply to sperm whale in the Ross Sea region where winter sea-ice is likely to be 1–2 m thick (Worby et al., 2008). Antarctic killer whales have bodies small enough that they can exploit narrow passages in the ice to breath (Pitman and Ensor, 2003) but much larger gaps will be needed for sperm whale.
We hence examined the role of sea-ice concentration on the probability of detecting sperm whale in an hour and the average number of detections per hour (detection rate) at A1 and A3. Simple estimates of click intensity, sound attenuation, background noise and detector sensitivity led us to estimate that we may detect sperm whale vocalizations from a maximum possible distance of about 30 km, comparable with previous studies (e.g., Poupard et al., 2022). We hence used mean satellite estimates of ice concentration within 30 km of each hydrophone in our analysis. We also estimated the shortest distance from the hydrophone to open water (taken as less than 15% ice concentration).
Our data at A1 (Iselin Bank) was consistent with the hypothesis that high concentrations (>80%) of sea-ice April to November provided a barrier between the atmosphere and the underwater habitat which restricted the ability of sperm whales to breathe and largely kept them out of the area. When the shortest distance to open water was greater than about 50 km, sperm whale acoustic detections were always low. There were however scarce and sporadic detections of sperm whales at station A1 even when mean sea-ice concentration within 30 km of the site was >80% and the distance to open water was 50 km. These detections suggest that sperm whale can find leads in sea-ice which are big enough to allow them access to air breathe, but it is not a favoured or common situation.
At our A3 station, ice-cover only sporadically reached percentages higher than 50% (mainly in July and August), and sperm whale would have access to air through most of the year. The much higher occurrence of sperm whale at A3 compared to A1 is hence consistent with sea-ice cover being the major determinant of sperm whale occurrence. However, this does not explain why so many whales were present at A1 in February and yet there were no acoustic detections in December or January when ice concentrations were low. Abundances of Antarctic toothfish at A1 are not expected to show high seasonal variability (Hanchet et al, 2015a) and so seasonal variation in prey availability is not a likely explanation for the absence of acoustics detections of sperm whale at A1 in December and January. As mentioned in the introduction, despite sperm whales being present in the Ross Sea region year-round, they are rarely sighted by fishing or research vessels.
A preference for night-time foraging in sperm whales would be consistent with few visual sightings. Data from eastern Antarctica shows that sperm whales foraged mainly during day-time (Miller and Miller, 2018). Consistent with this, our data confirmed a preference for day-time foraging at A1, but, in contrast to Miller and Miller (2018), we found no evidence of a difference in sperm whale occurrence between day, twilight and night at A3. Our result at A1 was driven by the much higher probability of detection and mean detection rate in day rather than night/twilight in February. A similar preference for day foraging at A1 was seen in some other months (March, May, September) but not in all; in April and October, detections were higher in the twilight periods than during the day. There seems no clear pattern to this preference for foraging in day, dusk, night and dawn at A1 and further data will be required to understand this.
At A1, the absence of visual sightings of sperm whale from vessels is consistent with zero acoustic detections in December and January when most research and fishing activity near the Iselin Bank is usually present. The Ross Sea region toothfish fishery currently opens each year on 1 December and fishing starts in the north of the region including potentially around A3 (depending on ice conditions). With the break-up of the sea-ice barrier, fishing vessels usually move south to access the Iselin Bank (A1) in late December/early January. All fishing vessels leave the Ross Sea region when the toothfish catch limit is reached and this typically occurs around the end of January or early February. It is speculated therefore that sperm whales actively avoid vessels as a learned behaviour from the whaling era, noting that behaviour in cetaceans can be passed down through generations (Rendell and Whitehead, 2001). Testing this hypothesis will be the focus of future work using longer-term data from the acoustic moorings in the Ross Sea region.
4.1 Final comments
Our study cannot confirm the extent to which sperm whales are preying on toothfish. Given the much higher trophic level of toothfish compared to Antarctic squid (Pinkerton et al., 2010), stable isotope analysis of biopsy samples from sperm whales in the Ross Sea region would potentially be an effective way of gaining insight into the relative consumption of toothfish and squid by the whales. Unfortunately, there are no known biopsy samples of sperm whales in the Ross Sea region with which to investigate diet of this species in the region but we recommend that this should be a target of research in the future.
To date, still much uncertainty exists on abundance, distribution and trophic connections of sperm whale in the Ross Sea region, and the importance of this knowledge gap has been heightened by the development of the fishery for Antarctic toothfish in the region. The Ross Sea region MPA was established in December 2017 by international agreement (CCAMLR, 2020) with the objective of protecting the unique environment and fauna of the Ross Sea region and improving understanding the effects of fishing and climate change on the Ross Sea region. Reduction of Antarctic toothfish abundance in the Ross Sea region due to fishing is likely to be highest on the Ross Sea slope and seamounts of the Pacific-Antarctic ridge where fishing effort is concentrated. Continued monitoring of the occurrence of sperm whale in areas like the Iselin Bank and Pacific-Antarctic ridge in the Ross Sea region remains crucial and our study demonstrates that long-term acoustic moorings can be a powerful approach to observation.
Data availability statement
The raw data supporting the conclusion of this article will be made available by the authors, without undue reservation.
Ethics statement
Ethical review and approval was not required because no animal was handled when collecting our data. We collected data on animal vocalizations only using passive acoustic recorders (hydrophones) so there were no interactions with any individual animal in their natural habitat.
Author contributions
GG collected and analysed the hydrophone data. GG and MP conceptualized the study, analysed the results, and co-wrote the manuscript.
Funding
This work was funded by MBIE Endeavour Fund programme Ross-RAMP (C01X1710) with strategic capex funding from NIWA.
Acknowledgments
We acknowledge the officers and crew of RV Tangaroa for moorings deployment and recovery. Sarah Searson, Olivia Price, Mike Brewer and Fiona Elliot (all NIWA) designed the moorings and deployed and recovered the instruments. We acknowledge assistance from NZ MFAT and MPI for permitting assistance. We would like to thank JASCO Applied Sciences for the technical support with the AMARs operations. We thank the journal editor and four reviewers for constructive comments that helped improve this paper.
Conflict of interest
The authors declare that the research was conducted in the absence of any commercial or financial relationships that could be construed as a potential conflict of interest.
Publisher’s note
All claims expressed in this article are solely those of the authors and do not necessarily represent those of their affiliated organizations, or those of the publisher, the editors and the reviewers. Any product that may be evaluated in this article, or claim that may be made by its manufacturer, is not guaranteed or endorsed by the publisher.
Footnotes
1Convention for the Conservation of Antarctic Marine Living Resources.
2South of 60°S.
References
Abe, T., and Iwami, T. (1989). Notes on fishes from the stomachs of whales in the antarctic II: On Dissostichus and ceratias. Proc. NIPR Symposium Polar Biol. 2, 78–82.
Ainley, D. G. (2010). A history of the exploitation of the Ross Sea, Antarctica. Polar Rec. 46 (3), 233–243. doi:10.1017/s003224740999009x
Ainley, D. G., and Ballard, G. (2012). Trophic interactions and population trends of killer whales (Orcinus orca) in the southern Ross Sea. Aquat. Mamm. 38, 153–160. doi:10.1578/am.38.2.2012.153
Ainley, D. G., and Pauly, D. (2014). Fishing down the food web of the Antarctic continental shelf and slope. Polar Rec. 50 (1), 92–107. doi:10.1017/s0032247412000757
Ainley, D. G., Tynan, C. T., and Stirling, I. (2003). “Sea ice: A critical habitat for polarmarine mammals and birds,” in Sea-ice—an introduction to its physics, biology, chemistry and geology. Editors D. Thomas, and G. Dieckmann (London, UK: B1ackwell Science), 240–266.
Ainslie, M. A., and McColm, J. G. (1998). A simplified formula for viscous and chemical absorption in sea water. J. Acoust. Soc. Am. 103 (3), 1671–1672. doi:10.1121/1.421258
Arrigo, K. R., Robinson, D. H., Worthen, D. L., Dunbar, R. B., DiTullio, G. R., VanWoert, M., et al. (1999). Phytoplankton community structure and the drawdown of nutrients and CO2 in the Southern Ocean. Science 283, 365–367. doi:10.1126/science.283.5400.365
Arrigo, K. R., and Van Dijken, G. L. (2004). Annual changes in sea-ice, chlorophyll a, and primary production in the Ross Sea, Antarctica. Deep Sea Res. II 51 (1-3), 117–138. doi:10.1016/j.dsr2.2003.04.003
Arrigo, K. R., van Dijken, G. L., and Bushinsky, S. (2008). Primary production in the Southern Ocean, 1997–2006. J. Geophys. Res. 113, C08004. doi:10.1029/2007jc004551
Au, W. W. L., Giorli, G., Chen, J., Copeland, A., Lammers, M., Richlen, M., et al. (2013). Nighttime foraging by deep diving echolocating odontocetes off the Hawaiian islands of kauai and Ni’ihau as determined by passive acoustic monitors. J. Acoust. Soc. Am. 133 (5), 3119–3127. doi:10.1121/1.4798360
Bowden, D. (2018). The Ross Sea environment and ecosystem voyage 2018, 5 february - 21 March 2018, Voyage Report – TAN1802 (March 2018).
Capdeville, D. (1997). Interaction of marine mammals with the longline fishery around the Kerguelen Islands (Division 58.5.1) during the 1995/96 cruise. CCAMLR Sci. 4, 171–174.
CAMLR Convention (1980). The convention on the conservation of antarctic marine living resources. Available https://www.ccamlr.org/en/organisation/camlr-convention-text (Accessed March, 2023).
Carroll, G., Hedley, S., Bannister, J., Ensor, P., and Harcourt, R. (2014). No evidence for recovery in the population of sperm whale bulls off Western Australia, 30 years post-whaling. Endanger. Species Res. 24, 33–43. doi:10.3354/esr00584
CCAMLR Conservation Measure 91-05 (2016). Ross Sea region marine protected area. Available https://cm.ccamlr.org/en/measure-91-05-2016 (Accessed April, 2022).
CCAMLR (2020). Total catches of Dissostichus mawsoni, all areas. Available at: https://www.ccamlr.org/en/fisheries/toothfish-fisheries (accessed April, 2022).
Clarke, M. R. (1980). Cephalopoda in the diet of sperm whales of the Southern Hemisphere and their bearing on sperm whale biology. Discov. Rep. 37, 1–324.
Collins, M. A., Brickle, P., Brown, J., and Belchier, M. (2010). The patagonian toothfish: Biology, ecology and fishery. Adv. Mar. Biol. 58, 227–300. doi:10.1016/B978-0-12-381015-1.00004-6
Comiso, J. C. (2003). “Large-scale characteristics and variability of the global sea ice cover,” in Sea Ice: An introduction to its physics, chemistry, biology and geology. Editors D. N. Thomas, and G. S. Dieckmann (Oxford, UK: Blackwell Science), 112–142.
Davis, J., and Goadrich, M. (2006). “The relationship between precision-recall and ROC curves”. in Proceedings of the 23rd International Conference on Machine Learning - ICML’06, 233–240.
Delegations of New Zealand and the USA (2013). Analysis of potential threats from fishing to the objectives of a proposed Ross Sea region MPA. CCAMLR document SC-CAMLR-IM-I/09.
Dong, L., and Dong, H. (2014). Bellhop – a modeling approach to sound propagation in the ocean. [Available online at https://www.ntnu.edu/documents/14687435/901262351/SSPA_2014_Dong_Bellh op.pdf/9e4d79dc-1c5a-43d0-9724-9990bd5e2219.Proceedings for the 37th Scandinavian Symposium on Physical Acoustics
Douglas, L. A., Dawson, S. M., and Jaquet, N. (2005). Click rates and silences of sperm whales at Kaikoura, New Zealand. J. Acoust. Soc. Am. 118 (1), 523–529. doi:10.1121/1.1937283
Dunn, A., Vacchi, M., and Watters, G. (2017). The Ross Sea region marine protected area research and monitoring plan. CCAMLR document SC-CAMLR-XXXVI/20. Hobart, Australia.
Ellison, W. T., Clark, C. W., and Bishop, G. C. (1987). “Potential use of surface reverberation by bowhead whales, Balaena mysticetus, in under-ice navigation,” in Report of the Meeting of the International Whaling Commission, 329–332.37
Evans, K., and Hindell, M. A. (2004). The diet of sperm whales (Physeter macrocephalus), in southern Australian waters. ICES J. Mar. Sci. 61 (8), 1313–1329. doi:10.1016/j.icesjms.2004.07.026
Fais, A., Aguilar Soto, N., Johnson, M., Perez-Gonzalez, C., Miller, P. J. O., and Madsen, P. T. (2015). Sperm whale echolocation behaviour reveals a directed, prior-based search strategy Informed by Prey Distribution. Behav. Ecol. Sociobiol. 69 (4), 663–674. doi:10.1007/s00265-015-1877-1
Gaskin, D. E. (1970). Composition of schools of sperm whales Physeter catodon Linn. east of New Zealand. N. Z. J. Mar. Freshw. Res. 4 (4), 456–471. doi:10.1080/00288330.1970.9515359
Giorli, G., Au, W. W. L., Jarvis, S., Morrissey, R., and Moretti, D. (2015). Acoustic detection of biosonar activity of deep diving odontocetes at josephine seamount high seas marine protected area. J. Acoust. Soc. Am. 137 (5), 2495–2501. doi:10.1121/1.4919291
Giorli, G., and Goetz, K. T. (2020). Acoustically estimated size distribution of sperm whales (Physeter macrocephalus) off the East Coast of New Zealand. N. Z. J. Mar. Freshw. Res. 54 (2), 177–188. doi:10.1080/00288330.2019.1679843
Giorli, G., and Goetz, K. T. (2019). Foraging activity of sperm whales (Physeter macrocephalus) off the East Coast of New Zealand. Sci. Rep. 9 (1), 12182–12189. doi:10.1038/s41598-019-48417-5
Giorli, G., and Pinkerton, M. H. (2019). Long-term soundscape monitoring in the Ross Sea and its marine protected area proceedings of meetings on acoustics 5ENAL. Acoust. Soc. Am. 37 (1), 070013.
Halpern, B. S., Walbridge, S., Selkoe, K. A., Kappel, C. B., Micheli, F., D'Agrosa, C., et al. (2008). A global map of human impact on marine ecosystems. Science 319, 948–952. doi:10.1126/science.1149345
Hanchet, S. M., Dunn, A., Parker, S. J., Horn, P., Stevens, D., and Mormede, S. (2015a). The antarctic toothfish (Dissostichus mawsoni): Biology, ecology, and life history in the Ross Sea region. Hydrobiologia 761 (1), 397–414. doi:10.1007/s10750-015-2435-6
Hanchet, S., Mitchell, J., Bowden, D., Clark, M., Hall, J., and O'Driscoll, R. (2008). Ocean survey 20/20, international polar year census of antarctic marine life, Ross Sea biodiversity voyage 2008. NIWA Client Report: WLG2008-74.
Hanchet, S. M., Sainsbury, K., Butterworth, D., Darby, C., Bizikova, V., Godøa, O. R., et al. (2015b). CCAMLR's precautionary approach to management focusing on Ross Sea toothfish fishery. Antarct. Sci. 27, 333–340. doi:10.1017/S095410201400087X
Harcourt, R., Hindell, M. A., McMahon, C. R., Charassin, J.-B., Heerah, K., Hoenner, X., et al. (2021). Regional variation in winter foraging strategies by Weddell seals in Eastern Antarctica and the Ross Sea. Front. Mar. Sci. 8. doi:10.3389/fmars.2021.720335
Hucke-Gaete, R., Moreno, C. A., and Arata, J. (2004). Operational interactions of sperm whales and killer whales with the Patagonian toothfish industrial fishery off southern Chile. CCCAMLR Sci. 11, 127–140.
International Whaling Commission (2001). Report of the sub-committee on the comprehensive assessment of whale stocks-other stocks. J. Cetacean Res. Manag. (Special Issue) 3, 209–228.
Janc, A., Richard, G., Guinet, C., Arnould, J. P. Y., Villanueva, C.-M., Duhamel, G., et al. (2018). How do fishing practices influence sperm whale (Physeter macrocephalus) depredation on demersal longline fisheries? Fish. Res. 206, 14–26. doi:10.1016/j.fishres.2018.04.019
Kaleschke, L., Lüpkes, C., Vihma, T., Haarpaintner, J., Bochert, A., Hartmann, J., et al. (2001). SSM/I sea ice remote sensing for mesoscale ocean-atmosphere interaction analysis. Can. J. Remote Sens. 27 (5), 526–537. doi:10.1080/07038992.2001.10854892
Kasamatsu, F., and Joyce, G. G. (1995). Current status of odontocetes in the antarctic. Antarct. Sci. 7 (4), 365–379. doi:10.1017/s0954102095000514
Kern, S., Kaleschke, L., Girard-Ardhuin, F., Spreen, G., and Beitsch, A. (2020). Global daily gridded 5-day median-filtered, gap-filled ASI Algorithm SSMI-SSMIS sea ice concentration data. Germany: Integrated Climate Date Center (ICDC), CEN, University of Hamburg. https://www.cen.uni-hamburg.de/en/icdc/data/cryosphere/seaiceconcentration-asi-ssmi.html.
Kirk, J. T. O. (1994). Light and photosynthesis in aquatic ecosystems. 2nd edition. UK: Cambridge University Press.
Kock, K.-H., Purves, M. G., and Duhamel, G. (2006). Interactions between cetacean and fisheries in the Southern Ocean. Polar Biol. 29 (5), 379–388. doi:10.1007/s00300-005-0067-4
Kowarski, K., Delarue, J., Martin, B., O’Brien, J., Meade, R., Ó. Cadhla, O., et al. (2018). Signals from the deep: Spatial and temporal acoustic occurrence of beaked whales off Western Ireland. PloS One 13 (6), e0199431. doi:10.1371/journal.pone.0199431
Laplanche, C., Adam, O., Lopatka, M., and Motsch, J. F. (2005). Male sperm whale acoustic behavior observed from multipaths at a single hydrophone. J. Acoust. Soc. Am. 118 (4), 2677–2687. doi:10.1121/1.2033567
Laws, R. M. (1977). Seals and whales of the Southern Ocean. Philosophical Trans. R. Soc. Lond. B 279, 81–96. doi:10.1098/rstb.1977.0073
Lyver, P. O’B., Barron, M., Barton, K. J., Ainley, D. G., Pollard, A., Gordon, S., et al. (2014). Trends in the breeding population of Adélie penguins in the Ross Sea, 1981–2012: A coincidence of climate and resource extraction effects. PLoS One 9 (3), e91188. doi:10.1371/journal.pone.0091188
Madsen, P. T., Payne, R., Kristiansen, N. U., Wahlberg, M., Kerr, I., and Mohl, B. (2002). Sperm whale sound production studied with ultrasound time/depth-recording tags. J. Exp. Biol. 205 (13), 1899–1906. doi:10.1242/jeb.205.13.1899
Matsuoka, K., Kiwada, H., Hakamada, T., Nishiwaki, S., and Ohsumi, S. (2005). “Distribution and abundance of sperm whales in the Antarctic Areas IIIE, IV, V and VIW (35 E-145 W),” in Presentation to Cachalot Assessment Research Planning (CARP) workshop (Woods Hole, MA: Marine Biological Laboratory, Swope Center), 1–3.
Miller, B. S., and Miller, E. J. (2018). The seasonal occupancy and diel behaviour of Antarctic sperm whales revealed by acoustic monitoring. Sci. Rep. 8 (1), 5429. doi:10.1038/s41598-018-23752-1
Miller, P. J., Johnson, M. P., and Tyack, P. L. (2004). Sperm whale behaviour indicates the use of echolocation click buzzes ‘creaks’ in prey capture. Proc. R. Soc. Lond. Ser. B Biol. Sci. 271 (1554), 2239–2247. doi:10.1098/rspb.2004.2863
Moehl, B., Wahlberg, M., and Heerfordt, A. (2006). Hyper-directionality in clicks from the sperm whale (Physeter macrocephalus). J. Acoust. Soc. Am. 119 (5), 3372–3373. doi:10.1121/1.4786572
Møhl, B., Wahlberg, M., Madsen, P. T., Heerfordt, A., and Lund, A. (2003). The monopulsed nature of sperm whale clicks. J. Acoust. Soc. Am. 114 (2), 1143–1154. doi:10.1121/1.1586258
Møhl, B., Wahlberg, M., Madsen, P. T., Miller, L. A., and Surlykke, A. (2000). Sperm whale clicks: Directionality and source level revisited. J. Acoust. Soc. Am. 107 (1), 638–648. doi:10.1121/1.428329
Nemoto, T., Okiyama, M., and Takahashi, M. (1985). “Aspects of the roles of squid in food chains of marine Antarctic ecosystems,” in Antarctic nutrient cycles and food webs. Editors W. R. Siegfried, P. R. Condy, and R. M. Laws (Berlin: Springer-Verlag), 700.
Northridge, S. P. (1984). World review of interactions between marine mammals and fisheries. FAO Fisheries Technical Paper 251. Pp 190.
O’Driscoll, R. L., and Double, M. (2015). Voyage report TAN1502, New Zealand-Australia Antarctic Ecosystems Voyage.
O’Driscoll, R. L. (2019). Ross Sea environment and ecosystem voyage 2019, 4 january - 18 february 2019. Voyage Report – TAN1901 (February 2019)
O’Driscoll, R. L. (2021). Ross Sea life in a changing climate (ReLiCC) 2021 voyage, 4 january - 17 february 2021. Voyage Report – TAN2101 (February 2021)
Péron, C., Welsford, D. C., Ziegler, P., Lamb, T. D., Gasco, N., Chazeau, C., et al. (2016). Modelling spatial distribution of Patagonian toothfish through life-stages and sex and its implications for the fishery on the Kerguelen Plateau. Prog. Oceanogr. 141, 81–95. doi:10.1016/j.pocean.2015.12.003
Pinkerton, M. H., and Bradford-Grieve, J. M. (2014). Characterizing foodweb structure to identify potential ecosystem effects of fishing in the Ross Sea, Antarctica. ICES J. Mar. Sci. 71 (7), 1542–1553. doi:10.1093/icesjms/fst230
Pinkerton, M. H., Bradford-Grieve, J. M., and Hanchet, S. M. (2010). A balanced model of the food web of the Ross Sea, Antarctica. CCAMLR Sci. 17, 1–31.
Pinkerton, M. H., Dunn, A., and Hanchet, S. M. (2007). Ecological risk management and the fishery for Antarctic toothfish (Dissostichus mawsoni) in the Ross Sea, Antarctica. CCAMLR document WG-EMM-07/24. Hobart, Australia.
Pitman, R. L., and Ensor, P. (2003). Three forms of killer whales in Antarctic waters. J. Cetacean Res. Manag. 5, 1–9.
Ponganis, P. J., and Stockard, T. K. (2007). The antarctic toothfish: How common a prey for Weddell seals? Antarct. Sci. 19, 441–442. doi:10.1017/s0954102007000715
Porter, M. B. (2011). The bellhop manual and user’s guide: Preliminary draft, 260. La Jolla, CA, USA: Heat, Light, and Sound Research, Inc. Tech. Rep.
Poupard, M., Ferrari, M., Best, P., and Glotin, H. (2022). Passive acoustic monitoring of sperm whales and anthropogenic noise using stereophonic recordings in the Mediterranean Sea, North West Pelagos Sanctuary. Sci. Rep. 12, 2007. doi:10.1038/s41598-022-05917-1
Powers, D. M. (2011). Evaluation: From precision, ecall and F-mmeasure to ROC, informedness, markedness and correlation. J. Mach. Learn. Technol. 2 (1), 37–63.
Purves, M. G., Agnew, D. J., Balguerias, E., Moreno, C. A., and Watkins, B. (2004). Killer whale (Orcinus orca) and sperm whale (Physeter macrocephalus) interactions with longline vessels in the Patagonian toothfish fishery at South Georgia, South Atlantic. CCAMLR Sci. 11, 111–126.
Rendell, L., and Whitehead, H. (2001). Culture in whales and dolphins. Behav. Brain Sci. 24, 309–324. doi:10.1017/s0140525x0100396x
Rivaro, P., Messa, R., Ianni, C., Magi, E., and Budillon, G. (2014). Distribution of total alkalinity and pH in the Ross Sea (Antarctica) waters during austral summer 2008. Polar Res. 33 (1), 20403. doi:10.3402/polar.v33.20403
Shabangu, F., Stafford, K., Findlay, K., Rankin, S., Ljungblad, D., Tsuda, Y., et al. (2018). Overview of the IWC-SOWER cruise circumpolar acoustic survey data and analyses of Antarctic blue whale calls within the dataset. Technical report.
Smith, W. O., and Gordon, L. I. (1997). Hyperproductivity of the Ross Sea (Antarctica) polynya during austral spring. Geophys. Res. Lett. 24, 233–236. doi:10.1029/96gl03926
Smith, W. O., Shields, A. R., Dreyer, J. C., Peloquin, J. A., and Asper, V. (2011). Interannual variability in vertical export in the Ross Sea: Magnitude, composition, and environmental correlates. Deep-Sea Res. I 58, 147–159. doi:10.1016/j.dsr.2010.11.007
Spreen, G., Kaleschke, L., and Heygster, G. (2008). Sea ice remote sensing using AMSR-E 89-GHz channels. J. Geophys. Res. (Oceans) 113, C02S03. doi:10.1029/2005JC003384
Stammerjohn, S. (2019) NBP1704 CTD sensor data. U.S. Antarctic Program (USAP) Data Center. doi:10.15784/601422
Taylor, B. L., Baird, R., Barlow, J., Dawson, S. M., Ford, J., Mead, J. G., et al. (2019). Physeter macrocephalus (amended version of 2008 assessment) the IUCN red List of threatened species 2019: e.T41755A160983555, RLTS.T41755A160983555.en. Accessed on 09 April 2022. doi:10.2305/IUCN.UK.2008
Teloni, V., Johnson, M. P., Miller, P. J. O., and Madsen, P. T. (2008). Shallow food for deep divers: Dynamic foraging behavior of male sperm whales in a high latitude habitat. J. Exp. Mar. Biol. Ecol. 354 (1), 119–131. doi:10.1016/j.jembe.2007.10.010
Thiele, D., Chester, E. T., and Gill, P. C. (2000). Cetacean distribution off eastern Antarctica (80–150°E) during the austral summer of 1995/1996. Deep-Sea Res. II 47, 2543–2572. doi:10.1016/s0967-0645(00)00035-7
Towers, J. R., Tixier, P., Ross, K. A., Bennett, J., Arnould, J. P., Pitman, R. L., et al. (2019). Movements and dive behaviour of a toothfish-depredating killer and sperm whale. ICES J. Mar. Sci. 76 (1), 298–311. doi:10.1093/icesjms/fsy118
Urick, R. J. (1983). Principles of underwater sound. Third Edition (3rd edition. New York: McGraw-Hill. Reprint 2013.
Wahlberg, M. (2002). The acoustic behaviour of diving sperm whales observed with a hydrophone array. J. Exp. Mar. Biol. Ecol. 281 (1-2), 53–62. doi:10.1016/s0022-0981(02)00411-2
Watwood, S. L., Miller, P. J., Johnson, M., Madsen, P. T., and Tyack, P. L. (2006). Deep-diving foraging behaviour of sperm whales (Physeter macrocephalus). J. Animal Ecol. 75 (3), 814–825. doi:10.1111/j.1365-2656.2006.01101.x
Whitehead, H., Christal, J., and Dufault, S. (1997). Past and distant whaling and the rapid decline of sperm whales off the Galapagos Islands. Conserv. Biol. 11, 1387–1396. doi:10.1046/j.1523-1739.1997.96246.x
Whitehead, H. (2002). “Sperm whale Physeter macrocephalus,” in Encyclopedia of marine mammals. Editors W. Perrin, B. Würsig, and J. Thewissen (Academic Press), 1165–1172. 978-0-12-551340-1.
Worby, A. P., Geiger, C. A., Paget, M. J., Van Woert, M. L., Ackley, S. F., and DeLiberty, T. L. (2008). Thickness distribution of Antarctic sea ice. J. Geophys. Res. (Oceans) 113, C05S92. doi:10.1029/2007JC004254
Yukhov, V. L. (1971). The range of Dissostichus mawsoni Norman and some features of its biology. J. Ichthyology 11, 8–18.
Yukhov, V. L. (1972). The range of fish of the genus Dissostichus (Family: Nototheniidae) in the Antarctic waters of the Indian Ocean. J. Ichthyology 12 (2), 346–347. (English translation).
Zapetis, M., and Szesciorka, A. (2018). Encyclopedia of animal cognition and behavior. Cham: Springer, 14.Cetacean navigation
Keywords: sperm whale, ross sea, toothfish, Antarctica, passive acoustics monitoring
Citation: Giorli G and Pinkerton MH (2023) Sperm whales forage year-round in the ross sea region. Front. Remote Sens. 4:940627. doi: 10.3389/frsen.2023.940627
Received: 10 May 2022; Accepted: 06 March 2023;
Published: 27 March 2023.
Edited by:
Susan E. Parks, Syracuse University, United StatesReviewed by:
Fannie W. Shabangu, Department of Forestry, Fisheries and the Environment, South AfricaDavid Moretti, Naval Undersea Warfare Center (NUWC), United States
Copyright © 2023 Giorli and Pinkerton. This is an open-access article distributed under the terms of the Creative Commons Attribution License (CC BY). The use, distribution or reproduction in other forums is permitted, provided the original author(s) and the copyright owner(s) are credited and that the original publication in this journal is cited, in accordance with accepted academic practice. No use, distribution or reproduction is permitted which does not comply with these terms.
*Correspondence: Giacomo Giorli, Z2lhY29tby5naW9ybGlAY21yZS5uYXRvLmludA==