 Luis González Vilas1*
 Vittorio E. Brando1
 Javier A. Concha1,2
 Clèmence Goyens3
 Ana I. Dogliotti4,5
 David Doxaran6
 Antoine Dille3
 Dimitry Van der Zande3
- 1CNR-ISMAR, Istituto di Scienze Marine, Consiglio Nazionale delle Ricerche, Rome, Italy
- 2Serco S.p.A. c/o ESA-ESRIN, Rome, Italy
- 3RBINS, Royal Belgian Institute of Natural Sciences (RBINS), Operational Directorate Natural Environment, Brussels, Belgium
- 4Instituto de Astronomía y Física del Espacio, Consejo Nacional de Investigaciones Científicas y Técnicas (IAFE, CONICET/UBA), Buenos Aires, Argentina
- 5Instituto Franco-Argentino para el Estudio del Clima y sus Impactos (UMI-IFAECI, CNRS CONICET-UBA), Buenos Aires, Argentina
- 6Laboratoire d’Océanographie de Villefranche UMR7093—CNRS/SU, Villefranche-sur-Mer, France
A Match-up Database (MDB) file structure and tools were developed to ease the validation analysis of satellite water products and to improve the exchange and processing of match-up data from different sites, missions and atmospheric correction processors. In situ remote sensing reflectance (Rrs) measurements were available from the HYPSTAR® (HYperspectral Pointable System for Terrestrial and Aquatic Radiometry), a new automated hyperspectral radiometer. An MDB file is a NetCDF file containing all the potential match-ups between satellite and in situ data on a specific site and within a given time window. These files are generated and manipulated with three modules developed in Python to implement the validation protocols: extract satellite data, associate each extract with co-located in situ radiometry data, and then perform the validation analysis. This work provides details on the implementation of the open-source MDB file structure and tools. The approach is demonstrated by a multi-site matchup comparison based on satellite data from the Sentinel-2 MSI and Sentinel-3 OLCI sensors, and HYPSTAR® data acquired over six water sites with diverse optical regimes from February 2021 to March 2023.The analysis of Sentinel-3 OLCI matchups across the six sites shows consistency with previous comparisons based on AERONET-OC data over extended reflectance range. We evaluated Sentinel-2 MSI reflectance data corrected with two atmospheric correction processors (ACOLITE and C2RCC) over four sites with clear to highly turbid waters. Results showed that the performance of the processors depends on the optical regime of the sites. Overall, we proved the suitability of the open-source MDB-based approach to implement validation protocols and generate automated matchup analyses for different missions, processors and sites.
1 Introduction
In remote sensing, validation aims at evaluating quantitatively if satellite data meet the mission requirements and are suitable for the intended applications (IOCCG, 2012). Justice et al. (2000) defined validation as “the process of evaluating by independent means the accuracy of satellite-derived [land or water] products and quantifying their uncertainties by analytical comparison with reference data. According to Bailey and Werdell (2006), “validation is the process of determining the spatial and temporal error fields of a given biological or geophysical data product.” In practice, quality of satellite-derived products over time and space is often assessed by the direct comparison with (quasi-)coincident in situ measurements, defining a match-up as a pair of satellite and in situ measurements (Clark et al., 1997; Zibordi et al., 2009a; Zibordi et al., 2018). Hence, in situ measurements are assumed to be representative of the truth, at least within their own reported uncertainties that need to be determined for each site (Loew et al., 2017).
In ocean colour remote sensing, water reflectance, usually expressed as remote-sensing reflectance (Rrs) or normalized water-leaving radiance (LWN), is the standard input for retrieving bio-geophysical parameters (e.g., chlorophyll-a, total suspended matter, chromophoric organic dissolved organic matter) from most of the optical models (Concha et al., 2021 and references therein). Validation of Rrs is hence essential to assess the atmospheric correction processors converting the satellite top-of-atmosphere signal into Rrs data and ensure the quality of ocean colour data for water quality monitoring (Clark et al., 1997; Gordon, 2021; Pahlevan et al., 2021).
Reference data for radiometric validation are typically based on under- or above-water radiometry data from ships or fixed platforms, with both multispectral and hyperspectral resolution (Concha et al., 2021 and references therein).
A new automated hyperspectral radiometer, i.e., the HYPSTAR® (HYperspectral Pointable System for Terrestrial and Aquatic Radiometry), has been developed within the European Union’s HORIZON 2020 project HYPERNETS. This radiometer provides high-quality above-water hyperspectral radiometry data in the visible to near infrared (VNIR) from 380 to 1,020 nm with a spectral resolution of 5 nm (or better), and in the short-wavelength infrared (SWIR) from 1,000 to 1700 nm with a spectral resolution of 10 nm (Goyens et al., 2022; De Vis et al., 2024). During the project, HYPSTAR® radiometers were deployed using fixed platforms at 7 water sites and 7 land sites in order to provide measurements at high spectral and temporal resolutions and for the multi-mission validation of satellite products. After the project, and at the time of writing this manuscript, the network of water sites (WATERHYPERNET) includes six operative sites and is expected to continue to deliver data in future (Ruddick et al., 2024, submitted in the current special issue).
Efforts have been made by the ocean colour (OC) community to establish the protocols to obtain Fiducial Reference Measurements (FRM) from in situ radiometry data (see review in Ruddick et al., 2019) or to perform validation exercises based on match-ups of satellite and reference data (Bailey and Werdell, 2006; Zibordi et al., 2009b; Concha et al., 2021). However, there is a lack of a standard data formats or database structures to facilitate the sharing of match-up data and validation results. To this aim, the Match-up Database (MDB) concept was first introduced by EUMETSAT (EUMETSAT, 2019). MDB files are designed to include all the potential match-ups between satellite and reference (in situ) Rrs data and to be used as input for the implementation of validation analysis.
Moreover, several satellite validation tools are available within the OC community. EUMETSAT has developed ThoMaS (https://gitlab.eumetsat.int/eumetlab/oceans/ocean-science-studies/ThoMaS, accessed on 18 January 2024), a toolkit to create matchups of bio-geophysical in situ data (in SeaBASS/OCDB-like format) with satellite OC products from Sentinel-3 OLCI. ThoMaS is also an open-source MDB-based approach developed in Python sharing many features with the approach presented in this work, such as user-defined validation protocols and metrics and plots production. The SeaWiFS Bio-optical Archive and Storage System (SeaBASS) maintained by the NASA Ocean Biology Processing Group (OBPG) has also developed a set of Satellite Validation Match-Up Tools (https://seabass.gsfc.nasa.gov/wiki/validation_matchup_tools, accessed on 18 January 2024) as part of its software package. Its approach includes the satellite data finder and the match-up extractor, both designed to work only with NASA’s Ocean Biology Distributed Active Archive Center (OB.DAAC) Level-2 products. The satellite validation navy tool (SAVANT) was developed by the Naval Research Laboratory (Lawson et al., 2021). SAVANT implements validation analysis in three steps: ingestion of satellite and in situ data into a database in addition to a set of metadata; match-up filtering according to the quality control criteria defined by the user; and production of validation graphs and statistical information. Unfortunately, at the time of writing this manuscript, SAVANT was temporally unavailable for the OC community (personal communication, Lawson et al., 2021).
In this work, and in the framework of HYPERNETS project, we developed an open-source MDB file structure and a set of Python tools to implement validation analysis of satellite water products using hyperspectral data as reference.
The rest of this document is organized as follows. First, we describe the MDB structure and validation tools. Then, as an example of the MDB-based approach, we present the results of a multi-site validation exercise using match-ups of satellite data from Sentinel-3 OLCI and Sentinel-2 MSI sensors with HYPSTAR® data from six water sites between January 2021 to March 2023. And we finalize with a brief discussion and conclusions.
2 Methods
Several satellite validation tools are available within the OC community. In this study, we built on the MDB concept that was first introduced by EUMETSAT (EUMETSAT, 2019). MDB files were designed to include all the potential match-ups between satellite and reference (in situ) Rrs data and to be used as input for the implementation of validation analysis.
EUMETSAT has developed ThoMaS (https://gitlab.eumetsat.int/eumetlab/oceans/ocean-science-studies/ThoMaS, accessed on 18 January 2024), a toolkit to create match-ups of bio-geophysical in situ data (in SeaBASS/OCDB-like format) with satellite OC products from Sentinel-3 OLCI. ThoMaS is also an open-source MDB-based approach developed in Python sharing many features with the approach presented in this work, such as user-defined validation protocols and metrics and plots production. Moreover, it provides some interesting options, as direct access to the EUMETSAT Sentinel-3 products from the EUMETSAT data store to generate the extracts or the optional application of the bi-directional reflectance correction (BRDF) to the in situ Rrs data.
The SeaWiFS Bio-optical Archive and Storage System (SeaBASS) maintained by the NASA Ocean Biology Processing Group (OBPG) has also developed a set of Satellite Validation Match-Up Tools (https://seabass.gsfc.nasa.gov/wiki/validation_matchup_tools, accessed on 18 January 2024) as part of its software package. Its approach includes two steps: the satellite data finder, aimed at locating satellite granules given an in situ point in space and time; and the match-up extractor, which creates the satellite extracts and obtain the match-ups values by applying the default validation protocols proposed by Bailey and Werdell (2006), although the user can define some options as the size extract, the minimum percent of valid pixels or the maximum time difference between the satellite and in situ observations. The main limitations are that these tools are designed to work only with NASA’s Ocean Biology Distributed Active Archive Center (OB.DAAC) Level-2 products, and production of metrics and plots is not implemented in the software.
The satellite validation navy tool (SAVANT) was developed by the Naval Research Laboratory (Lawson et al., 2021). SAVANT implements validation analysis in three steps: ingestion of satellite and in situ data into a database in addition to a set of metadata; match-up filtering according to the quality control criteria defined by the user; and production of validation graphs and statistical information. The system was tested using in situ data from the Marine Optical Buoy (MOBY) and the Aerosol Robotic Network—Ocean Color (AERONET-OC) network and support satellite data from different sources, including Suomi National Polar-orbiting Partnership (SNPP) Visible Infrared Imaging Radiometer Suite (VIIRS), NOOA-20 VIIRS or Sentinel-3 OLCI, but the back-end database was designed to be flexible and open-ended. Unfortunately, at the time of writing this manuscript, SAVANT was temporally unavailable for the OC community (personal communication, Lawson et al., 2021).
2.1 MDB file structure
In this study, MDB files include all the potential match-ups between satellite and reference (in situ) Rrs data, and are then used for validation analysis. MDB files use the open-source NetCDF-4 (Network Common Data Form) file format (https://www.unidata.ucar.edu/software/netcdf), which is built on top of the Hierarchical Data Format version 5 (HDF5) (https://hdfgroup.github.io/hdf5). HDF5 supports large, complex and heterogenous data by using a directory-like structure to organize the data within the file.
Data in MDB files are stored in variables, i.e., multi-dimensional arrays of values of the same type. The shape of the arrays is defined using the following dimensions:
• satellite_id: satellite measurements (i.e., satellite Rrs extracts). It is defined as unlimited to enable appending more data. Its actual length is the number of satellite measurements included in the file.
• insitu_id: in situ measurements (i.e., in situ Rrs spectra). Its length indicates the maximum number of in situ measurements that could be associated with a specific satellite measurement.
• row and columns: spatial coordinates of the satellite extracts, which are defined as squared boxes of n rows by n columns centered on the in situ site location being n an uneven number of pixels.
• satellite_bands: satellite spectral bands. Its length depends on the number of bands of the sensor and/or the AC processor.
• insitu_original_bands: in situ spectral bands. Its length depends on the instrument (e.g., HYPSTAR® include 1,600 bands).
• mu_id: match-up of a satellite and an in situ measurement at a specific wavelength. It is also defined as unlimited. Its actual length is the number of satellite measurements by the number of satellite bands included in the validation analysis.
The list of variables with their corresponding dimensions is summarized in Table 1. All the variables (except for time_difference) could be grouped in the following groups: satellite variables (satellite prefix); in situ variables (insitu prefix); match-ups variables (mu prefix); and flag variables (flag prefix).
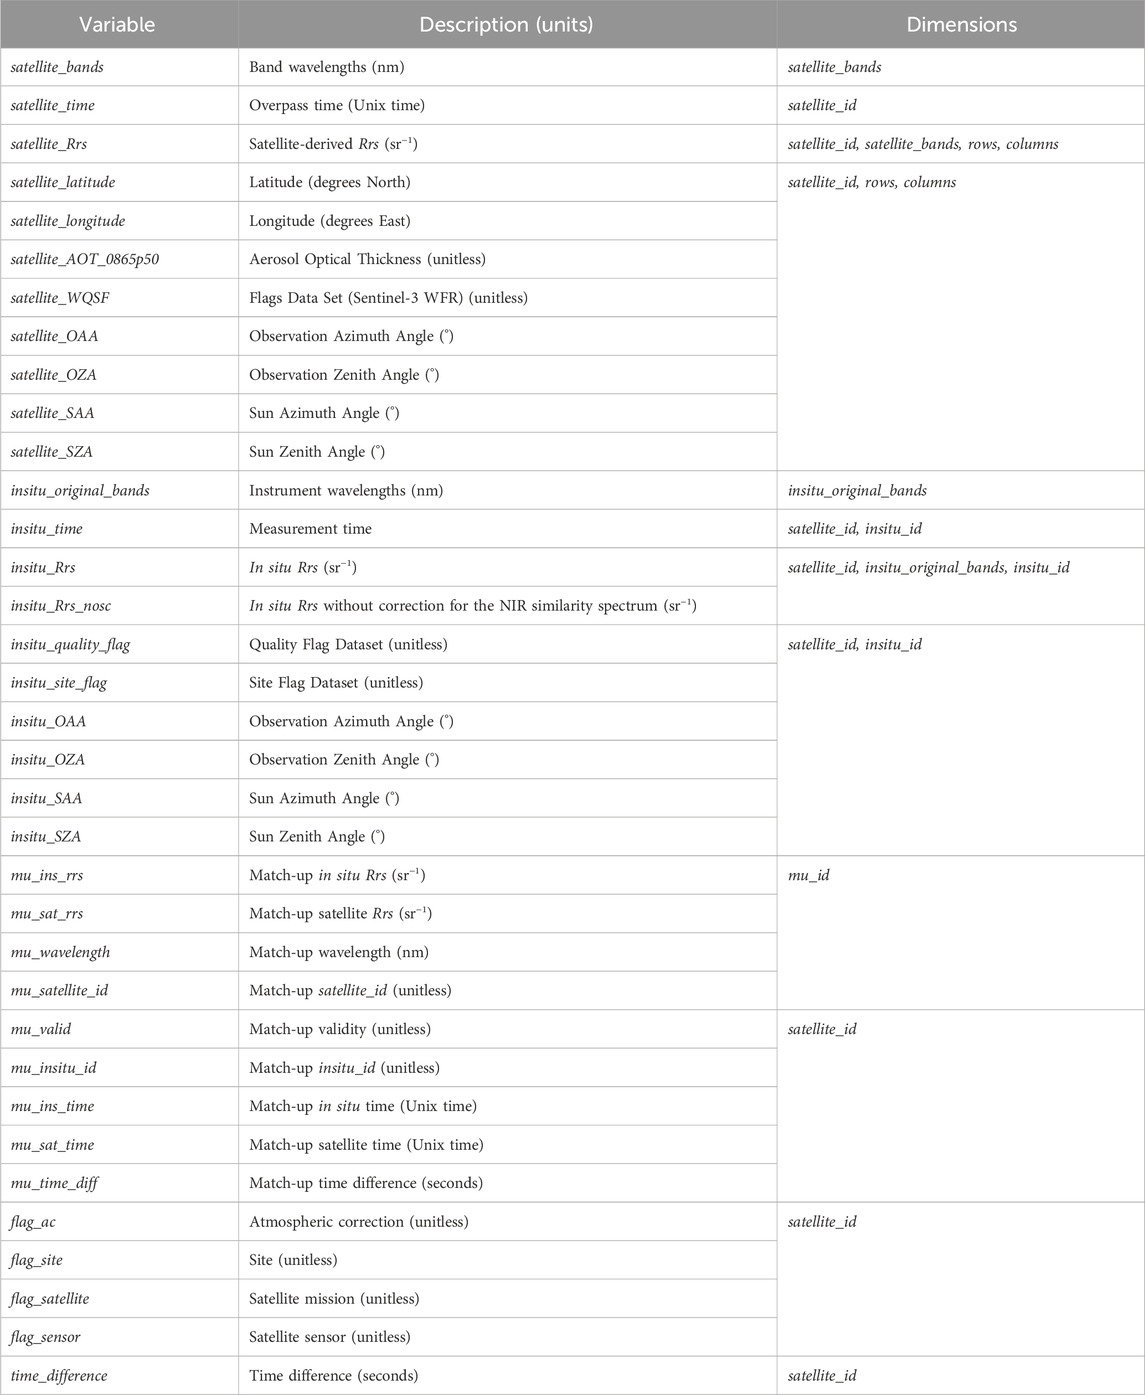
Table 1. List of variables included in the MDB file. Unix time is the number of seconds since 1 January 1970 00:00:00 UTC.
The MDB file also contains metadata (global attributes) to fully characterize and identify the file, including satellite and in situ sensor, name, latitude and longitude of the site, creation date, etc., (Supplementary Material MDB file structure, Section 2; Table 3).
2.2 MDB tools
We developed a set of Python tools to work with MDB files (Supplementary Material MDB User Manual). Tools are organized in three modules: SAT_EXTRACT, MDB_builder and MDB_reader, which are included in the hypernets_val repository available from the HYPERNETS project GitHub (https://github.com/HYPERNETS/hypernets_val). Figure 1 summarizes the workflow for the implementation of validation analysis based on the MDB-approach.

Figure 1. Workflow for the implementation of validation analysis using the MDB-based approach.
2.2.1 Extraction module (SAT_EXTRACT)
This module aims at extracting data from a specific satellite product for a box centered on the specified site location. The extract size can be defined by the user depending on the satellite resolution and/or site characteristics. By default, it is set to 25 × 25 pixels, which is enough for applying all the validation protocols proposed in literature for both medium- and high-resolution satellites (see review in Concha et al., 2021).
Different Python extracts tools were developed for working with specific satellite sensors and/or AC processors. For the multi-site validation exercise presented in this article, we used the tools for Sentinel-3 WFR, Sentinel-2 C2RCC and Sentinel-2 ACOLITE.
The output of the extract tools is a single NetCDF extract file for each satellite product and site, including a set of variables named with the prefix satellite (see Table 1). The variable used in the validation is satellite_Rrs, containing extracts of Rrs values for each satellite band. Other variables store the overpass time, the band wavelengths, the geographic coordinates (satellite_latitude and satellite_longitude) and data useful for the quality control, as sun and observation angles (e.g., satellite_OZA), aerosol optical thickness (satellite_AOT_0865p50) or flag bands for masking (e.g., satellite_WQSF).
2.2.2 Building module (MDB_builder)
The MDB_builder module aims at generating MDB files containing all the potential match-ups between satellite and in situ data. A single MDB file is produced for each satellite sensor, atmospheric correction processor and site.
The output MDB file includes: 1) the extracts of satellite data generated in the previous step, which are stored in the variables with the satellite prefix; and 2) the corresponding in situ data () available for the specific site within a time window from the satellite overpass time, which are stored in the variables identified with the insitu prefix (Table 1). insitu_Rrs contain the quality-assured Level-2 Rrs in situ spectra associated with each satellite extract. In this work for the HYPSTAR® spectra, Rrs with (insitu_Rrs) and without (insitu_Rrs_nosc) applying the correction for the NIR similarity spectrum were stored. Other variables include measurement time (insitu_time), band wavelengths (insitu_original_bands), geometry information (e.g., insitu_SZA) or flags datasets for masking (insitu_quality_flags or insitu_site_flags).
The time window, i.e., the maximum time difference between the in situ and satellite measurements, is defined by the user. Hence, the maximum number of in situ observations associated with a specific satellite extract (length of dimension insitu_id) depends on this time window and the in situ measurement frequency. This value is automatically determined from data or set by the user.
In this work, defaults are set to a time window of 3 h and a maximum of 40 in situ Rrs spectra. Depending on the site, HYPSTAR® collects automatically data with a time interval between 10 and 30 min, although the number of available spectra is not always the same one as some measurements are not processed to quality-assured level-2 Rrs spectra. Overall, the default (3 h) time window enable to collect enough data for maximizing the number of valid match-ups for all the sites.
2.2.3 Reader module (MDB_reader)
The MDB_reader module includes a set of tools for performing the validation analysis starting from the MDB files produced in the previous step. The approach consists of three steps: 1) Match-up generation; 2) Optional concatenation for multi-mission, multi-site and multi-processor analysis; 3) Plot production and metric computation.
2.2.3.1 Match-up generation
The match-up generation tool aims at producing match-ups, i.e., pairs of satellite and in situ Rrs at a given wavelength for the later plot production and metric computation. It uses as input a specific MDB file (The required quality control options for the satellite and in situ data and the spatiotemporal colocation protocols are defined by the user (Concha et al., 2021).
The process is divided into four steps:
1) Quality checking of satellite data: Satellite measurements are evaluated and identified as valid or invalid according to the criteria defined by the user, such as the size of the satellite extract and minimum number of valid pixels, masks based on flag lists or band (Rrs or geometry) thresholds, or spatial homogeneity tests based on the coefficient of variation or other extract statistics.
2) Quality checking of in situ data: In situ spectra are also defined as valid or invalid according to the criteria defined by the user, such as flag datasets or Rrs thresholds for specific spectral ranges.
3) Match-up preparation: Match-ups, i.e., pairs of satellite and in situ Rrs values, are obtained for all the available satellite bands or for a band list defined by the user. Satellite Rrs are derived from the satellite extract according to the user options, including the reported quantity (mean or median) and the possibility of applying outliers based on the standard deviation or the interquartile range. In situ Rrs are derived from the closest valid spectra to the satellite acquisition time. The user can decide if the Rrs value for each wavelength is retrieved as the value at the nearest wavelength to the satellite band or applying the spectral response function of the satellite sensor.
4) Match-up validity: A match-up is defined as valid if both the satellite and in situ measurements are valid (steps 1 and 2) and if the time difference between both acquisitions is lower than a threshold defined by the user.
Output data are stored in a set of new variables identified with the mu prefix (Table 1) and saved in an extended copy of the MDB file (MDBr). Data available for each match-up include Rrs (mu_sat_rrs and mu_ins_rrs), identifiers (mu_satellite_id and mu_insitu_id) and acquisition times (mu_sat_time and mu_ins_time) for both satellite and in situ measurements, as well as wavelength (mu_wavelength), validity (mu_valid) and time difference (mu_time_diff).
2.2.3.2 MDB concatenation
The concatenation tool creates a new MDB file (MDBrc) by assembling the match-ups from single MDB files with match-up values generated in the previous step. Therefore, results from different satellite/sensor, processed with different AC algorithms and/or based on in situ data from different sites are combined in a single file to obtain multi-mission, multi-processor and/or multi-site validation results.
The match-ups are correctly identified in the extended MDBrc file using new variables identified with the flag prefix (Table 1), as flag_ac (for the AC processor), flag_satellite, flag_sensor or flag_site.
2.2.3.3 Plots and metrics
The plot tool aims as obtaining different types of plot (e.g., scatter plots, average spectra) and metrics based on the recommendations in literature (Concha et al., 2021). It uses extended MDB files with match-ups (MDBr or MDBrc) as input. Options and parameters are defined by the user. Examples of plots are shown in the results for Sentinel-3 and Sentinel-2 in Section 3.1; Section 3.2, respectively.
Metrics used in this work are the determination coefficient (R2), Root Mean Square Deviation (RMSD); Absolute Percent Difference (APD), Relative Percent Difference (RPD) and bias, which are computed by the following equations (Eqs 1–5) using the in situ (x) and satellite (y) Rrs values:
R2 (unitless) assesses the agreement between the satellite and in situ Rrs ranging from 0 (no agreement) to 1 (perfect agreement). RMSD and APD quantify the differences between the satellite and in situ measurements in Rrs units (sr−1) and in percentage, respectively. RPD measures the relative error in percentage, whereas the bias (in Rrs units: sr−1) is useful for checking if there is overestimation (positive values) or underestimation (negative values). Some metrics are displayed in the scatter plot of Rrs match-ups in addition to the identity line (y = x) and the linear regression line based on the least square method (Figures 5, 10, 11).
2.3 Validation of Sentinel-3 OLCI level 2 WFR
We applied the MDB-based approach for a multi-site validation of Sentinel-3 OLCI Level 2 Water Full Resolution (WFR) product using HYPSTAR® data from six sites of the WATERHYPERNET network. Data were collected during the HYPERNETS deployment phase between January 2021 and March 2023.
2.3.1 Satellite and in situ data
The OLCI WFR product is operationally processed by EUMETSAT for both Sentinel-3A (from April 2016 to present) and 3B (from May 2018 to present) missions using the OLCI L2 processor IPF-OL-2 version 07 (EUMETSAT, 2021; Zibordi et al., 2022). OLCI WFR provides Rrs for 16 bands (all the OLCI bands except those dedicated to atmospheric measurements) between 400 nm and 1,020 nn at 300 m resolution, and with a revisit time of 1 day combining both missions. It also includes a pixel classification band, i.e., Water Quality and Science Flags (WQSF), which is imported into the MDB file (satellite_ WQSF, see Table 1). Data were available from the EUMETSAT Ocean Colour baseline collection OL_L2M.003.
In this study, HYPSTAR® publicly available datasets acquired at six water sites were included in the validation analysis (Table 2): Acqua Alta Oceanographic Tower in Venice (AAOT), Italy (VEIT) (Brando et al., 2023a); Garda Lake, Italy (GAIT) (Brando et al., 2023b); Berre, France (BEFR) (Doxaran and Corizzi, 2023a); Magest station—GIRonde estuary (MAGIR), France (MAFR) (Doxaran and Corizzi, 2023b); Rio de la Plata (RdP-EsNM), Argentina (LPAR) (Dogliotti et al., 2023); and Zeebrugge, Belgium (M1BE) (Goyens and Gammaru, 2023). The optical water types at the six sites range from clear to highly turbid waters (Table 2).
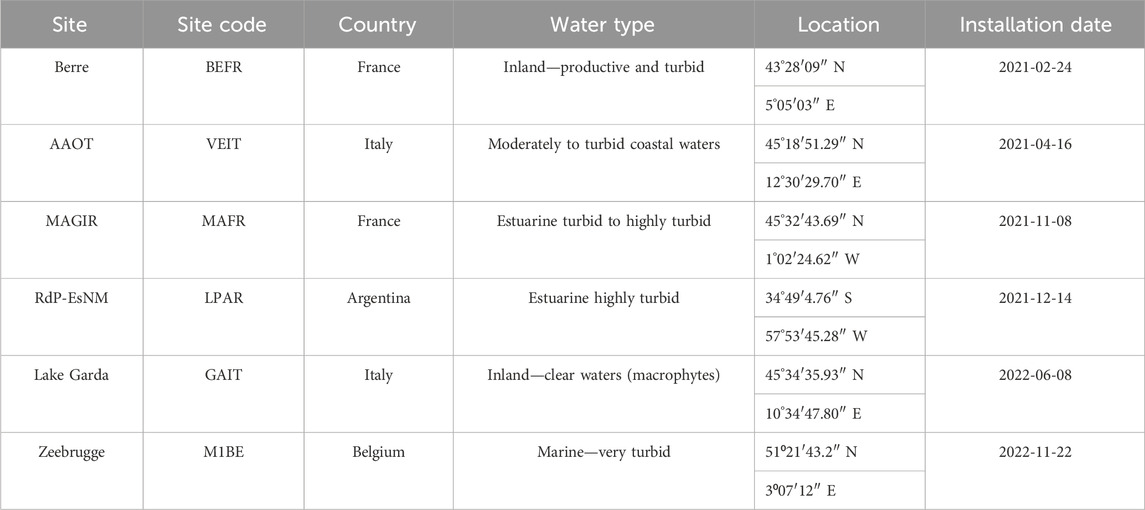
Table 2. WATERHYPERNET sites included in the Sentinel-3 validation analysis.
The reference data from HYPSTAR® are processed with the “hypernets processor” (https://github.com/HYPERNETS/hypernets_processor) and assumed to be quality-assured Level 2 Rrs data (with site specific quality checks, see Tables 3, 4, but without extrapolation of the viewing and illumination geometry).
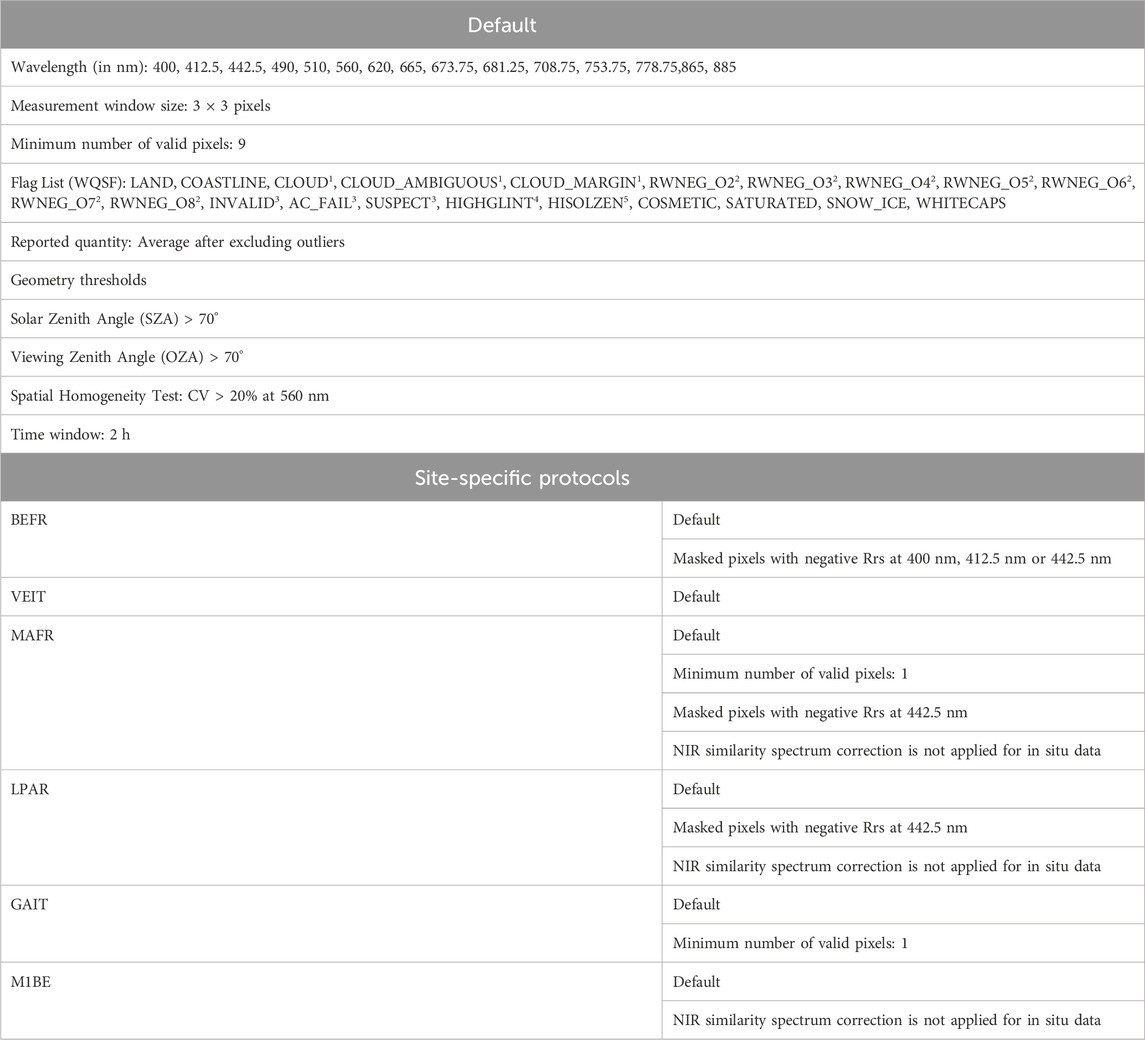
Table 3. Default and site-specific protocols implemented in the OLCI WFR validation analysis. Superscripts in the flag list indicate the flags used in the flag groups shown in Figure 3 (1: S3_CLOUD; 2: S3_RWNEG; 3: S3_INVALID; 4: HIGHGLINT; 5: HISOLZEN).
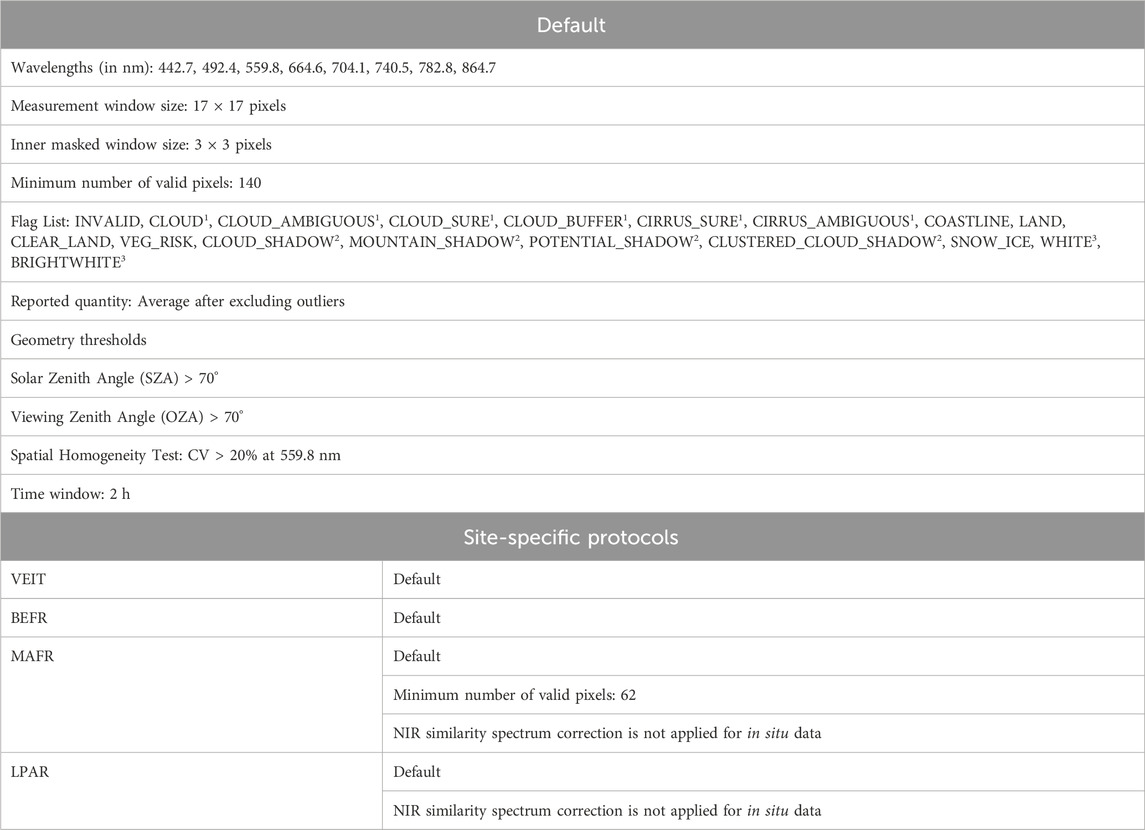
Table 4. Default and site-specific protocols implemented in the MSI validation analysis. Superscripts in the flag list indicate the flags used in the flag groups shown in Figure 8 (1: S2_CLOUD; 2: S2_SHADOW; 3: S2_WHITE/BRIGHT). Note that the same flagging based on IdePix software was applied to both C2RCC and ACOLITE processors.
Rrs data are calculated according to Eq. 6, i.e., the measured above water upwelling radiance, Lu (θ, Δφ, θs, λ) is corrected for the reflectance at the air-water interface and is normalized by the downwelling irradiance, Ed (θs, λ). The symbols θ, Δφ, θs, and λ stand for the viewing zenith angle, the relative azimuth angle between sun and sensor, the solar zenith angle and wavelength, respectively. The reflectance at the air-water interface is the product of the air-water interface reflectance factor, ρF (θ, Δφ, θs, ws), taken from Mobley (1999) and with ws being the wind speed, and, the downwelling radiance, Ld, measured at a an angle reciprocal to the measurement of Lu, i.e., θ-140°. More details on the HYPSTAR® data processing are available in Goyens et al., 2021, Goyens et al., 2022 and De Vis et al. 2024.
For most sites the NIR similarity correction (Ruddick et al., 2024) has been applied to correct the spectra for remaining glint. However, for some sites the theory of the NIR Similarity correction is not valid, in particular in very turbid waters, explaining why the Rrs data without the NIR similarity spectrum correction is used. Both Rrs variables (insitu_Rrs and insitu_Rrs_nosc) are delivered by the “hypernets processor” and are available in the MDB files (see Table 1). It is at the discretion of the end-user to select the appropriate final product. The HYPSTAR® Level-2 files also provide flags (imported into the MDB file as insitu_quality_flag) that are useful for checking the validity of the Rrs spectra.
2.3.2 MDB-based approach and validation protocols
As explained in Section 2.2, the MDB-based approach consists of three steps:
a) Satellite extract: Production of satellite extracts from OLCI WFR images for all the sites and dates with available in situ data (Section 2.2.1).
b) MDB building: Preparation of 12 MDB files including satellite and in situ data for each platform (Sentinel-3A and 3B) and site (2 platforms x 6 sites) (Section 2.2.2).
c) MDB reader: Match-ups generation for each single MDB implementing the corresponding validation protocols; concatenation to produce a single MDB file; and production of plots and statistics (Section 2.2.3)
Validation protocols are summarized in Table 3. Default options are based on the recommendations available in literature for Sentinel-3 OLCI (Concha et al., 2021; EUMETSAT, 2022). Protocols were adapted for some sites with specific characteristics.
All the available bands were included in the analysis except for 1,020 nm, since the combination of a greater variability of the HYPSTAR® spectra in the near infrared and the low signal (except for LPAR and MAFR) leads to unreliable results.
Regarding the satellite quality control, the same flag list based on the WQSF flag band was implemented for all the sites. With respect to the default parameters, the main difference is the application of only one valid pixel in the measurement window for GAIT and MAFR (instead of the strict criterium of 9 valid pixels) because of the proximity of the coastline. Moreover, considering that WQSF RNEG flags allow for low negative values up to a defined threshold, we masked negative pixels at some stations in the blue spectral range in order to reduce noise (Table 3).
In situ Rrs data were extracted as the HYPSTAR® L2 values at the nearest wavelength to the corresponding satellite band. Data without the NIR similarity spectrum correction were used for the validation of the sites with high turbid waters (i.e., MAFR, LPAR, and M1BE, Table 2).
2.4 Validation of Sentinel-2 MSI processed using ACOLITE and C2RCC
We used the MDB-based approach for a multi-site and multi-processor validation exercise of Sentinel-2 MSI based on HYPSTAR® data from four WATERHYPERNET sites acquired between January 2021 and March 2023.
2.4.1 Satellite and in situ data
Sentinel-2A and 2B Level 1B images available from ESA (revisit time varies between 3 and 5 days combining both missions) were processed to produce Level-2 Rrs products at 20 m resolution using two AC processors: the Case 2 Regional Coast Colour, C2RCC (Doerffer and Schiler, 2007; Brockmann et al., 2016) and ACOLITE/DSF (Vanhellemont, 2019a). ACOLITE provides remote sensing reflectance data for 11 bands between 442 nm and 2,200 nm at 20 m spatial resolution. The Version 2 of C2RCC (https://c2rcc.org/neural-nets/) provides Rrs data for 8 MSI bands between 442 nm and 865 nm at 20 m spatial resolution. In addition to the atmospheric correction, the pixels are also classified to flag non-water and/or cloud contaminated pixels. Therefore, the IdePix software (v2.2.10, algorithm update 8.0.3), available as a SNAP processor, is used. How the data has been processed is detailed in Van der Zande et al. (2022). This document also provides a description of both AC algorithms, and their respective assumptions. Note, however, that the complementary quality tests coming from the AC algorithms suggested by the authors have not been applied here. The IdePix classes used for flagging are given in Table 4.
Four sites were included in the analysis (Table 2): Acqua Alta Oceanographic Tower (VEIT), Berre (BEFR), MAGIR (MAFR), and Rio de la Plata (LPAR). As compared to Sentinel-3 (see Section 2.3.1), Lake Garda (GAIT) and Zeebrugge (M1BE) were excluded because only a small number of match-ups was available since most of the images were affected by sun glint (GAIT) or the deployment period was too short (M1BE).
2.4.2 MDB-based approach and validation protocols
The MDB-based approach (see Section 2.2) was based on three steps:
a) Satellite extract (Section 2.2.1): Production of satellite extracts from ACOLITE and C2RCC images for all the sites and dates with available in situ data.
b) MDB building (Section 2.2.2): Generation of 16 MDB files including satellite and in situ data for each platform (Sentinel-2A and 2B), AC processor (ACOLITE and C2RCC) and site (2 platforms x 2 AC processors x 4 sites).
c) MDB reader (Section 2.2.3): Match-ups generation for each single MDB implementing the corresponding validation protocols; concatenation to produce a single MDB file; and production of plots and statistics.
Table 4 summarizes the validation protocols. Default options follow the recommendations available in the literature for high-resolution sensors (Concha et al., 2021). As with Sentinel-3, some variations were implemented to adapt the protocols to the site-specific characteristics.
We included in the validation analysis the eight bands available for both AC processors, using the same flag list based on IdePix (Table 4). Due to the broad band width in Sentinel-2, we implemented Spectral Response Functions (SRF) specific for each Sentinel-2 mission in order to extract the in situ Rrs values matching to each satellite band (https://sentinels.copernicus.eu/web/sentinel/user-guides/sentinel-2-msi/document-library/-/asset_publisher/Wk0TKajiISaR/content/sentinel-2a-spectral-responses, accessed on 19 January 2024) Moreover, the NIR similarity spectrum correction was not applied to the HYPSTAR® L2 spectra for the sites with high turbid waters (i.e., MAFR and LPAR) consistently with the Sentinel-3 analysis.
3 Results
3.1 Sentinel-3 OLCI WFR
3.1.1 Coverage
We obtained 1955 match-ups combining data from both Sentinel-3A and 3B missions at the six sites. 595 of these match-ups (around 30%) were classified as valid after applying the quality control (see Section 2.3).
Figure 2 summarizes the temporal distribution showing the total and valid number of match-ups by month and site. The highest number of match-ups are from VEIT and BEFR, as HYPSTAR® radiometers at these sites were working for a longer period with some interruptions since the first half of 2021 until February 2023. Data from GAIT and MAFR were available with some interruptions since beginning 2022, LPAR was working during two short periods (December 2021-February 2022 and May 2022-September 2022) and data from M1BE were not available until February 2023. Note that up to 40 potential match-ups could be obtained for a specific site and month because two match-ups (one per mission) are available for some days.
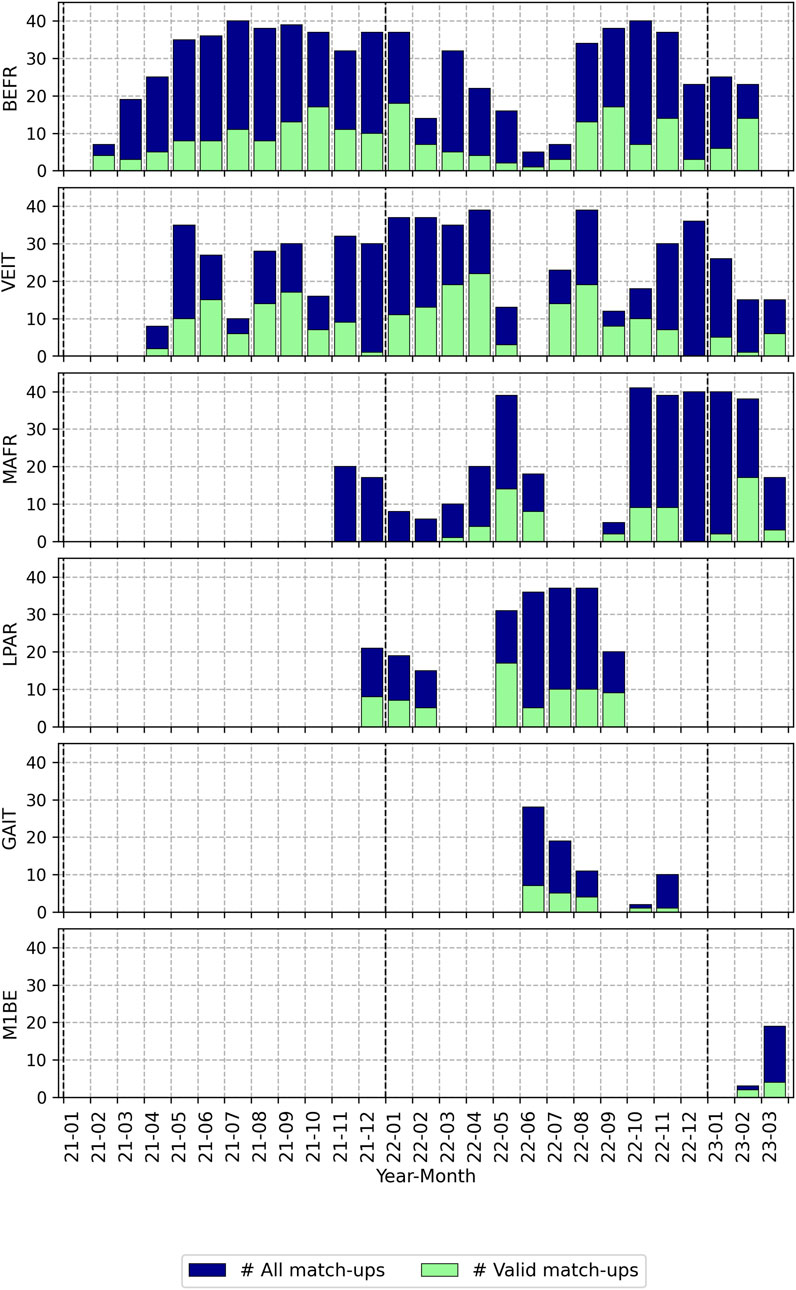
Figure 2. Number of total and valid Sentinel-3 WFR match-ups per month and site.
The temporal distribution of valid match-ups is a result of the percentage of valid match-ups with respect to the total number of match-ups per site (Figure 3A) and the satellite flags affecting each site (Figure 3B). For instance, VEIT shows the highest validity rates (37.06%), with more than 15 valid match-ups in some months (Figure 2). On the other hand, the lowest percentage is found in MAFR (19.27%), which is explained by the higher impact of the cloud coverage (almost 80%, see Figure 3B). Coverage results from M1BE or GAIT, with values around 25%, are less significant as coming from a shorter deployment period.
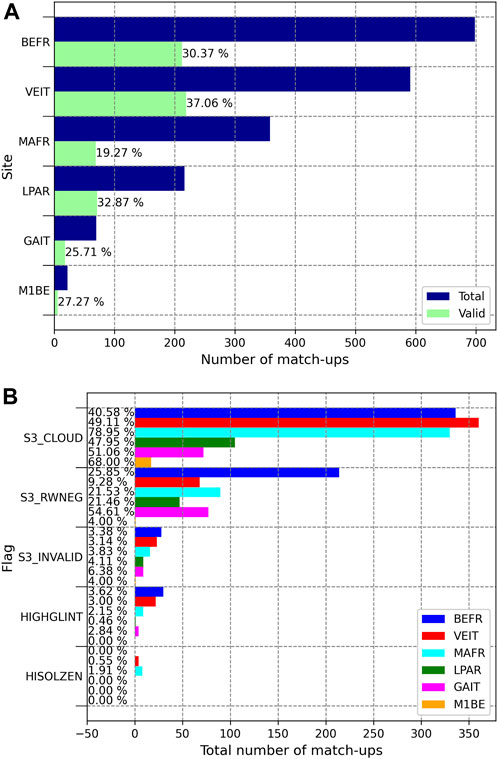
Figure 3. (A) Number of total and valid match-ups for each site. Validity rate is also shown. (B) Number of match-ups with at least one pixel affected by a specific flag within the measurement window, and percentage with respect to the total number of potential match-ups. Flags included in each flag group are shown in Table 1.
Most of invalid match-ups are caused by the cloud coverage (Figure 3B), with percentages varying between 40% and 80%. Moreover, negative reflectance values (S3_RWNEG) also have an important impact, especially at sites characterized by low signals in the blue part of the spectrum as BEFR. In fact, VEIT shows a better global coverage than BEFR despite of its higher cloud coverage (49.11% versus 40.58%) because of the lower impact of S3_RWNEG (9.28% versus 49.11%). Other flags have a less significant effect as they only affect a limited number of match-ups (always lower than 7%).
3.1.2 Comparison of in situ and satellite spectra
Figure 4 shows the comparison between satellite and in situ spectra for each site. Overall, at all the sites the in situ and satellite radiometry show similar spectral shape but WFR tends to underestimate the in situ Rrs values. Overall, there is a greater variability in the blue part of the spectrum and a higher overlap towards the red and NIR spectral range, with exception of GAIT.
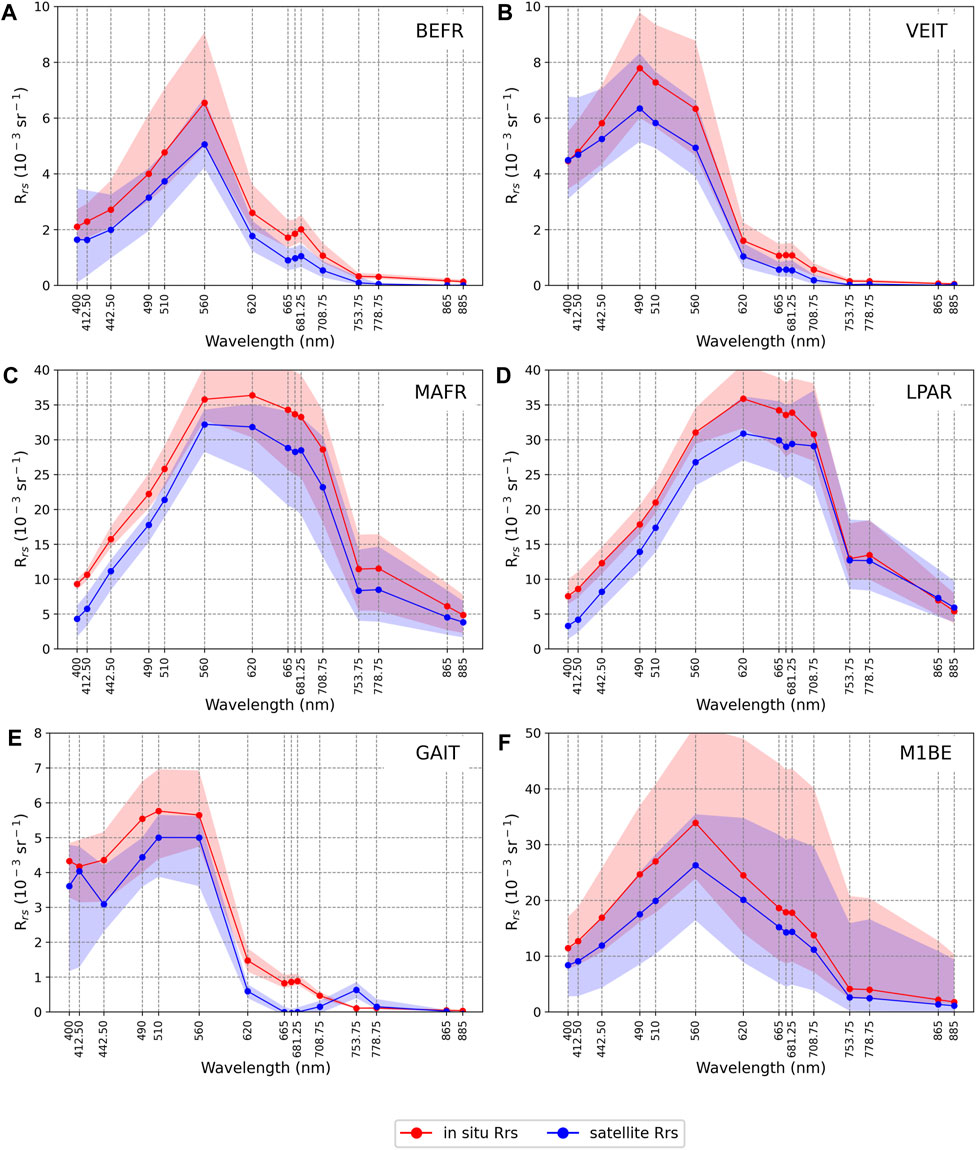
Figure 4. Comparison between satellite (Sentinel-3 WFR) and in situ (HYPSTAR® L2) spectra for each site: (A) BEFR; (B) VEIT; (C) MAFR; (D) LPAR; (E) GAIT; (F) M1BE. Lines show the average spectra and shadow areas indicate the interquartile range. Note that spectral shapes and Rrs ranges reveal, to some extent, the specific optical characteristics of each site.
VEIT is characterized by optically complex waters. oligotrophic to mesotrophic waters in function of the phytoplankton seasonal dynamics, some moderately turbid waters occur due to wind and wave driven re-suspension or coastal currents. The Rrs spectra are thus characterized by a high variability in the blue and green spectral range (400-560 nm) and low Rrs values between 665 nm and 708.75 nm.
BEFR is characterized by moderately turbid waters with rather stable concentrations of CDOM and non-algal particles along the year, and strong seasonal dynamics of phytoplankton with peaks of chl-a concentrations occurring at the end of the summer period. BEFR shows a higher CDOM absorption and lower Rrs values than VEIT in the blue part of the spectrum.
As compared to VEIT or BEFR, LPAR, and MAFR sites are characterized by highly turbid sediment-dominated waters with higher Rrs ranges. Strong tidal currents and river discharges strongly influence the dynamics of suspended sediment concentrations and therefore the water optical properties. Both sites show also similar spectral shapes except for the 560 nm–708.75 nm spectral range: LPAR shows lower Rrs values at 560 nm and higher Rrs values between 665 nm and 708.75 nm, specially at 708.75 nm. Compared to LPAR, MAFR shows higher but less variable Rrs values in lower wavelengths (400–510 nm) and lower but more variable Rrs in the NIR (753.75–885 nm).
GAIT is characterized by clear oligo/meso-trophic lake waters with Rrs spectra with a peak centred in the 442.5–510 nm spectral range. As the radiometer is installed in a steep transitional zone, due to varying lake water levels it can measure some shallow waters that may not be captured by the satellite footprint: Rrs values between 665 nm and 708.75 nm were consistently higher for the in situ spectra than Sentinel-3 WFR. Furthermore a 753.75 nm peak in satellite data not observed in the in situ spectra may be due to adjacency effects or the lake elevation not addressed adequately by the atmospheric correction.
Results from M1BE are not significant as they come from only 11 valid match-ups. However, the Rrs range, similar to those from LPAR and MAFR, indicates that the site is mainly characterized by turbid waters. This is also in agreement with the literature showing turbid coastal waters around this station (e.g., Vanhellement and Ruddick, 2021 and references therein).
3.1.3 Validation results
Figure 5 shows the scatter plots between satellite and in situ Rrs for each wavelength and grouped by site. A high data dispersion and poor correlation (R2 < 0.35) are observed at 400 nm and 442.5 nm. Better correlations are attained with increasing wavelengths, mainly between 510 nm and 865 nm (R2 > 0.90), whereas a relative worse fitting is obtained at 442.5 nm or 885 nm. As also observed in Figure 4, a negative bias was found across the whole spectral range. Regression lines also show negative deviations with respect to the identity line (y = x). These negative deviations increase with Rrs and are mainly linked with match-ups from turbid sites (MAFR, LPAR or M1BE) with Rrs values higher that 0.010 sr−1.
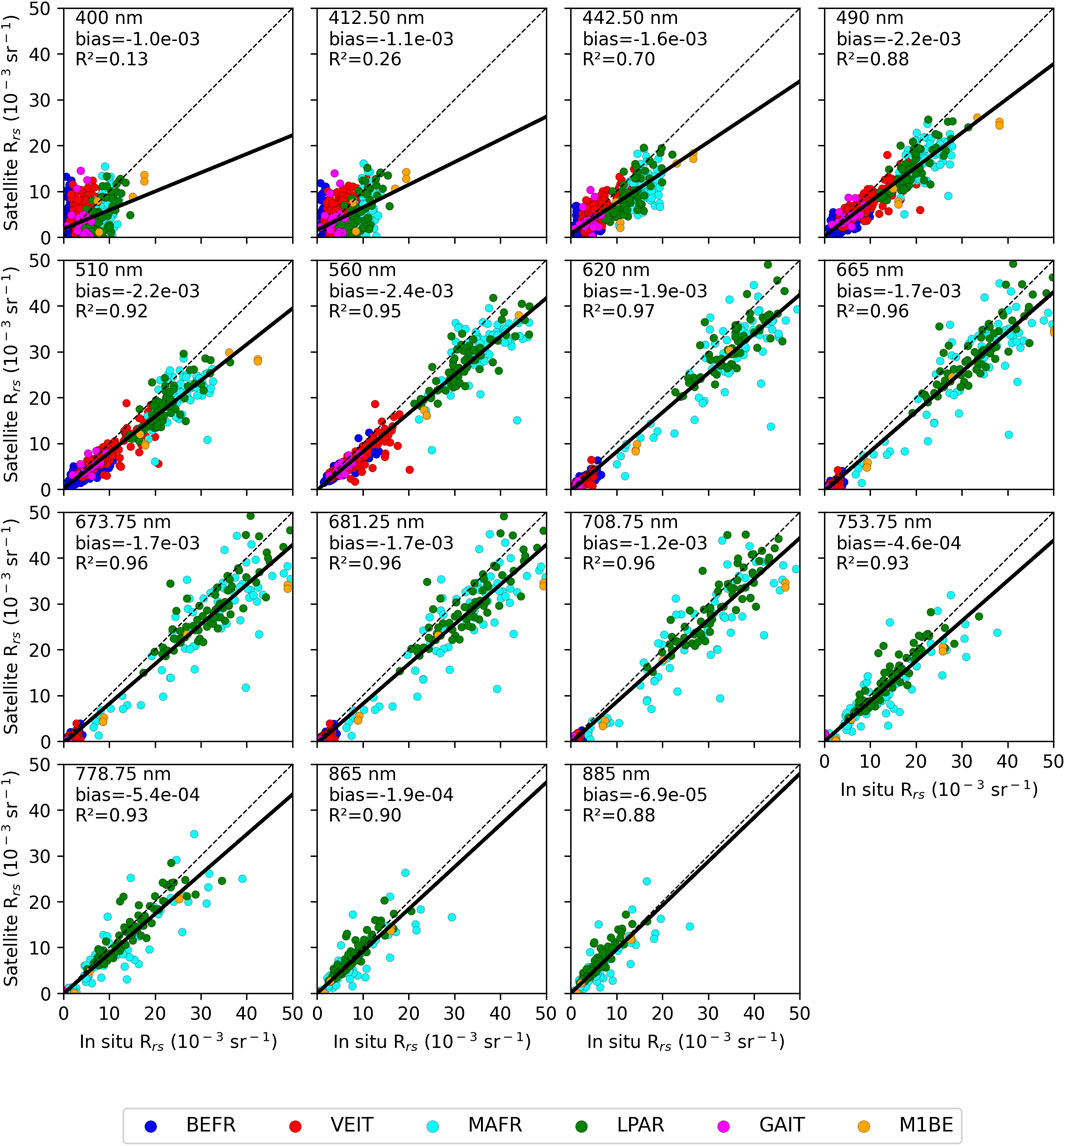
Figure 5. Scatter plot of Rrs match-ups between satellite (Sentinel-3 WFR) and in situ (L2 HYPSTAR®) measurements for each OLCI band. Data points are coloured by site. Statistics are computed including the six sites.
Spectral variation of some metrics for each site is shown in Figure 6 (except for M1BE as only 11 match-ups were available). Overall, RMSD values are lower in the 708.75–865 nm spectral range and higher in the blue part of the spectrum. The determination coefficients (R2) are always higher between 490 nm and 708.75 nm, with a peak at 560 nm and lower values in the blue and towards the red parts of the spectrum. The bias values are always negative, expect for some values near zero (see also Figure 4). Lower bias values are observed in the 708.75–855 nm spectral range.
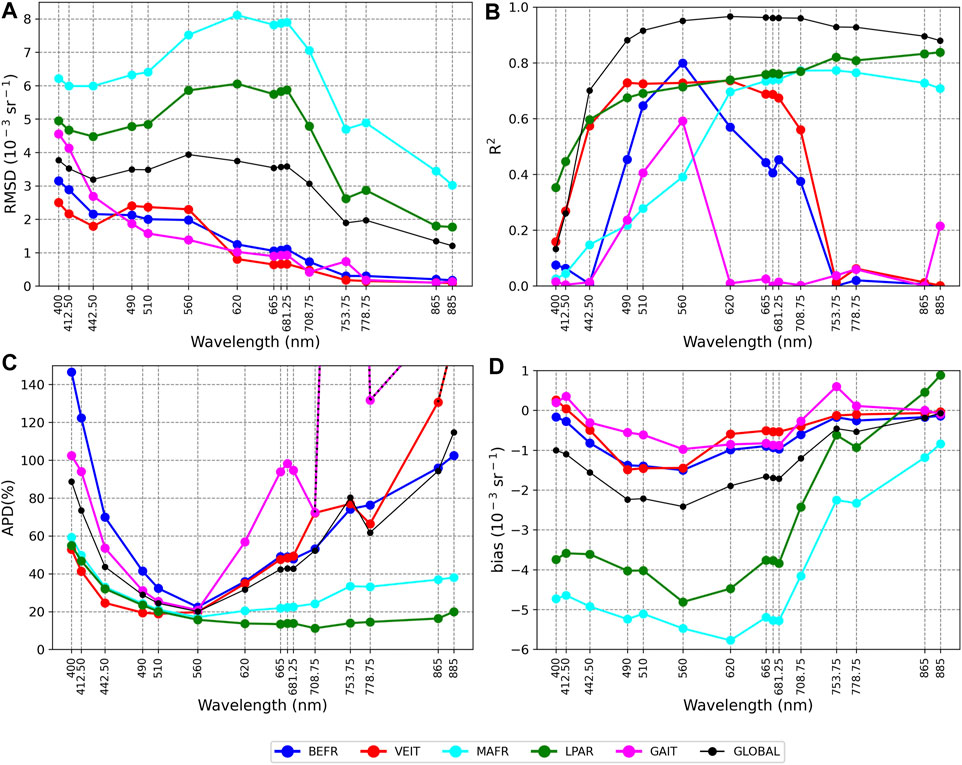
Figure 6. Spectral variation of the validation metrics computed for each site from the Sentinel-3 WFR match-ups with HYPSTAR® L2 in situ data. (A) RMSD (in Rrs units: sr−1). (B) Determination coefficient (R2). (C) Absolute percentage difference (in percentage). (D) Bias (in Rrs units: sr−1).
Analysing the validation metrics by site, VEIT and BEFR show similar global results (including all the bands) in terms of determination coefficient (VEIT: 0.83; BEFR: 0.85), bias (VEIT: −5.9 10−4 sr−1: BEFR: −5.8 10−4 sr−1) or RMSD (VEIT: 1.6 10−3 sr−1; BEFR: 1.1 10−3 sr−1). Moreover, bias follows a similar spectral pattern for both sites (Figure 6) despite of the different spectral shape (Figure 4), with negative values between 442.5 nm and 708.75 nm and near zero in the remaining bands (Figures 4, 6). There are also some differences, as BRFR results are better in the 490–560 nm spectral range with higher correlation coefficients and lower bias and RMSD values.
As compared to VEIT/BEFR, sites characterized by highly turbid waters (i.e., MAFR and LPAR) show remarkably higher RMSD and bias values across the whole spectrum, but mainly in the 400–681.25 spectral range, and a better fitting (higher R2 values) between 665 nm and 885 nm. These differences are mainly explained because Rrs data from MAFR/LPAR present a higher range (with values up to 0.060 sr−1) causing a higher bias and RMSD, but also better results in terms of correlation. Comparing both turbid sites, results from LPAR are better than those from MAFR in terms of correlation, bias and RMSD for almost all the spectral bands.
Results from GAIT are affected by higher uncertainties in the Rrs data because of the low water level in the Lake Garda due to a prolongated drought, which could cause shallow waters and bottom effects. In fact, results from this site are worse in terms of correlation, with only a determination coefficient higher than 0.6 at 560 nm, and bias, with a positive value at 753.75 (Figures 4, 6). Regarding RMSD, values are similar to those from BEFR except for the blue region (400 nm–442.5 nm).
3.2 Sentinel-2 MSI (ACOLITE and C2RCC)
3.2.1 Coverage
We obtained 508 potential match-ups combining Sentinel-2A and 2B missions and the four WATERHYPERNET sites (BEFR, VEIT, LPAR and MAFR). Since we used a common flagging framework, we obtained almost the same number of valid match-ups for both processors: 226 for ACOLITE and 229 for C2RCC. Validation analysis was only based on common valid match-ups resulting in 221 valid match-ups (∼44%), distributed as follows: 99 from BEFR, 77 from VEIT, 32 from LPAR and 11 from MAFR (see also Table 3). As compared to Sentinel-3, GAIT and M1BE were discarded from further analysis because of the small number of valid match-ups.
Figure 7 shows the temporal distribution of the potential and valid match-ups grouped by site. As compared to Sentinel-3, the temporal distribution patterns of potential match-ups are quite similar as a result of the same availability of HYPSTAR® data (Figures 2, 7). However, the total number of match-ups is more limited because of the longer revisit time (3-5 days vs. 1 day) with only 12 potential match-ups as maximum for each single month and site. Regarding the number of valid match-ups, we obtained on average 4 match-ups by site and month, with a peak of 10 valid match-ups available in August 2022 for VEIT (Figure 7).
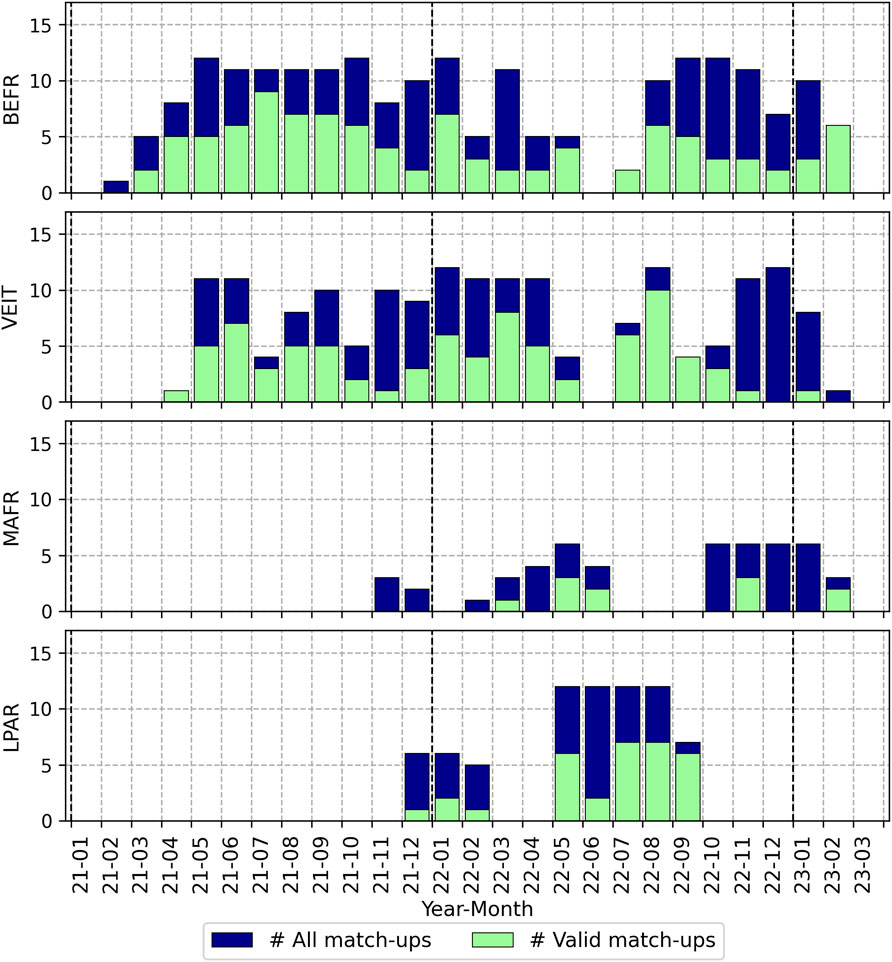
Figure 7. Number of total and valid Sentinel-2 match-ups per month and site. The valid number of match-ups include only common match-ups for ACOLITE and C2RCC.
The rates of valid match-ups with respect to the total number of match-ups (Figure 8A) were similar at BEFR, VEIT and LPAR, with values around 45%. In these three sites, validity rates were higher than those attained using Sentinel-3 OLCI WFR (Figure 3A). This difference is more remarkable at BEFR (48.56% with MSI versus 30.37% with OLCI WFR) because of the impact of negative reflectance values (flag RWNEG, Figure 3B) on WFR match-ups. Finally, MAFR shows a lower validity rate (22%) as a consequence of the cloudiness impact (72.73%), with similar percentages to those obtained with OLCI WFR (Figure 3).
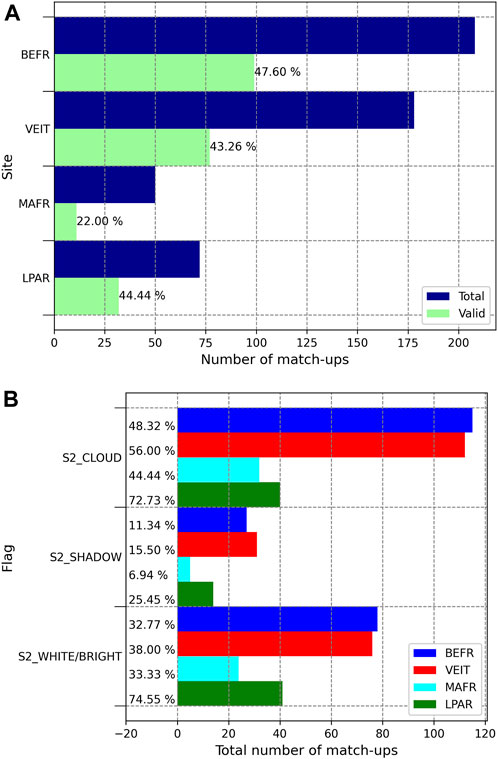
Figure 8. (A) Number of total and valid match-ups (based on common match-ups for ACOLITE and C2RCC) for each site. Validity rate is also shown. (B) Number of match-ups with at least one pixel affected by a specific flag within the measurement window, and percentage with respect to the total number of potential match-ups. Flags included in each flag group are shown in Table 3.
Figure 8B shows the impact of some satellite flags on the match-ups for each site. As with Sentinel-3 WFR, cloud coverage was the most common flag leading to invalid match-ups for all the sites, affecting more than 70% of match-ups at MAFR and around 50% at the other sites. Moreover, bright or white pixels and shadow also had a significant impact.
3.2.2 Comparison of in situ and satellite spectra
Figure 9 shows the comparison between satellite and in situ spectra using both C2RCC and ACOLITE, highlighting the differences between both processors.
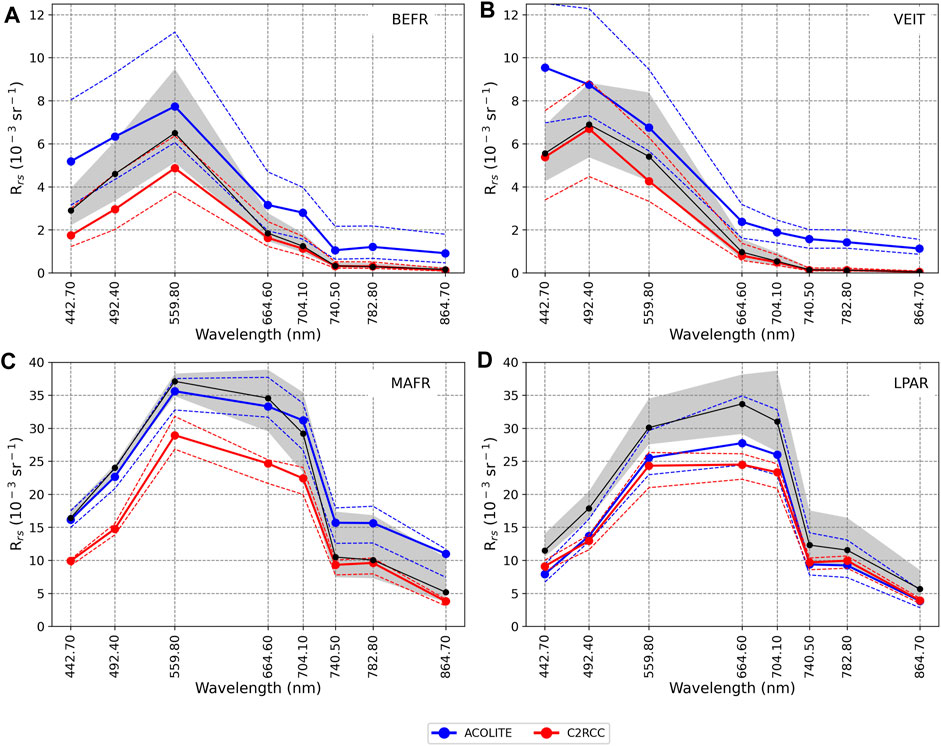
Figure 9. Comparison between satellite (Sentinel-2 ACOLITE and C2RCC) and in situ (HYPSTAR® L2) spectra for each site: (A) VEIT; (B) BEFR; (C) LPAR; (D) MAFR. Solid lines show the average spectra, whereas the grey shadow area and the dashed lines limit the interquartile range for in situ and satellite data, respectively.
At VEIT and BEFR, ACOLITE follows correctly the spectral shape except for the increasing Rrs between 442.7 nm and 492.4 nm at VEIT. However, it tends to overestimate keeping a positive bias across the whole spectral range, with values around 1 10−3 sr−1 (Figures 9A, B).
C2RCC also keeps better the spectral shape at these two sites but with a opposite behaviour as compared to ACOLITE: it tends to underestimate showing non-uniform negative bias, with higher deviations between 442.7 nm and 559.8 nm and lower bias values lower (<0.2 10−3 sr−1) with wavelengths greater than 704.1 nm (Figures 9A, B).
At the sites characterized by highly turbid waters, i.e., LPAR and MAFR, C2RCC is able to follow the spectral shape but with a high negative bias across the whole spectra. At LPAR, ACOLITE shows a similar pattern but with lower negative deviations, whereas at MAFR it shows a greater overlap with wavelengths lower than 704.1 nm and overestimation towards the near infrared part of the spectrum (Figures 9B, C).
3.2.3 Validation results
Figure 10 compares the validation results of both AC processors with the metrics computed for each wavelength and site.
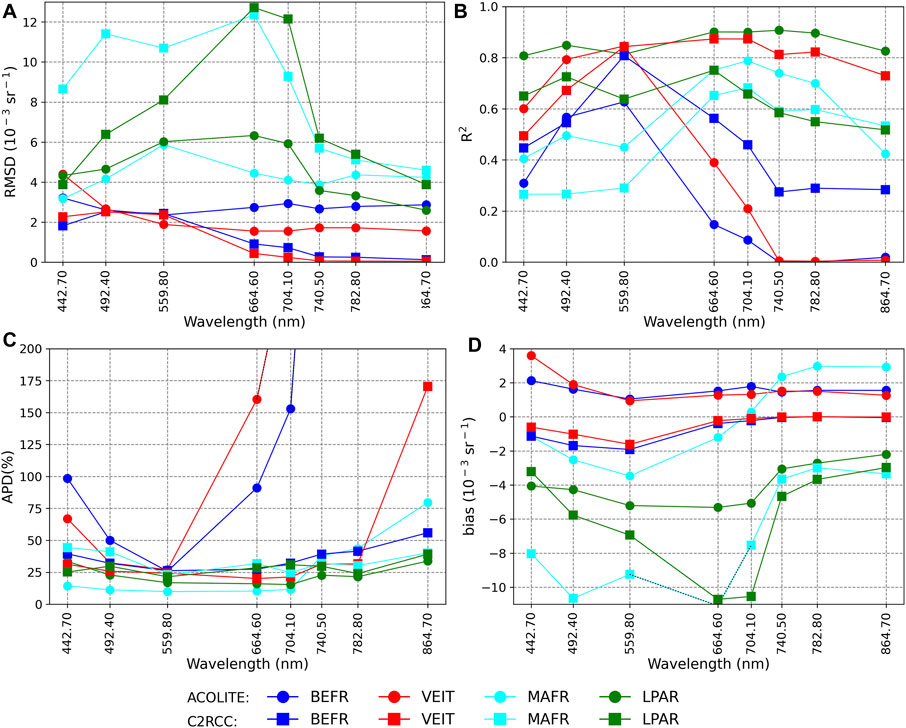
Figure 10. Spectral variation of the validation metrics computed for each site from the Sentinel-2 ACOLITE and C2RCC match-ups with HYPSTAR® L2 in situ data. (A) RMSD (in Rrs units: sr−1). (B) Determination coefficient (R2). (C) Absolute percentage difference (in percentage). (D) Bias (in Rrs units: sr−1).
In case of VEIT and BEFR, C2RCC outperforms ACOLITE considering almost all the metrics and wavelengths (Figure 10), although ACOLITE shows higher R2 values in the 442.7–559.8 spectral range (Figure 10B). As also observed in Figure 9, there is a difference in the bias sign: ACOLITE tends to overestimate the in situ Rrs (positive bias) whereas C2RCC shows a negative bias nearer zero (Figure 10D). C2RCC follows a similar pattern in both sites with comparable values in terms of RMSD, bias and APD (except for the highest APD at 864.7 nm at VEIT, Figure 10), although the R2 values are higher at VEIT for all the wavelengths (Figure 10B). The main limit of ACOLITE performance at these two sites is the Rrs retrieval in the red and infrared spectral range (wavelengths >664.6 nm), leading to extreme APD values (up to 2000%, Figure 10C).
On the contrary, ACOLITE shows better results than C2RCC at LPAR and MAFR considering almost all the metrics and wavelengths (Figure 10). The main issue of C2RCC at these sites is the high negative bias (Figures 9C, D) despite of the relatively good correlation results observed specially at MAFR (Figure 10B). Regarding ACOLITE, it shows comparable results in terms of error (RMSD and APD, Figures 10A, C) at both sites and higher R2 values at LPAR (Figure 10B). The ACOLITE bias values are negative at LPAR for all the wavelengths (Figures 9D, 10D), whereas the bias goes from negative to positive values with increasingly wavelengths at MAFR (Figures 9C, 10D).
As with Sentinel-3 OLCI WFR, the higher RMSD magnitudes at LPAR and MAFR are caused by the higher Rrs range (Figure 10A) while the APD values for C2RCC were comparable to VEIT and BEFR as this metric isn’t sensitive to the signal intensity.
Figure 11 shows the scatter plots of Rrs match-ups between ACOLITE and in situ Rrs for each wavelength grouped by site. The best results were achieved in the central bands between 559.8 nm and 704.1 nm, with R2 values around 0.95 and bias lower than 1.0 10−3 sr−1. On the contrary, higher dispersion and worse results were attained at 442.7 and 864.7 nm, whereas the remaining bands were found in between with correlation coefficients around 0.78. The scatter plots confirm the overall good results at LPAR and MAFR, with most of the data points around the identity line, whereas bad results are observed at VEIT and BEFR with wavelengths greater than 740.5 nm.
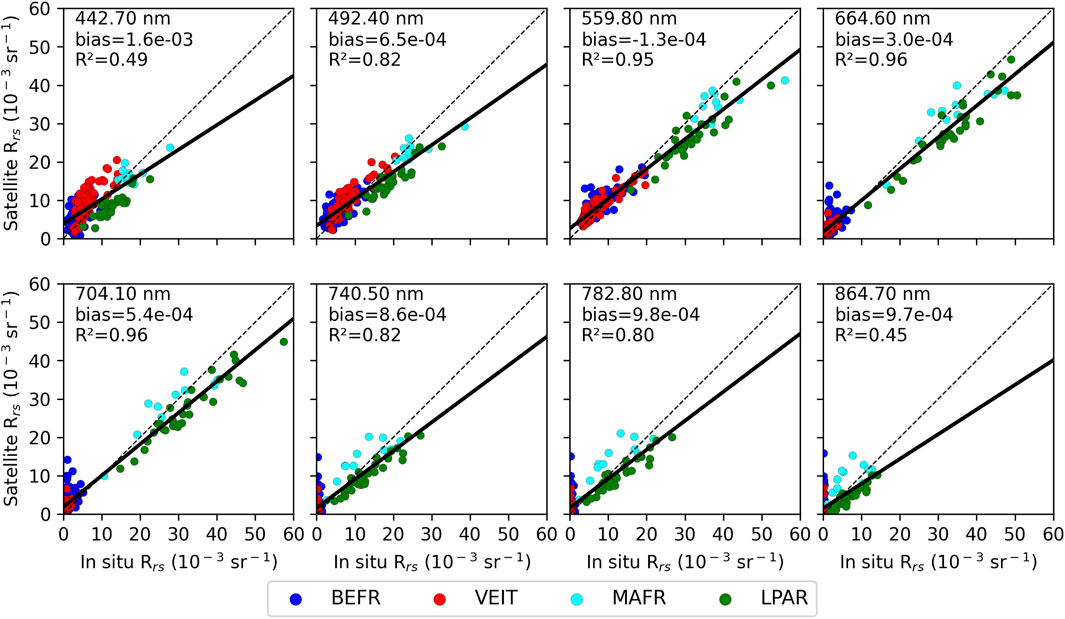
Figure 11. Scatter plot of Rrs match-ups between satellite (Sentinel-2 ACOLITE) and in situ (HYPSTAR® L2) measurements for each MSI band. Data points are coloured by site. Statistics are computed including the four sites.
Figure 12 presents the scatter plots of match-ups between C2RCC and in situ Rrs. The best results in terms of correlation were achieved with wavelengths between 559.8 nm and 704.1 nm (R2 > 0.95). However, increase negative deviations of the regression line with respect to the identity line were observed with increasing wavelengths, which are mainly caused by the bad results (with a clear underestimation) at LPAR and MAFR.
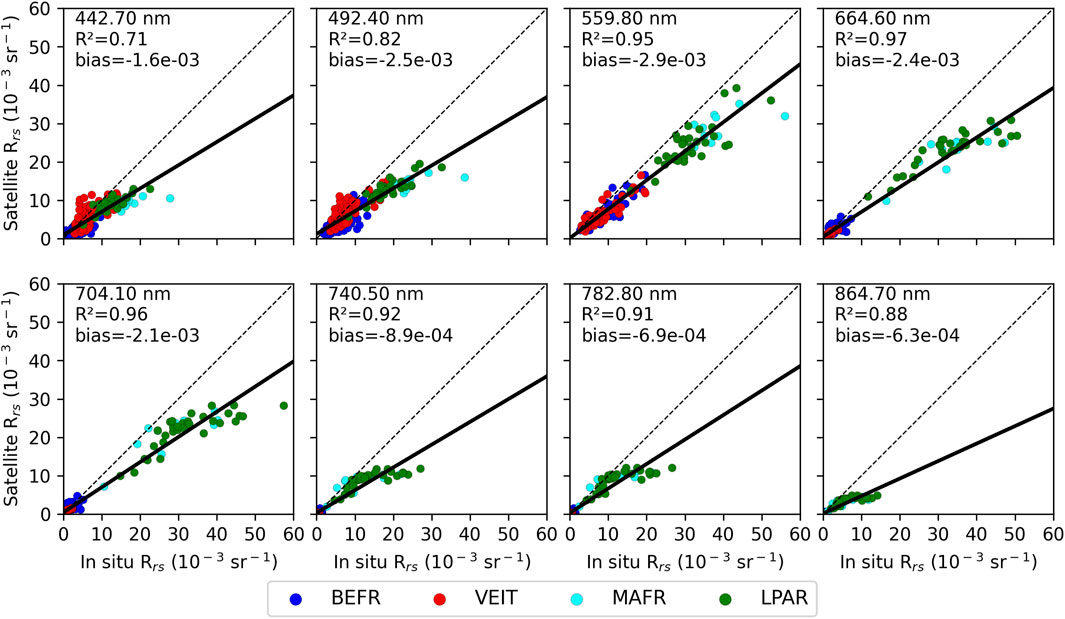
Figure 12. Scatter plot of Rrs match-ups between satellite (Sentinel-2 C2RCC) and in situ (HYPSTAR® L2) measurements for each wavelength. Data points are coloured by site. Statistics are computed including the four sites.
4 Discussion
The MDB-based approach presented in this work has proven to be a useful tool for the implementation of satellite validation analysis based on in situ reference data. The main strong points are: 1) it is an open-source approach open to the community; 2) it provides a common format facilitating the sharing of match-up data and validation results; 3) it allows users to adapt different validation protocols; and 4) it is suitable to perform automated analysis and compare results from different missions, atmospheric correction processors and/or sites. This approach requires both satellite and in situ reference data as input.
Regarding satellite data, they should be provided as single NetCDF extract files for each site, satellite sensor and AC processor. Different tools have already been implemented for the generation of these extract files. For instance, the methodology was adapted for a round-robin comparison of four AC algorithms for Sentinel-3 in the Baltic Sea (González Vilas et al., 2024), and for the validation exercises required for the implementation of new level-3 CMEMS datasets. In case of satellite products without a specific extract tool available in the code, users could also provide their own extract files, which should follow the format requirements (see Section 2.2.1).
Regarding the in situ reference data, the MDB-based approach was first implemented in the framework of HYPERNETS project to work with HYPSTAR® data. Moreover, it has already been adapted to use Rrs data from multispectral instruments collected at fixed platforms, such as AERONET-OC/SeaPRISM, and from shipborne hyperspectral radiometers (González Vilas et al., 2024). In addition to radiometric data, the approach has also been implemented for the validation of chlorophyll-a concentration (González Vilas et al., 2024). Users could also provide their own in situ data (radiometry or bio-geochemical parameters) by using the csv format.
The MDB-based approach mainly aimed at the systematic collection of match-up data to evaluate the quality of satellite products. In this work, examples of multi-site comparison were performed for Sentinel-3 OLCI and Sentinel-2 MSI as these sensors are representative of different spatial, spectral and temporal resolutions, although the methodology could be adapted to other sensors and/or processors.
In case of Sentinel-3 OLCI WFR product, the average percentage of valid match-ups reached 30% with more than 15 match-ups obtained in some months and sites. The comparison across sites with different optical properties enabled an evaluation of the sensor performance over a rather extended reflectance range with values greater than 0.0001 10−3 sr−1 and up to 50 10−3 sr−1. The satellite and in situ spectra showed similar spectral shapes at all the sites (except for GAIT), but the satellite product tends to underestimate the in situ Rrs with a negative deviation across the spectra and a higher overlap towards the red. The comparison between Sentinel-3A and Sentinel-3B (results not shown in this work, see Ruddick et al., 2024) yielded a similar number of match-ups for both platforms and showed that values of the uncertainty metrics were practically identical.
Moreover, Sentinel-3 OLCI WFR validation results at VEIT were consistent with the comparison based on AERONET-OC/SeaPRISM multispectral data for optically complex waters performed by Zibordi et al., 2022. They limit their analysis to the 400–665 nm spectral range and used data from four sites, including Acqua Alta Oceanographic Tower (AAOT), which is located in the same platform as the HYPSTAR® instrument at VEIT. Their metrics follow a similar spectral pattern as observed in Figure 6. For instance, the correlation coefficient (R2) shows lower values in the 400–442.5 nm spectral range and higher values between 490 nm and 665 nm, whereas the APD follows a U-shape pattern with higher values between 400 nm and 442.5 nm and between 620 nm and 665 nm but lower values in the 490–560 nm spectral range. In absolute terms, their metrics are better but results are not directly comparable as they include four sites. A more detailed comparison between both instruments (HYPTAR® and SeaPRISM) located at the same platform is expected to be performed in future to verify the consistency of the measurements, similarly to the comparison between two SeaPRISM systems by Mélin et al., 2024.
Regarding Sentinel-2 MSI, we evaluated two atmospheric correction processors, i.e., ACOLITE and C2RCC, using data from four sites. Coverage was lower than using Sentinel-3 due to the difference in the revisit time (3–5 days against 1 day), although we were able to obtain up to 10 valid math-up in a single month (i.e., MAFR). Results evidence that the selection of the optimal processor depends on the optical regime of the sites, i.e., ACOLITE performed better in very turbid waters (LPAR, MAFR) while better results were attained using C2RCC at the other two sites (BEFR, VEIT). This is in agreement with findings in literature, while C2RCC is designed to handle optically complex waters (Brockman et al., 2016; Warren et al., 2019; Soriano-González et al., 2022), its effectiveness in highly turbid conditions might be limited (Katlane et al., 2023). At the opposite, ACOLITE is known to perform well in moderately and highly turbid waters (Maciel and Pedocchi, 2022; Renosh et al., 2020; Vanhellemont and Ruddick, 2016). Note that both processors were run using default parameters and results could hence be improved by applying specific options depending on the particular site characteristics (e.g., using the glint correction from the ACOLITE processor; Katlane et al., 2023; Tavares et al., 2021).
The application of hyperspectral instruments as HYPSTAR® for validation analysis provide some advantages as compared to multispectral data. Firstly, it enables to obtain results for bands that could be missing in case of multispectral instruments (e.g., 709 nm, 754 nm, and 885 nm in case of AERONET-OC). Secondly, it does not require the use of the band shifting procedure for estimating the in situ Rrs at a specific satellite wavelength, which could introduce some uncertainty (Mélin and Sclep, 2015). And finally, it enables the application of spectral response functions, which is especially useful in case of satellite sensors with a large band width as Sentinel-2 MSI. Note also that some WATERHYPERNET sites are located in very turbid waters (LPAR, MAFR, M1BE, see Table 1), showing a higher signal in the NIR bands (between 709 and 885 nm) facilitating the validation analysis in this spectral range.
Overall, as compared to other validation software available for OC validation, our approach is more generic and flexible and enable users to work with different satellite sensors and AC processors, as well as in situ sources. For instance, ThoMaS and SeaBASS are designed to use EUMETSAT Sentinel-3 OLCI and OB.DAAC Level-2 products as input, respectively. Hence, they could not be used for the multi-processor validation exercises as the one presented in this work for Sentinel-2 or the one for the Sentinel-3 OLCI in the Baltic Sea (González Vilas et al., 2024). Moreover, our tools also support validation from shipborne in situ measurements (González Vilas et al., 2024).
The main limitation of the proposed approach is that the download of the satellite sources and AC processing are not integrated in the software package, so that these tasks must be performed using external tools. Moreover, some features are not still incorporated, as BRDF correction or validation based on reference pixels to avoid perturbations at sub-pixel level and/or within the validation window (e.g., Vanhellemont, 2019b).
The set of tools presented in this work could also be useful for assessing the influence of different validation protocols on the results, as Concha et al. (2021) show that the number of the valid match-ups and metrics differ between methods. The most evident possibility is repeating the full analysis using different quality control options to compare the results. Moreover, two useful alternatives have also been implemented: one is the flag analysis (see Figures 3B, 8B) and the other one is the evaluation of the results by applying different values of a specific quality control parameter (Figure 13).
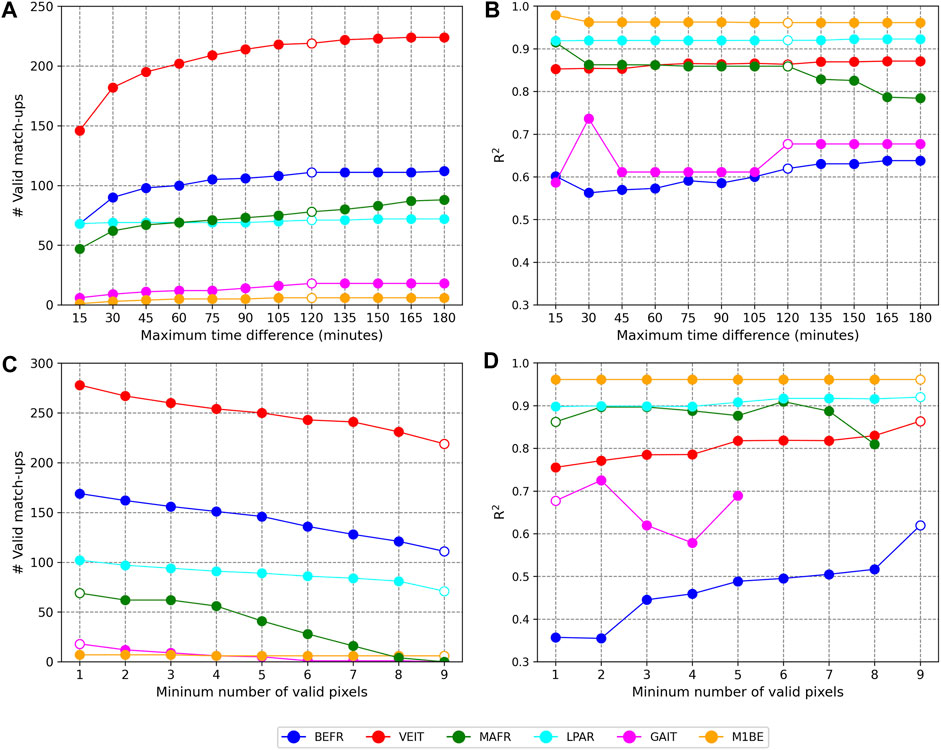
Figure 13. (A,B) Variation of the number of valid match-ups (A) and the correlation coefficient R2 (B) with the maximum time difference between the satellite and in situ acquisitions. (C,D) Variation of the number of valid match-ups (C) and the correlation coefficient R2 (D) with the minimum number of valid pixels in the extraction window. All the plots are based on the Sentinel-3 OLCI WFR validation protocols shown in Table 3, varying only the indicated parameter (maximum time difference or minimum number of valid pixels). The empty dots indicated the selected options for each site in the validation results presented in this work.
As an example, Figure 13 shows the variation of the number of valid match-ups and R2 using the Sentinel-3 OLCI WFR match-ups with: 1) the maximum time difference between the satellite and in situ measurements (Figures 13A, B), and 2) the minimum number of valid pixels in the satellite extract (Figures 13C, D). For each case, the remaining quality control options (Table 3) are kept fixed. Note also that R2 is reported for the match-ups for all the OLCI bands, although the analysis could also be implemented for other metrics or specific bands.
The valid match-ups are always based on the valid in situ measurement closest in time to the satellite overpass. HYPSTAR® measures each 10 min (MAFR), 15 min (VEIT), 20 min (LPAR and GAIT) or 30 min (BEFR or M1BE), and hence most of valid match-ups are expected to show a time difference between both acquisitions lower than 30 min. However, as valid spectra are not always available within this interval, the number of valid match-ups usually increases with the maximum time difference (Figure 13A). Validation metrics (as R2) also vary with the number of match-ups included in the analysis (Figure 13B).
The use of match-ups with a higher time difference is expected to introduce uncertainties in dynamic environments (Bailey and Werdell, 2006; Concha et al., 2021). In this work, a maximum time difference of two hours was selected to try to balance the number of valid match-ups and the quality of the validation results (Figures 13A, B). At LPAR, more than 95% of match-ups show a time difference lower than 15 min and R2 keeps almost constant. At BEFR, VEIT, and MAFR, around 80% of the valid match-ups were obtained with time differences lower than 30 min with an abrupt change between 15 and 30 min followed by a slower growth. At these sites, the global correlation keeps constant (or with a slight increase) after 30 min, with a decrease after the 120 min threshold only at MAFR. GAIT and M1BE show a lower number of valid match-ups as compared to the other sites because of the shorter deployment time, so that the time difference threshold enables to maximize the number of valid match-ups.
As the minimum number of valid pixels in the extraction window increases, the number of valid match-ups decreases but validation metrics are expected to improve, since higher uncertainties in the satellite measurement are expected when invalid (masked) pixels are present within the extraction window (Zibordi et al., 2009b; Concha et al., 2021). In this study, we selected the strict criterium of 9 valid pixels (i.e., not allowing invalid pixels in the 3 × 3 extraction window) at BEFR, VEIT, LPAR, and M1BE with the aim of obtaining the best possible validation results at the cost of a lower number of match-ups (Figures 13C, D). In terms of global correlation, the improvement is more evident at VEIT and mainly at BEFR (Figure 13D). On the contrary, we relaxed the criterium at MAFR and GAIT because these two sites are nearer to the coastline so that land masked pixels are always present in the extraction window. In fact, we opted for maximizing the number of valid match-ups requiring only one valid pixel (Figure 13C).
5 Conclusion
This work demonstrated the satellite validation analysis based on the MDB approach using the HYPSTAR® demonstration datasets acquired at six water sites collected during the deployment phase of the HYPERNETS project (February 2021–March 2023). The results of the matchup analyses were consistent with recent findings based on other in situ radiometric data proving that the data collected by the network of automated in situ measurements of hyperspectral water reflectance (WATERHYPERNET) are suitable to communicate conclusions about the quality of the satellite data streams to the corresponding agencies (e.g., ESA/EUMETSAT/Copernicus) and satisfying the multi-mission radiometric validation needs. At the time of writing, the WATERHYPERNET network includes six sites and is expected to continue to deliver publicly available data in the future (Ruddick et al., 2024, submitted in the current special issue).
The MDB-based approach for satellite validation analysis enables open science and repeatability as the generated NetCDF files containing the potential match-ups between satellite and in situ data can be shared with collaborators and manipulated consistently with the open-source Python modules to implement the validation protocols.
Furthermore, the open-source MDB-based approach is already being implemented as a standard for the validation of Copernicus Ocean Colour Thematic Assembly Centre (OCTAC) products using in situ reference data from different sources, including radiometric networks as WATERHYPERNET or AERONET-OC as well as ship-based measurements and it was adapted to also assess merged multi-sensor satellite data time series.
Data availability statement
The six HYPSTAR® demonstration datasets used in this study are publicly available on Zenodo: Brando et al. (2023a), Brando et al. (2023b), Dogliotti et al. (2023b), Doxaran and Corizzi (2023a), Doxaran and Corizzi (2023b), Goyens and Gammaru (2023). The 28 MDB files generated and analysed in this work are publicly available on Zenodo: González Vilas et al. (2024).
Author contributions
LG: Conceptualization, Data curation, Formal Analysis, Methodology, Software, Validation, Visualization, Writing–original draft. VB: Conceptualization, Data curation, Formal Analysis, Funding acquisition, Methodology, Validation, Writing–original draft. JC: Conceptualization, Methodology, Software, Writing–review and editing. CG: Data curation, Software, Writing–review and editing. AID: Funding acquisition, Writing–review and editing. DD: Funding acquisition, Writing–review and editing. AD: Data curation, Software, Writing–review and editing. DV: Data curation, Software, Writing–review and editing.
Funding
The author(s) declare financial support was received for the research, authorship, and/or publication of this article. This work has been performed in the context of the HYPERNETS project funded by the European Union’s Horizon 2020 research and innovation programme (Grant agreement no 775983), the HYPERNETS-POP project funded by the European Space Agency (contract no 4000139081/22/I-EF), the ArcticFlux TOSCA research project funded by the French Spatial Agency CNES and the ANPCyT PICT-2020/2636 project.
Acknowledgments
The MDB-based approach for satellite validation analysis presented in this work builds on open source codes developed by Ilaria Cazzaniga while she was working at EUMETSAT. The whole HYPERNETS Team is acknowledged for the development of the HYPSTAR® radiometer and its data processing, as well as for the installation and maintenance of the water sites. In particular, the installation and maintenance of the six sites was supported by: Alexander Corrizzi and local collaborators at GIPREB (BEFR); Mauro Bastianini, the skipper and crew of the AAOT and R/V Litus (VEIT); Estefania Piegari, Lucas Rubinstein, Pablo Perna, Escuela Naval Militar (LPAR); Alexander Corrizzi and local collaborators at Port de Bordeaux (MAFR), Claudia Giardino, Mariano Bresciani, Salvatore Mangano (GAIT); Anabel Gammaru, Benoot Broes from the Flemish Government, department Maritieme Dienstverlening en Kust for providing access and technical support to the platform (M1BE). EUMETSAT and ESA are acknowledged for the provision of the Copernicus Sentinel-3 Full Resolution and the Copernicus Sentinel-2 MSI data. The ESA Sentinel Application Platform and Sentinel tool-box development teams is thanked for making the SNAP software freely available. We are grateful to Vega Forneris and Flavio Lapadula for maintaining the satellite data processing and the satellite data archive at CNR-ISMAR. The authors would like to thank Adam Lawson for his information about SAVANT.
Conflict of interest
Author JC was employed by Serco S.p.A. c/o ESA-ESRIN.
All authors are likely to receive future research funding for WATERHYPERNET data acquisition and/or exploitation.
The authors declare that these interests do not affect the statements and findings of this paper, which has been written according to the normal scientific ethics and values of the academic community.
Publisher’s note
All claims expressed in this article are solely those of the authors and do not necessarily represent those of their affiliated organizations, or those of the publisher, the editors and the reviewers. Any product that may be evaluated in this article, or claim that may be made by its manufacturer, is not guaranteed or endorsed by the publisher.
Supplementary material
The Supplementary Material for this article can be found online at: https://www.frontiersin.org/articles/10.3389/frsen.2024.1330317/full#supplementary-material
References
Bailey, S. W., and Werdell, P. J. (2006). A multi-sensor approach for the on-orbit validation of ocean color satellite data products. Remote Sens. Environ. 102 (1-2), 12–23. doi:10.1016/j.rse.2006.01.015
Brando, V., González Vilas, L., Bresciani, M., Mangano, S., Concha, J. A., and Goyens, C. (2023b). Initial Sample of HYPERNETS hyperspectral water reflectance measurements for satellite validation at Lake Garda, GAIT site (Italy) (v1.2). Zenodo. doi:10.5281/zenodo.8057823
Brando, V. E., González Vilas, L., Concha, J. A., and Goyens, C. (2023a). Initial Sample of HYPERNETS hyperspectral water reflectance measurements for satellite validation from the VEIT site (Italy). Zenodo. doi:10.5281/zenodo.8057531
Brockmann, C., Doerffer, R., Peters, M., Stelzer, K., Embacher, S., and Ruescas, A. (2016). Evolution of the C2RCC neural network for Sentinel 2 and 3 for the retrieval of Ocean Colour products in normal and extreme optically complex waters” in proceedings of living planet symposium. Prague, Czech Republic: ESA-SP, 740.
Clark, D. K., Gordon, H. R., Voss, K. J., Ge, Y., Broenkow, W., and Trees, C. (1997). Validation of atmospheric correction over the oceans. J. Geophys. Res.-Atmos. 102, 17209–17217. doi:10.1029/96jd03345
Concha, J. A., Bracaglia, M., and Brando, V. E. (2021). Assessing the influence of different validation protocols on Ocean Colour match-up analyses. Remote Sens. Environ. 259, 112415. doi:10.1016/j.rse.2021.112415
De Vis, P., Goyens, C., Hunt, S., Vanhellemont, Q., Ruddick, K., and Bialek, A. (2024) Generating hyperspectral reference measurements for surface reflectance from the LANDHYPERNET and WATERHYPERNET networks. Front. Remote Sens. 5, 1347230. doi:10.3389/frsen.2024.1347230
Doerffer, R., and Schiller, H. (2007). The MERIS Case 2 water algorithm. Int. J. Remote Sens. 28, 517–535. doi:10.1080/01431160600821127
Dogliotti, A. I., Piegari, E., Rubinstein, L., and Perna, P. (2023). Initial Sample of HYPERNETS hyperspectral water reflectance measurements for satellite validation from the LPAR site (Argentina). Zenodo Dataset. doi:10.5281/zenodo.8057728
Doxaran, D., and Corizzi, A. (2023a). Initial Sample of HYPERNETS hyperspectral water reflectance measurements for satellite validation at Berre coastal lagoon, BEFR site (France). Zenodo Dataset. doi:10.5281/zenodo.8057777
Doxaran, D., and Corizzi, A. (2023b). Initial Sample of HYPERNETS hyperspectral water reflectance measurements for satellite validation at the mouth of the Gironde estuary, MAFR site (France). Zenodo Dataset. doi:10.5281/zenodo.8057789
EUMETSAT (2019). EUMETSAT OCDB user manual. Copyright 2019, Copernicus revision 763d8907. Available at: https://ocdb.readthedocs.io/en/latest/ocdb-MDB-user-manual.html (Accessed October 17, 2023).
EUMETSAT (2021). Sentinel-3 OLCI L2 report for baseline collection OL_L2M_003 - EUM/RSP/REP/21/1211386. Available at: https://www.eumetsat.int/media/47794 (Accessed October 17, 2023).
EUMETSAT (2022). Recommendations for sentinel-3 OLCI Ocean Colour product validations in comparison with in situ measurements – matchup protocols. Available at: https://www.eumetsat.int/media/44087 (Accessed October 17, 2023).
González Vilas, L., Brando, V. E., Di Cicco, A., Colella, S., D’Alimonte, D., Kajiyama, T., et al. (2024). Assessment of ocean color atmospheric correction methods and development of a regional ocean color operational dataset for the Baltic Sea based on Sentinel-3 OLCI. Front. Mar. Sci. 10, 1256990. doi:10.3389/fmars.2023.1256990
González Vilas, L., Brando, V., Concha, J. A., Goyens, C., Dogliotti, A. I., Doxaran, D., et al. (2024). Match-up Database (MDB) files for the validation of satellite water products from Sentinel-3 OLCI and Sentinel-2 MSI using the initial samples of HYPERNETS in situ data. Zenodo. doi:10.5281/zenodo.10721333
Gordon, H. R. (2021). Evolution of Ocean Color atmospheric correction: 1970–2005. Remote Sens. 13, 5051. doi:10.3390/rs13245051
Goyens, C., De Vis, P., and Hunt, S. E. (2021). Automated generation of hyperspectral fiducial reference measurements of water and land surface reflectance for the hypernets networks. Bruss. Belg., 7920–7923. doi:10.1109/IGARSS47720.2021.9553738
Goyens, C., and Gammaru, A. (2023). Initial Sample of HYPERNETS hyperspectral water reflectance measurements for satellite validation at the measurement tower MOW1. Zenodo, M1BE site. (Belgium) (v1.2) [Data set]. doi:10.5281/zenodo.8059881
Goyens, C., Lavigne, H., Dille, A., and Vervaeren, H. (2022). Using hyperspectral remote sensing to monitor water quality in drinking water reservoirs. Remote Sens. 14 (21), 5607. doi:10.3390/rs14215607
IOCCG (2012). “Mission requirements for future ocean-colour sensors,” in Reports of the international Ocean Colour coordinating group (IOCCG), No. 13. Editors C. R. McClain, and G. Meister (Canada: IOCCG).
Justice, C., Belward, A., Morisette, J., Lewis, P., Privette, J., and Baret, F. (2000). Developments in the 'validation' of satellite sensor products for the study of the land surface. Int. J. Remote Sens. 21 (17), 3383–3390. doi:10.1080/014311600750020000
Katlane, R., Doxaran, D., ElKilani, B., and Trabelsi, C. (2023). Remote sensing of turbidity in optically shallow waters using sentinel-2 MSI and PRISMA satellite data. PFG - J. Photogramm. Remote Sens. Geoinf. doi:10.1007/s41064-023-00257-9
Lawson, A., Bowers, J., Ladner, S., Crout, R., Wood, C., Arnone, R., et al. (2021). Analyzing satellite Ocean Color match-up protocols using the satellite validation navy tool (SAVANT) at MOBY and two AERONET-OC sites. Remote Sens. 14, 2673. doi:10.3390/rs13142673
Loew, A., Bell, W., Brocca, L., Bulgin, C. E., Burdanowitz, J., Calbetet, X., et al. (2017). Validation practices for satellite-based Earth observation data across communities. Rev. Geophys. 55, 779–817. doi:10.1002/2017RG000562
Maciel, F. P., and Pedocchi, F. (2022). Evaluation of ACOLITE atmospheric correction methods for Landsat-8 and Sentinel-2 in the Río de la Plata turbid coastal waters. Int. J. Remote Sens. 43 (1), 215–240. doi:10.1080/01431161.2021.2009149
Mélin, F., Cazzaniga, I., and Sciuto, P. (2024). Verification of uncertainty estimates of autonomous field measurements of marine reflectance using simultaneous observations. Front. Remote Sens. 4, 1295855. doi:10.3389/frsen.2023.1295855
Mélin, F., and Sclep, G. (2015). Band shifting for ocean color multi-spectral reflectance data. Opt. Express 23, 2262. doi:10.1364/OE.23.002262
Pahlevan, N., Mangin, A., Balasubramanian, S. V., Smith, B., Alikas, K., Arai, K., et al. (2021). ACIX-Aqua: a global assessment of atmospheric correction methods for Landsat-8 and Sentinel-2 over lakes, rivers, and coastal waters. Remote Sens. Environ. 258, 112366. doi:10.1016/j.rse.2021.112366
Renosh, P. R., Doxaran, D., Keukelaere, L. D., and Gossn, J. I. (2020). Evaluation of atmospheric correction algorithms for sentinel-2-MSI and sentinel-3-OLCI in highly turbid estuarine waters. Remote Sens. 12, 1285. doi:10.3390/rs12081285
Ruddick, K., Brando, V. E., Corizzi, A., Dogliotti, A., Doxaran, D., Goyens, C., et al. (2024). WATERHYPERNET: a prototype network of automated in situ measurements of hyperspectral water reflectance for satellite validation and water quality monitoring. Submitt. Front. Remote Sens.
Ruddick, K., De Cauwer, V., Park, Y., and Moore, G. (2024). Seaborne measurements of near infrared water-leaving reflectance: the similarity spectrum for turbid waters. Limnol. Oceanogr. 51 (2), 1167–1179. doi:10.4319/lo.2006.51.2.1167
Ruddick, K. G., Voss, K., Boss, E., Castagna, A., Frouin, R., Gilerson, A., et al. (2019). A review of protocols for fiducial reference measurements of water-leaving radiance for validation of satellite remote-sensing data over water. Remote Sens. 11, 2198. doi:10.3390/rs11192198
Soriano-González, J., Urrego, E. P., Sòria-Perpinyà, X., Angelats, E., Alcaraz, C., Delegido, J., et al. (2022). Towards the combination of C2RCC processors for improving water quality retrieval in Inland and Coastal Areas. Remote Sens. 14, 1124. doi:10.3390/rs14051124
Tavares, M. H., Lins, R. C., Harmel, T., Fragoso, C. R., Martínez, J. M., and Motta-Marques, D. (2021). Atmospheric and sunglint correction for retrieving chlorophyll-a in a productive tropical estuarine-lagoon system using Sentinel-2 MSI imagery. ISPRS J. Photogramm. Remote Sens. 174, 215–236. doi:10.1016/j.isprsjprs.2021.01.021
Van der Zande, D., Stelzer, K., Lebreton, C., Dille, A., Shevchuk, R., Santos, J., et al. (2022). Copernicus marine service, quality information document, ref: CMEMS-HR-OC-QUID-009-201to212. Available at: https://catalogue.marine.copernicus.eu/documents/QUID/CMEMS-HR-OC-QUID-009-201to212.pdf (Accessed October 26, 2023).
Vanhellemont, Q. (2019a). Adaptation of the dark spectrum fitting atmospheric correction for aquatic applications of the Landsat and Sentinel-2 archives. Remote Sens. Environ. 225, 175–192. doi:10.1016/j.rse.2019.03.010
Vanhellemont, Q. (2019b). Adaptation of the dark spectrum fitting atmospheric correction for aquatic applications of the Landsat and Sentinel-2 archives. Remote Sens. Environ. 225, 175–192. doi:10.1016/j.rse.2019.03.010
Vanhellemont, Q., and Ruddick, K. (2016). “ACOLITE for sentinel-2: aquatic applications of MSI imagery” in proceedings of the 2016 ESA living planet symposium, Prague. ESA Special Publication.
Vanhellemont, Q., and Ruddick, K. (2021). Atmospheric correction of Sentinel-3/OLCI data for mapping of suspended particulate matter and chlorophyll-a concentration in Belgian turbid coastal waters. Remote Sens. Environ. 256, 112284. doi:10.1016/j.rse.2021.112284
Warren, M. A., Simis, S. G., Martinez-Vicente, V., Poser, K., Bresciani, M., Alikas, K., et al. (2019). Assessment of atmospheric correction algorithms for the sentinel-2a multispectral imager over Coastal and Inland Waters. Remote Sens. Environ. 225, 267–289. doi:10.1016/j.rse.2019.03.018
Zibordi, G., Berthon, J.-F., Mélin, F., D'Alimonte, D., and Kaitala, S. (2009a). Validation of satellite ocean color primary products at optically complex coastal sites: northern Adriatic Sea, Northern Baltic Proper and Gulf of Finland. Remote Sens. Environ. 113 (12), 2574–2591. doi:10.1016/j.rse.2009.07.013
Zibordi, G., Holben, B., Slutsker, I., Giles, D., Dalimonte, D., Melin, F., et al. (2009b). AERONET-OC: a network for the validation of Ocean Color primary products. J. Atmos. Ocean. Technol. 26, 1634–1651. doi:10.1175/2009JTECHO654.1
Zibordi, G., Kwiatkowska, E., Mélin, F., Talone, M., Cazzaniga, I., Dessailly, D., et al. (2022). Assessment of OLCI-A and OLCI-B radiometric data products across European seas. Remote Sens. Environ. 272, 112911. doi:10.1016/j.rse.2022.112911
Keywords: ocean color, satellite validation, hyperspectral reflectance, Sentinel-3 OLCI, Sentinel-2 MSI, Match-up Database (MDB)
Citation: González Vilas L, Brando VE, Concha JA, Goyens C, Dogliotti AI, Doxaran D, Dille A and Van der Zande D (2024) Validation of satellite water products based on HYPERNETS in situ data using a Match-up Database (MDB) file structure. Front. Remote Sens. 5:1330317. doi: 10.3389/frsen.2024.1330317
Received: 30 October 2023; Accepted: 15 February 2024;
Published: 18 March 2024.
Edited by:
Enner Alcântara, São Paulo State University, BrazilReviewed by:
Yulong Guo, Henan Agricultural University, ChinaShun Bi, Helmholtz Association of German Research Centres (HZ), Germany
Copyright © 2024 González Vilas, Brando, Concha, Goyens, Dogliotti, Doxaran, Dille and Van der Zande. This is an open-access article distributed under the terms of the Creative Commons Attribution License (CC BY). The use, distribution or reproduction in other forums is permitted, provided the original author(s) and the copyright owner(s) are credited and that the original publication in this journal is cited, in accordance with accepted academic practice. No use, distribution or reproduction is permitted which does not comply with these terms.
*Correspondence: Luis González Vilas, bHVpcy5nb256YWxlenZpbGFzQGFydG92LmlzbWFyLmNuci5pdA==