 Jean-Pierre Wigneron1*
 Philippe Ciais2
 Xiaojun Li1Martin Brandt3
 Josep G. Canadell4
 Feng Tian5
 Huan Wang6
 Ana Bastos7
 Lei Fan8
 Gabriel Gatica9
 Rahul Kashyap10
 Xiangzhuo Liu1Stephen Sitch11
 Shengli Tao12
 Xiangming Xiao13Hui Yang14
 Jhan Carlo Espinoza Villar15
 Frederic Frappart1
 Wei Li16
 Yuanwei Qin13
 Aurélien De Truchis17Rasmus Fensholt3
- 1ISPA, UMR 1391, INRAE Nouvelle-Aquitaine, INRAE Nouvelle-Aquitaine Bordeaux, INRAE Nouvelle Aquitaine Poitiers, Bordeaux Villenave d’Ornon, Paris, France
- 2Laboratoire des Sciences du Climat et de l’Environnement, LSCE/IPSL, CEA-CNRS-UVSQ, Université Paris-Saclay, Paris, France
- 3Department of Geosciences and Natural Resource Management, University of Copenhagen, Copenhagen, Denmark
- 4CSIRO Environment, Canberra, ACT, Australia
- 5Hubei Key Laboratory of Quantitative Remote Sensing of Land and Atmosphere, School of Remote Sensing and Information Engineering, Wuhan University, Wuhan, China
- 6College of Urban and Environmental Sciences, Key Laboratory for Earth Surface Processes of the Ministry of Education, Peking University, Beijing, China
- 7Department of Geography, Ludwig Maximilian University of Munich, Munich, Germany
- 8Chongqing Jinfo Mountain Karst, Ecosystem National Observation and Research Station, School of Geographical Sciences, Southwest University, Chongqing, China
- 9CONICET, Centro de Investigaciones de la Geósfera y la Biósfera (UE CONICET y Universidad Nacional de San Juan), San Juan, Argentina
- 10CORAL, Indian Institute of Technology Kharagpur, Kharagpur, India
- 11Faculty of Science, Economy and Environments, University of Exeter, Exeter, United Kingdom
- 12Institute of Ecology, College of Urban and Environmental Sciences and Key Laboratory for Earth Surface Processes of the Ministry of Education, Peking University, Beijing, China
- 13School of Biological Sciences, Center for Earth Observation and Modeling, University of Oklahoma, Norman, OK, United States
- 14Department of Biogeochemical Integration, Max Planck Institute for Biogeochemistry, Jena, Germany
- 15IGE, UGA - IGE, CS 40700, 38 058 Grenoble Cedex 9, Grenoble, France
- 16Department of Earth System Science, Ministry of Education Key Laboratory for Earth System Modeling, Institute for Global Change Studies, Tsinghua University, Beijing, China
- 17KAYRROS, Paris, France
Monitoring forest carbon (C) stocks is essential to better assess their role in the global carbon balance, and to better model and predict long-term trends and inter-annual variability in atmospheric CO2 concentrations. On a national scale, national forest inventories (NFIs) can provide estimates of forest carbon stocks, but these estimates are only available in certain countries, are limited by time lags due to periodic revisits, and cannot provide spatially continuous mapping of forests. In this context, remote sensing offers many advantages for monitoring above-ground biomass (AGB) on a global scale with good spatial (50–100 m) and temporal (annual) resolutions. Remote sensing has been used for several decades to monitor vegetation. However, traditional methods of monitoring AGB using optical or microwave sensors are affected by saturation effects for moderately or densely vegetated canopies, limiting their performance. Low-frequency passive microwave remote sensing is less affected by these saturation effects: saturation only occurs at AGB levels of around 400 t/ha at L-band (frequency of around 1.4 GHz). Despite its coarse spatial resolution of the order of 25 km × 25 km, this method based on the L-VOD (vegetation optical depth at L-band) index has recently established itself as an essential approach for monitoring annual variations in forest AGB on a continental scale. Thus, L-VOD has been applied to forest monitoring in many continents and biomes: in the tropics (especially in the Amazon and Congo basins), in boreal regions (Siberia, Canada), in Europe, China, Australia, etc. However, no reference study has yet been published to analyze L-VOD in detail in terms of capabilities, validation and results. This paper fills this gap by presenting the physical principles of L-VOD calculation, analyzing the performance of L-VOD for monitoring AGB and reviewing the main applications of L-VOD for tracking the carbon balance of global vegetation over the last decade (2010–2019).
1 Introduction
Considering only above- and below-ground biomass stocks, the annual changes in forest carbon (C) stocks have been estimated to be in the range of 0.5–2 GtC/yr (Harris et al., 2021; Yang et al., 2023) and they play an essential role in the global carbon cycle, accounting for a large proportion of the land carbon sink (∼2.5 GtC/yr) (Ahlström et al., 2015; Friedlingstein et al., 2022). The forest C stocks are stored in the vegetation (above and below ground), the soil, dead wood and litter, and according to a 2011 benchmark study, these pools account for about 860 GtC globally (Pan et al., 2011). Of this total, around 360 GtC (42%) are found in living biomass (above and below ground), and the remainder in a reservoir of non-living C represented by soil carbon with an almost equal amount (44%, considering a depth of ∼ 1 m), in the form of dead wood (9%), and litter (5%).
Considering only the living biomass (above and below ground), the largest part of the forest C stocks (out of the total of 360 GtC) is found in the tropics (70%, 260 GtC), of which about 40% (140 GtC) is in the Neotropics alone and 25% (93 GtC) if we consider only the above ground living biomass of the Amazon (Pan et al., 2011).
Annual changes in the forest C stocks (positive, corresponding to a C sink, or negative corresponding to a C source) play a key role in the long-term trends and interannual variability of the atmospheric CO2 concentrations (Ahlström et al., 2015; Fan et al., 2019; Yang et al., 2023), and thus in the global carbon cycle. Increasing the forest C stocks through forest restoration could help countries achieve their net-zero emission targets. However, forests are threatened globally because they are subject to many negative pressures: in the tropics due to high levels of deforestation and increased degradation from human exploitation (selective logging, human induced fires, edge effects, etc.), and drought, and in boreal and temperate forests due to harvest pressure (Ahlström et al., 2022), and to fires, insect attacks and drought-induced mortality. These environmental impacts are exacerbated by climate change, resulting in more frequent and intense extreme events such as droughts, heat waves, storms, floods, extreme fires, etc. (Bastos et al., 2020; Wang et al., 2023). Thus, this represents a vicious circle: increased degradation of forests due to the ongoing climate change and other human pressures lead to increased C emission in the atmosphere, further increasing the impact of climate change on forests.
It has been shown that the C biomass sink in the Amazon forest is declining due to stagnant productivity gains and increased mortality (Brienen et al., 2015). Hubau et al. (2020) confirmed that we have passed the peak-point in the carbon sink in tropical forests: the C sink in the Amazonian forests is declining rapidly, while that of Africa is only starting to decline (mortality in African tropical forests is lower than in the Amazon since ecosystems may be better adapted to drought). Similarly, a recent study has shown that the C sink in eastern Europe is declining mainly driven by changes in land use and land management, but also by increasing natural disturbances (Winkler et al., 2023). In the EU, the sink in forests has declined by 15% since 2015, with larger declines in some countries like France (−40%) and Czech Republic, which questions the neutrality goal of the EU that counted on a forest sink of 110 MtC y-1 in 2030 (Korosuo et al., 2023). In Siberia, forests seem to have a neutral carbon budget, with positive impacts of increased temperatures being offset by large declines in C stocks of living biomass due to fires (Fan et al., 2022). Currently, the largest C sink can be found in temperate and boreal regions (Yang et al., 2023), but the sustainability of these carbon sinks is still poorly understood (Winkler et al., 2023; Tong et al., 2020).
To develop an accurate monitoring system based on observations to track changes in forest C stocks is thus key for better evaluating their role in the global C budget, contribute to their protection, and track active reforestation and afforestation towards the national determined contributions under the Paris Agreement. National forest inventories (NFI) provide accurate estimates of the forest C stocks at a national scale in some countries, mainly in higher income countries. However, 1) such estimates require a large inventory infrastructure which is unavailable in most countries; 2) there is an inherent time lag and low temporal fidelity in these estimates as all inventory plots are revisited once every 5 years or longer intervals; 3) through interpolation methods based on spatial statistics, inventories can provide C stocks estimates at the scale of large regions, but cannot provide spatially continuous mapping of forests, which is required for forest management and monitoring of degradations (insect outbreaks, fires, impact of droughts, etc.). To address these issues, remote sensing appears to be a viable tool that can potentially provide annually resolved monitoring of aboveground biomass (AGB) with a good spatial resolution (50–100 m), globally.
The use of remote sensing for vegetation monitoring was incepted by the development of vegetation indices from optical observations such as the normalized difference vegetation index (NDVI) (Rouse et al., 1973; Tucker TJ, 1979). However, even though optical observations are very useful for monitoring various features of vegetation (cover fraction, productivity, water status, etc.), such observations are affected by saturation effects in the case of moderately or densely vegetated canopies, which reduces the accuracy of monitoring AGB. Microwave remote sensing is less affected by these saturation effects at relatively low frequencies (at P-, L-, C- and X-bands in the 0.4–15 GHz frequency range) and has emerged as an efficient tool for monitoring forest AGB. However, in the active microwave domain (Imhoff, 1995; Mermoz et al., 2015), the radar observations present saturation at relatively moderate levels of AGB (less than 100 t/ha at L-band). In the passive microwave domain, saturation appears only at higher AGB levels of about 400 t/ha at L-band (Wigneron et al., 2021). In spite of its coarse spatial resolution of about 25 km × 25 km, passive microwave technology, through the use of vegetation indices such as VOD (vegetation optical depth) has therefore recently emerged as a key approach for monitoring annual changes in forest AGB on a continental scale (Brandt et al., 2018a; Fan et al., 2019; Yang et al., 2023).
The use of standard approaches based on optical vegetation indices has limited capabilities for monitoring forest AGB, but optical data has a high potential for AGB monitoring through the use of specific and tailored approaches. Without being exhaustive, we cite here two methods demonstrating a well-documented accuracy. The first method consists of estimating forest height, which is a good proxy of forest AGB, from LIDAR (“light detection and ranging”) observations, an active optical technique targeting the forest with a laser and measuring the time for the reflected light to return to the receiver (the forest height is retrieved from the waveform of the reflected signal). LIDAR are used very actively from airborne systems and several spaceborne LIDAR sensors, including the recent Global Ecosystem Dynamics Investigation (GEDI) instrument launched in 2018 have been developed (Dubayah et al., 2020). The main limitation to the use of these sensors is that, due to the discontinuous sampling of observations, several years of operation are required before coverage of the world’s forest surface can be obtained. Moreover, forest height is highly related, but not equivalent, to forest AGB. The second method consists in retrieving AGB from the spatial patterns of high-resolution optical images (∼50 cm–10 m) using Machine Learning (ML) methods. Note that the ML method can also be applied to high-resolution SAR (synthetic aperture radar) data, alone or in combination with optical data. The very large datasets of vegetation features required for training the ML algorithms can be obtained from in situ measurements, manual detection directly in the images (as annotations of tree crowns, Tucker et al., 2023) or from other spaceborne sensors (as forest height from GEDI, Schwartz et al., 2023).
The development of these ML methods is relatively recent, and so far, they do not allow us to derive a global analysis of the carbon balance of vegetation. Therefore, to date, passive L-band microwave observations, through the L-VOD parameter, are one of the most appropriate ways to obtain a rapid assessment of changes in vegetation carbon stocks on a large scale. Considering the importance of the recent advances brought by L-VOD in the field of carbon cycle, we consider it timely to make a review presenting L-VOD, its capabilities and strengths, and the main results it has contributed to reveal. In addition, considering that the validation of L-VOD capability has never been analyzed in detail, this review will also include an evaluation part, highlighting the high consistency of the results obtained by L-VOD with results obtained by other reference methods. Since L-VOD observations have been available since the early 2010s, our results will cover the last decade (2010–2019).
2 Passive microwave remote sensing of vegetation
Passive microwave remote sensing (PMW) is used in several key operational applications in the monitoring of the atmosphere and of the ocean. “Operational” in this context means that these applications are critical for weather forecasting that requires continuous satellite observations. Over the land surface, PMW was mainly used to monitor the surface soil moisture at a depth varying from about 3 cm at L-band (1.4 GHz) to about 1 cm at C- and X-bands (frequency of about 5 and 10 GHz). The capability of microwaves to penetrate vegetation increases for decreasing frequencies. Hence, the lower the frequency, the higher the possibility to “see” through all components of the vegetation. For reasons of antenna size, the lowest frequency that can be reached by a PMW space sensor is 1.4 GHz (this band corresponds to a frequency band allocated to science, which means that the band is supposed to be protected from radio frequency interference (RFI) emitted by public or military activities).
PMW instruments have therefore been developed to monitor soil moisture at the frequency of 1.4 GHz (L-band, wavelength ∼20 cm). The first spaceborne instrument dedicated to monitor soil moisture routinely is SMOS (Soil Moisture and Ocean Salinity) launched by ESA (European Space Agency) at the end of 2009 (Kerr et al., 2010) and the second one is SMAP (Soil Moisture Active Passive), launched by NASA (National Aeronautics and Space Administration) in 2015 (Entekhabi et al., 2010); both instruments are still in operation.
In preparation for these two satellite missions, multiple experimental campaigns have been conducted, including both airborne radiometers or in situ observations, using microwave radiometers mounted on a truck or on a tower (Jackson et al., 1999). These studies mainly aimed at monitoring soil moisture (SM), but for this purpose, it was also necessary to correct for the soil roughness effects (not covered in this review) and vegetation effects, which are parameterized by VOD. More precisely, VOD is the variable used to parameterize the extinction effects that affect microwave radiation when they pass through a vegetation canopy. These effects include both the scattering effects (parameterized by the effective scattering albedo ω (Kurum, 2013)) and the absorption effects. The vegetation attenuation factor (γ) is defined as γ = exp (-VOD/cos (θ)), where θ represents the incidence angle of the observations, and is a key parameter in the radiative transfer (RT) equations. RT equations represent the different effects of absorption, scattering and reflection processes that occur within a vegetation media (note that in the RT equations, VOD is usually denoted as τ) (Wigneron et al., 2017; Wigneron et al., 2007; Frappart et al., 2020). Note that VOD can be calculated at different frequency bands, and that L-band VOD is known as L-VOD (as distinct from C-VOD and X-VOD, which correspond to C- and X-band VOD).
Early studies showed that L-VOD was well related to the vegetation water content (VWC, kg/m2), with an almost linear relationship (L-VOD = b. VWC, Jackson and Schmugge, 1991). The parameter b depends mainly on the canopy type and decreases during vegetation senescence (Wigneron et al., 2004). In these early studies (Jackson et al., 1999), the objective was solely to estimate SM. So, for operational monitoring of SM, L-VOD was estimated roughly from vegetation indices as NDVI or LAI (Leaf Area Index). Such an approach was used operationally by SMAP and changed only recently (Chaubell et al., 2020). Studies conducted by CNES (Centre National d’Etudes Spatiales) and then by ESA, targeted the development of an L-band instrument (SMOS) based on interferometry and allowing multi-angular measurements.
The capability of L-VOD for monitoring vegetation biomass was first shown during the whole crop cycle over soybean and wheat based on a 2-parameter retrieval method that consisted of retrieving simultaneously L-VOD and soil moisture from multi-angular L-band observations (Wigneron et al., 1993; 1995). These results were complemented by a theoretical analysis considering the potential multi-angular capabilities of the future SMOS instrument (Wigneron et al., 2000). The 2-P method assumed that the L-VOD parameter varies relatively slowly in time (being almost constant over a week), which was considered a reasonable assumption. The 2-P method represent two main features of interest:
(1) no need for rough estimate of L-VOD from optical indices, facilitating the retrieval process of SM and improving its accuracy;
(2) retrieved L-VOD could be by itself a key parameter of interest for monitoring vegetation.
Based on these experimental and theoretical analyses, the SMOS project was ultimately accepted as an Earth Explorer Mission and the satellite was launched in 2009 (Kerr et al., 2010). ESA developed official products based on a complex algorithm (Level 2 and 3), requiring optical vegetation indices (i.e., LAI) and modeled soil moisture as inputs (which seems to be a limitation, since SMOS was designed to monitor SM). An alternative algorithm (SMOS-IC, Fernandez-Moran et al., 2017) based on the original study of Wigneron et al. (2000) was coordinated by INRAE Bordeaux. This algorithm is much more simple and accurate and is furthermore independent of ancillary data. It is now used in most applications of SMOS L-VOD and soil moisture (Wigneron et al., 2021; Colliander et al., 2023). As the L-band penetrates deeper into the forest canopy than the C- and X-bands, L-VOD features a much less saturation effect, particularly in areas with dense forest canopies and high volumes of standing biomass (Brandt et al., 2018a) is thus more reliable for monitoring forest AGB temporal dynamics (Dou et al., 2023). So, in this review devoted to AGB monitoring, we will focus more on the L-VOD product, estimated at L-band, which is better suited to this purpose.
3 Estimating AGB from L-VOD
3.1 Main principles
Recent studies have shown the ability of L-VOD to monitor AGB changes at continental scales (Yang et al., 2022; 2023). Note that L-VOD is a relative vegetation index that should be calibrated based on reference AGB maps to obtain VOD-based AGB estimates. The value of L-VOD therefore lies in its ability to track changes in AGB, which are very difficult to assess using other remote sensing techniques, as mentioned in the introduction. In the following, we analyze in detail the link between L-VOD and AGB.
As noted above, L-VOD is related to the vegetation water content (VWC). The fresh vegetation biomass (Bf, kg/m2) includes both vegetation water (VWC, kg/m2) and dry biomass (Bs, kg/m2). To estimate dry biomass (Bs) from L-VOD, many formulations are possible, but here we express L-VOD as a function of the vegetation moisture content Mg = VWC/Bf (%, a parameter driving the vegetation dielectric constant (Ulaby and EI-Rayes, 1987)) and dry biomass Bs:
Some studies focus on monitoring biomass (Bs) from L-VOD while other studies are more interested in monitoring the vegetation water status through the parameters Mg or RWC (Relative Water Content = VWC/Bs) (Konings et al., 2019). In both cases it is necessary to decouple the effects of vegetation biomass (Bs) and water status (Mg or RWC).
We focus here on the L-VOD derived AGB estimates. The temporal changes in L-VOD are associated with some level of noise and a smoothing window (period T = 7, 15 or 30 days) is often applied before doing further analysis. L-VOD generally exhibits diurnal and seasonal changes, which can be related to changes in the moisture content of vegetation and AGB. To monitor AGB and decouple AGB from these “high frequency” temporal Mg changes, two assumptions are generally made:
(i) assuming the average of Mg is constant from year to year (excluding very dry years); in that case the average value of L-VOD is used as a proxy of AGB. The median value can also be used instead of mean, and provides similar results;
(ii) assuming the maximum value of Mg (during the wet period(s) of the year) is constant from year to year; the value of L-VOD during the wet period(s) is used as a proxy of AGB.
Assuming i) or ii), a spatial calibration between the L-VOD proxy (either the yearly average L-VOD or the L-VOD value associated with the wet period) and AGB is computed. Then, considering a space for time substitution, this spatial calibration is used to compute the L-VOD derived annual variations in AGB. The estimates of AGB can be then transformed into total live biomass carbon density (TBC), by first computing total live biomass (TB) using maps of the ratio between AGB and belowground biomass (BGB; TB = AGB + BGB) and applying a ratio of about 0.5 to convert into units of C (Spawn et al., 2020; Yang et al., 2023).
3.2 Uncertainties associated with the L-VOD derived AGB estimates
As noted above, the spatial relationship obtained between the yearly mean L-VOD and AGB is used, considering a space for time substitution, to monitor annual variations in AGB. Several studies (Brandt et al., 2018a; Fan et al., 2022) have found that the general relationship between the reference map and annual L-VOD is stable between individual years. Carbon net changes (increases and decreases) are generally computed by computing the difference in carbon stocks between years. Gross losses and gains are calculated by accumulating positive and negative changes between consecutive years. Gross changes are larger than net changes as losses and recovery occur in the same pixel/region over the study period. The balance between gross gain and gross loss equals the net changes (Brandt et al., 2018b).
As all the existing AGB maps needed to convert L-VOD into biomass contain uncertainties and bias, none can be considered as the “reference” AGB map (a true AGB map does not exist); so 1) the spatial gradients of AGB are derived from several AGB maps and 2) the temporal dynamics of AGB is derived exclusively from L-VOD (Yang et al., 2023).
The details of the calculation of the uncertainties associated with the L-VOD derived AGB were analyzed in Fan et al. (2019), Fan et al. (2022) and Yang et al. (2023) and we provide here only the main general results. The uncertainties associated with the estimates of AGB and AGB changes, includes 1) internal uncertainties associated with the L-VOD derived AGB estimates and 2) external uncertainties associated with the errors in the reference AGB maps used to calibrate the L-VOD/AGB relationships (approximated by differences between maps). Several sets of calibration parameters of the L-VOD/AGB spatial relationship are generally computed for different biomes or continents and for different reference AGB maps. The minima and maxima of AGB obtained from these various calibrations provide estimates of the uncertainty associated with the retrieved AGB estimates, which are related to external errors in the reference AGB maps. Fan et al. (2019) have shown that external uncertainties dominate over internal uncertainties and that by combining both of them, the total relative uncertainties associated with AGB and the AGB changes are on the order of 20%–30%. It should be noted that particular attention needs to be paid to merging VOD datasets calculated from different satellites, as found by Tao et al. (2023) when analyzing the VOD Climate Archive dataset (VODCA2). Another potential problem may be related to some form of latency in the L-VOD results. For example, a certain amount of water may still be present in the trunks of dead trees after fires or droughts, so that the decrease in living biomass can be detected with a certain latency (often a year or more) from the L-VOD.
3.3 Decoupling the effects of changes in AGB and vegetation moisture content
As presented above, L-VOD generally presents diurnal and seasonal changes which can be related to changes in the moisture content of vegetation (Mg, %). So, to strongly reduce these diurnal and seasonal effects, a proxy of AGB is generally computed from either: i) the yearly average (or median) value of VOD or ii) the maximum value of Mg during the wet period of the year.
For instance, Yang et al. (2023) considered that seasonal changes in vegetation moisture content should not be persistent in the long-term record, and the long-term trends in L-VOD data reflect mainly AGB changes, while the seasonal effects of water stress on L-VOD are filtered out. Moreover, the annual values of AGB are calculated using the monthly reconstructed long-term trend data from the wettest periods, considering that during the wettest periods, water content tends to be saturated and have less year-to-year variability. Of course, these assumptions have some limitations, as Mg could be impacted by negative interannual trends. However negative trends in Mg could correspond to drying trends which would impact vegetation through strong mortality rates that will finally impact AGB. A decrease in Mg due to repetitive droughts could eventually lead to a modification in the composition of tree species at the ecosystem level, with different levels of moisture content during the wet season. However, such ecosystem-level alterations will operate over longer time scales and these two assumptions seem to be quite reasonable in most cases as in a first approximation.
Two types of analyses have been developed to explore in more detail the validation of the two assumptions:
First, we analyzed whether L-VOD-derived AGB tracks changes in AGB well. Changes in AGB can be proxied by several types of parameters: forest loss in areas of high deforestation, areas burnt during specific large fires, vegetation cover in areas of low vegetation density, etc. A number of recent validation studies have provided highly consistent results on the ability of L-VOD to track changes in AGB and are presented in the next section (Brandt et al., 2018a; Brandt et al., 2019; Qin et al., 2021; Li et al., 2022a; Fan et al., 2022; Yang et al., 2023, etc.)
Second, the specific effects of the vegetation water status (either the vegetation moisture content Mg, or the relative water content RWC) on the trend of L-VOD derived AGB have been considered through the use of proxies. For instance, (Yang et al., 2022) used a vegetation index, the Normalized Difference Water Index (NDWI) which was developed to monitor the changes in the water content of vegetation surface (Gao, 1996) and soil moisture as proxies of the vegetation moisture status. Then, a simple linear model combining these two proxies (NDWI and SM) was calibrated to account for their effects of the seasonal variations in L-VOD. The simple linear model was applied to correct the L-VOD derived trends in AGB. Results showed that regardless whether this correction was considered or not, the L-VOD derived trends in AGB were very similar.
In other words, the vegetation moisture content has a clear impact on the diurnal and seasonal changes in AGB, but its effects on the long-term L-VOD derived AGB changes is negligible on the scale of a few decades.
3.4 Evaluation/validation of L-VOD derived AGB changes
As no global product and very few in situ datasets of VWC exist, the evaluation of the L-VOD products developed from different algorithms is challenging. Hence, there is not one unique way of performing validation, and instead a variety of validations for specific conditions can be conducted including conditions of low and medium vegetation density, dense vegetation or specific events/regions corresponding to deforested areas, burnt areas, etc. A non-exhaustive list of validation applied to the INRAE Bordeaux L-VOD products include analysis of spatial correlation and temporal correlation, distinguishing densely vegetated and low to medium densely vegetated areas (a summary is given in Table 1).
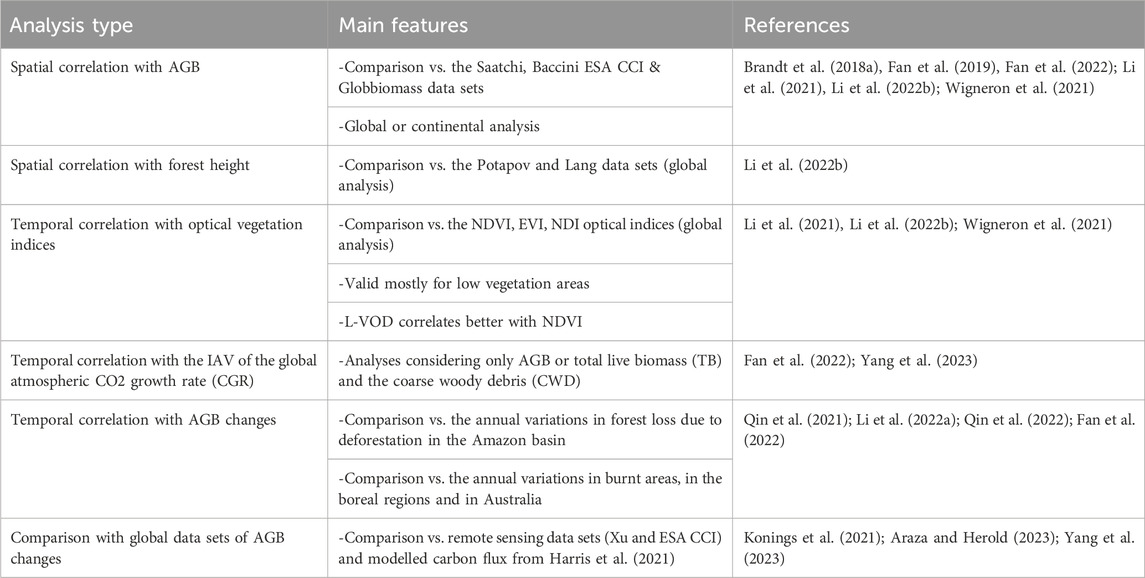
Table 1. Summary of the main L-VOD evaluation/validation studies.
3.4.1 Spatial correlation with AGB
As discussed above, the yearly mean or median of L-VOD generally shows a good and almost linear relationship with AGB up to levels of about 400 t/ha (Figure 1), while C- and X-VODs present obvious saturation at high AGB levels (Brandt et al., 2018a; Li et al., 2022ab). The spatial correlation is generally evaluated using global maps of AGB from reference studies (Saatchi, et al., 2011; Santoro et al., 2021) or using global maps of vegetation height (considered here as a proxy of AGB) as those from Potapov et al. (2021) and Lang et al. (2023), To this end it was found that the spatial correlation with L-VOD is generally better considering vegetation height than AGB (Li et al., 2022a; Li et al., 2022b).
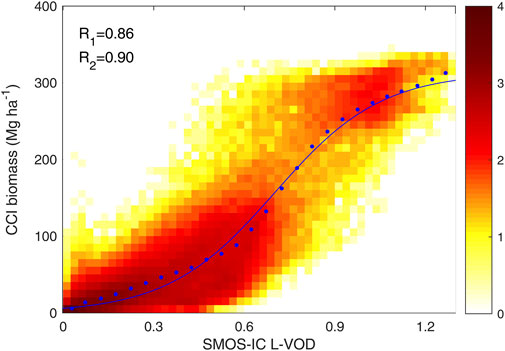
Figure 1. Density plot of the spatial relationship between SMOS-IC L-VOD and AGB (CCI biomass; Santoro and Cartus, 2019); R1 is the spatial correlation coefficient computed between L-VOD and CCI AGB, while R2 is that between L-VOD-predicted AGB using a fitted logistic function and CCI AGB (derived from Figure 6 of Wigneron et al. (2021)).
3.4.2 Temporal correlation with vegetation indices
In areas of low to medium vegetation density, vegetation optical indices and C-, X- and L-VOD correlate well spatially when used to monitor vegetation and are well related to AGB. So, in these regions, we also expect a good correlation between temporal changes in L-VOD and temporal changes in optical indices (NDVI, LAI, etc.) and C- and X-VOD (an illustration is given in Figure 2 for the correlation between L-VOD and NDVI). Maps of correlation, Hovmöller diagrams and intercomparisons of temporal changes at specific sites allow to evaluate the quality of the L-VOD product in monitoring the vegetation dynamics, including phenology (Li et al., 2021; Li et al., 2022b; Liu et al., 2023). Results showed that passive microwave SMOS L-VOD correlates better with NDVI (vs. LAI) while active ASCAT C-VOD correlates better with LAI (vs. NDVI). This result is in line with the fact that the active observations are more sensitive to the leafy structure of the vegetation canopy.
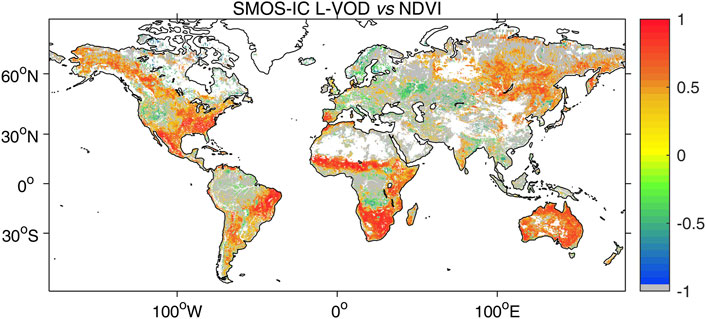
Figure 2. Correlation (R coefficient) of the temporal relationship between L-VOD and NDVI for SMOS-IC V2 L-VOD (Wigneron et al., 2021). Blank areas correspond to pixels filtered out with the scene flags and/or desert areas; gray areas to pixels where the correlation is not significant. Negative correlations found in Miombo are discussed in Tian et al. (2018). (Derived from Figure 4b of Wigneron et al. (2021)).
3.4.3 Temporal correlation with AGB changes
In regions with relatively homogeneous biomass density over large areas, the fraction of forest area is a good proxy of AGB. The annual variations in the L-VOD product can then be evaluated vs. the annual variations in forest loss as in Qin et al. (2021) and Li et al. (2022b). Several studies found a good match between the annual variations in L-VOD and those of forest loss due to deforestation in the Amazon basin; particularly in the arc of deforestation in Brazil (Qin et al., 2021; Li et al., 2022a) illustrated in Figure 3, or due to burnt areas, for instance in the boreal regions (Fan et al., 2022) or in Australia (Qin et al., 2022).
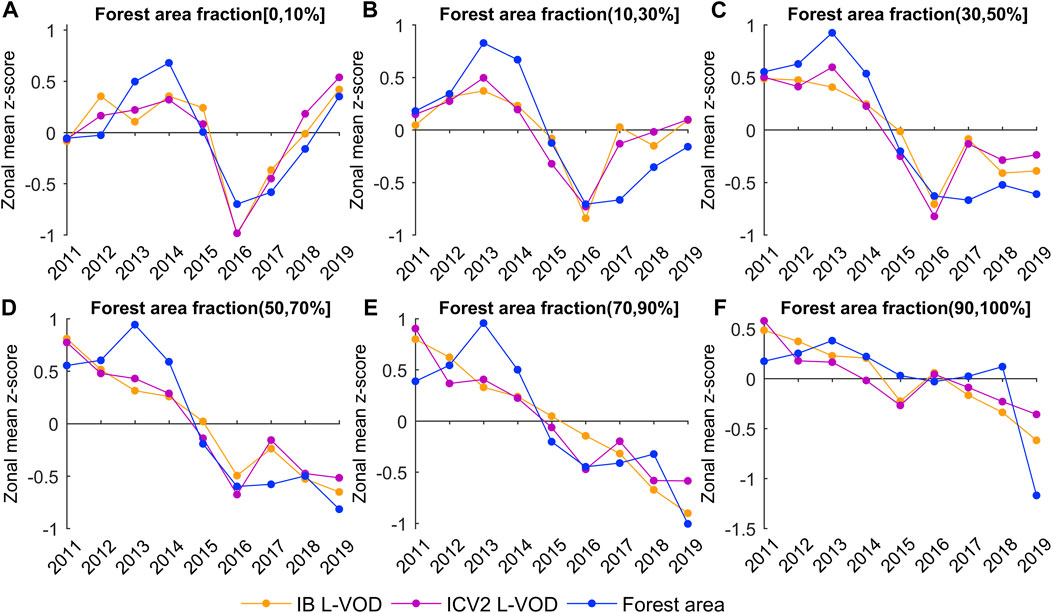
Figure 3. Evaluation of the L-VOD annual variations for the SMOS (ICV2 version) and SMAP (IB Version) (Li et al., 2022b) vs. forest loss as computed by Qin et al. (2021). The different plots (A–F) correspond to different fractions of forest areas (0–10%, 10–30%, 30–50%, 50–70%, 70–90% and 90–100%). (Derived from Figure 12 of Li et al., 2022b).
Very few in situ datasets are available for a large-scale evaluation of the L-VOD derived annual changes in AGB. However, such an evaluation has been made by Brandt et al. (2019) in the arid and semi-arid Ferlo region in northern Senegal. In the latter study, L-VOD showed a very good performance (r = 0.87) in monitoring annual changes in the measured woody plant foliage mass.
3.4.4 Temporal correlation of the interannual variability (IAV) in L-VOD-derived total live biomass with the fluctuations of the global atmospheric CO2 growth rate (CGR)
Changes in the global atmospheric CO2 concentration results from net biomass changes, soil CO2 respiration and ‘legacy’ CO2 emissions from decaying coarse woody debris (CWD) and litter pools, which are particularly important in the tropics (Yang et al., 2021). Accounting for all these effects, Yang et al. (2023) found that the IAV in carbon fluxes from live biomass and CWD pools estimated from L-VOD closely matched the CGR. It can be seen that the IAV in AGB based on L-VOD match better the IAV in the global carbon fluxes (PgC/yr) from the land surfaces to the atmosphere estimated from the global carbon budget (Friedlingstein et al., 2022) than the IAV of AGB based on Xu et al. (2022) (referred to as the Xu dataset in the following) (Figure 4). In particular, the large carbon loss anomaly in 2015, which is mainly due to severe drought and fires in European and tropical forests such as the Amazon caused by the El Niño event (Jiménez-Muñoz et al., 2016), is well observed from L-VOD but not from the Xu dataset.
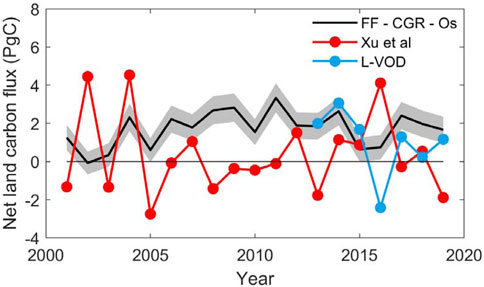
Figure 4. Comparison of the IAV in global carbon fluxes (PgC/yr) from the land surfaces to the atmosphere estimated from the global carbon budget (Friedlingstein et al., 2022) (fossil fuel (FF) - CO2 growth rate (CGR) - ocean sink from models (Os), and from satellite-based AGB retrievals based on L-VOD (Wigneron et al., 2021) and on the Xu dataset (Xu et al., 2022). The annual carbon fluxes derived from AGB data were calculated as the difference between two consecutive years.
All these evaluations led to very consistent results suggesting L-VOD as a reliable source of information for monitoring AGB dynamics. This is especially the case for those based on temporal AGB changes, which supports the value of L-VOD as a unique tool to monitor AGB dynamics.
3.4.5 Comparison with other studies evaluating annual AGB changes
Evaluating datasets monitoring AGB change is very difficult as shown by Araza et al. (2023). To our knowledge we can cite only two studies evaluating L-VOD derived annual AGB changes vs. other AGB change datasets: Konings et al. (2021) and Yang et al. (2023). Konings et al. (2021) highlighted the difficulty in monitoring changes in AGB from L-VOD. When analyzing the findings of Konings et al. (2021) in detail, we show that rather than casting doubt on L-VOD, this in fact helped to highlight the capacity of L-VOD to monitor AGB changes as compared to other products.
One of the main assumptions of the study by Konings et al. (2021) is that the biomass product from Xu et al. (2021) can be considered a robust reference product to monitor annual biomass changes during 2000–2019. A key point here, however, relates to the satellite data used to evaluate annual variations in biomass in the Xu data set. The Xu dataset is based on LIDAR data (including airborne and spaceborne Geoscience Laser Altimeter System (GLAS) onboard the Ice, Cloud, and land Elevation Satellite (ICESat), optical data (MODIS) and radar backscatter data from ALOS PALSAR (ALOS (Advance Land Observation Satellite, “DAICHI”); PALSAR (Phased Array L-band Synthetic Aperture Radar sensor)) and SeaWinds Scatterometer on QuikSCAT.
ALOS PALSAR at L-band is sensitive to low-density vegetation biomass (AGB <100 Mg/ha). Similarly, the QuikSCAT scatterometer operates at a frequency of 13.4 GHz and is strongly affected by saturation effects in forests. Moreover, the original QuikSCAT products have observations extending only from 2000 to 2009.
Due to the limitations in terms of temporal and spatial coverage by the LIDAR observations, it is likely that most of the spatio-temporal changes in AGB in the Xu dataset were evaluated from the three major satellite observations that have annual time series: MODIS Collection-6 Nadir BRDF-Adjusted Reflectance (NBAR) data, the day and night MODIS Land Surface Temperature (LST) data and the high-frequency QuikSCAT data. The latter optical and high-frequency radar observations quickly saturate in medium to dense forests. It seems that such a saturation can be observed in Figure 5 (from Yang et al., 2023), which compared the spatial patterns of changes during 2010–2019 in: a) L-VOD derived mean annual changes in total live biomass carbon density (TBC). b) Mean annual changes in total TBC from the Xu dataset and c) Total forest gross loss fraction from the Global Forest Change (GFC) Data (Hansen et al., 2013). Visual analysis of Figure 5 shows a very good agreement between the L-VOD derived TBC changes and the GFC dataset. This results from the fact, as discussed above, that the main changes in TBC in that region are due to deforestation, making forest area losses a good proxy of TBC changes (Cf Figure 3). Conversely, it seems the Xu dataset mostly shows greening trends in the arc of deforestation. This could be due to the fact the optical and high-frequency radar observations are more sensitive to rapid regrowth in low vegetation (herbaceous vegetation and shrubs) after deforestation, being insensitive to huge losses in forest AGB from widespread deforestation. Similar results were noted by Fan et al. (2022) in the Siberian forests after fires, where in spite of very large AGB losses due to fires, optical indices showed greening trends.
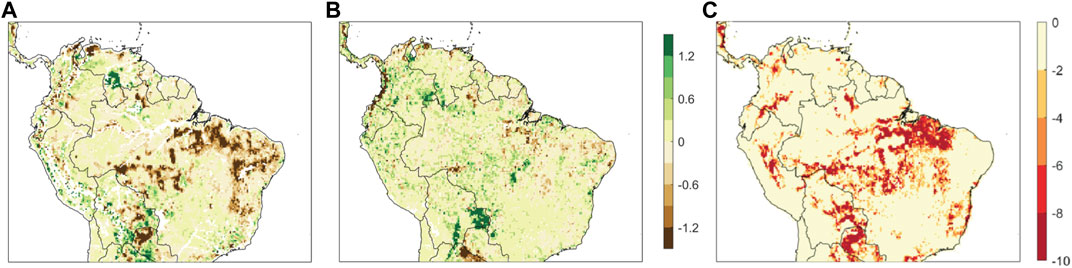
Figure 5. Comparison of the spatial patterns of the annual variations in several products over 2010–2019, in tropical South America: (A) L-VOD derived mean annual changes in total live biomass carbon density (B) Mean annual changes in total live biomass carbon density from the Xu dataset (Xu et al., 2021) (C) Total forest gross loss fraction over 2010–2019 using the Landsat-based Global Forest Change Data (Hansen et al., 2013). (Derived from Extended Figure 1 from Yang et al. (2023)).
In summary, the results of Konings et al. (2021) are based on the assumption that the Xu dataset is a true reference for the analysis of biomass changes. Our results show that this assumption seems to be quite questionable, weakening, at the very least, the results of Konings et al. (2021) that were used to question the link between annual changes in L-VOD and AGB.
4 Global carbon budget of the Earth’s vegetation
Even though L-VOD has been used in several analyses at continental scales over the last years, the first study that has analyzed the carbon budget of vegetation at a global scale was done only recently by Yang et al. (2023). This work included recent developments in the filtering of interferences (RFI) (in particular impacting derivation of L-VOD in areas of China) and in the seasonal changes of L-VOD, which are due to changes in the moisture content of vegetation.
The first map of the L-VOD derived estimates of the carbon sinks and sources of vegetation is shown in Figure 6.
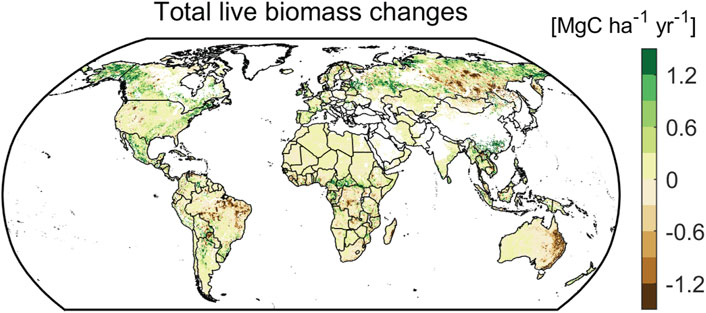
Figure 6. L-VOD derived mean changes in total living carbon stocks (TBC) (MgC/ha/yr) over 2010–2019. (Derived from Figure 1 from Yang et al. (2023)).
Yang et al. (2023) found that during the period 2010 to 2019, the global carbon stocks of vegetation increased at a rate of 0.50 ± 0.20 PgC yr−1 (mean ± s.d.; s.d. includes the uncertainty of the spatial calibration against different reference AGB maps and the uncertainty of the ratio between above-ground and total biomass). The main contributors to the global C sink are the boreal (+0.37 ± 0.12 PgC yr−1) and temperate (+0.13 ± 0.09 PgC yr−1) forests, while the wet tropical forests showed small carbon loss (−0.07 ± 0.02 PgC yr−1). The biomes in arid regions and the dry tropical forests were observed to be nearly carbon neutral (−0.02 ± 0.03 PgC yr−1 and −0.01 ± 0.007 PgC yr−1, respectively).
4.1 AGB dynamics in the tropics
The fact that the Brazilian Amazon rainforest is a source of carbon as a whole when considering AGB was revealed from L-VOD in the study by Qin et al. (2021) and losses were mainly attributed to forest degradation and deforestation, consistent with a study based on atmospheric measurements (Gatti et al., 2021). In particular, southern Amazonia is characterized by a lengthening of the dry season, warming trend and increasing forest fires (Fu et al., 2013; Jiménez-Muñoz et al., 2016; Espinoza et al., 2021). However, hydroclimatic changes in northern Amazonia are different, with opposite events, mainly characterized by an increase in wet episodes and extreme floods (Barichivich et al., 2018; Espinoza et al., 2022). Nevertheless, during some extreme droughts, such as the one in 2023, both the northern and southern Amazon experienced intense dryness and warmth (Espinoza et al., 2024).
In the tropical region of Africa, the Democratic Republic of Congo (DRC) also appeared as a large region of C losses, mainly due to deforestation and degradation (He et al., 2024; (Zhao et al., 2024), as in Brazil and southern Amazonia. Most of the undisturbed wet tropical forests are carbon sinks, which is in agreement with inventory data (Brienen et al., 2015). However, these undisturbed forests are generally very old (>140 years) and correspond to a very small sink. A few countries appeared as carbon sinks. Notably the Central African Republic, where the increase in C-stocks could be related to a relatively low pressure by domestic demand for wood resources, explained by a rather low population density and by the lasting political instability (civil war) that limited large-scale deforestation activities by domestic or foreign companies and caused a large emigration of the southern population out of the country (Wang et al., 2024). This C sink corresponds to one of the rare areas of greening trends in Africa found in Cortés et al. (2021) over 1981–2018. In the dry tropics, the negative effects of deforestation and agriculture on live biomass are almost completely offset by the positive effects of forestry and vegetation growth and regrowth (+0.08 PgC yr-1). Such biomass gain offset in dry forests may be associated with woody plant encroachment due to warmer and wetter conditions, changes in rainfall distribution as well as elevated CO2 concentration (Donohue et al., 2013; Venter et al., 2018; Brandt et al., 2019). In the Amazon-Cerrado transition zone where the agriculture frontier in Brazil is expanded, climate pressure was intensified, with more frequent dry and warm conditions related to changes in fire regime (Marengo et al., 2022).
In contrast with the tropics, large L-VOD derived biomass gains were found associated to net forest area gains and forestry activities (total biomass gains over ‘forestry’-classified areas sum up to +0.16 PgC yr-1 in boreal forests and +0.12 PgC yr-1 in temperate forests). These results are discussed in more detail in the two sections below.
4.2 AGB dynamics in the temperate and subtropical regions
In temperate and subtropical regions, several carbon sinks can be mainly illustrated by:
- The very large carbon sink in southern China (0.11 ± 0.05 PgC yr−1 during 2002–2017, Tong et al. (2020)), which can be related to massive forest management programs since 2000. These programs include protection of existing (old-growth) forests, recovery of deforested areas, forestation of croplands for conservation purpose, and development of industrial timber and paper production (Tong et al., 2020).
- Rubber plantations in mountainous Southeast Asia (for example, Cambodia and Indonesia) that resulted in net carbon sequestration (Guillaume et al., 2018).
- The very large C sink in the central part of western Russia and some eastern European countries (Belarus and Ukraine) can be related to forest expansion in areas of cropland abandonment that mainly occurred in the early 1990s after the fall of the Soviet Union. Though those abandoned lands had already sequestered considerable quantities of carbon before 2010, the vegetation continues to evolve into closed forests and land abandonment is still a major contributor to the eastern European carbon uptake during 2010–2019 (Winkler et al., 2023).
Other areas of pronounced carbon sinks are likely related to mixed land use changes and changes in climatic factors:
- A carbon sink can be observed in the eastern United States. The spatial pattern of this sink corresponds well to that found in analyses of greening trends (Zhu et al., 2016; Winkler et al., 2021) and was attributed by Zu et al. (2018) to land cover changes. In contrast to the western part of the United States, which mainly shows carbon losses in relation with a multi-year 2006–2015 mega-drought (Kogan and Guo, 2015), the spatial pattern of the carbon sink in the eastern United States seems to correspond well with that of increasing long-term precipitation trends (Crouch, 2017).
- A small carbon sink can also be found in the north-eastern part of Argentina. The spatial pattern of this C-sink corresponds well to the greening (increasing NDVI) trends found by Long et al. (2023) in the three main administrative regions (western Northwest, southwestern Pampas and Cuyo). In these regions, the increasing trends were found to be positively correlated to temperature, precipitation and incoming solar radiations. Results showed that climate change favored vegetation growth in western Northwest and Cuyo (where the greening trends could be mainly explained by the three climatic factors), while the greening trend in southwestern Pampas (mostly shrubland) could be mainly related to land use changes.
- A minor carbon sink can be noted in India and corresponds well to the increasing trends in both SM and L-VOD found by Bueso and Plies (2023), and to the greening trends found by Kashyap et al. (2022) and Kashyap et al. (2023) in the northern regions of India. However, only a small carbon sink can be linked to these greening trends. This can be explained by two main effects i) the carbon sinks in India are getting weaker due to climate change and anthropogenic activities during the recent decades as found by Kashyap et al. (2023) and ii) greening trends are largely due to cultivated land, which has a more limited impact than forests in terms of carbon accumulation. Increased greening of cropland can be attributed to improved irrigation facilities and more efficient cropland management (farm mechanization and use of nitrogen fertilizers), as analyzed by Kuttippurath and Kashyap (2023). So, in summary, despite being the second largest contributor to global greening, India is a weak carbon sink due to cropland-driven greening and browning of vegetation in regions of efficient carbon sinks.
4.3 AGB dynamics in the boreal regions
Greening trends, which can be related to warming effects, have been found in high latitudes. For instance, Piao et al. (2020) noted that warming increases vegetation greenness particularly in the boreal and Arctic regions by enhancing metabolism and extending the growing season. Dynamic Global Vegetation Model (DGVM) simulations show that the positive effects of climate change, primarily from warmer temperature, dominate the greening trend over more than 55% of the northern high latitudes and in the Tibetan Plateau.
However, strong C losses in very large areas of Siberia have also been observed. Siberian forests have been impacted by severe droughts and fire disturbances and compensation effects of springtime warming leading to summertime water stress (Buermann et al., 2018) that have strongly impacted their carbon dynamics. Over 2020–2019, Fan et al. (2022) found that the carbon balance of Siberian forests was close to neutral. Carbon storage in dead wood increased, but was largely offset by a decrease in live biomass attributed to fire and drought, such as the widespread fires in northern Siberia in 2012 and the extreme drought in eastern Siberia in 2015. These live above-ground carbon losses contrast with ‘greening’ trends generally seen from optical indices (LAI, NDVI) (Piao et al., 2020). This “greening” as observed from optical indices could be explained by the fast recovery after fires, which reflect strong regrowing by grasses and other early-succession plants, but does not involve a recovery in C stocks (Fan et al., 2019).
Carbon losses can also be found in central regions of Canada, which are strongly affected by stand-replacing disturbances (e.g., fires, logging and insect outbreaks (Yu et al., 2023)). Note that many pixels have to be masked out in those regions for issues in L-VOD data quality (mostly due to contamination by open water bodies), limiting the L-VOD coverage on the North American boreal forests. The results obtained in boreal regions agree well with the only two major browning patterns (one located in Siberia and one in central regions of Canada) found at the global scale by Cortés et al. (2021), from using median instead of mean of LAI, of an Advanced Very-High-Resolution Radiometer (AVHRR) LAI dataset. The interpretation of those browning effects by Cortés et al. (2021) is different from ours (stand-replacing disturbances): the authors suggested a reversal or stalled greening in high latitudes with increased plant growth in spring and earlier start of the growing season leading to decreased summer growth and decreased peak season maximum plant growth.
4.4 AGB dynamics in Australia
The carbon budget in Australia is impacted by land clearing and wildfires (Bueso and Plies, 2023; Villalobos et al., 2023). In particular, vast forest fires occurred in 2012 over the northern savannas and ranges of central and western Australia, and at the end of 2019 and early 2020 in the forest regions of eastern and south of the continent). While the 2012 fires resulted from excess grass biomass after a 2-year ENSO-La Nina event (wet conditions), the 2019–2020 fires resulted from a 3-year drought and record high temperatures in 2019. The forest regions of eastern Australia showed an AGB loss of 0.20 Pg C in 2019, which is ∼15% of the pre-fire AGB. However, rapid recovery in C stocks occurred (not shown here), resulting from the high resilience (high resprouting capacity) of trees to fire, especially eucalyptus species and rapid growth of the understory vegetation under the wet conditions of 2020 (Qin et al., 2022).
5 Summary and discussion
5.1 Summary
The global map of vegetation carbon sinks and sources can help elucidate the key driving mechanisms in the global land carbon budget. According to Bueso and Plies (2023), most of the carbon changes at large scales can be related to:
(1) land use and land cover change (LULCC), mostly related directly (e.g., deforestation and plantation) or indirectly (e.g., reforestation after crop abandonment) to anthropic activities:
(i) the large C sinks found in southern China related to very large forest management programs since 2000 (Tong et al., 2020); in rubber plantations in Southeast Asia; in Russia and eastern Europe due to persisting effects of agricultural abandonment after the fall of the Soviet Union (Winkler et al., 2023); in the Central Africa Republic from forest regrowth due to political instability.
(ii) the large C sources in the tropics are mostly related to deforestation and forest degradation in South America, in the arc of deforestation in Amazonia (Qin et al., 2021; Fawcett et al., 2022) and eastern regions of Brazil as well as in Africa, in the Congo basin (mostly in DRC), in Zambia, Madagascar, etc (Wigneron et al., 2020; He et al., 2024; Zhao et al., 2024).
(2) climatic events and trends, mostly through the impact of droughts and associated wildfires and increased temperatures. As for land use change, climate effects can be positive or negative and concern in particular:
(i) the large C sinks found in the boreal regions can be related to an increased growth period due to trends in increased temperature in the temperature-limited northern latitude regions (Piao et al., 2020) and in the eastern part of North America, it is possibly related to long-term trends in increased precipitation. To a lesser extent, the C-sink in central Africa (CAR, north of Cameroon, south of Sudan), in non-closed forests, could be related to woody plant encroachment (WPE), driven by a decline in burned areas along with warmer, and wetter climates (Venter et al., 2018). Similarly, Brandt et al. (2019) noted that changes in rainfall distribution have promoted woody biomass production in the Sahel. However, this change has still a very low impact in terms of C budget and does not appear on our map.
(ii) Droughts and extreme high temperatures lead to large carbon emissions from extreme fire and forest dieback. In addition, after dieback, insect attacks and diseases proliferate on weakened trees. These effects are at play in relation to the immense carbon losses observed in Siberian forests (Fan et al., 2022), in eastern Australia (Qin et al., 2022), and to a lesser extent in Canada (Yu et al., 2023). Temperate regions are also strongly affected by droughts. For instance, forest die-off in Sierra Nevada (California) was linked to multi-year deep soil drying in 2012–2015 (Goulden and Bales, 2019) and widespread carbon losses from bark-beetle attacks and wildfires (Hicke et al., 2013). Here, warm and wet conditions in the previous years led to unusually dense vegetation, which, in association with high temperatures accelerated water loss from evapotranspiration in 2012–2015 thereby intensifying the drought conditions and forest die-off.
As another example, ecosystem productivity in Central and northern Europe was affected by extreme drought and heat in 2018 (Bastos et al., 2020). As for the previous example in California, earlier favorable weather conditions contributed to the 2018 heat wave effects: spring conditions promoted increased vegetation growth, which, in turn, contributed to rapid soil moisture depletion, amplifying the summer drought. Similarly, the 2012 fires in Australia were favored by an excess of herbaceous biomass after a 2-year period of wet conditions.
These carbon losses in the western U.S. and Europe are not yet visible in our map, as it is likely they were offset by positive effects in other years (our results only present average trends over a decade); but these heat waves should be more frequent and more intense according to climate projections.
5.2 Threats and prospects
The global carbon budget analyzed here covers only the most recent decade. In the future, positive and negative effects could affect this budget, and we discuss below the main threats and prospects that can be associated with the future of this budget.
Concerning the first category of factors driving carbon changes (land use change), one of the main threats is the saturation of C sink: in some specific regions, forests are now well-developed and the intensity of biomass growth could weaken over the coming decades. For instance, in eastern Europe, Winkler et al. (2023) noted that forest growth saturation, land competition for food production and soil-water depletion challenge the longevity of this carbon sink service. The saturation effect of tree regrowth in abandoned agricultural areas, combined with increasing wood harvest removals, particularly in European Russia, already contributed to the decrease in the Eastern European carbon sink. Similarly, in China, Tong et al. (2020) noted possible soil water depletion and the limited availability of arable land challenge the longevity of the carbon sink service.
Concerning the second category of factors driving C changes (climate change), Piao et al. (2020) noted that the positive impact of anthropogenic warming on greenness appears to have weakened during the past 4 decades, suggesting a possible saturation of future greening in response to warmer temperatures. Moreover, the impact of droughts and extreme high temperatures is expected to intensify in the decades to come, and associated with wildfires, insect attacks, diseases and tree mortality, drought events will likely continue to drive large C losses in all continents.
In relation to future prospects, the primary source lies within the tropics, where the largest forest carbon stocks are found. Implementing enhanced protective measures and legislation in this region would yield substantial positive impacts on carbon stocks. In the temperate and boreal regions, better management methods could improve forest resistance and resilience to droughts: for example, by increasing biodiversity, selecting resistant species and developing selective logging, while reducing clear-cutting and by fire prevention.
5.3 Strength, limitation and perspective of L-VOD
One of the main limitations of the SMOS instrument is related to its sensitivity to interference (RFI), which strongly affects the retrieval of L-VOD and to a lesser extent on SM in some parts of the world. On that aspect, results obtained by the more recent L-band spaceborne instrument (SMAP), show that accurate filtering methods can be developed.
Another limitation raised by some scientists concerned temporal variations in vegetation water status, which could affect plant biomass trends derived from L-VOD. As presented in this study, recent results have shown that these effects are limited and can be corrected.
One of the main limitations of the L-VOD vegetation index is its coarse resolution (∼25 km). To overcome this problem, ongoing research focuses on developing disaggregation methods based on optical and radar observations, offering much higher spatial resolution capabilities, but limited by saturation in medium to dense forests. For example, in an initial step, L-VOD has been successfully used alongside other high-resolution remote sensing products to attribute changes to underlying processes acting at finer spatial scales, such as deforestation, degradation, mortality, fire, etc. (Fawcett et al., 2022).
Another way is the development of new space missions. Given the great potential of passive microwave observations, some space agencies (such as CNES, ESA and NASA) are examining the possibility of developing instruments with spatial resolutions in the order of 5–15 km. Several projects of spaceborne L-band instruments at higher spatial resolution are currently starting or are already under development. Such instruments could be based on real aperture (as for SMAP) or aperture synthesis (as for SMOS) antennas.
At NASA, recent scientific discussions (https://climatesciences.jpl.nasa.gov/events/20231010-workshop/index.html) have focused on the scientific benefits and applications of 10-km L-band radiometer observations, their synergistic use with higher frequency observations (6–37 GHz), and associated mission requirements. It was noted that passive microwave observations at L-band (1.4 GHz) have been a massive success in providing unique information about the Earth system since the launch of the ESA SMOS, NASA Aquarius and SMAP, and that the science derived from these missions has furthered understanding of geophysical processes in hydrology, oceanography, cryosphere, ecology, and atmosphere. Meanwhile, the state-of-the-art technology allows for the development of a next-generation mission that could make global daily L-band measurements at 10-km resolution. The project is still at an early stage.
In Europe, the multi-frequency ESA CIMR (Copernicus Imaging Microwave Radiometer) mission to be launched in the 2028 timeframe has a limited spatial resolution of about 55 km at L-band (Piles, 2021). However, the SAILIN (Sea-Air-Ice-Land Interactions) project coordinated by Dr. Estrella Olmedo, Institute of Marine Sciences in Barcelona, target accurate L-band measurements with an unprecedentedly fine spatial resolution of 15 km globally every 3 days based on a synthetic aperture imaging instrument.
We hope that these projects can be finalized and that the sensor can be launched before the possible failure of the SMOS (launched in late 2019) and/or SMAP (launched in 2015) instruments, in order to ensure the continuity of the L-VOD monitoring of the carbon balance of global vegetation. It will be very challenging, as it takes a long time to go from the initial stages to the launch of a space instrument (around 10 years for SMOS), but it can be done.
Author contributions
J-PW: Conceptualization, Supervision, Validation, Writing–original draft. PC: Writing–review and editing. XL: Writing–review and editing. MB: Writing–review and editing. JC: Writing–review and editing. FT: Writing–review and editing. HW: Writing–review and editing. AB: Writing–review and editing. LF: Writing–review and editing. GG: Writing–review and editing. RK: Writing–review and editing. XgL: Writing–review and editing. SS: Writing–review and editing. ST: Writing–review and editing. XX: Writing–review and editing. HY: Writing–review and editing. JE: Writing–review and editing. FF: Writing–review and editing. WL: Writing–review and editing. YQ: Writing–review and editing. ADT: Writing–review and editing. RF: Writing–review and editing.
Funding
The author(s) declare financial support was received for the research, authorship, and/or publication of this article. This work was supported by the Centre National des Etudes Spatiales (CNES), TOSCA programme, France
Conflict of interest
RF was employed by KAYRROS.
The remaining authors declare that the research was conducted in the absence of any commercial or financial relationships that could be construed as a potential conflict of interest.
The author(s) declared that they were an editorial board member of Frontiers, at the time of submission. This had no impact on the peer review process and the final decision.
The reviewer (HM) declared a shared affiliation with the author (J-PW) to the handling editor at the time of review.
Publisher’s note
All claims expressed in this article are solely those of the authors and do not necessarily represent those of their affiliated organizations, or those of the publisher, the editors and the reviewers. Any product that may be evaluated in this article, or claim that may be made by its manufacturer, is not guaranteed or endorsed by the publisher.
References
Ahlström, A., Canadell, J. G., and Metcalfe, D. B. (2022). Widespread unquantified conversion of old boreal forests to plantations. Earth’s Future 10, e2022EF003221. doi:10.1029/2022EF003221
Ahlström, A., Raupach, M. R., Schurgers, G., Smith, B., Arneth, A., Jung, M., et al. (2015). The dominant role of semi-arid ecosystems in the trend and variability of the land CO2 sink. Science 348, 895–899. doi:10.1126/science.aaa1668
Araza, A., Herold, M., de Bruin, S., Ciais, P., Gibbs, D. A., Harris, N., et al. (2023). Past decade above-ground biomass change comparisons from four multi-temporal global maps. Int. J. Appl. Earth Observation Geoinformation 118, 103274. doi:10.1016/j.jag.2023.103274
Barichivich, J., Gloor, E., Peylin, P., Brienen, R. J. W., Schöngart, J., Espinoza, J. C., et al. (2018). Recent intensification of Amazon flooding extremes driven by strengthened Walker circulation. Sci. Adv. 4, eaat8785. doi:10.1126/sciadv.aat8785
Bastos, A., Ciais, P., Friedlingstein, P., Sitch, S., Pongratz, J., Fan, L., et al. (2020). Direct and seasonal legacy effects of the 2018 heat wave and drought on European ecosystem productivity. Sci. Adv. 6, eaba2724. doi:10.1126/sciadv.aba2724
Brandt, M., Hiernaux, P., Rasmussen, K., Tucker, C. J., Wigneron, J.-P., Diouf, A., et al. (2019). Changes in rainfall distribution promote woody foliage production in the Sahel. Commun. Biol. 2, 133. doi:10.1038/s42003-019-0383-9
Brandt, M., Wigneron, J.-P., Chave, J., Tagesson, T., Penuelas, J., Ciais, P., et al. (2018a). Satellite passive microwaves reveal recent climate-induced carbon losses in African drylands. Nat. Ecol. Evol. 2, 827–835. doi:10.1038/s41559-018-0530-6
Brandt, M., Yue, Y., Wigneron, J.-P., Tong, X., Tian, F., Rudbeck Jepsen, M., et al. (2018b). Satellite-observed major greening and biomass increase in south China karst during recent decade. Earth’s Future 6, 1017–1028. doi:10.1029/2018ef000890
Brienen, R. J. W., Phillips, O. L., Feldpausch, T. R., Gloor, E., Baker, T. R., Lloyd, J., et al. (2015). Long-term decline of the Amazon carbon sink. Nature 519, 344–348. doi:10.1038/nature14283
Buermann, W., Forkel, M., O’Sullivan, M., Sitch, S., Friedlingstein, P., Haverd, V., et al. (2018). Widespread seasonal compensation effects of spring warming on northern plant productivity. Nature 562 (7725), 110–114. doi:10.1038/s41586-018-0555-7
Bueso, D., Piles, M., Ciais, P., Wigneron, J. P., Moreno-Martínez, Á., and Camps-Valls, G. (2023). Soil and vegetation water content identify the main terrestrial ecosystem changes. Natl. Sci. Rev. 10, nwad026. doi:10.1093/nsr/nwad026
Chaubell, M. J., Yueh, S. H., Dunbar, R. S., Colliander, A., Dunbar, R. S., Chen, F., et al. (2020). Improved SMAP DualChannel algorithm for the retrieval of soil moisture. IEEE Trans. Geosci. Remote Sens. 58 (6), 3894–3905. doi:10.1109/tgrs.2019.2959239
Colliander, A., Kerr, Y., Wigneron, J. P., Al-Yaari, A., Rodriguez-Fernandez, N., Li, X., et al. (2023). Performance of SMOS soil moisture products over core validation sites. IEEE Geoscience Remote Sens. Lett. 20, 1–5. doi:10.1109/LGRS.2023.3272878
Cortés, Jé., Mahecha, M. D., Reichstein, M., Myneni, R. B., Chen, C., and Brenning, A. (2021). Where are global vegetation greening and browning trends significant? Geophys. Res. Lett. 48, e2020GL091496. doi:10.1029/2020GL091496
Crouch, J. (2017). Mapping U.S. climate trends. Comments 14. Available at: https://www.climate.gov/news-features/blogs/beyond-data/mapping-us-climate-trends.
Donohue, R. J., Roderick, M. L., McVicar, T. R., and Farquhar, G. D. (2013). Impact of CO2 fertilization on maximum foliage cover across the globe’s warm, arid environments. Geophys. Res. Lett. 40, 3031–3035. doi:10.1002/grl.50563
Dou, Y., Tian, F., Wigneron, J.-P., Tagesson, T., Du, J., Brandt, M., et al. (2023). Reliability of using vegetation optical depth for estimating decadal and interannual carbon dynamics. Remote Sens. Environ. 285, 113390. doi:10.1016/j.rse.2022.113390
Dubayah, R., Blair, J. B., Goetz, S., Fatoyinbo, L., Hansen, M., Healey, S., et al. (2020). The global ecosystem dynamics investigation: high-resolution laser ranging of the earth’s forests and topography. Sci. Remote Sens. 1, 100002. doi:10.1016/j.srs.2020.100002
Entekhabi, D., Njoku, E. G., O’Neill, P. E., Kellogg, K. H., Crow, W. T., Edelstein, W. N., et al. (2010). The soil moisture active passive (SMAP) mission. Proc. IEEE 98, 704–716. doi:10.1109/jproc.2010.2043918
Espinoza, J. C., Arias, P. A., Moron, V., Junquas, C., Segura, H., Sierra-Perez, J., et al. (2021). Recent changes in the atmospheric circulation patterns during the dry-to-wet transition season in south tropical South America (1979-2020): impacts on precipitation and fire season. J. Clim., 1–56. doi:10.1175/JCLI-D-21-0303.1
Espinoza, J. C., Marengo, J. A., Schongart, J., and Jimenez, J. C. (2022). The new historical flood of 2021 in the Amazon River compared to major floods of the 21st century: atmospheric features in the context of the intensification of floods. Weather Clim. Extrem. 35, 100406. doi:10.1016/j.wace.2021.100406
Espinoza, J. C., Jimenez, J. C., Marengo, J. A., Schongart, J., Ronchail, J., Lavado-Casimiro, W., et al. (2024). The new record of drought and warmth in the Amazon in 2023 related to regional and global climatic features. Sci. Rep., 14, 8107. doi:10.1038/s41598-024-58782-5
Fan, L., Wigneron, J.-P., Ciais, P., Chave, J., Brandt, M., Fensholt, R., et al. (2019). Satellite observed pantropical carbon dynamics. Nat. Plants 5, 944–951. doi:10.1038/s41477-019-0478-9
Fan, L., Wigneron, J.-P., Ciais, P., Chave, J., Brandt, M., Sitch, S., et al. (2022). Siberian carbon sink reduced by forest disturbances. Nat. Geosc 16, 56–62. doi:10.1038/s41561-022-01087-x
Fawcett, D., Sitch, S., Ciais, P., Wigneron, J. P., Silva-Junior, C. H. L., Heinrich, V., et al. (2022). Declining Amazon biomass due to deforestation and subsequent degradation losses exceeding gains. Glob. Change Biol. 00, 1106–1118. doi:10.1111/gcb.16513
Fernandez-Moran, R. A., Al-Yaari, A., Mialon, A., Al Bitar, G., De Lannoy, N., Rodriguez-Fernandez, E., et al. (2017). SMOS-IC: An Alternative SMOS Soil Moisture and Vegetation Optical Depth Product. Remote Sens., 9, 457. doi:10.3390/rs9050457
Frappart, F., Wigneron, J.-P., Li, X., Liu, X., Al-Yaari, A., Fan, L., et al. (2020). Global monitoring of the vegetation dynamics from the vegetation optical depth (VOD): a review. Remote Sens. 12, 2915. doi:10.3390/rs12182915
Friedlingstein, P., O’Sullivan, M., Jones, M. W., Andrew, R. M., Gregor, L., Hauck, J., et al. (2022). Global carbon budget 2022. Earth Syst. Sci. Data 14, 4811–4900. doi:10.5194/essd-14-4811-2022
Fu, R., Yin, L., Li, W., Arias, P. A., Dickinson, R. E., Huang, L., et al. (2013). Increased dry season length over southern Amazonia in recent decades and its implication for future climate projection. Proc. Natl. Acad. Sci. 110 (45), 18110–18115. doi:10.1073/pnas.1302584110
Gao, B.-C. (1996). NDWI—a normalized difference water index for remote sensing of vegetation liquid water from space. Remote Sens. Environ. 58 (3), 257–266. doi:10.1016/S0034-4257(96)00067-3
Gatti, L. V., Basso, L. S., Miller, J. B., Gloor, M., Gatti Domingues, L., Cassol, H. L. G., et al. (2021). Amazonia as a carbon source linked to deforestation and climate change. Nature 595, 388–393. doi:10.1038/s41586-021-03629-6
Goulden, M. L., and Bales, R. C. (2019). California forest die-off linked to multi-year deep soil drying in 2012–2015 drought. Nat. Geosci. 12, 632–637. doi:10.1038/s41561-019-0388-5
Guillaume, T., Kotowska, M. M., Hertel, D., Knohl, A., Krashevska, V., Murtilaksono, K., et al. (2018). Carbon costs and benefits of Indonesian rainforest conversion to plantations. Nat. Commun. 9, 2388. doi:10.1038/s41467-018-04755-y
Hansen, M. C., Potapov, P. V., Moore, R., Hancher, M., Turubanova, S. A., Tyukavina, A., et al. (2013). High-resolution global maps of 21st-century forest cover change. Science 342, 850–853. doi:10.1126/science.1244693
Harris, N. L., Gibbs, D. A., Baccini, A., Birdsey, R. A., de Bruin, S., Farina, M., et al. (2021). Global maps of twenty-first century forest carbon fluxes. Nat. Clim. Chang. 11, 234–240. doi:10.1038/s41558-020-00976-6
He, J., Li, W., Zhao, Z., Zhu, L., Du, X., Xu, Y., et al. (2024). Recent advances and challenges in monitoring and modeling of disturbances in tropical moist forests. Front. Remote Sens. [Sec. Terrestrial Carbon Cycle], 5. doi:10.3389/frsen.2024.1332728
Hicke, J. A., Meddens, A. J. H., Allen, C. D., and Kolden, C. A. (2013). Carbon stocks of trees killed by bark beetles and wildfire in the western United States. Environ. Res. Lett. 8, 035032. doi:10.1088/1748-9326/8/3/035032
Hubau, W., Lewis, S. L., Phillips, O. L., Affum-Baffoe, K., Beeckman, H., Cuní-Sanchez, A., et al. (2020). Asynchronous carbon sink saturation in African and Amazonian tropical forests. Nature 579, 80–87. doi:10.1038/s41586-020-2035-0
Imhoff, M. L. (1995). Radar backscatter and biomass saturation: ramifications for global biomass inventory. IEEE Trans. Geoscience Remote Sens. 33 (2), 511–518. doi:10.1109/TGRS.1995.8746034
Jackson, T. J., Le Vine, D. M., Hsu, A. Y., Oldak, A., Starks, P. J., Swift, C. T., et al. (1999). Soil moisture mapping at regional scales using microwave radiometry: the Southern Great Plains Hydrology Experiment. IEEE Trans. Geoscience Remote Sens. 37, 2136–2151. doi:10.1109/36.789610
Jackson, T. J., and Schmugge, T. J. (1991). Vegetation effects on the microwave emission of soils. Remote Sens. Environ. 36, 203–212. doi:10.1016/0034-4257(91)90057-d
Jiménez-Muñoz, J. C., Mattar, C., Barichivich, J., SantamaríaArtigas, A., Takahashi, K., Malhi, Y., et al. (2016). Record-breaking warming and extreme drought in the Amazon rainforest during the course of El Niño 2015-2016. Sci. Rep. 6, 33130. doi:10.1038/srep33130
Kashyap, R., Kuttippurath, J., and Kumar, P. (2023). Browning of vegetation in efficient carbon sink regions of India during the past two decades is driven by climate change and anthropogenic intrusions. J. Environ. Manage 336, 117655. doi:10.1016/j.jenvman.2023.117655
Kashyap, R., Pandey, A. C., and Kuttippurath, J. (2022). Photosynthetic trends in India derived from remote sensing measurements during 2000–2019: vegetation dynamics and key climate drivers. Geocar. Intl. 37, 11813–11829. doi:10.1080/10106049.2022.2060325
Kerr, Y. H., Waldteufel, P., Wigneron, J. P., Delwart, S., Cabot, F., Boutin, J., et al. (2010). The SMOS mission: new tool for monitoring key elements of the global water cycle. Proc. IEEE 98 (5), 666–687. doi:10.1109/JPROC.2010.2043032
Kogan, F., and Guo, W. (2015). 2006–2015 mega-drought in the western USA and its monitoring from space data. Geomatics, Nat. Hazards Risk 6 (8), 651–668. doi:10.1080/19475705.2015.1079265
Konings, A. G., Holtzman, N. M., Rao, K., Xu, L., and Saatchi, S. S. (2021). Interannual variations of vegetation optical depth are due to both water stress and biomass changes. Geophys. Res. Lett. 48, e2021GL095267. doi:10.1029/2021GL095267
Konings, A. G., Rao, K., and Steele-Dunne, S. C. (2019). Macro to micro: microwave remote sensing of plant water content for physiology and ecology. New Phytol. 223, 1166–1172. doi:10.1111/nph.15808
Korosuo, A., Pilli, R., Abad Viñas, R., Blujdea, V. N. B., Colditz, R. R., Fiorese, G., et al. (2023). The role of forests in the EU climate policy: are we on the right track? Carbon Balance Manage 18, 15. doi:10.1186/s13021-023-00234-0
Kurum, M. (2013). Quantifying scattering albedo in microwave emission of vegetated terrain. Remote Sens. Environ. 129, 66–74. doi:10.1016/j.rse.2012.10.021
Kuttippurath, J., and Kashyap, R. (2023). Greening of India: forests or croplands? Appl. Geogr. 161, 103115. doi:10.1016/j.apgeog.2023.103115
Lang, N., Jetz, W., Schindler, K., and Wegner, J. D. (2023). A high-resolution canopy height model of the Earth. Nat. Ecol. Evol., 7, 1778–1789. doi:10.1038/s41559-023-02206-6
Li, X., Wigneron, J.-P., Fan, L., Frappart, F., Yueh, S. H., Colliander, A., et al. (2022a). A new SMAP soil moisture and vegetation optical depth product (SMAP-IB): algorithm, assessment and inter-comparison. Remote Sens. Environ. 271, 112921. doi:10.1016/j.rse.2022.112921
Li, X., Wigneron, J.-P., Frappart, F., Fan, L., Ciais, P., Fensholt, R., et al. (2021). Global-scale assessment and inter-comparison of recently developed/reprocessed microwave satellite vegetation optical depth products. Remote Sens. Env. 253, 112208. doi:10.1016/j.rse.2020.112208
Li, X., Wigneron, J.-P., Frappart, F., Lannoy, G. D., Fan, L., Zhao, T., et al. (2022b). The first global soil moisture and vegetation optical depth product retrieved from fused SMOS and SMAP L-band observations. Remote Sens. Environ. 282 (2022), 113272. doi:10.1016/j.rse.2022.113272
Liu, X., Wigneron, J.-P., Wagner, W., Frappart, F., Fan, L., Vreugdenhil, M., et al. (2023). A new global C-band vegetation optical depth product from ASCAT: description, evaluation, and inter-comparison. Remote Sens. Environ. 299, 113850. doi:10.1016/j.rse.2023.113850
Long, Q., Wang, F., Ge, W., Jiao, F., Han, J., Chen, H., et al. (2023). Temporal and spatial change in vegetation and its interaction with climate change in Argentina from 1982 to 2015. Remote Sens. 15, 1926. doi:10.3390/rs15071926
Marengo, J. A., Jimenez, J. C., Espinoza, J. C., Cunha, A. P., and Aragão, L. E. O. (2022). Increased climate pressure on the agricultural frontier in the Eastern Amazonia–Cerrado transition zone. Nat. Sci. Rep. 12, 457. doi:10.1038/s41598-021-04241-4
Mermoz, S., Réjou-Méchain, M., Villard, L., Le Toan, T., Rossi, V., and Gourlet-Fleury, S. (2015). Decrease of L-band SAR backscatter with biomass of dense forests. Remote Sens. Environ. 159, 307–317. doi:10.1016/j.rse.2014.12.019
Pan, Y. D., Birdsey, R. A., Fang, J., Houghton, R., Kauppi, P. E., Kurz, W. A., et al. (2011). A large and persistent carbon sink in the world’s forests. Sci., 333, 988–993. doi:10.1126/science.1201609
Piao, S., Wang, X., Park, T., Chen, C., Lian, X., He, Y., et al. (2020). Characteristics, drivers and feedbacks of global greening. Nat. Rev. Earth Environ. 1, 14–27. doi:10.1038/s43017-019-0001-x
Piles, M. (2021). The CIMR mission and its unique capabilities for soil moisture sensing. doi:10.5194/egusphere-egu21-9484
Potapov, P., Li, X., Hernandez-Serna, A., Tyukavina, A., Hansen, M. C., Kommareddy, A., et al. (2021). Mapping global forest canopy height through integration of GEDI and Landsat data. Remote Sens. of Environ. 253, 112165. doi:10.1016/j.rse.2020.112165
Qin, Y., Xiao, X., Wigneron, J.-P., Ciais, P., Brandt, M., Fan, L., et al. (2021). Carbon loss from forest degradation exceeds that from deforestation in the Brazilian Amazon. Nat. Clim. Change 11, 442–448. doi:10.1038/s41558-021-01026-5
Qin, Y., Xing, X., Wigneron, J.-P., Ciais, P., Canadell, J. G., Brandt, M., et al. (2022). Large loss and rapid recovery of vegetation cover and aboveground biomass over forest areas in Australia during 2019–2020. Remote Sens. Environ. 278, 113087. doi:10.1016/j.rse.2022.113087
Rouse, J. W., Haas, R. H., Schell, J. A., and Deering, D. W. (1973). “Monitoring vegetation systems in the great plains with ERTS,” in Third ERTS Symposium, NASA SP-351 I, 309–317.
Saatchi, S. S., Harris, N. L., Brown, S., Lefsky, M., Mitchard, E. T. A., Salas, W., et al. (2011). Benchmark map of forest carbon stocks in tropical regions across three continents. Proc. Natl. Acad. Sci. U. S. A. 108, 9899–9904. doi:10.1073/pnas.1019576108
Santoro, M., and Cartus, O. (2019). ESA Biomass Climate Change Initiative (Biomass_cci): global datasets of forest above-ground biomass for the year 2017, v1. Centre Environ. Data Analysis.
Santoro, M., Cartus, O., Carvalhais, N., Rozendaal, D. M. A., Avitabile, V., Araza, A., et al. (2021). The global forest above-ground biomass pool for 2010 estimated from high-resolution satellite observations. Earth Syst.Sci. Data 13, 3927–3950. doi:10.5194/essd-13-3927-2021
Schwartz, M., Ciais, P., De Truchis, A., Chave, J., Ottlé, C., Vega, C., et al. (2023). FORMS: Forest Multiple Source height, wood volume, and biomass maps in France at 10 to 30 m resolution based on Sentinel-1, Sentinel-2, and Global Ecosystem Dynamics Investigation (GEDI) data with a deep learning approach. Earth Syst. Sci. Data, 15, 4927–4945. doi:10.5194/essd-15-4927-2023
Spawn, S. A., Sullivan, C. C., Lark, T. J., and Gibbs, H. K. (2020). Harmonized global maps of above and belowground biomass carbon density in the year 2010. Sci. Data 7, 112. doi:10.1038/s41597-020-0444-4
Tao, S., Wigneron, J. P., Chave, J., Tang, Z., Wang, Z., Zhu, J., et al. (2023). Little evidence that Amazonian rainforests are approaching a tipping point. Nat. Clim. Chang. 13, 1317–1320. doi:10.1038/s41558-023-01853-8
Tian, F., Wigneron, J.-P., Ciais, P., Chave, J., Ogée, J., Peñuelas, J., et al. (2018). Coupling of ecosystem-scale plant water storage and leaf phenology observed by satellite. Nat. Ecol. Evol., 2, 1428–1435. doi:10.1038/s41559-018-0630-3
Tong, X., Brandt, M., Yue, Y., Ciais, P., Rudbeck Jepsen, M., Penuelas, J., et al. (2020). Forest management in southern China generates short term extensive carbon sequestration. Nat. Commun. 11, 129. doi:10.1038/s41467-019-13798-8
Tucker, C., Brandt, M., Hiernaux, P., Kariryaa, A., Rasmussen, K., Small, J., et al. (2023). Sub-continental-scale carbon stocks of individual trees in African drylands. Nature 615, 80–86. doi:10.1038/s41586-022-05653-6
Tucker, C. J. (1979). Red and photographic infrared linear combinations for monitoring vegetation. Remote Sens. Environ. 8 (2), 127–150. doi:10.1016/0034-4257(79)90013-0
Ulaby, F. T., and Ei-Rayes, M. A. (1987). Microwave dielectric spectrum of vegetation-Part II: dual-dispersion model. IEEE Trans. Geosci. Remote Sens. 25, 550–557. doi:10.1109/tgrs.1987.289833
Venter, Z. S., Cramer, M. D., and Hawkins, H. J. (2018). Drivers of woody plant encroachment over Africa. Nat. Commun. 9, 2272. doi:10.1038/s41467-018-04616-8
Villalobos, Y., Canadell, J. G., Keller, E. D., Briggs, P., Bukosa, B., Giltrap, D. L., et al. (2023). A comprehensive assessment of anthropogenic and natural sources and sinks of Australasia’s carbon budget. Glob. Biogeochem. Cycles 37. (in press). doi:10.1029/2023gb007845
Wang, F., Harindintwali, J.-D., Wei, K., Shan, Y., Mi, Z., Costello, M. J., et al. (2023). Climate change: strategies for mitigation and adaptation. Innovation Geoscience 1(1), 100015. doi:10.59717/j.xinn-geo.2023.100015
Wang, M., Philippe, C., Rasmus, F., Martin, B., Shengli, T., Wei, L., et al. (2024). Satellite observed aboveground carbon dynamics in Africa during 2003–2021. Remote Sens. of Environ., 301, 113927. doi:10.1016/j.rse.2023.113927
Wigneron, J. P., Chanzy, A., Calvet, J. C., and Bruguier, N. (1995). A simple algorithm to retrieve soil moisture and vegetation biomass using passive microwave measurements over crop fields. Remote Sens. Environ. 51, 331–341. doi:10.1016/0034-4257(94)00081-w
Wigneron, J.-P., Fan, L., Ciais, P., Bastos, A., Brandt, M., Chave, J., et al. (2020). Tropical forests did not recover from the strong 2015-2016 El Niño event. Sci. Adv. 6 (6), eaay4603. doi:10.1126/sciadv.aay4603
Wigneron, J.-P., Jackson, T. J., O’Neill, P., De Lannoy, G., de Rosnay, P., Walker, J. P., et al. (2017). Modelling the passive microwave signature from land surfaces: a review of recent results and application to the L-band SMOS & SMAP soil moisture retrieval algorithms. Remote Sens. Environ. 192, 238–262. doi:10.1016/j.rse.2017.01.024
Wigneron, J.-P., Kerr, Y., Waldteufel, P., Saleh, K., Escorihuela, M. J., Richaume, P., et al. (2007). L-band microwave emission of the biosphere (L-MEB) model: description and calibration against experimental data sets over crop fields. Remote Sens. Environ. 107, 639–655. doi:10.1016/j.rse.2006.10.014
Wigneron, J.-P., Kerr, Y. H., Chanzy, A., and Jin, Y. Q. (1993). Inversion of surface parameters from passive microwave measurements over a soybean field. Remote Sens. Environ. 46, 61–72. doi:10.1016/0034-4257(93)90032-s
Wigneron, J.-P., Li, X., Frappart, F., Fan, L., Al-Yaari, A., De Lannoy, G., et al. (2021). SMOS-IC data record of soil moisture and L-VOD: historical development, applications and perspectives. Remote Sens. Env. 254, 112238. doi:10.1016/j.rse.2020.112238
Wigneron, J.-P., Pardé, M., Waldteufel, P., Chanzy, A., Kerr, Y., Schmidl, S., et al. (2004). Characterizing the dependence of vegetation model parameters on crop structure, incidence angle, and polarization at L-band. IEEE Trans. Geosci. Remote Sens. 42 (2), 416–425. doi:10.1109/tgrs.2003.817976
Wigneron, J.-P., Waldteufel, P., Chanzy, A., Calvet, J.-C., and Kerr, Y. (2000). Two-dimensional microwave interferometer retrieval capabilities over land surfaces (SMOS mission). Remote Sens. Environ. 73, 270–282. doi:10.1016/s0034-4257(00)00103-6
Winkler, A. J., Myneni, R. B., Hannart, A., Sitch, S., Haverd, V., Lombardozzi, D., et al. (2021). Slowdown of the greening trend in natural vegetation with further rise in atmospheric CO&lt;sub&gt;2&lt;/sub&gt;. Biogeosciences 18, 4985–5010. doi:10.5194/bg-18-4985-2021
Winkler, K., Hui, Y., Raphael, G., Richard, F., Guido, C., Gregory, D., et al. (2023). Changes in land use and management led to a decline in Eastern Europe's terrestrial carbon sink. Commun. Earth Environ., 4, 237. doi:10.1038/s43247-023-00893-4
Xu, L., Saatchi, S. S., Yang, Y., Yu, Y., Pongratz, J., Bloom, A. A., et al. (2021). Changes in global terrestrial live biomass over the 21st century. Sci. Adv. 7, eabe9829. doi:10.1126/sciadv.abe9829
Yang, H., Ciais, P., Chave, J., Huang, Y., Ballantyne, A., Yu, K., et al. (2021). Coarse woody debris are buffering mortality-induced carbon losses to the atmosphere in tropical forests. Environ. Res. Lett. 16, 011006. doi:10.1088/1748-9326/abd58a
Yang, H., Ciais, P., Frappart, F., Li, X., Brandt, M., Fensholt, R., et al. (2023). Global increase in biomass carbon stock dominated by growth of northern young forests over past decade. Nat. Geosci. 16, 886–892. doi:10.1038/s41561-023-01274-4
Yang, H., Ciais, P., Wigneron, J.-P., Chave, J., Cartus, O., Chen, X., et al. (2022). Climatic and biotic factors influencing regional declines and recovery of tropical forest biomass from the 2015/16 El Niño, PNAS, 119 e2101388119. doi:10.1073/pnas.2101388119
Yu, L., Fan, L., Ciais, P., Sitch, S., Fensholt, R., Xiao, X., et al. (2023). Carbon dynamics of Western North American boreal forests in response to stand-replacing disturbances. Int. J. Appl. Earth Observation Geoinformation 122, 103410. doi:10.1016/j.jag.2023.103410
Zhao, Z., Ciais, P., Wigneron, J.-P., et al. (2024). Central African biomass carbon losses and gains during 2010–2019. One Earth. doi:10.1016/j.oneear.2024.01.021
Keywords: L-VOD, passive microwave, forest, biomass, global carbon cycle
Citation: Wigneron J-P, Ciais P, Li X, Brandt M, Canadell JG, Tian F, Wang H, Bastos A, Fan L, Gatica G, Kashyap R, Liu X, Sitch S, Tao S, Xiao X, Yang H, Espinoza Villar JC, Frappart F, Li W, Qin Y, De Truchis A and Fensholt R (2024) Global carbon balance of the forest: satellite-based L-VOD results over the last decade. Front. Remote Sens. 5:1338618. doi: 10.3389/frsen.2024.1338618
Received: 14 November 2023; Accepted: 09 April 2024;
Published: 10 May 2024.
Edited by:
Jiangyuan Zeng, Chinese Academy of Sciences (CAS), ChinaReviewed by:
Hongliang Ma, l’alimentation et l’environnement (INRAE), INRAE Paris, FranceXiaojing Bai, Nanjing University of Information Science and Technology, China
Quan Quan, Cornell University, United States
Copyright © 2024 Wigneron, Ciais, Li, Brandt, Canadell, Tian, Wang, Bastos, Fan, Gatica, Kashyap, Liu, Sitch, Tao, Xiao, Yang, Espinoza Villar, Frappart, Li, Qin, De Truchis and Fensholt. This is an open-access article distributed under the terms of the Creative Commons Attribution License (CC BY). The use, distribution or reproduction in other forums is permitted, provided the original author(s) and the copyright owner(s) are credited and that the original publication in this journal is cited, in accordance with accepted academic practice. No use, distribution or reproduction is permitted which does not comply with these terms.
*Correspondence: Jean-Pierre Wigneron, amVhbi1waWVycmUud2lnbmVyb25AaW5yYWUuZnI=