 Yehav Alkaher
 Israel Cohen
 - Andrew and Erna Viterbi Faculty of Electrical and Computer Engineering, Technion—Israel Institute of Technology, Haifa, Israel
In this paper, we address the problem of dual-microphone speech reinforcement for improving in-car speech communication via howling control. A speech reinforcement system acquires speech from a speaker’s microphone and delivers it to the other listeners in the car cabin through loudspeakers. A car cabin’s small space makes it vulnerable to acoustic feedback, resulting in the appearance of howling noises. The proposed system aims to maintain a desired high amplification gain over time while not compromising the output speech quality. The dual-microphone system consists of a microphone for speech acquisition and another microphone that monitors the environment for howling detection, where its location depends on its howling detection sensitivity. The proposed algorithm contains a gain-control segment based on the magnitude-slope-deviation measure, which reduces the amplification-gain in the case of howling detection. To find the optimal locations of the howling-detection microphone in the cabin, for a devised set of scenarios, a Pareto optimization method is applied. The Pareto optimization considers the bi-objective nature of the problem, i.e., minimizing both the relative gain-reduction and the overall speech distortion. It is shown that the proposed dual-microphone system outperforms a single-microphone-based system. The performance improvement is demonstrated by showing the higher howling detection sensitivity of the dual-microphone system. Additionally, a microphone constellation design process, for optimal howling detection, is provided through the utilization of the Pareto fronts and anti-fronts approach.
1 Introduction
Speech communication, especially between the front and rear-seat passengers, relies on the reflections of the speech sound waves inside the car. Unfortunately, the sound-absorbing interior of the car is designed to quiet the cabin from car and road noises. Together with in-car noises, the speech communication quality is generally insufficient. A common practice for in-car speech communication is to utilize a speech-reinforcement (SR) system, where the speaker’s speech is acquired and delivered to the other passengers, and in that way better heard and more intelligible (Ortega et al., 2005; Faccenda et al., 2013; Bulling et al., 2016). The SR system consists of microphones, which are mounted over each passenger to acquire the direct speech, and loudspeakers for each row of seats, which amplify the acquired speech signals and play them back into the car cabin. Reverberation, due to reflections of sound waves inside the cabin, leads the speech signals of the speaker and loudspeakers to return into the speaker’s microphone, i.e., acoustic echo (Cohen et al., 2009). To acquire the cleanest direct speech signal from the speaker, the microphone needs to be positioned in the least reverberant place in the cabin while being as close as possible to the speaker.
Reverberation times (T60) in cars are typically between 50–60 ms (Bulling et al., 2016), i.e., the room space of a car cabin is not very reverberant due to its sound-absorbing interior. However, since the loudspeaker-enclosure-microphone (LEM) paths inside a car cabin are relatively short, there exists a level of the amplification-gain, at which the loudspeaker signal is picked up by the microphone, and then played back into the cabin, i.e., acoustic feedback. This situation is also known as electro-acoustic coupling and might result in system instability (positive feedback). This instability is manifested in the appearance of a grating howling sound, which usually starts rising at certain frequencies that are determined by the LEM paths. Due to the acoustic feedback, the attainable gain of the loudspeakers is limited to keep the SR system stable. This maximum attainable gain of the system, which satisfies system stability and the absence of howling, is known as the maximum stable gain (MSG) (Faccenda et al., 2013). As the room is more reverberant and the LEM paths are shorter, the MSG is lower.
Several approaches to deal with the disruptive howling effect have been proposed. A common approach for preventing electro-acoustic coupling, also utilized in hearing aids (Nakagawa et al., 2012; Liang et al., 2017), is to use an acoustic echo canceller (AEC). An AEC consists of an adaptive filter that aims at canceling the echo signal from the loudspeaker by adjusting itself to the room-impulse-response (RIR) of the LEM-path (Shynk et al., 1992; Ortega et al., 2005; Reuven et al., 2007; Cifani et al., 2009; Cohen et al., 2009; Van Waterschoot and Moonen, 2010; Nakagawa et al., 2012; Bulling et al., 2016). For example, Ortega et al. (Ortega et al., 2005) present a single-microphone method that involves an AEC with a combined residual echo suppression and noise reduction filter. The combined filter is designed to ensure the stability of the closed-loop system. Nakagawa et al. (Nakagawa et al., 2012) present a dual-microphone method for acoustic feedback cancellation, utilized in hearing aids, where the second microphone (remote from the in-ear loudspeaker) is used for reducing the impact of the desired signal on the adaptation of the AEC. Another approach is to handle the howling effect itself. Handling the howling effect is used to restore the system stability, rather than preventing it (Faccenda et al., 2013). A general approach for handling the appearance of howling frequencies is the usage of notch-filter-based howling suppression (NHS) techniques, which restore system stability by reducing the amplification gain at the detected howling frequencies (Van Waterschoot and Moonen, 2010). Since a noticeable howling sound may arise even before the SR system reaches instability (positive feedback), a howling detection stage must be utilized (Green et al., 2016).
The relatively short LEM paths in a car cabin constitute a constraint on the minimal propagation delay, that can be addressed by the reinforcement system. Specifically, for an echo signal emitted from the loudspeaker and arriving at the microphone, it is desired to estimate the direct response and the reflections in a time shorter than the propagation time of the echo signal to the microphone. That means that AEC’s processing delay must be lower than the minimal propagation delay that may exist in the cabin. This requirement poses a significant challenge to the use of AEC algorithms. As for suppressing the residual echo with the combined filter, as suggested by Ortega et al. (Ortega et al., 2005), although stability is kept in terms of non-divergence of the adaptive filter taps and the output signal, the howling effect may still appear at some level. Moreover, such filters may result in speech distortion, mainly since it takes time for them to properly converge or react to changes in the input. As for the dual-microphone method, proposed by Nakagawa et al. (Nakagawa et al., 2012), both microphones in a car cabin acquire similar amounts of echo from the loudspeaker, which means that the central assumption is contradicted. In that case, two single-channel AECs are required in the SR system. This would result in increasing the system complexity (Van Waterschoot and Moonen, 2010) and thus affecting the minimal propagation delay that can be dealt with.
In this paper, a dual-microphone system with an SR algorithm, named Magnitude-Slope-Deviation based Gain-Control (MSD-GC), is proposed for in-car speech communication, focusing on front-to-rear passenger communication. The proposed system aims to maintain a desired high amplification gain over time while not compromising the output speech quality. The system comprises a set of microphones for speech acquisition and a single microphone, denoted as the howling-detection microphone, which is dedicated to monitoring the environment. The idea behind adding the howling-detection microphone lies in the fact that a howling noise in the room may be more noticeable at one location than at another, depending on the amplification gain and LEM paths. Hence, the proposed MSD-GC algorithm (within the proposed system) applies a gain factor for each speech-acquisition microphone, which is adjusted by the proposed gain-control segment that is triggered by a Magnitude-Slope-Deviation (MSD) based howling detector (Alkaher and Cohen, 2021). To ensure the stability of the system and the speech quality, the gain-control segment utilizes the dedicated microphone for howling detection and suppression. Namely, changing the gain uniformly (for all frequencies) along time, as a function of howling detection. The dedicated howling-detection microphone does not affect the MSG of the system. However, its location may affect the RIR, increasing the magnitude of howling frequencies. Considering front-to-rear passenger communication in a two-row car, the proposed system is a dual-microphone SR system. The dual-microphone solution degenerates into a single-microphone solution when a single microphone serves for both speech acquisition and monitoring the environment. The contributions of this paper are as follows: First, developing a gain-control algorithm that exploits the advantages of the MSD-based howling detector, and utilizes a howling-detection microphone for improving howling control. Thus, maintaining a desired high amplification gain in the SR system while minimizing the distortion of the output speech quality. Second, designing a microphone-constellation (on a car cabin’s ceiling) for optimal howling detection through the utilization of the Pareto fronts and anti-fronts approach.
The rest of the paper is organized as follows: Section 2 describes the signal model and problem formulation. Section 3 describes the advantage of utilizing a second microphone for howling detection, for a simple amplification system, using Control Systems theory. Section 4 presents the proposed MSD-GC algorithm. Section 5 presents the process for finding the Pareto-optimal locations of the howling-detection microphone inside the cabin. Section 6 describes the performance evaluation procedure. Section 7 demonstrates the advantage of utilizing the howling-detection microphone and shows the microphone-constellation design method for Pareto-optimal howling detection. Finally, Section 8 presents the conclusions of the study.
2 Signal Model and Problem Formulation
The signal model of the proposed dual-microphone SR system considers two microphones and a loudspeaker in a closed room. One microphone is responsible for speech acquisition, and the other one is responsible for monitoring the environmental noise for the purpose of howling detection and suppression. The first microphone is denoted as the speaker’s microphone, and the second microphone is denoted as the howling-detection microphone. The loudspeaker is used to play the system’s output signal back into the room.
Figure 1 illustrates the proposed SR system. The output signal of the system y(n) comprises the loudspeaker signal x(n) and the thermal noise of the loudspeaker w(n), i.e.,
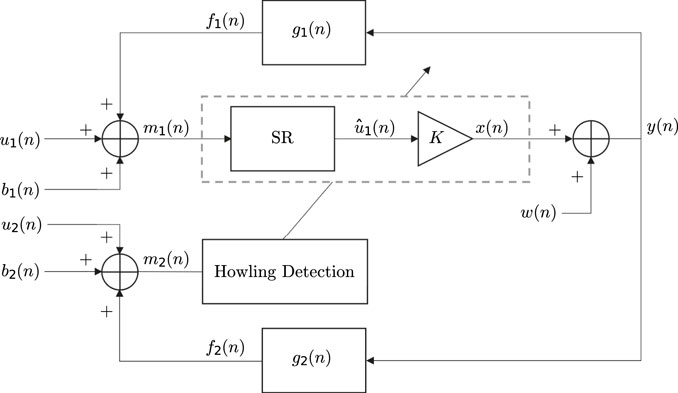
FIGURE 1. Proposed speech reinforcement system, controlled by the howling-detection microphone.
The signal y(n) propagates through the LEM-paths into the speaker’s microphone (mic1), with an RIR g1(n), generating the echo signal f1(n):
where * denotes the convolution operation. The input signal to mic1 m1(n) is composed of the desired near-end speech u1(n), the background and thermal noises of the microphone, b1(n), and the acoustic echo from the loudspeaker f1(n):
To deliver the near-end speech through the loudspeaker, an SR-segment is utilized to obtain the filtered estimated near-end speech
Simultaneously, y(n) propagates through other LEM-paths into the howling-detection microphone (mic2), with an RIR g2(n), creating the echo signal f2(n). The input signal to mic2 m2(n) is given by
where u2(n) is the desired near-end speech in mic2, and b2(n) is the background and thermal noises of the microphone. Our objective is to develop a stable dual-microphone SR system, which utilizes one of the microphones for howling detection and suppressing potential system instabilities due to acoustic feedback. Specifically, once howling is detected in m2(n), the SR system is adapted to provide a proper reaction.
3 Howling Detection in a Simple Amplification System
Considering a simple amplification algorithm within the proposed SR system, in Figure 1, it is desired to prove the claim that a frequency-howl can appear at one location in a room and not appear at another location. A frequency-howl is the product of feedback at a particular frequency, which occurs if a pole of the system’s transfer function is excited by a frequency component of the input signal. For that, a signal model analysis of the system is provided with respect to Control Systems theory (Dorf and Bishop, 2008), Closed-Loop Control Systems to be precise.
It is desired to calculate the effect of the speaker’s speech signal on the input of both mic1 and mic2, considering the closed-loop system. Assuming that the background and thermal noises are statistically independent of the speaker’s speech signal, and due to the linearity of the closed-loop system, the effect of each on the system’s output can be calculated separately (Benesty et al., 2017). Thus, the inter-system relations, in terms of the Laplace domain (where s denotes the complex frequency s-plane), are described in Eqs 6–9 (disregarding the background and thermal noises). The effect of the speaker’s speech signal Sp(s) on the stability of the system, as perceived by mic1 and mic2, is described by the closed-loop transfer functions in Eqs 7, 9, correspondingly. First,
so
From here,
In this manner,
The expression of P2(s) implies that the magnitude of specific frequencies may be affected rather than the MSG of the closed-loop system.
In order to test the system, a car cabin was simulated as a room of dimensions
The magnitude-responses of P1(f) and P2(f), for different amplification-gains, are presented in Figure 2. For K = 0 [graph (A)], P1(f) and P2(f) are in fact H1(f) and H2(f), and the magnitude-response difference shows a reduction in 10 dB. For K = 1 [graph (B)], the magnitude levels are similar. Amplification-gain K = 5 [graph (C)] is the MSG. The magnitude-responses show a high amplification around frequency 2,170 Hz: about 7 dB for P1(f) and about 16 dB for P2(f). This suggests that there is a potential pole around frequency 2,170 Hz. Above the MSG [graphs (D) and (E)], the magnitude level difference between P2(f) and P1(f) is about 10 dB, and the number of poles increases for both P1(f) and P2(f).
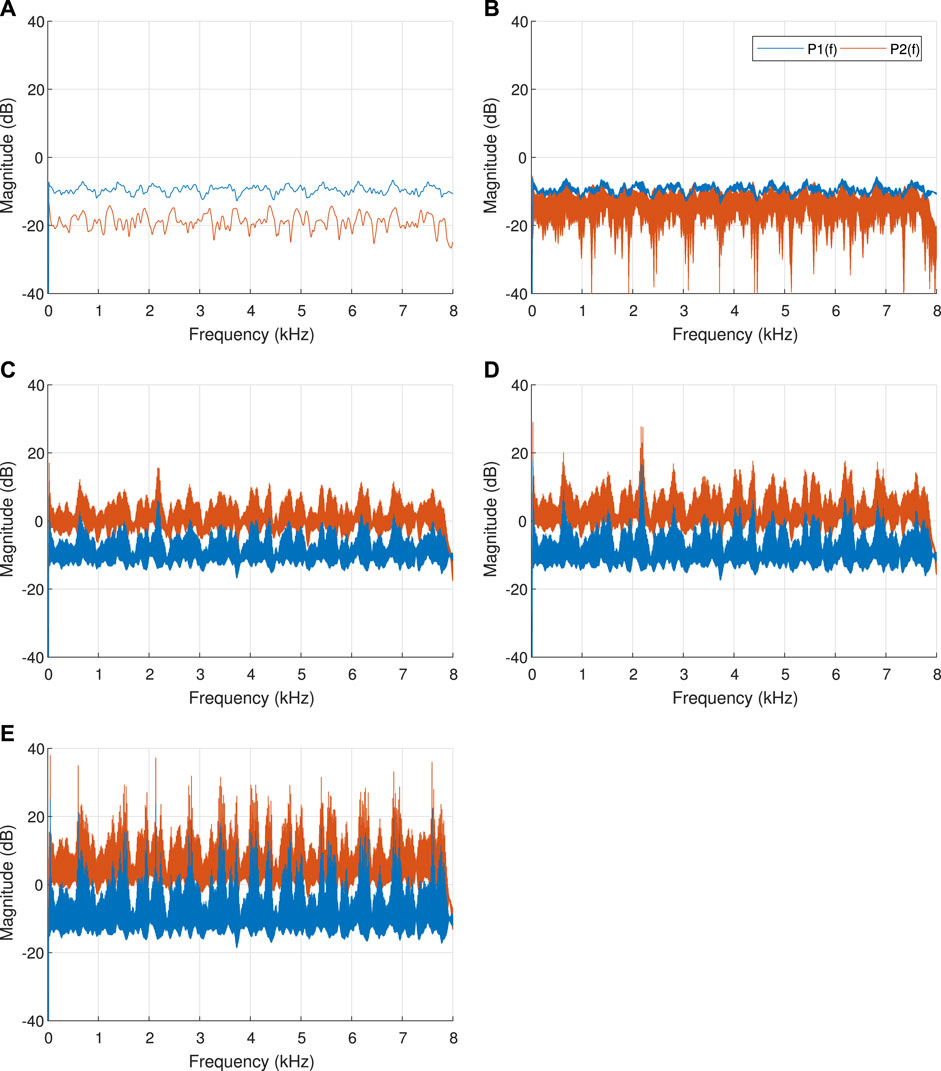
FIGURE 2. Magnitude-response (dB) graphs of the frequency responses P1(f) and P2(f), for different amplification-gains, where mic2’s location is
Hence, for a speech signal Sp(s) that comprises a frequency component at some pole of the system, the resulting frequency-howl will be more dominant at mic2 (which is closer to the loudspeaker), especially up to the MSG. A higher magnitude of a frequency-howl, relative to the environmental noise in the cabin, means a better howling signal-to-noise ratio (HSNR). Therefore, according to the simulated RIRs, placing mic2 near the loudspeaker would result in better detection of frequency-howls.
Furthermore, adding an SR segment that would restrain high levels of the amplified sound signal may help prevent or suppress the appearance of dominant frequency-howls.
4 Proposed Magnitude-Slope-Deviation-based Gain-Control Algorithm
The proposed solution is to control the desired amplification-gain to be applied based upon a howling detection segment that receives the input signal to mic2, the howling-detection microphone. The proposed Magnitude-Slope-Deviation-based Gain-Control (MSD-GC) algorithm within the proposed dual-microphone system is illustrated in Figure 3. In the framework of this paper, no SR segment is applied, so the inherited physical properties of the system (microphones and a loudspeaker) serve as the SR segment, while the proposed gain-control segment controls the amplification-gain K of the system in Figure 1. Accordingly, mic1 acquires the desired signal to be reproduced, while mic2 acquires the environmental noise.
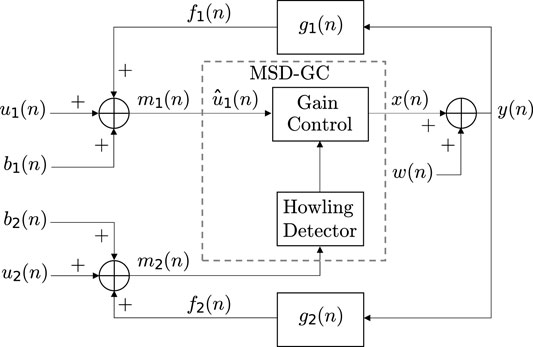
FIGURE 3. Proposed MSD-GC algorithm within the proposed dual-microphone system (the SR-segment is empty). The howling detection algorithm is based on the MSD measure, and controls the amplification-gain of the system within the proposed gain-control segment (i.e., MSD-GC).
A known problem in the discussed environment is that a noticeable howling sound may arise even before the SR system reaches instability. As mentioned in Section 3, a frequency-howl is the product of acoustic feedback at a certain frequency. The appearing frequency-howls can be divided into two cases. First, an increasing howl occurs when a frequency component of the input signal excites an unstable pole of the system’s transfer function. Second, an underdamped howl occurs when a frequency component of the input signal excites a stable pole of the system’s transfer function, which is located close to (and inside) the unit-circle (considering the z plane of a discrete system), and thus decays more slowly. In the ideal case, where the RIR of the LEM-paths is known, the MSG can be determined by known methods of Control Systems theory (Dorf and Bishop, 2008). However, since the RIR is dynamic and unknown, a howling detection stage must be utilized.
The gain-control segment in the discussed problem aims at reducing the amplification-gain in the case of howling detection. For this purpose, Green et al.(Green et al., 2016) suggest utilizing the MSD measure, via the Summing MSD Method, to intelligently identify feedback howls within candidate-frequency bins. Hence, howling detection, based on the MSD measure, is used to control the amplification-gain of the system within the proposed gain-control segment (i.e., MSD-GC), see Figure 3.
4.1 Magnitude-Slope-Deviation Based Howling Detection
An increasing frequency-howl, which occurs due to positive feedback at some frequency, is manifested in an exponential magnitude growth. This means that the power of howling components increases linearly over time when calculated on a dB-scale, i.e., the gradient change (second-order derivative) is consistently close to zero (Green et al., 2016). Similarly, underdamped howls are manifested in an exponential magnitude decrease, which also means that the gradient change is consistently close to zero.
Magnitude change is tracked using a dB-scale magnitude history buffer. In detail, the magnitude history buffer is formed by calculating the power-spectral-density (PSD) of subsequent sample frames, where each sample frame is referred to as an MSD-buffer. Namely, the magnitude at each frequency bin is calculated according to the PSD of the MSD-buffer. For an unbiased estimator (assuming the second-derivative is 0 for a frequency-howl), the root-mean-square deviation (RMS-Deviation) is the square root of the variance, known as the standard deviation. Hence, to evaluate the linear change of suspected frequency components over time, the MSD of the magnitude history buffer is calculated by averaging the squared absolute values of the historical magnitude gradient change, as follows:
where m denotes the current frame, G″(k, n) is the second-derivative of the dB-scale magnitude history buffer data, at frequency bin k and analysis frame n, and N in the number of frames in the history-buffer. As a result, the minimal delay required for calculating the MSD-measure, since the beginning of a howl, is calculated by
where LMSD is the length (in samples) of the MSD-buffer, and Lframe-shift is the frame-shift (in samples). Finally, a frequency bin is flagged as a probable howl if its corresponding MSD value is below a certain threshold δMSD.
One deficiency of this MSD-based method is that frequency bins with no energy change over time would produce corresponding MSD values which are very close to zero. For that, the howling detection shall be refuted if the maximum value of the candidate frequencies’ mean-energy (among the magnitude history-buffer), is below a certain threshold ϵhowl. In addition, since sound waves consider only acoustic waves within the frequency range of 20 Hz to 20 kHz (Chen et al., 2018; Wang et al., 2019), detected frequency-howls below 15 Hz shall also be refuted.
A significant tradeoff of this temporal method lies in the effect of varying the number of frames in the magnitude history buffer, which are available for analysis, and in the length of each sample frame. The length of a sample frame is set to 512 (the power of 2, closest to 30 ms—about the typical length of a speech-analysis frame), and there is a frame-shift of 10 ms between two subsequent sample frames. While a larger number of frames provides a more accurate estimation of the MSD, and a longer sample frame provides a better frequency resolution, the total length of the magnitude history buffer determines the delay of the howling-detection process. A long howling-detection delay is not desired due to two significant constraints. First, the howling detector in the proposed algorithm is required to detect frequency-howls as soon as possible, hopefully before the human ear may notice them. Second, a noticeable underdamped frequency-howl might be short, and a long magnitude history buffer may not detect it.
Accordingly, while the MSD measure has a low false-alarm rate for the optimized set of parameters (frame-shift, frame-length, and the number of frames), the howls are noticeable before they are detected, and it miss-detects short howls. Therefore, an improved howling detector has been developed, based on the principles of the MSD measure in (Green et al., 2016), that includes two stages (Alkaher and Cohen, 2021). The first stage detects candidate frequency-howls and is designed to have a low miss-detect rate, at the cost of a high false-alarm rate. From analyzing the howling false-alarms, it appears that the false-alarms originate mostly from speech harmonies. Speech-harmonies behave similarly to frequency-howls, i.e., the frequency-components: rise (like an increasing howl), keep steady for a few moments, and decay (like an underdamped howl). Therefore, a second stage was added, designed to refute candidate frequency-howl false-alarms, which are not caused by feedback.
For this purpose, the magnitude history buffer is set up with a large number of frames, so it has two goals. First, the group of the most recent few frames is termed the detection buffer, and it is utilized for early howling detection (at the cost of a high false-alarm rate). Second, the entire buffer is termed the history buffer, and it is utilized for analyzing the behavior of the candidate frequency-howls during the time before the detection.
4.2 Gain-Control Segment
The gain-control segment is somehow inspired by the congestion control mechanism employed by the Transmission-Control-Protocol (TCP) (Allman et al., 2009). The TCP provides a reliable continuous byte stream via data-segment transmission between communicating users. While TCP Congestion Control uses data-segment-loss detection as a sign of congestion, and then repairs it and reduces the congestion window (the amount of data that the sender can transmit); the proposed gain-control segment uses howling-detection as a sign of congestion (electro-acoustic coupling), and then reduces the amplification gain.
The gain-control segment is divided into three cascaded stages: Gain Update, Howling Detection, and Gain Smoothing. The Howling Detection stage is responsible for initiating a gain reduction process when a frequency-howl is detected by setting a new destination amplification-gain Kdest. Then, further gain reduction via the Howling Detection stage is frozen for a time-span τhd, to suppress the howling components using the recently configured Kdest. The Gain Smoothing stage is responsible for smoothing the transition from the currently applied amplification-gain Kcurr to Kdest, via a level-detection process, aiming to minimize artifacts in the reinforced speech Giannoulis et al. (2012). The gain-smoothing attack and release times are τA,gs and τR,gs, correspondingly. In the Gain Update stage, if howling is not detected during a time-span τgu, Kdest is updated to the new configured maximal gain Kmax (which is less than the previous one). Furthermore, if howling is not detected during a larger time-span τrenew, then a gradual gain increment process is initiated. Namely, where Kdest is updated gradually, every τrenew, up to the initial maximal gain K.
Initially, Kmax is set as the desired gain K (chosen by the user), Kcurr is set to 1 (neutral gain), and Kdest is set to be equal to Kmax. Regarding the level detection process, the smoothed decoupled peak detector (Giannoulis et al., 2012) is utilized with a fall-time τA,gs = 5 ms, for quick response in case of howling detection, and a rise-time τR,gs = 10 ms (effective release time of 15 ms), for fast recovery towards the updated destination gain (Giannoulis et al., 2012). As for the system time-spans, τhd = 60 ms, τgu = 100 ms and τrenew = 1 s.
In detail, when howling is detected (and not refuted, e.g., due to low-energy candidate-howls), the amplification-gain is reduced as follows:
and the howling detection algorithm is frozen for τhd.
The transition from Kcurr to Kdest is smoothed via the level detection process.
After τgu from the last howling detection, the amplification-gain starts to recover by setting
and after τrenew from the last howling detection, the gradual gain increment begins. Namely, every τgu (unless howling is detected), Kmax is updated to the intermediate available desired gain Kavail, until reaching K, as follows:
5 Pareto Optimization Based Microphone Constellation Design
Following on from Section 3, it is desired to find the optimal location of the howling-detection microphone in the cabin. Evaluating the SR algorithm in terms of both maintaining a desired high amplification gain over time, and not compromising the overall output speech quality, is a bi-objective problem. Consider a given SR system, i.e., the SR algorithm with a certain mic2-location in the cabin, as a strategy. To conduct a multiple-criteria decision making, concerning which strategy is optimal for solving this problem, a multi-objective optimization is required, also known as Pareto optimization (Deb, 2001). Hence, an analysis is done similarly to Section 4 in (Alkaher and Moshaiov, 2018). However, in the current discussion, the optimal mic2-locations are desired, rather than proving the satisfaction of the generality criteria among the compared strategies (mic2-locations).
The number of possible scenarios is infinite, starting with all desired amplification-gain values and environmental noise levels, and continuing with different car structures and speaker speech signals. Therefore, to facilitate a satisfying comparison, a sampled set of reference scenarios is devised, to produce a finite result-set for the reference strategies. Given these scenarios, each reference strategy is represented in the bi-objective space as a set of performance vectors
5.1 Background—Strategy Comparison
For comparing a set of strategies i ∈ Nstrategies under a single scenario j*, domination among vectors is employed to sort the strategies. Since there is no preference for one objective over another, in the discussed problem, the sorting process is done by optimizing both objectives. Thus, the strategy performance vectors, which are non-dominated by any other vector, constitute a Pareto front that indicates the Pareto-optimal outcomes. Considering the Pareto front, the only way to decide which strategy is optimal (under the scenario) is by making a preference for one of the two objectives.
When there is no a priori information about the occurrence probability of the scenarios, a worst-case approach is employed. Accordingly, a strategy comparison under multiple scenarios is made using worst-case domination. Namely, under a devised set of scenarios j ∈ Mscenarios, comparing the worst-case Pareto anti-front per each strategy i*. These anti-fronts are the dominated (worst-case) bi-objective performance vectors of each strategy under the devised set of scenarios. In this manner, a Pareto front is formed, considering only the performance vectors of the strategies’ anti-fronts. This worst-case Pareto front is composed of the Pareto-optimal strategies under the worst-case scenario, given the uncertainty conditions. The Pareto-optimal strategies are those for which the anti-fronts are non-dominated by each other, i.e., where at least one pair of anti-front performance vectors from different strategies is non-dominated, or that domination is not absolute among the anti-fronts.
5.2 Pareto-Optimal mic2 Locations in a Car Cabin
Given a car cabin and an SR algorithm implemented within the dual-microphone system, the set of reference strategies shall consist of multiple mic2-locations. Considering the performance evaluation measures of the bi-objective problem, as will be determined in Section 6.2, a Pareto optimization process is applied under a devised set of scenarios, as illustrated in Figure 4.
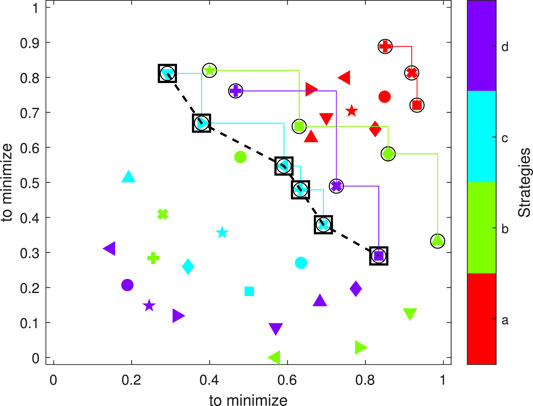
FIGURE 4. Pareto anti-fronts of the worst-case Pareto-front strategies (black circles connected by colored stair-graphs, see color-bar). The worst-case Pareto front is depicted by dashed-line connected black squares. Both axes are aimed to be minimized.
Accordingly, for each mic2-location (colored markers), the (dominated) Pareto anti-fronts are extracted, considering the devised set of scenarios (different markers). Considering that both axes aim to be minimized (in this example), each strategy’s anti-front (stair-graph) is facing towards the maximum of each axis. Then, the anti-fronts of all mic2-locations are compared, resulting in the worst-case Pareto front mic2-locations (dashed-line connected black squares). This way, the Pareto optimization process provides a microphone constellation design, consisting of the non-dominated Pareto-optimal mic2-locations.
5.3 General-Domination Criterion
Inspired by (Alkaher and Moshaiov, 2018), a new domination criterion is proposed. Accordingly, a strategy is defined as generally-dominated if it satisfies the following three conditions: if it is not one of the strategies that constitute the worst-case Pareto front; if under each of the devised set of scenarios, at least one of the worst-case Pareto front’s strategies is non-dominated by it; and if under at least one scenario, it is dominated by at least one of these strategies. Namely, general-domination over a reference strategy indicates the robustness of the worst-case Pareto front over that strategy.
6 Performance Evaluation
This section outlines the room configuration of the car cabin used in the simulations, along with the performance measures relevant to our problem. Accordingly, the Pareto optimization process, described in Section 5, will provide the Pareto-optimal strategies within the bi-objective problem.
6.1 Car-Cabin Room Configuration
This research focuses on a speech communication system inside a car cabin. The altogether system comprises sound absorbers (the car’s interior), omnidirectional microphones, directional sources (the speaker and the loudspeaker), and background noises. No databases were found, which include RIRs between different locations (to the authors’ choice) inside a car cabin. Therefore, the cabin configuration was designed using the known Room Impulse Response Generator Matlab code (Habets, 2006). Using more accurate RIRs, which may also consider near-field effects, may affect the howling frequencies of the system and even the MSG. However, as the amplification-gain approaches or exceeds the MSG, the acoustic feedback’s effect on sound remains the same.
In order to simulate a car cabin, the system was tested via simulations inside a room of dimensions

FIGURE 5. An illustration of the car-cabin room configuration, in the XY axes.
Two sound sources are considered: the speaker, the driver in this case, and the loudspeaker of the backseat passengers. Due to the limitations of the RIR Generator, the sources are assumed to be omnidirectional. This decision can be approved because the proposed system aims to be robust enough to cope with this situation as well. The simulated location of the driver’s mouth (sound source) is
6.2 Performance Measures
For the simple amplification system, the RIRs and the gain factor are considered linear and time-invariant (LTI) systems, so the MSG and signal distortion can be analyzed mathematically, assuming the knowledge of the RIRs (Section 3). However, the proposed SR algorithm is not time-invariant since the amplification-gain is changed according to howling appearance (and detection), which is dependent on the resulting feedback that is caused by the unobservable input signal u1(n) and the microphone noises. Hence, performance evaluation is done by obtaining objective performance measurements at the end of the simulation process, which evaluates the overall output signal of the system. The following subsections present the chosen performance evaluation measures for each objective of the discussed problem.
6.2.1 Spectral Distance Measures Based on LPC
Spectral distance measures assess the distortion between the original and reinforced (degraded) signals. According to Deller et al.(Deller Jr et al., 1993), “The human auditory system is relatively insensitive to phase distortion”. Namely, the source and the enhanced speech signals can be perceived similarly by the listener, although being quite different from each other. Hence, these objective measures are suggested to assess the dissimilarity between the all-pole models of the reference and enhanced speech signals, which can be calculated via Linear Prediction using the Autocorrelation method. The linear predictive coefficients are estimated over synchronous time-frames, of about 15–30 ms, of the compared speech signals (Deller Jr et al., 1993; Loizou, 2013). The traditional rule of thumb leads to linear prediction of order
Three spectral distance measures, which are proposed in the literature, are the Itakura-Saito distance (and its symmetric form), the log-likelihood ratio measure, and the Itakura-Saito measure. The Itakura-Saito (IS) distance distortion-measure is shown in equation (5.195) in Deller Jr et al. (1993). To achieve a valid metric, the symmetric IS-distance can be calculated, see equation (9.10) in Deller Jr et al. (1993). The formulae of the log-likelihood ratio (LLR) measure and the IS-measure are shown in equations (11.7) and (11.10) in Loizou (2013), correspondingly. The distortion measure used in this paper is the IS distance.
Accordingly, given a frame of a speech signal s(n), the all-pole model of order p is
where
where
A long-term measure can be computed by taking an average on the short-term measurements between the time-frames of the input and output signals of the reinforcement system (Loizou, 2013). To be less sensitive to outliers, a median is taken on the short-term measurements, and it is denoted by Med-IS-Dist.
6.2.2 Relative Gain-Reduction
The MSG is dependent on the RIR of the LEM paths. The objective of utilizing mic2 is to better control the amplification-gain by increasing the howling detection sensitivity, see Section 3. Hence, the SR system aims to maintain a desired high amplification gain over time while not compromising the output speech quality (Van Waterschoot and Moonen, 2009).
As a long-term measure, the Matched Effective-Gain Keff is computed, based on the MSE, as
However, to be able to compare the results for various amplification-gain values, the Relative Gain-Reduction (RGR) is computed as
where the RGR is aimed to be minimized.
7 Simulation and Analysis
This section evaluates the proposed SR system and algorithm. As seen in Section 3, a constant amplification gain is limited by the MSG. Section 7.1 demonstrates the constraint of the MSG on the simple amplification algorithm within the proposed SR system in Figure 1. Since a dual-microphone system is proposed, there is a need to justify it by comparing the performance vectors for different locations of mic2. For this purpose, the considered performance objectives are the relative gain-reduction and the speech quality, measured by the RGR and the Med-IS-Dist, correspondingly. Of course, the performance of the dual-microphone system depends on the SR algorithm implemented within it. Section 7.2 proves the advantage of utilizing another microphone for better howling detection in terms of domination of the dual-microphone solution. This section also serves as the training stage since it extracts the Pareto-optimal mic2-locations in the simulated cabin. Finally, Section 7.3 shows a demonstration of the proposed SR system and algorithm, and thus verifies the domination of the dual-microphone solution, i.e., the test stage.
The proposed SR system is tested by computer simulations via Matlab. The train and test speech signals are composed (without repetition) from TIMIT speech database (Zue et al., 1990), as in (Liang et al., 2017), and the sampling frequency is 16 kHz. A constant system processing delay of 5 ms was inserted in simulations, considering that it must be short enough so the listener does not notice the time difference between the direct (spoken) and emitted (reinforced) sound signals.
7.1 Result Reference
As a reference, performance measures are extracted for the test speech signal (with a duration of 51 s) with the simple amplification algorithm inside the cabin, with no environmental noise, for the neutral gain K = 1, for the MSG K = 5 (right before howling is dominant in the reinforcement system, see Section 3), and for K = 6. It results that the calculated matched effective-gain is Keff = 1 for K = 1, and Keff = 5 for K = 5 (which gives an RGR value of 0). As for degradation in speech quality, the Med-IS-Dist value increases from 0.0011 for K = 1, to 0.051 for K = 5 (although the speech quality is still decent, i.e., with very low howls). For K = 6, which is above the MSG, it results that Keff = 6 (RGR = 0) and Med-IS-Dist = 0.13. For example, Figure 6 illustrates the spectrogram comparison, between a sample input signal u1 and the output of the reinforcement system y, for K = 6. The quality degradation can be recognized by the smearing of frequency components in y, and the multiple howling artifacts (retrospectively detected via mic1 using the howling detector), some of which are marked here by red circles.
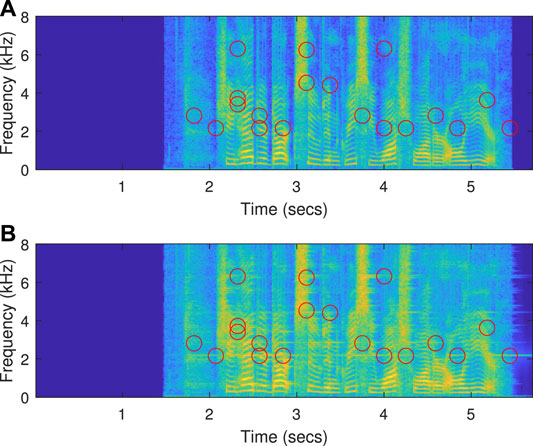
FIGURE 6. Spectrogram comparison for K = 6 (above MSG): (A) Spectrogram of u1; (B) spectrogram of y. The howling artifacts in y were retrospectively detected via mic1 using the howling detector, and (some of them) are marked in both (A,B) by red circles.
7.2 Optimal mic2 Locations Analysis
Regarding the proposed dual-microphone solution for the SR problem, the advantage of utilizing another microphone needs to be proven. For that, the bi-objective performance vectors shall be compared for different mic2-locations, aiming to obtain the non-dominated mic2-locations for optimal speech reinforcement inside the simulated car cabin.
Applying Pareto optimization, the compared strategies are the different mic2-locations, the simple amplification system and the single-microphone solution (namely, where mic2’s location is also mic1’s location), where the last two strategies are added for reference. The devised set of scenarios is composed of configured amplification-gain values
Regarding worst-case scenario domination, Figure 7 depicts the Pareto anti-fronts of the worst-case Pareto-front mic2-locations and the single-microphone solution. The worst-case Pareto front (dashed-line connected black circles) is composed of the mic2-locations for which the Pareto anti-fronts are non-dominated by any other mic2-location. It can be noticed that the worst-case Pareto anti-front of the single-microphone solution is non-dominated by all mic2-locations, except mic2-location
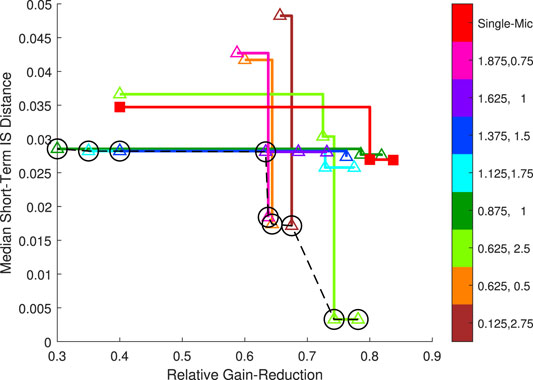
FIGURE 7. Pareto anti-fronts of the worst-case Pareto-front mic2-locations (connected colored triangles, see color-bar) and of the single-microphone solution (connected red squares). The worst-case Pareto front is depicted by dashed-line connected black circles. Both axes are aimed to be minimized.
As to the proposed general-domination criterion, the performance vectors are presented under the cherry-picked scenarios: K = 6 and clean-signal; K = 7 and noisy-signal; and K = 8 and clean-signal. Figure 8 depicts the performance vectors of the Pareto-front mic2-locations (per scenario), the performance vectors of the worst-case Pareto-front mic2-locations, and the performance vector of the single-microphone solution. Graphs (A)–(C) indicates that at least one of the worst-case Pareto-front mic2-locations are non-dominated by the single-microphone solution, under each of these scenarios; while graph (B) depicts a scenario where the single-microphone solution is also dominated by some of the worst-case Pareto-front mic2-locations. Hence, it is concluded for the compared set of scenarios, that the single-microphone solution is generally-dominated.
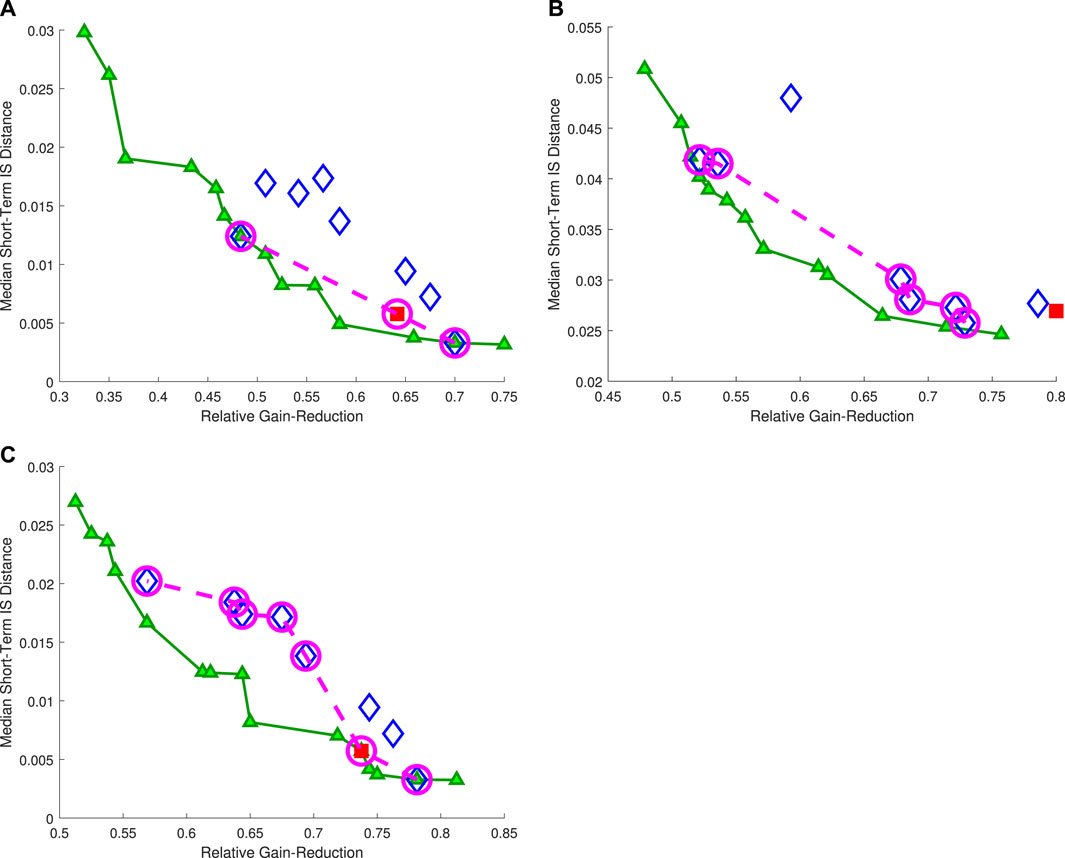
FIGURE 8. Performance vectors of the Pareto-front mic2-locations (connected green triangles), worst-case Pareto-front mic2-locations (blue diamonds), and the single-microphone solution (red square). The dashed-line connected magenta circles denote the Pareto front that considers the worst-case Pareto-front mic2-locations and the single-microphone solution. The graphs are extracted under the scenarios: (A) K = 6 and clean-signal; (B) K = 7 and noisy-signal; (C) K = 8 and clean-signal.
7.3 Algorithm Demonstration & Analysis
Figure 9 shows a comparison of the spectrogram of y(n) and the applied amplification-gain over time, under the scenario of K = 6 and clean-signal, where the single-microphone solution serves for both speech acquisition and howling detection. As can be seen in Figure 9, the inserted sample signal is preceded with 1.222 s of a silence buffer, which is the time-length of the magnitude history buffer of the MSD-based howling detector, see Section 4.1. This buffer is required to start monitoring the environmental noise in the system. It can also be noticed that the amplification gain is quickly attenuated (after the preceding silence-buffer), due to howling detection (marked by a red circle), and then gradually tends to rise back unless howling is detected. In Correspondence to Section 4, the amplification-gain fall time is short (5 ms) for quick response in case of howling detection, while the rise time is longer (15 ms) although still short for a fast recovery towards the updated destination gain. The gain-update time-span of 100 ms is widely evident and indicates the beginning of the Gain Update stage. The howling-detection freezing time-span of 60 ms is best illustrated at the gain-rising after t = 3 and in the gain-reduction before t = 4. In these cases, the gain-update process is stopped and the gain-reduction further continues, correspondingly, due to howling detection. Finally, the gradual gain increment process is initiated after t = 4 and continues every 1 s. Apart from the howling effect, better speech quality is expected to be achieved with a steadier applied amplification-gain over time, i.e., with softer transitions and less abrupt gain changes.
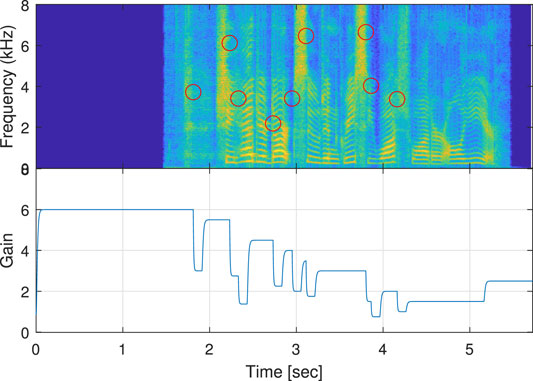
FIGURE 9. Comparison of the spectrogram of the system’s loudspeaker signal, and the applied amplification-gain (Gain) over time, under the scenario of K = 6 and clean-signal, where mic2’s location is
In subsequence to the training stage in Section 7.2, the following analysis compares the single-microphone solution with the worst-case Pareto front of the dual-microphone solution, using the test speech signal (with a duration of 51 s), i.e., the test stage. Thus, verifying that the single-microphone solution is generally-dominated. Namely, the system’s output is examined for the single-microphone solution, in comparison with three instances of the dual-microphone solution, under the scenario of K = 6 and clean-signal. The three mic2 placements, considered in the dual-microphone solution, are
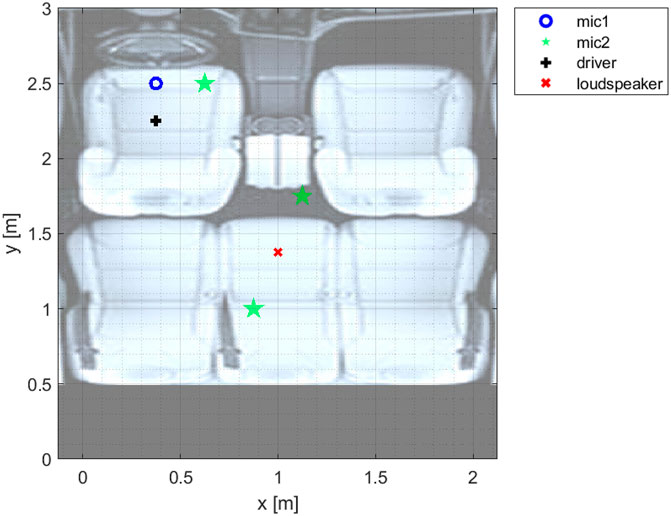
FIGURE 10. An illustration of the car-cabin room configuration, in the XY axes.
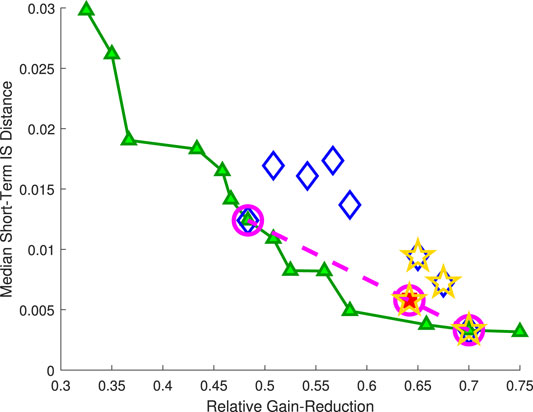
FIGURE 11. Performance vectors, under the scenario of K = 6 and clean-signal (of the training stage), of the Pareto-front mic2-locations (connected green triangles), worst-case Pareto-front mic2-locations (blue diamonds), and the single-microphone solution (red square). The dashed-line connected magenta circles denote the Pareto front that considers the worst-case Pareto-front mic2-locations and the single-microphone solution. The gold pentagrams denote the performance vectors of the mic2-locations, chosen for the algorithm demonstration.
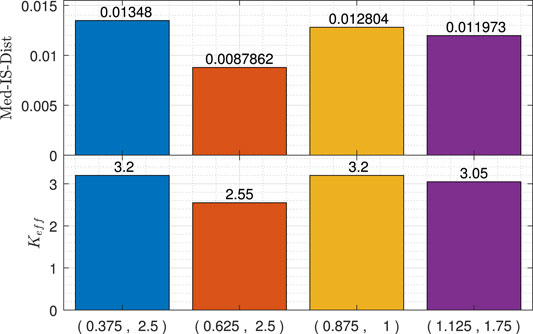
FIGURE 12. MSD-GC performance vectors for mic2-locations:
First, mic2-location
This demonstration validates the intuitive tradeoff between speech quality and the relative gain-reduction, which tends to be higher when the howling detection is more sensitive. In addition, this demonstration validates the dual-microphone solution’s potential to detect howling at a higher level of sensitivity.
8 Conclusion
We have considered a dual microphone speech reinforcement system for improving in-car speech communication via howling control. The car-cabin can be characterized as a relatively small room (short loudspeaker-enclosure-microphone paths) with a short reverberation time (due to the sound-absorbing materials). Therefore, the desired amplification-gain to be applied is limited due to electro-acoustic coupling, which is the product of feedback, manifested in a howling sound. A dual-microphone system with a speech reinforcement algorithm, named MSD-GC, was proposed for in-car speech communication, focusing on front-to-rear passenger communication. The proposed system aims to maintain a desired high amplification gain over time while not compromising the output speech quality. The proposed MSD-GC algorithm comprises a proposed gain-control segment, triggered by a Magnitude-Slope-Deviation based howling detector, utilizing another microphone that monitors the environment.
A Pareto optimization approach was applied, under a devised set of scenarios, to find the Pareto-optimal locations of the howling-detection microphone in the cabin, thus proving the advantage of utilizing another microphone. Namely, the worst-case Pareto front’s locations of the howling-detection microphone were discovered using the train speech signal, i.e., the training stage. It was shown that the proposed dual-microphone system outperforms the single-microphone-based system (that consists of the same proposed algorithm) in terms of the worst-case scenario; and that the proposed dual-microphone system is non-dominated by the single-microphone-based system under each of the devised set of scenarios, which indicates the robustness of the proposed dual-microphone system. Subsequently, the performance improvement of the dual-microphone system was demonstrated and validated in the simulated car cabin, under one scenario, for a chosen microphone placement and the test speech signal. This improvement was demonstrated by a steady high amplification gain over time, as well as a higher speech quality.
Future work may concern developing more advanced algorithms for implementation within the proposed dual-microphone speech-reinforcement system, analyzing the performance of the proposed system in real-life car models (which also involve directional microphones), and even expanding its use to other howling-vulnerable applications, such as Public Announcement systems, Live Shows, and Video Chat applications that often suffer from howling. In addition, the gain-control segment can be further investigated to separately control the gain for subdivided frequency bands of the audible frequency range concerning a psycho-acoustical scale (such as Bark scale), e.g., by setting different parameters for each frequency band.
Data Availability Statement
The original contributions presented in the study are included in the article/Supplementary Material, further inquiries can be directed to the corresponding authors.
Author Contributions
YA and IC contributed to conceptualization, methodology, and writing—review and editing. YA developed the theoretical formalism, designed the model and the computational framework, performed the numerical simulations, and analyzed the data. YA wrote the first draft of the manuscript. IC supervised the research. All authors contributed to manuscript revision, read, and approved the submitted version.
Conflict of Interest
The authors declare that the research was conducted in the absence of any commercial or financial relationships that could be construed as a potential conflict of interest.
Publisher’s Note
All claims expressed in this article are solely those of the authors and do not necessarily represent those of their affiliated organizations, or those of the publisher, the editors and the reviewers. Any product that may be evaluated in this article, or claim that may be made by its manufacturer, is not guaranteed or endorsed by the publisher.
Acknowledgments
The authors thank David Alkaher and Shlomo Alkaher for their constructive comments and useful suggestions.
References
Alkaher, D., and Moshaiov, A. (2018). Nondominated Strategies for Cautious to Courageous Aerial Navigation. J. Guidance, Control Dyn. 41, 1485–1501. doi:10.2514/1.g003285
Alkaher, Y., and Cohen, I. (2021). Magnitude-slope-deviation Based Howling-Detector for Speech Reinforcement Systems. In preparation
Allman, M., Paxson, V., and Blanton, E. (2009). TCP Congestion Control. RFC 5681, RFC Editor. doi:10.17487/RFC5681
Benesty, J., Cohen, I., and Chen, J. (2017). Fundamentals of Signal Enhancement and Array Signal Processing. John Wiley & Sons, 63–65. chap. 3.
Bulling, P., Linhard, K., Wolf, A., and Schmidt, G. (2016). “Acoustic Feedback Compensation with Reverb-Based Stepsize Control for Incar Communication Systems,” in Speech Communication; 12. ITG Symposium. Paderborn, Germany: IEEE, October, 1–5.
Chen, J., Huang, G., and Benesty, J. (2018). [Dataset]. Concentric Circular Differential Microphone Arrays and Associated Beamforming. US Patent 9,930,448
Cifani, S., Montesi, L. C., Rotili, R., Principi, E., Squartini, S., and Piazza, F. (2009). “A PEM-AFROW Based Algorithm for Acoustic Feedback Control in Automotive Speech Reinforcement Systems,” in 2009 Proceedings of 6th International Symposium on Image and Signal Processing and Analysis (IEEE), 656–661. doi:10.1109/ispa.2009.5297666
Cohen, I., Benesty, J., and Gannot, S. (2009). Speech Processing in Modern Communication: Challenges and Perspectives, 3. Springer Science & Business Media. chap. 1, 4, 6. 2, 89–125, 151–182.
Deb, K. (2001). “Dominance and Pareto-Optimality,” in Multi-Objective Optimization Using Evolutionary Algorithms (John Wiley & Sons), 16. chap. 2.4. 25–44.
Deller, J. R., Proakis, J. G., and Hansen, J. H. (1993). Discrete Time Processing of Speech Signals. New York, NY: Prentice Hall PTR. 290, 328–329, 587–588.
Dorf, R. C., and Bishop, R. H. (2008). Modern Control Systems. 11th edition. New York: Pearson Prentice Hall. chap. 2, 4, 5, 7. 50–57, 74, 212–216, 255–257, 277–295, 407–409.
Faccenda, F., Squartini, S., Principi, E., Gabrielli, L., and Piazza, F. (2013). A Real-Time Dual-Channel Speech Reinforcement System for Intra-cabin Communication. J. Audio Eng. Soc. 61, 889–910.
Franzen, J., zum Alten Borgloh, I. M., and Fingscheidt, T. (2018). “On the Benefit of a Stereo Acoustic echo Cancellation in an In-Car Communication System,” in Speech Communication; 13th ITG-Symposium (VDE), 1–5.
Giannoulis, D., Massberg, M., and Reiss, J. D. (2012). Digital Dynamic Range Compressor Design—A Tutorial and Analysis. J. Audio Eng. Soc. 60, 399–408.
Green, M. C., Szymanski, J., Speed, M., and Penryn, U. (2016). “Assessing the Suitability of the Magnitude Slope Deviation Detection Criterion for Use in Automatic Acoustic Feedback Control,” in Proceedings of the 19th International Conference on Digital Audio Effects (DAFx-16), 85–92.
Habets, E. A. (2006). Room Impulse Response Generator. Technische Universiteit Eindhoven, Tech. Rep. 2.
Liang, R., Wang, X., Wang, Q., and Zou, C. (2017). A Joint echo Cancellation Algorithm for Quick Suppression of Howls in Hearing Aids. IEEJ Trans. Elec Electron. Eng. 12, 565–574. doi:10.1002/tee.22412
Nakagawa, C. R. C., Nordholm, S., and Yan, W.-Y. (2012). “Dual Microphone Solution for Acoustic Feedback Cancellation for Assistive Listening,” in 2012 IEEE International Conference on Acoustics, Speech and Signal Processing (ICASSP), Kyoto, Japan, March (IEEE), 149–152. doi:10.1109/ICASSP.2012.6287839
Ortega, A., Lleida, E., and Masgrau, E. (2005). Speech Reinforcement System for Car Cabin Communications. IEEE Trans. Speech Audio Process. 13, 917–929. doi:10.1109/TSA.2005.853006
Reuven, G., Gannot, S., and Cohen, I. (2007). Joint Noise Reduction and Acoustic echo Cancellation Using the Transfer-Function Generalized Sidelobe Canceller. Speech Commun. 49, 623–635. doi:10.1016/j.specom.2006.12.008
Shynk, J. J. (1992). Frequency-domain and Multirate Adaptive Filtering. IEEE Signal. Process. Mag. 9, 14–37. doi:10.1109/79.109205
Van Waterschoot, T., and Moonen, M. (2009). “Assessing the Acoustic Feedback Control Performance of Adaptive Feedback Cancellation in Sound Reinforcement Systems,” in 2009 17th European Signal Processing Conference (IEEE), 1997–2001.
Van Waterschoot, T., and Moonen, M. (2010). Fifty Years of Acoustic Feedback Control: State of the Art and Future Challenges. Proc. IEEE 99, 288–327.
Wang, X., Benesty, J., Huang, G., Chen, J., and Cohen, I. (2019). “Design of Kronecker Product Beamformers with Cuboid Microphone Arrays,” in Proceedings Of The 23rd International Congress On Acoustics (Universitätsbibliothek der RWTH Aachen).
Keywords: speech reinforcement, howling control, howling detection and cancellation, dual microphone, automatic gain control, in-car communication, Pareto optimization, microphone constellation
Citation: Alkaher Y and Cohen I (2022) Dual-Microphone Speech Reinforcement System With Howling-Control for In-Car Speech Communication. Front. Sig. Proc. 2:819113. doi: 10.3389/frsip.2022.819113
Received: 20 November 2021; Accepted: 17 February 2022;
Published: 11 March 2022.
Edited by:
Sebastian Braun, Microsoft, United StatesCopyright © 2022 Alkaher and Cohen . This is an open-access article distributed under the terms of the Creative Commons Attribution License (CC BY). The use, distribution or reproduction in other forums is permitted, provided the original author(s) and the copyright owner(s) are credited and that the original publication in this journal is cited, in accordance with accepted academic practice. No use, distribution or reproduction is permitted which does not comply with these terms.
*Correspondence: Yehav Alkaher, eWVoYXZhQGNhbXB1cy50ZWNobmlvbi5hYy5pbA==; Israel Cohen , aWNvaGVuQGVlLnRlY2huaW9uLmFjLmls