 Shaik Benarjee
 Vaegae Naveen Kumar
- School of Electronics Engineering, Vellore Institute of Technology, Vellore, India
Introduction: Identifying protein-coding regions in eukaryotic Deoxyribonucleic acid (DNA) remains difficult due to the sparse and uneven distribution of exons.
Methods: This work focusses into four static encoding schemes—integer, Voss, paired numeric, and Electron-Ion Interaction Potential (EIIP) to improve exon prediction using genomic signal processing. Two benchmark sequences, Caenorhabditis elegans Cosmid F56F11.4 and Mouse apolipoprotein A-IV (M13966.1), were analyzed in MATLAB. A Cauer (elliptic) band-pass filter was used to isolate the period-3 component, and a Blackman-Harris window was utilised to reduce spectral leakage. The elliptic filter in conjunction with EIIP-based encoding achieved the most distinct separation between coding and non-coding areas among the assessed techniques, identifying every exon segment with a minimal amount of noise.
Results and discussion: The technique obtained 84% sensitivity, 96% specificity, and 94% accuracy on the C. elegans Cosmid sequence and 86.5% sensitivity, 93% specificity, and 91% accuracy on the M13966.1 gene sequence.
Conclusion: These results show that the EIIP, Cauer filter and Blackman-Harris windowing framework offers a reliable and effective method for identifying exons.
1 Introduction
All living things are made up of cells, which serve as the fundamental structural and functional building blocks for functions including growth, energy conversion, and genetic information storage. Broadly, cells are classified into two major types: prokaryotic cells and eukaryotic cells. Prokaryotic cells, like bacteria and archaea, have cytoplasm that freely contain their genetic material and no membrane-bound nucleus or other organelles. Eukaryotic cells, by contrast, are more complex, containing membrane-bound organelles including the nucleus, where a molecule known as DNA resides in the cells of all living organisms, serving as a blueprint for life that provides instructions on how to grow, develop, function, and reproduce.
An individual DNA molecule is made up of two chains of nucleotides arranged in a double helix structure, which has a sugar-phosphate backbone and a nitrogenous base: adenine (A), thymine (T), guanine (G) and cytosine (C). Within a vast landscape of DNA, genes are considered functional units, and these are the segments of DNA that encode specific instructions for synthesizing proteins (Sekhar Sahu and Panda, 2011).
Genes are composed of two main types of sequences: exons and introns. The exons in genes contain the information necessary to produce proteins, while introns are non-coding regions interspersed among exons (Fickett and Tung, 1992; Fickett, 1996; Vaidyanathan and Yoon, 2004). To understand gene expression and regulation, it is crucial to distinguish between exons and introns. While exons directly contribute to protein synthesis, introns were thought to be non-functional “junk” DNA. A key feature of exons is the three-base periodicity, where nucleotides repeat in codon triplets, producing a distinct spectral peak at frequency 1/3 that helps differentiate exons from introns.
As shown in Figure 1, introns are removed from genes during the splicing process to produce the final set of instructions for the protein (Kar et al., 2019). A study of DNA sequences and gene structures in the field of computational biology and bioinformatics has led to several encoding methods aimed at representing DNA sequences in a way that can be analyzed computationally. These encoding methods range from simple mappings of nucleotides to integers (Yu et al., 2018; Ahmad et al., 2017; Das and Turkoglu, 2016) or binary representations (Mabrouk, 2017; Abbas et al., 2021; Lio and Vannucci, 2000; Raman Kumar and Kumar, 2019; Deng et al., 2021; Zhang et al., 2019) to more sophisticated methods involving machine learning algorithms (Ranawana and Palade, 2004), and signal processing techniques (Kar et al., 2019). Encoding methods aim to convert the four-letter DNA alphabet (A, T, G, C) into numerical or binary representations that can be processed using algorithms and computational methods (Anastassiou, 2001; Pasquier et al., 1998; Fickett, 1998). These encoding methods play a crucial role in various applications, including sequence alignment (Chao et al., 2022) and gene prediction (Das et al., 2020; Zheng et al., 2021; Kar and Ganguly, 2023; Hassan et al., 2024; Benarjee and Kumar Vaegae, 2025; Marhon and Kremer, 2016).
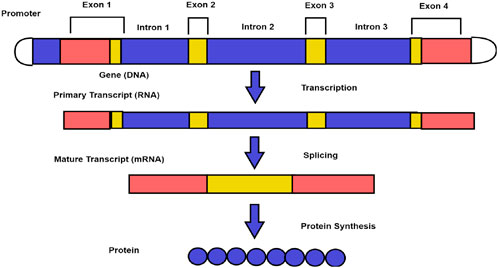
Figure 1. Eukaryotic protein-coding process involving genes (Kar et al., 2019).
Static and dynamic encoding methods are two broad categories of encoding methods used in computational biology and bioinformatics to represent genetic information, particularly DNA sequences. Every nucleotide in the sequence is given a constant numerical value in static encoding, regardless of its location or context. In contrast, dynamic encoding methods adapt the numerical assignment based on sequence context, codon position, structural information, or statistical properties. In this paper, static encoding methods have been discussed.
Static encoding methods are preferred in genomic signal processing for their consistency, simplicity, and efficiency (Mabrouk, 2017; Kwan and Bai Arniker, 2009). They provide a standardized representation of genetic data, facilitating comparison across studies and minimizing processing errors. Their straightforward nature ensures computational efficiency and compatibility with existing tools, essential for seamless integration and analysis. Static encoding also supports reproducibility, allowing research findings to be verified, and offers storage efficiency with fixed-length representations, making large dataset management practical. These techniques are ideal for real-time applications and systems with limited computational power, offering good compression for predictable data patterns and ensuring compatibility across different systems.
Static encoding schemes are fixed mappings or transformations that convert data into a specific format, which remains constant over time and context (Das and Turkoglu, 2018). In the context of computational biology and bioinformatics, static encoding schemes are used to represent genetic information, such as DNA sequences, in a consistent and predefined manner. These encoding schemes typically involve assigning numerical values, binary representations, or symbolic codes to each element of the data, allowing for efficient processing and analysis. As static encoding schemes can be easily implemented and interpreted, they are ideal for applications where the data representation does not need to adapt to changing conditions. The goal of static encoding methods is to encode DNA sequences into numerical or binary formats, thus simplifying computational analysis, enabling pattern recognition, and enhancing the efficiency of genetic data storage, retrieval, and processing.
These methods can vary in their approaches and applications: The integer encoding method assigns a unique integer to each nucleotide, with A = 1, G = 3, T = 2, and C = 4 (Tenneti and Vaidyanathan, 2019). This method is easy to implement and useful for basic sequence analysis and visualization, though it does not capture nucleotide relationships or higher-order structures. Binary vectors representing categorical data are created using the Voss encoding method, in which each category is represented by a distinct binary vector with all other bits set to 0 and only 1 bit set to 1 (Voss, 1992). Voss encoding provides a clear distinction between different nucleotides, making it widely used in machine learning applications for sequence analysis. However, this method increases the dimensionality of the data, which can lead to higher computational costs, especially for large sequences.
Paired numeric encoding (Das and Turkoglu, 2016) categorizes nucleotides into purines (A, G) and pyrimidines (C, T), mapping purines to one and pyrimidines to −1. It simplifies sequence analysis but loses detailed information about individual nucleotides. Using the Electron-Ion Interaction Potential (EIIP) encoding, nucleotides are assigned numerical values based on their electron-ion interaction potential, such as G = 0.0806, A = 0.1260, T = 0.1335 and C = 0.1340 (Nair et al., 2006). These methods capture biochemical properties of nucleotides, making it useful for studying DNA-protein interactions and other biochemical phenomena. Although it is less intuitive than simpler encoding schemes and specific to certain types of analyses, EIIP encoding remains a popular choice due to its ability to incorporate biochemical properties and provide valuable insights into molecular interactions. The generalized block diagram for the static encoding methods is depicted in Figure 2.
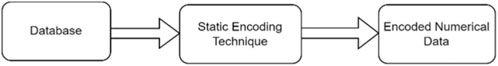
Figure 2. Conversion of character sequences into numerical sequences.
In this work, two benchmark sequences, namely, F56F11.4 and M13966.1 from National Center for Biological Information (NCBI) are used. A combination of static encoding methods, Cauer filter followed by Blackman Harris windowing technique are introduced. The various encoding methods used in this work are integer, paired numeric, Voss and EIIP. These methods are used to identify protein-coding regions, by highlighting their respective characteristic properties of coding sequences.
A Cauer filter is a type of digital filter used to isolate specific frequency components in a signal help to distinguish protein-coding regions by filtering out irrelevant frequency noise from genetic data. This is followed by the Blackman-Harris window which minimizes spectral leakage, enhancing the clarity of frequency components in genetic sequences. This is useful for identifying protein-coding regions more accurately. The performance characteristics, mainly accuracy, specificity, sensitivity, and AUC values are evaluated for each combination, and the best combination is inferred.
In this paper, the following sections are presented: Section 1 introduces static encoding methods. Section 2 describes the proposed methodology, whereas Section 3 outlines simulation results using MATLAB and Section 4 provides the conclusion of the work.
2 Methodology
Figure 3 depicts the generalized block diagram for the prediction of coding regions. The methodology consists of obtaining data from NCBI resources, applying static type of encoding to convert the character sequence of data to the numerical form. The data filtered by Cauer filter to obtain the power spectrum. This is followed by Blackman Harris windowing to reduce edge effects and finally perform thresholding to isolate significant data points. Each step was carefully designed to ensure the integrity and quality of the data, enabling robust and reliable analysis.
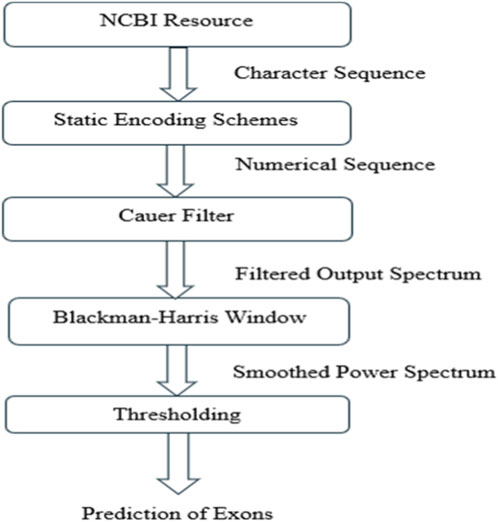
Figure 3. Methodology of the Proposed work.
2.1 NCBI resource
This paper focuses on static encoding methods for the prediction of protein-coding regions. For analysis, a dataset of Caenorhabditis elegans Cosmid F56F11.4 (with accession number FO081497) (NIH, 2022) and Mouse apolipoprotein A-IV gene (M13966.1) (NCBI, 2025) were collected from the NCBI resource. The information regarding the gene sequences listed in Table 1.
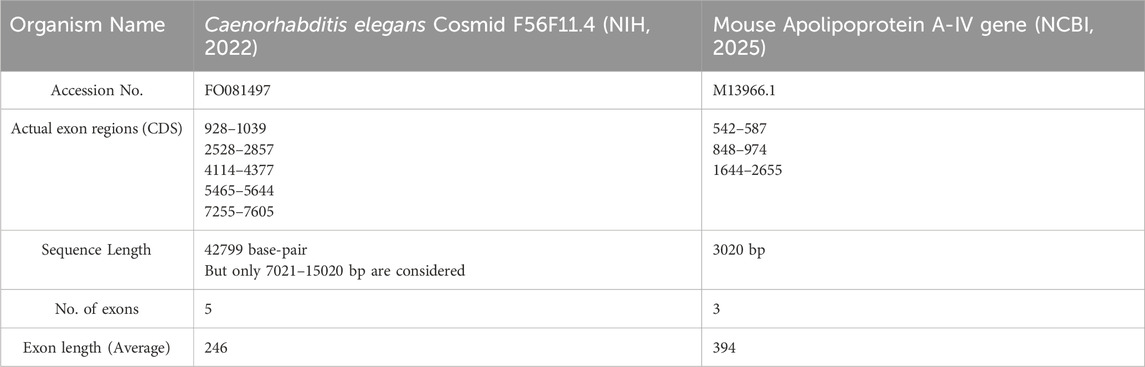
Table 1. The details of the database.
2.2 Static encoding methods
To ensure consistent and reliable data processing, a static type of encoding was applied to the datasets. This method involves converting biological sequences or numerical data into a fixed encoding scheme that maintains uniformity across all samples. In this paper four static types of gene encoding methods were considered: Voss encoding, integer, paired-numeric and EIIP. The types of static encoding techniques and assigned numeric values to the nucleotides are listed in Table 2.
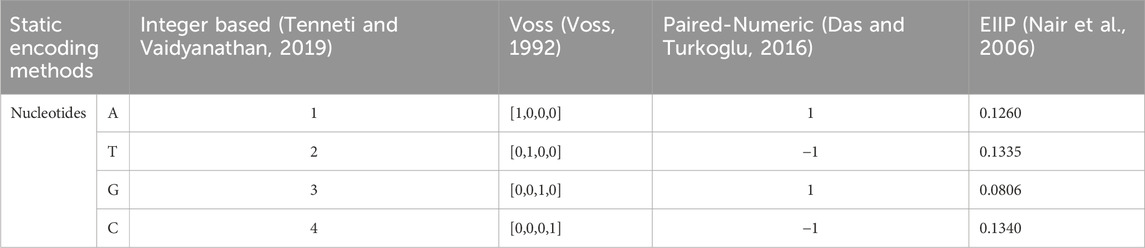
Table 2. Details of static encoding methods.
2.3 Elliptic or cauer filter
In order to filter the signals, an elliptic or Cauer filter was used. Cauer filters are distinguished by their minimum ripple in the passband and stopband, as well as their sharp cutoff characteristics.
This filter was created with certain parameters (such as attenuation levels, ripple, and cut-off frequencies) that were adapted to the needs of the data being examined.
Removing undesired noise (Kar and Ganguly, 2022) and enhancing the signal quality were the main goals of applying the Cauer filter. Table 3 presents specifications of the Cauer filter.
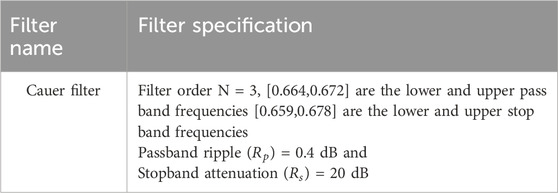
Table 3. The filter specifications for exon prediction.
2.4 Blackman-Harris windowing (BH)
Blackman-Harris windowing is used in digital signal processing to reduce spectral leakage during Fourier transforms. The general form for the symmetric four-term Blackman-Harris window is given in Equation 1.
Using Equation 2, we can determine the periodic four-term Blackman-Harris window of length N.
Where n is a sample index, N refers to total number of samples, and
A BH window of length 61 was applied to the elliptic-filtered signal to smooth the power spectrum. The window effectively slides across the signal at each nucleotide position, creating smooth transitions between adjacent points, which is equivalent to full overlap. This smoothing emphasizes the period-3 component of coding regions while reducing noise from non-coding regions. The window length was chosen to balance smoothing and resolution. A longer window would further reduce noise but might blur short exons, while a shorter window could preserve sharp features but allow more fluctuations.
The BH window was selected for its low side-lobe characteristics, minimizing spectral leakage and preserving exon boundaries better than simpler windows such as rectangular or Hamming. While the BH window is not universally superior, but in combination with the Elliptic filter, it provides the clearest distinction between coding and non-coding regions for our mapped signal data.
2.5 Thresholding (Th)
Thresholding is the last phase in the methodology, which is a mechanism for locating important characteristics or data points in the processed signal. A threshold percentile range between 1% and 99% was used to compare parameters of implemented methods (Kumar Hota and Srivastava, 2010; Zhang et al., 2014).
Thresholding was performed by setting a predefined threshold value of 0.2, above which data points are considered significant and below which they are discarded as noise or insignificant variations. The threshold value of 0.2 was chosen based on Equation 3 to distinguish between coding and non-coding regions in the genomic signal, optimizing for metrics like sensitivity, specificity and accuracy.
The period three values derived from introns and exons are denoted by
2.6 Performance metrics
In the context of genomic signal processing (GSP), especially for DNA exon–intron classification or exon prediction, we deal with four outcomes: True_Negative (TN), True_Positive (TP), False_Positive (FP), and False_Negative (FN). Table 4 shows a clear summary explaining these concepts in context of classification. TP (True Positive) presents correctly predicted exon positions and FP (False Positive) measures incorrectly predicted exon positions. TN (True Negative) interprets correctly predicted intron positions and FN (False Negative) measures missed exon positions.

Table 4. Confusion matrix in the context of classification.
The performance metrics used to assess the effectiveness of gene encoding methods are presented in Table 5. The true positive rate (TPR) is a proportion of true exon bases/regions correctly predicted. It is given as
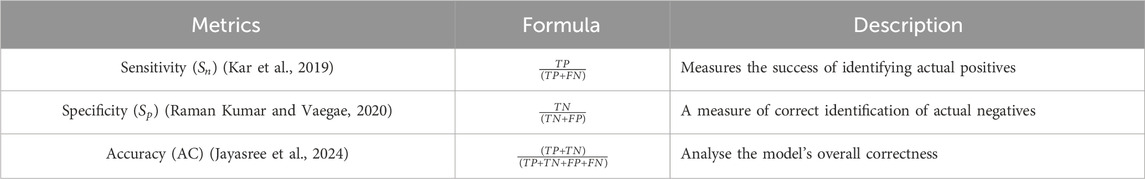
Table 5. Performance metrics and its description.
The false positive rate (FPR) is a proportion of intronic bases/regions that are wrongly predicted as exons. It is given as
Specificity (
3 Results
In this section, the results are presented for (a) F56F11.4 (b) M13966.1 (c) Using DSP filters and (d) HMR195 dataset respectively.
3.1 Using F56F11.4 gene sequence
In this work, the four static gene encoding schemes are applied to the gene sequence of F56F11.4, and the output spectrum was represented as peaks by three-base periodicity (TBP) regions. Dotted lines show the actual location of exons; continuous lines show the predicted locations of exons and introns.
In Figure 4, it can be observed that the integer encoding method failed to detect the first peak properly corresponding to nucleotide positions 928–1039, because the predicted exon was shifted right and has more number of introns. In the Voss encoding method, the five predicted exons are above the x-axis and also has more introns which are present above the threshold

Figure 4. Spectrums of a gene sequence C. Elegans (F56F11.4) using various static encoding schemes. (a) Voss method (b) Integer method (c) Paired-Numeric and (d) EIIP mapping method (Proposed method).
It's inevitable that every mapping method has extra peaks at undesired places in the spectrum due to noise from non-coding regions (introns). Eliminating noise can make the approach more accurate. The mathematical descriptor used in the EIIP method has suppressed the noise and detected all the five coding regions. From the output spectrum, it can be concluded that out of the four encoding methods, the EIIP method provides the best mathematical description and classification of exons and introns. Step by step simulation results of our proposed work using F56F11.4 as shown in Figure 5.

Figure 5. Step by step process of our Proposed method using F56F11.4 gene sequence.
The step-by-step process of the proposed method (EIIP + Cauer filter + BH windowing) is presented as:
1. Raw sequence visualization–A small portion (15 bases out of ∼8,000 bp in F56F11.4) is plotted to show the nucleotide arrangement. This gives a simple visual of the DNA character string.
2. Numerical mapping (EIIP) – The nucleotide sequence is converted into a numerical signal using EIIP values (G = 0.0806, T = 0.1335, C = 0.1340, A = 0.1260). This enables digital signal processing.
3. Ground-truth exon regions–The EIIP signal is displayed with annotated coding regions (CDS) taken from NCBI for the F56F11.4 gene. This provides a biological reference for validation.
4. Elliptic (Cauer) filter spectrum–The numerical signal is processed with an elliptic band-pass filter centered at the period-3 frequency. The resulting spectrum highlights periodicity associated with coding regions.
5. Blackman-Harris windowed spectrum–A power spectrum is computed with a BH window to improve frequency resolution and reduce spectral leakage. This forms the proposed method’s feature spectrum.
6. Smoothed final spectrum–The BH output is smoothed to emphasize true peaks corresponding to exons while suppressing noise, yielding the final exon prediction profile.
Table 6 provides a comparison of the numerical mapping methods used in this work. It demonstrates that the proposed approach provides specificity 96%, sensitivity 84%, accuracy 94% and Area under Curve (AUC) 95%, while other mapping methods give lower metrics. Figure 6 gives the Receiver Operating Characteristics (ROC) plots of static encoding methods for the gene sequence F56F11.4. The nucleotide ranges for exon measured using EIIP mapping method for the sequence F56F11.4 at a threshold of 0.2 is tabulated in Table 7.
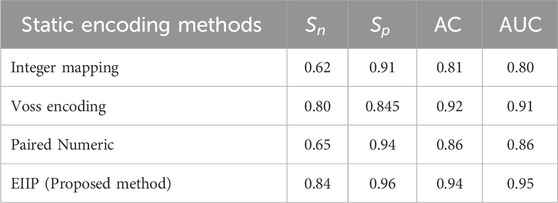
Table 6. Comparison of various static encoding methods using F56F11.4 gene sequence.
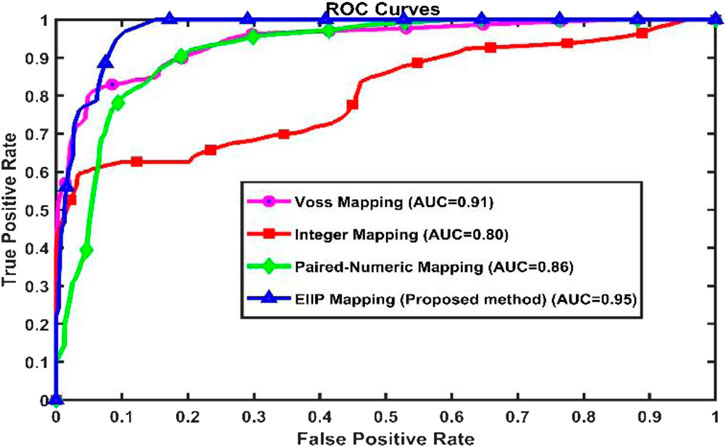
Figure 6. Receiver Operating Characteristic plots of various static encoding methods for the gene sequence F56F11.4.

Table 7. Range of nucleotides in coding areas utilising the EIIP mapping approach (F56F11.4 gene sequence).
AUC and ROC were adopted to validate a classification of introns and exons in gene sequences (Fawcett, 2006). In terms of False_Positive, ROC curve is 1-Specificity for a threshold of used for classification. AUC values close to one are supposed to provide good classification accuracy. From Table 6 it can be observed that the proposed method shows a better AUC value of 95% for the classification of exons.
Sensitivity, specificity, accuracy and AUC values of the proposed method are compared with other existing encoding methods are listed in Table 8. Performance metrics of proposed method using different windowing techniques like rectangular, Hamming, Hanning and BH are listed in Table 9. Compared to existing windowing strategies, our proposed method yields better performance metrics.
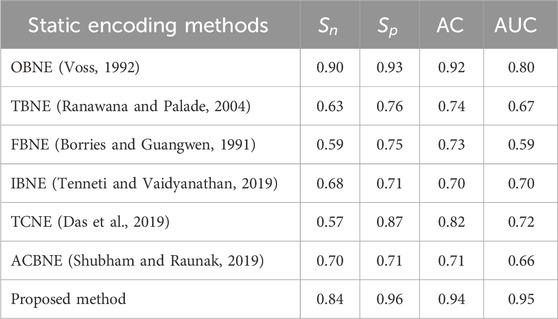
Table 8. Comparison of the proposed method with existing encoding methods based on performance metrics.

Table 9. Performance metrics of different windowing techniques using F56F11.4 gene sequence for proposed method.
3.2 Using M13966.1 gene sequence
Similarly, the four static gene encoding methods are applied to the gene sequence of M13966.1 for cross validation of our proposed approach. The output spectrum is represented as shown in Figure 7. ROC curves of static encoding methods using M13966.1 gene sequence is shown in Figure 8 and Table 10 gives the performance metrics using M13966.1 gene sequence.

Figure 7. Spectrums of a gene sequence Mouse apolipoprotein A-IV gene (M13966.1) using various static encoding schemes. (a) Integer method (b) Voss method (c) Paired-Numeric and (d) EIIP mapping method (Proposed method).
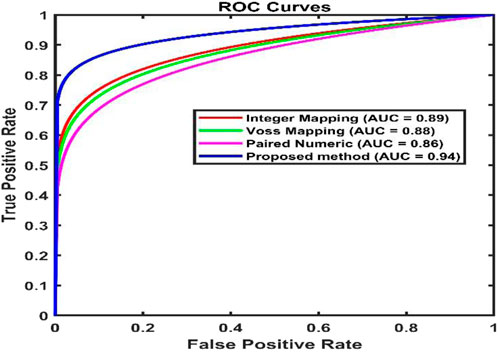
Figure 8. ROC curves of static mapping methods using M13966.1 gene sequence.
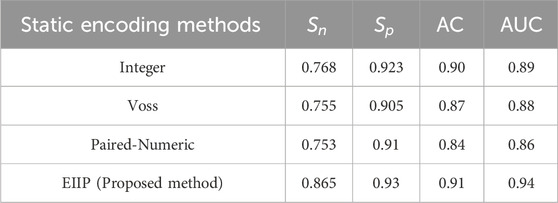
Table 10. The following table shows a comparison of various numerical mapping methods using M13966.1 gene sequence.
3.3 DSP tools
The effectiveness of various DSP filtering techniques that were simulated to enhance the identification of protein-coding areas in DNA sequences is displayed in Figure 9.

Figure 9. Comparison of different DSP techniques for exon prediction in DNA sequences using (a) Parks–McClellan filter, (b) Least-Squares filter, (c) Butterworth filter, (d) ST-DFT with rectangular window, (e) Singular Value Decomposition (SVD), (f) Chebyshev-II filter, and (g) Elliptic filter or Cauer filter (Proposed method).
Each filter was designed with specific parameters to optimize frequency response and minimize spectral noise. The Parks-McClellan filter (order = 216, passband ripple = 0.4 dB, stopband attenuation = 30 dB) provides an equiripple response with reasonably clear peaks, although some residual noise persisted. The Least Squares filter (order = 231, stopband cutoff = [0.65, 0.68]) tries to minimize the mean squared error in the frequency domain, but exhibited broader, less distinct peaks, indicating limited localization accuracy.
Similarly, the Butterworth filter (order = 6, passband ripple = 0.4 dB, stopband attenuation = 30 dB) offers a smooth frequency response, but the resulting signal showed reduced peak sharpness and contrast. The Short-Time DFT using a rectangular window and Singular Value Decomposition (SVD) approaches were employed to capture transient signals and reduce noise, respectively; however, both methods led to dispersed or attenuated peaks, suggesting lower discriminative capability.
The Chebyshev Type II filter (order = 4, passband cutoff = [0.664, 0.672]) produces relatively sharp peaks, but with some misalignment and moderate noise leakage. In contrast, the Elliptic filter (proposed method) demonstrates superior performance, producing sharp, well-defined peaks with precise alignment with the annotated coding regions (red dashed lines). This filter’s ability to maintain low passband ripple and sharp transition bands contributed to its effectiveness in isolating biologically relevant signals.
Overall, the proposed method proved to be the most effective among the other DSP methods, achieving high fidelity in identifying coding regions while effectively suppressing non-coding noise.
Performance metrics of DSP tools are listed in Table 11 and ROC curves are given in Figure 10. Table 12 gives the AUC value of DSP methods. The proposed method exhibits superior performance compared to all existing methods.
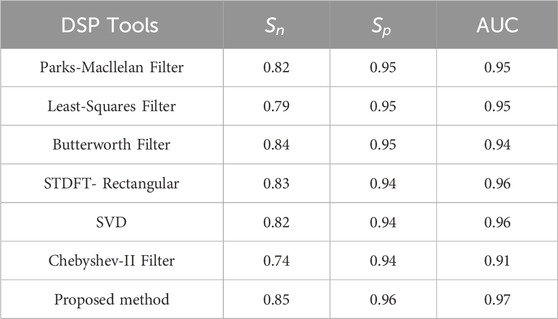
Table 11. Performance metrics of DSP tools using F56F11.4 gene sequence.

Figure 10. ROC curves of DSP tools using F56F11.4 gene sequence.
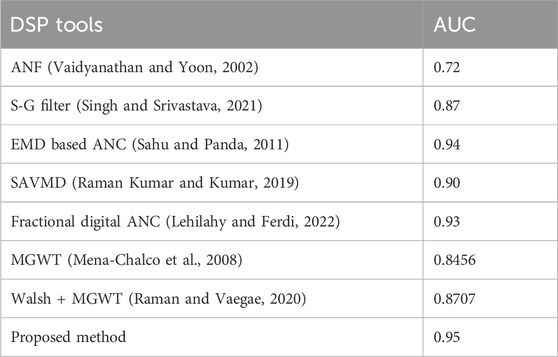
Table 12. AUC value of Proposed method using F56F11.4 gene sequence against other DSP tools.
3.4 Using HMR195 dataset
Additionally, we are using the HMR195 dataset to validate our proposed approach. With a distribution of 103 human, 82 mouse, and 10 rat sequences, the HMR195 dataset (Sanja Rogic, 2008) includes 195 genomic sequences from human, mouse, and rat species. These sequences have an average length of 7,096 base pairs (bp).
With 152 multi-exon genes and 43 single-exon genes, the collection contains both types of genes. There are typically 4.86 exons per gene. All the sequences put together have a length of about 1,386,021 bp. ROC analysis was used to assess the proposed method’s performance on the HMR195 dataset. This can be seen in Figure 11. The AUC values of the suggested approach are compared with those of other static methods in Table 13.
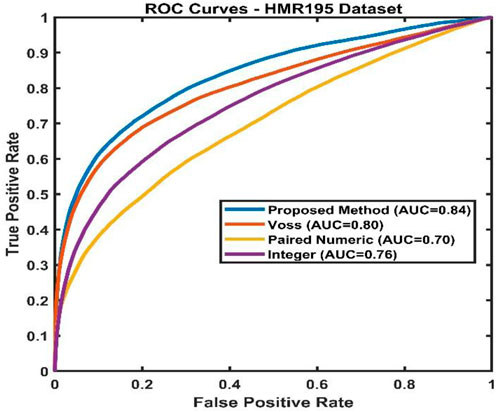
Figure 11. ROC curves of static encoding methods using HMR195 dataset.
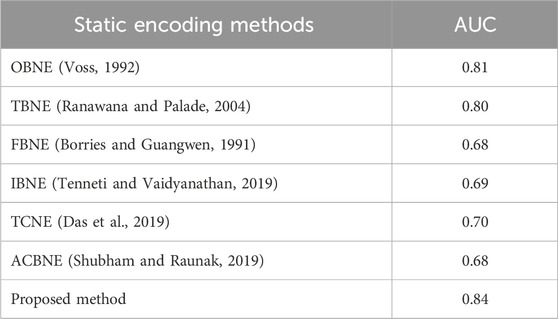
Table 13. Comparison of AUC value of Proposed method with other existing methods using HMR195 dataset.
4 Discussion
In bioinformatics, accurately analyzing and interpreting DNA sequences is crucial for understanding genetic functions and variations. To facilitate this analysis, DNA sequences are often converted into numerical formats using encoding methods. Among various methods, static encoding schemes are widely used due to their simplicity and consistency.
Static encoding methods for DNA sequences assign fixed numerical values to nucleotides, making the encoding process straightforward and consistent. These methods do not change based on the sequence context, ensuring uniformity across different analysis. Examples include the integer method (Tenneti and Vaidyanathan, 2019), which assigns unique integers to each nucleotide, Voss method (Voss, 1992), which encodes DNA sequences using numerical values based on the occurrence of specific nucleotides.
The paired numeric method (Das and Turkoglu, 2016), considers pairs of nucleotides for encoding and the EIIP method (Nair et al., 2006), uses electron-ion interaction potentials to represent nucleotides numerically. These methods are simple to implement and provide a foundation for more complex analyse. These methods are particularly useful for initial stages of DNA analysis.
The comparative analysis of different numerical mapping techniques—Integer mapping, Voss mapping, Paired-Numeric mapping and the proposed EIIP mapping reveals notable differences in their ability to accurately identify protein-coding regions in DNA sequences. In both the datasets shown, the proposed method (Figures 4D, 7D) exhibits clear and more distinct peaks that align closely with the known coding regions, marked by red dashed lines. Unlike the Integer and Voss mappings, which often produce spurious or low-amplitude peaks in non-coding regions, the EIIP approach minimizes such noise, thereby improving the signal-to-noise ratio. The Paired-Numeric mapping, while producing multiple peaks, lacks clarity and selectivity in comparison to the EIIP method. These findings suggest that EIIP mapping with Cauer filter and BH windowing offer enhanced discriminatory power for identifying biologically significant regions in genomic sequences, making it a more reliable method for gene prediction and related bioinformatics applications.
5 Conclusion and future scope
In this work, the performance of four static gene encoding schemes mainly integer, Voss, paired-numeric and EIIP was evaluated using both the gene sequences: F56F11.4 of Caenorhabditis elegans and Mouse apolipoprotein A-IV gene (M13966.1) The spectral analysis of EIIP encoding method, combined with the Cauer filter and BH windowing technique, demonstrated superior performance in identifying exon regions by enhancing spectral resolution and minimizing noise interference. This combination proved more effective than other encoding methods in distinguishing coding from non-coding regions. Also, the proposed method is validated with other DSP techniques and HMR195 dataset. Future work could focus on further improving prediction accuracy by integrating additional structural and chemical features. Exploring the method’s application to other genomic areas, such as gene origin prediction and hotspot detection, could also provide valuable insights.
Data availability statement
The original contributions presented in the study are included in the article/Supplementary Material, further inquiries can be directed to the corresponding author.
Author contributions
SB: Investigation, Writing – review and editing, Software, Data curation, Conceptualization, Visualization, Formal Analysis, Writing – original draft, Methodology, Validation. VK: Formal Analysis, Validation, Visualization, Project administration, Conceptualization, Supervision, Software, Investigation, Resources, Writing – review and editing.
Funding
The authors declare that no financial support was received for the research and/or publication of this article.
Acknowledgements
The authors thank VIT Vellore for providing the facilities to conduct this research work.
Conflict of interest
The authors declare that the research was conducted in the absence of any commercial or financial relationships that could be construed as a potential conflict of interest.
Generative AI statement
The authors declare that no Generative AI was used in the creation of this manuscript.
Any alternative text (alt text) provided alongside figures in this article has been generated by Frontiers with the support of artificial intelligence and reasonable efforts have been made to ensure accuracy, including review by the authors wherever possible. If you identify any issues, please contact us.
Publisher’s note
All claims expressed in this article are solely those of the authors and do not necessarily represent those of their affiliated organizations, or those of the publisher, the editors and the reviewers. Any product that may be evaluated in this article, or claim that may be made by its manufacturer, is not guaranteed or endorsed by the publisher.
Supplementary material
The Supplementary Material for this article can be found online at: https://www.frontiersin.org/articles/10.3389/frsip.2025.1679555/full#supplementary-material
References
Abbas, Z., Tayara, H., and Chong, K.To (2021). 4mCPred-CNN—Prediction of DNA N4-Methylcytosine in the mouse genome using a convolutional neural network. Genes 12 (2), 296. doi:10.3390/genes12020296
Ahmad, M., Jung, L. T., and Bhuiyan, A.-A. (2017). From DNA to protein: why genetic code context of nucleotides for DNA signal processing? A review. Biomed. Signal Process. Control 34, 44–63. doi:10.1016/j.bspc.2017.01.004
Anastassiou, D. (2001). Genomic signal processing. IEEE Signal Process. Mag. 18 (4), 8–20. doi:10.1109/79.939833
Benarjee, S., and Kumar Vaegae, N. (2025). Hadamard code based numerical mapping approach for the identification of protein coding regions in genomic sequences using digital filters. Comput. Biol. Med. 195, 110565. doi:10.1016/j.compbiomed.2025.110565
Borries, D., and Guangwen, Z. (1991). Neural network optimization for e.coli promoter prediction. Nucleic Acids Res. 19, 1593–1599. doi:10.1093/nar/19.7.1593
Chao, J., Tang, F., and Xu, L. (2022). Developments in algorithms for sequence alignment: a review. A Rev. 12 (4), 546. doi:10.3390/biom12040546
Das, B., and Turkoglu, I. (2018). A novel numerical mapping method based on entropy for digitizing DNA sequences. Appl. 29 (8), 207–215. doi:10.1007/s00521-017-2871-5
Daş, B., and Türkoğlu, İ. (2016). Classification of DNA sequences using numerical mapping techniques and Fourier transformation. J. Fac. Eng. Archit. Gazi Univ. 31 (4) 921–932. doi:10.17341/gazimmfd.278447
Das, L., Nanda, S., and Das, J. K. (2019). An integrated approach for identification of exon locations using recursive Gauss Newton tuned adaptive Kaiser window. Genomics 111 (3), 284–296. doi:10.1016/j.ygeno.2018.10.008
Das, L., Das, J. K., and Nanda, S. (2020). Detection of exon location in eukaryotic DNA using a fuzzy adaptive Gabor wavelet transform. Genomics 112 (6), 4406–4416. doi:10.1016/j.ygeno.2020.07.020
Deng, L., Wu, H., Liu, X., and Liu, H. (2021). DeepD2V: a novel deep learning-based framework for predicting transcription factor binding sites from combined DNA sequence. Int. J. Mol. Sci. 22 (11), 5521. doi:10.3390/ijms22115521
Fawcett, T. (2006). An introduction to ROC analysis. Pattern Recognit. Lett. 27, 861–874. doi:10.1016/j.patrec.2005.10.010
Fickett, J. W. (1998). Finding genes b computer: (1998).The state of the art. Trends Genet. 12 (8), 316.
Fickett, J. W. (1996). The gene identification problem: an overview for developers. Comput. Chem. 20, 103–118. doi:10.1016/s0097-8485(96)80012-x
Fickett, J. W., and Tung, C. S. (1992). Assessment of protein coding measures. Nucleic Acids Res. 20 (24), 6441–6450. doi:10.1093/nar/20.24.6441
Hassan, E. S., Dessouky, A. M., Fathi, H., Salama, G. M., Oshaba, A. S., El-Emary, A., et al. (2024). Enhancing speaker identification through reverberation modeling and cancelable techniques using ANNs. Curr. Bioinforma. 19, e0294235. doi:10.1371/journal.pone.0294235
Jayasree, K., Hota, M. K., Dwivedi, A. K., Ranjan, H., and Srivastava, V. K. (2024). Identification of exon regions in eukaryotes using fine-tuned variational mode decomposition based on kurtosis and short-time discrete Fourier transform. Nucleosides, Nucleotides and Nucleic Acids 1–24. doi:10.1080/15257770.2024.2388785
Kar, S., and Ganguly, M. (2022). Study of effectiveness of FIR and IIR filters in Exon identification: a comparative approach. Mater. Today Proc. 58, 437–444. doi:10.1016/j.matpr.2022.02.394
Kar, S., and Ganguly, M. (2023). An efficient way of identification of protein coding regions of eukaryotic genes using digital FIR filter governed by Ramanujan’s Sum. Int. J. Biomed. Eng. Technol. 43 (2), 152–184. doi:10.1504/ijbet.2023.133795
Kar, S., Ganguly, M., and Das, S. (2019). Using dit-fft algorithm for identification of protein coding region in eukaryotic gene. Yīxué gōngchéng. Applications, basis, Communications/Biomedical engineering: applications. Basis Commun. 31 (01), 1950002. doi:10.4015/s1016237219500029
Kumar Hota, M., and Srivastava, V. K. (2010). Identification of protein-coding regions using Modified Gabor-Wavelet Transform with Signal Boosting Technique. Int. J. Comput. Biol. Drug Des. 3 (4), 259. doi:10.1504/ijcbdd.2010.038391
Kwan, H. K., and Bai Arnikar, S. (2009). Numerical representation of DNA sequences. Int. Conf. Biosci. Biochem. Bioinforma. IPCBEE. doi:10.1109/eit.2009.5189632
Lehilahy, M., and Ferdi, Y. (2022). Identification of exon locations in DNA sequences using a fractional digital anti-notch filter. Biomed. Signal Process. Control 80, 104362. doi:10.1016/j.bspc.2022.104362
Lio, P., and Vannucci, M. (2000). Finding pathogenicity islands and gene transfer events in genome data. Bioinformatics 16 (10), 932–940. doi:10.1093/bioinformatics/16.10.932
Mabrouk, M. S. (2017). Advanced genomic signal processing methods in DNA mapping schemes for gene prediction using digital filters --Gene prediction, digital filters, 3- base periodicity, Exon, Intron, bioinformatics, genomic signal processing. Am. J. Signal Process. 7 (1), 12–24. doi:10.5923/j.ajsp.20170701.02
Marhon, S. A., and Kremer, S. C. (2016). Prediction of protein coding regions using a wide-range wavelet window method. IEEE/ACM Trans. Comput. Biol. Bioinforma. 13 (4), 742–753. doi:10.1109/tcbb.2015.2476789
Mena-Chalco, J., Carrer, H., Zana, Y., and Cesar, R. M. (2008). Identification of protein coding regions using the modified gabor-wavelet transform. IEEE/ACM Trans. Comput. Biol. Bioinforma. 5 (2), 198–207. doi:10.1109/tcbb.2007.70259
Nair, A. S., Sreenadhan, S. P., Nair, A. S., and Sreenadhan, S. P. (2006). A coding measure scheme employing electron-ion interaction pseudopotential (EIIP). Bioinformation 1, 197–202.
NCBI (2025). Mouse apolipoprotein A-IV gene, complete cds, clone Apo4.5. Available online at: https://www.ncbi.nlm.nih.gov/nuccore/M13966.1?report=fasta.
NIH (2022). Caenorhabditis elegans Cosmid F56F11, complete sequence. Available online at: https://www.ncbi.nlm.nih.gov/nuccore/FO081497.1?report=fasta.
Pasquier, C. M., Promponas, V., Varvayannis, N., and Hamodrakas, S. (1998). A web server to locate periodicities in a sequence. Bioinformatics 14 (8), 749–750. doi:10.1093/oxfordjournals.bioinformatics.a011054
Raman, R. K., and Vaegae, N. K. (2020). Walsh code based numerical mapping method for the identification of protein coding regions in eukaryotes. Biomed. Signal Process. Control 58, 101859. doi:10.1016/j.bspc.2020.101859
Raman Kumar, M., and Kumar, V. N. (2019). “A numerical representation method for a DNA sequence using gray code method,” in Advances in intelligent systems and computing, 645–654.
Raman Kumar, M., and Vaegae, N. K. (2020). A new numerical approach for DNA representation using modified Gabor wavelet transform for the identification of protein coding regions. Biocybern. Biomed. Eng. doi:10.1016/j.bbe.2020.03.007
Ranawana, R., and Palade, V. (2004). A neural network based multi-classifier system for gene identification in DNA sequences. Neural Comput. Appl. 14 (2), 122–131. doi:10.1007/s00521-004-0447-7
Sahu, S. S., and Panda, G. (2011). Identification of protein-coding regions in DNA sequences using a time-frequency filtering approach. Genomics, Proteomics and Bioinforma. 9 (1-2), 45–55. doi:10.1016/s1672-0229(11)60007-7
Sanja Rogic (2008). HMR195 dataset. Available online at: https://srogic.wordpress.com/datasets/hmr195-dataset/(Accessed 13 March. 2025).
Sekhar Sahu, S., and Panda, G. (2011). Identification of protein-coding regions in DNA sequences using a time-frequency filtering approach. Genomics Proteomics Bioinforma., 44–55.
Shubham, K., and Raunak, L. (2019). Computational prediction of replication sites in DNA sequences using complex number representation. Quant. Biol. doi:10.48550/arXiv.1909.13751
Singh, A. K., and Srivastava, V. K. (2021). Improved filtering approach for identification of protein-coding regions in eukaryotes by background noise reduction using S–G filter. Netw. Modeling Analysis Health Informatics Bioinformatics 10 (1), 19. doi:10.1007/s13721-021-00293-8
Tenneti, S. V., and Vaidyanathan, P. P. (2019). IMUSIC: a family of MUSIC -like algorithms for integer period estimation. IEEE Trans.Signal Process 67, 367–382. doi:10.1109/tsp.2018.2879039
Vaidyanathan, P. P., and Yoon, N.B.-J. (2002). “Digital filters for gene prediction applications,”, CiteSeer X (The Pennsylvania State University). doi:10.1109/acssc.2002.1197196
Vaidyanathan, P. P., and Yoon, B.-J. (2004). The role of signal-processing concepts in genomics and proteomics. J. Frankl. Inst. 341 (1-2), 111–135. doi:10.1016/j.jfranklin.2003.12.001
Voss, R. F. (1992). Evolution of long-range fractal correlations and 1/f noise in DNA base sequences. Phys. Rev. Lett. 68 (25), 3805–3808. doi:10.1103/physrevlett.68.3805
Yu, N., Li, Z., and Yu, Z. (2018). Survey on encoding schemes for genomic data representation and feature learning—from signal processing to machine learning. Big Data Min. Anal. 1 (3), 191–210. doi:10.26599/bdma.2018.9020018
Zhang, X., Zhao, J., and Xu, W. (2014). “Identification of eukaryotic exons using empirical mode decomposition and modified Gabor-wavelet transform,” in Proceedings of the 33rd Chinese control conference.
Zhang, Q., Shen, Z., and Huang, D.-S. (2019). Modeling in-vivo protein-DNA binding by combining multiple-instance learning with a hybrid deep neural network. Sci. Rep. 9 (1), 8484. doi:10.1038/s41598-019-44966-x
Keywords: blackman-harris windowing, cauer filter, deoxyribonucleic acid, electron-ion interaction potential, exon identification, genomic signal processing, period-3 component, static encoding schemes
Citation: Benarjee S and Kumar VN (2025) A computational approach for prediction of exons using static encoding methods, digital filter and windowing technique. Front. Signal Process. 5:1679555. doi: 10.3389/frsip.2025.1679555
Received: 04 August 2025; Accepted: 13 November 2025;
Published: 27 November 2025.
Edited by:
Muthusamy Govarthanan, Kyungpook National University, Republic of KoreaReviewed by:
Amin Khodaei, University of Tabriz, IranMahery Lehilahy, university MAGIS Madagascar, Madagascar
Copyright © 2025 Benarjee and Kumar. This is an open-access article distributed under the terms of the Creative Commons Attribution License (CC BY). The use, distribution or reproduction in other forums is permitted, provided the original author(s) and the copyright owner(s) are credited and that the original publication in this journal is cited, in accordance with accepted academic practice. No use, distribution or reproduction is permitted which does not comply with these terms.
*Correspondence: Vaegae Naveen Kumar, dmVnZW5hdmVlbkB2aXQuYWMuaW4=