 Tim Granata
 Bernd Rattenbacher1,2
- 1The Science Space Hub and Center for Bioscience and Medical Engineering, Lucerne University of Applied Sciences and Arts, Hergiswil, Switzerland
- 2Biotechnology Space Support Center (BIOTESC) Lucerne University of Applied Sciences and Arts, Hergiswil, Switzerland
- 3Precision Sensing GmbH, Regensburg, Germany
Bioreactors in space have applications from basic science to microbial factories. Monitoring bioreactors in microgravity has challenges with respect to fluidics, aeration, sensor size, sample volume and disturbance of medium and cultures. We present a case study of the development of small bioreactors and a non-invasive method to monitor dissolved oxygen, pH, and biomass of yeast cultures. Two different bioreactor configurations were tested for system volumes of 60 ml and 10.5 ml. For both configurations, the PreSens SFR vario, an optical sensor array, collected data autonomously. Oxygen and pH in the cultures were monitored using chemically doped spots, 7 mm in diameter, that were fixed to the bottom of sampling chambers. Spots emitted a fluorescent signal for DO and pH when reacted with oxygen molecules and hydrogen ions, respectively. Biomass was sensed using light reflectance at centered at 605 nm. The, optical array had three light detectors, one for each variable, that returned signals that were pre- and post-calibrated. For heterotrophic cultures requiring oxygen and respiring carbon dioxide, a hollow fiber filter, in-line with the optical array, oxygenated cells and remove carbon dioxide. This provided oxygen levels that were sufficient to maintain aerobic respiration for steady state conditions. Time series of yeast metabolism in the two bioreactors are compared and discussed. The bioreactor configurations can be easily be modified for autotrophic cultures such that carbon dioxide is enhanced and oxygen removed, which would be required for photosynthetic algal cultures.
Introduction
Yeast is an ideal cell model for space biology since it is a eucaryotic organism with fast growth rates whose metabolism has increasing importance in genomics and systems biology and shares many molecular processes with animals (Botstein et al., 1997; Scannell et al., 2007; Baryshnikova et al., 2010; Botstein and Fink, 2011; Botstein and Fink, 2011). For experiments in space, yeast is usually grown in bioreactors that come in various configurations (Walther 2002). Yeast bioreactors can be operated as batch, batch-fed, and continuous cultures. Batch and batch-fed cultures give unsteady state growth and limit the number of yeast generations produced. This is because as biomass accumulates in the bioreactor nutrients are rapidly depleted and cell growth rates decrease until cells reach the stationary phase when growth ceases. Additionally, as biomass increases oxygen concentrations in the bioreactor can be rapidly depleted causing yeast to depend on anaerobic metabolism, which produces lower growth rates.
In contrast, continuous cultures maintain cells at a steady state growth rate by periodically removing biomass to maintain a constant biomass concentration (Chapra 1997). This has three consequences; since biomass concentration is constant, both nutrient uptake and oxygen respiration remain constant, unlike batch and batch-fed cultures, and growth continues as long as nutrients are supplied. By prolonging growth, continuous cultures can extend the generation times of the population. This is important since many of the genomic studies of space conditions and the effects of radiation and microgravity on cells depend on longer exposures of metabolically active cells. This can only be achieved in continuous cultures. Yet many space bioreactors are based on the batch or batch-fed design where cells accumulate in the bioreactor without dilution (Walther, 2002).
The Space Biology Group, part of the Space Hub (a consortium of the University of Zurich and the Lucerne University of Applied Sciences and Arts), has designed two bioreactor systems to continuously grow cells for numerous generations in small volumes, which is necessary for space applications where nutrient mass and volumes are limited. Theses bioreactors use a novel optical array to monitor cell metabolism in near-real time. This paper is a case study that compares the two bioreactors and their potential for space deployment.
Methods and Set-Up
Yeast Cultures
Cultures of Brewer’s yeast, Saccharomyces cerevisiae (BY4742, MATα his3Δ1 leu2Δ0 lys2Δ0 ura3Δ0) were obtained from Dr. R. Willaert at the University of Brussels, Vrije as part of the PRODEX-ESA project on yeast bioreactors for space applications. Cells were grown in 7.5 g L−1 D-glucose and Synthetic Complete (SC) media, for steady state cultures. The SC media was prepared with yeast nitrogen base (YNB) without amino acids, which were added separately. Inocula was prepared using Yeast Extract-Peptone Dextrose (YPD) with 1% yeast extract (BD 212750) and 2% peptone extract (BD 211677).
For each inoculum, 100 ml of YPD batch culture was grown at 30°C on a shaker (250 rpm). After 16–24 h of incubation, the yeast was transferred to two, 50 ml centrifuge tubes and centrifuged for 10 min at 4,000 rpm to concentrate the inoculum. The YPD was decanted and the remaining cell concentrate washed with SC medium, then vortexed for 20 s and centrifuged again. After three washings, inoculum was prepared by mixing the cell concentrate in 10 ml of SC medium. The volume of inoculum for each bioreactor is given in Table 1 along with bioreactor configurations. It should be noted that even after 24 h, inocula in batch cultures had positive growth rates, although only half of the exponential growth rate.
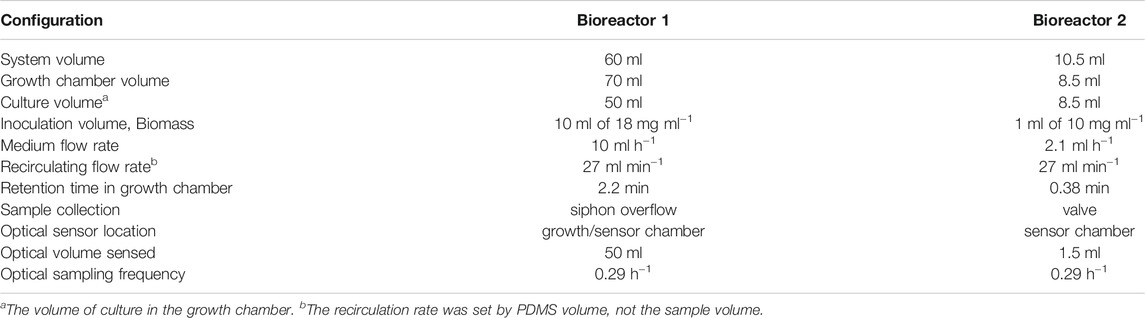
TABLE 1. Configurations of the two bioreactors.
Optical Sensor Array
Metabolic variables were measured using the SFR vario optical array (Figure 1A) by PreSens GmbH to non-invasively and simultaneously sample time series of optical density (OD) for biomass, dissolved oxygen (DO), and pH. To sample DO and pH, the array used chemically treated spots that were autoclavable (PreSens Manual, 2019). The DO spots (SP-PSt3-YAU-D7-YOP) reversely react with oxygen molecules and, when excited by an LED, emitted a fluorescent signal at 505 nm. The pH spots (SP-LG1-V2-D7) reversely react with hydrogen ions and, when excited by an LED, fluoresced at 470 nm. Fluorescence emissions from the spots were measured by photodetectors (Figure 1B). The DO and pH spots were glued to the inside-bottom of each sample chamber (Figure 1C) and left to dry for 24 h, after which they were flushed with filtered de-ionized water.
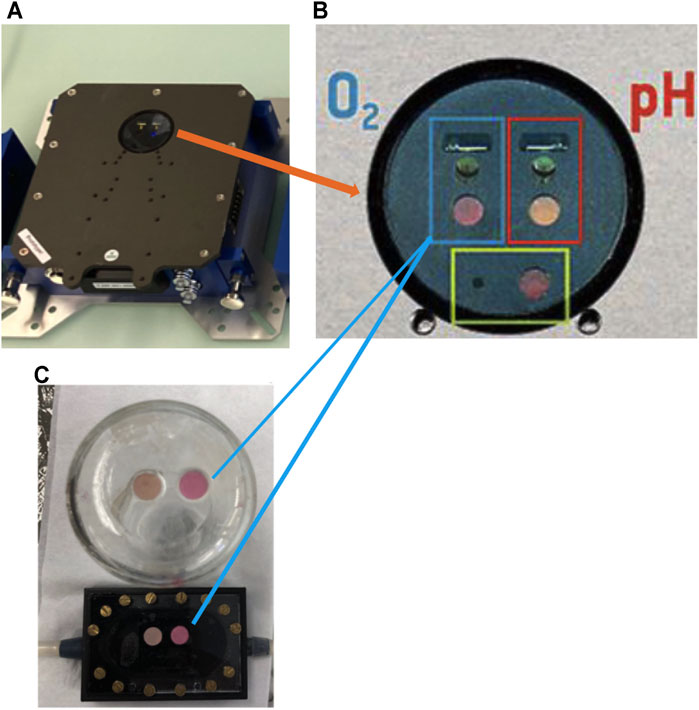
FIGURE 1. (A) The SFR optical array showing: (B) the dissolved oxygen sensor in the blue rectangle with the LED (top) and detector (bottom), the pH sensors in the red rectangle with the LED (top) and detector (bottom), and the biomass sensor in the green rectangle with the LED (left) and detector (right); and (C) the position of the spots in the 50 ml growth/sampling chamber (top) and 1.5 ml sampling chamber (bottom) with arrows showing dissolved oxygen spots.
Optical density (OD) of yeast in the bioreactor was measured as backscatter from cells with excitation provided at a peak wavelength of 605 nm by an LED and absorption determined over the visible band by a positive-intrinsic-negative (PIN) photodiode. To sample DO, pH and biomass, the sample chamber with the culture was positioned on the SFR aligned with the optical detectors. Additionally, the SFR measured ambient temperature and pressure. Data were acquired at a frequency of 0.29 h−1 (4.8 × 10⁻³ min−1) corresponding to the division rate of the cells.
Bioreactor Configurations
Two bioreactor configurations were tested over a 15 days period to compare yeast growth and metabolism under aerobic, steady state conditions. Table 1 summarizes the details of the two bioreactors. For the first configuration of Bioreactor 1, SC medium was pumped from a 2 L bottle into a 70 ml growth chamber containing 50 ml of culture. Growth rates were maintained by a peristaltic pump that replenished the medium at a dilution rate of D = 0.2 h−1 while simultaneously removing cells to a waste bottle via a siphon. Initially, carbon dioxide was sequestered using a LiquiCel hollow fiber filter and Ca(OH)2 trap (volume 100 ml) in-line with cultures while oxygen was augmented using filtered air (0.5 L min−1). However, neither of these were needed to aerate and maintain an operational pH and therefore were eliminated from the final configurations.
Aeration was provided by a 8.5 ml, the PDMSXA-1000 (PermSelect Inc.) hollow fiber filter (HFF), hereafter called PDMS, with a surface area of 103 cm2. Cells were recirculated from the PDMS filter to the growth/sampling chamber using a second peristaltic (Figure 2A,B). This created a closed loop which enhanced oxygen transfer in the cultures once every 2.2 min at a flow rate of 27 ml min−1 for a total system volume of 60 ml.
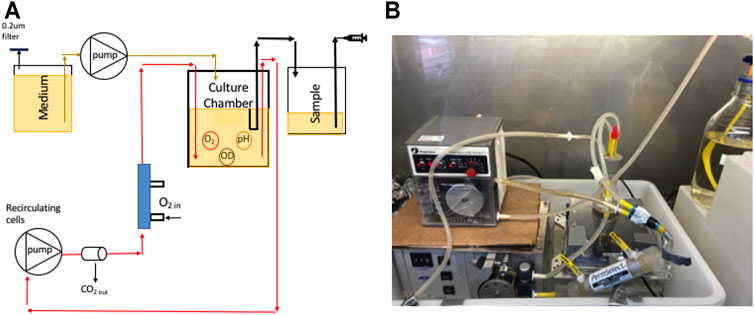
FIGURE 2. (A) A schematic of the 60 ml bioreactor; (B) a photograph of the system.
For Bioreactor 2, the 70 ml growth chamber was eliminated, and the 8.5 ml hollow fiber filter became the culture chamber as well as providing aeration (Figure 3A). Since it was not possible to measure oxygen, pH and optical density in the sealed PDMS filter, a 1.5 ml, flow-through sampling chamber was developed, and the spots affixed. The sampling chamber was positioned on SFR optical array so spots and cell concentrations could be sampled. Cells were recirculated from the oxygenated filter to the sampling chamber and back in a closed loop with a retention time of 0.38 min for a flow rate of 27 ml min−1. Valves were placed on the sample/medium tubing in the closed position to prevent pressure surges from the recirculation pump. This isolated the sampling/medium pump from the recirculating loop such that the oxygen levels in the PDMS bioreactor remained high as cells respired and no backflow occurred to the medium or sample bottles. For this configuration, the total system volume was 10.5 ml. Valves were opened to deliver medium to the culture at a rate of 2.1 ml h−1 while simultaneously displacing 2.1 ml of sample to the waste bottle, after which valves were closed to reestablish aeration by the recirculating flow.
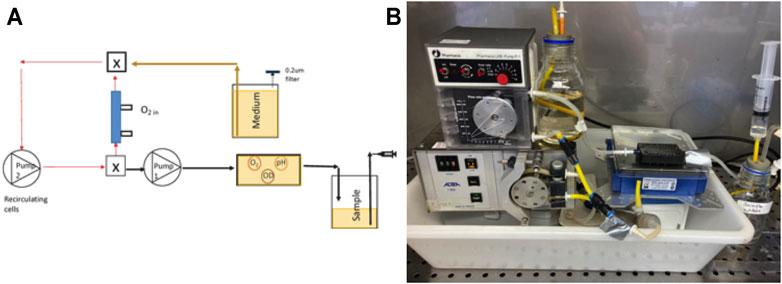
FIGURE 3. (A) A schematic of the second bioreactor configuration for the 10.5 ml bioreactor system with the PDMS filter and recirculation flow isolated from the sample/medium pump by valves (valve is X); (B) a photograph of the system. Note that the sample goes directly to the sampling chamber and is not recycled to the culture.
Hereafter bioreactors one and two are referred to by their total system volumes, the 60 ml bioreactor and 10.5 ml bioreactor, respectively. Every 24 h a 5 ml grab sample from the 60 ml bioreactor and a 2.1 ml sample from the 10.5 ml bioreactor were taken. Every third day, cells were microscopically observed and were found to be in good condition with no change in shape or budding over time. OD of grab samples was in measured at 650 nm on a spectrophotometer (Eppendorf Biophotometer plus) to calibrate the biomass after a 1:10 dilution with the medium as per Granata et al. (2021). Dry weight was determined by filtering cells onto pre-dried and weighed filters, drying them for 2 h at 105°C, cooling them in a desiccator, and weighing the mass. Biomass OD in the bioreactor was linearly correlated to cell dry weight as:
For N = 25, r2 = 0.881
DO and pH were pre- and post-calibrated using standard solutions, adjusted for ambient temperature and pressure.
Time series of 15 days were collected for both bioreactors, however means were also determined using data from two preliminary experiments of shorter duration. The initial time series was conducted on the 60 ml bioreactor. Afterwards, the PDMS filter was flushed with 50 ml of 70% ethanol and left overnight (≈10 h). Tubing was autoclaved at 121°C and 1,034 mbar (15 psi) for 20 min. The PDMS filter was rinsed with 100 ml of filtered de-ionized, and the system assembled under a laminar flow hood where it was flushed with SC medium and inoculated for the 10.5 ml bioreactor time series.
For time series, data dropouts (i.e. missing points) were interpolated, however, aberrant data points were not edited, deleted or interpolated. Analysis of Variance (ANOVA) was conducted on time series data using SPSS v27 and a Tukey test and t-tests were used to discriminate differences between means. Statistical tests were run for both equal and unequal variances with alpha values set to 0.05. Means values, plus and minus one standard deviation, are used in the paper.
Results
Optical Measurements
DO spots were accurate after being autoclaved several times. Standard pH solutions were linearly correlated with spots that were autoclaved 2–4 times (SFRpH = 4.736 + 0.3630xpH, r2 = 0.790) and those autoclaved once (SFRpH = 2.1339 + 0.5833xpH, r2 = 0.855). However, spots autoclaved multiple times had higher pH values than those autoclaved once (Figure 4A). Despite the differences in accuracy, pH spots autoclaved once and multiple times gave reproduceable results that could be post-calibrated to account for offsets and drift during the 15 days experiments.
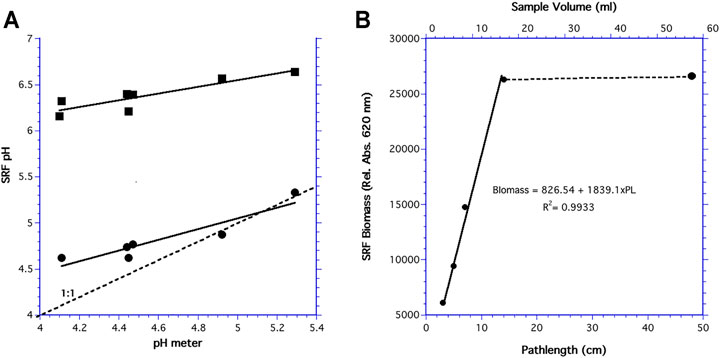
FIGURE 4. (A) Calibration of pH after autoclaving once (•) and multiple times (■). The dotted line is a 1:1 relationship; and (B) SFR reflectance in filtered de-ionized water as a function of the bioreactor volume and path length of the light.
To determine how the bioreactor volume influenced optical density, SFR reflectance of filtered de-ionized water in the 60 ml bioreactor was varied. OD increased linearly over pathlengths of 2–14 mm (Figure 4B). This plateau at 14 mm was reached at a chamber volume of 16.5 ml and increased volume gave relatively constant reflection, indicating the maximum penetration of light into the sample was 14 mm.
Bioreactor Comparisons
Comparison of Mean DO, pH and OD
For both the 10.5 and 60 ml bioreactors, increased DO generally lead to increased pH (Figure 5). The increase in pH as a function of DO was a significantly different for the 60 ml and 10.5 ml bioreactors (F1,40 = 4.876, p = 0.034) indicating the pH dependency on DO followed different trends in the two bioreactors.
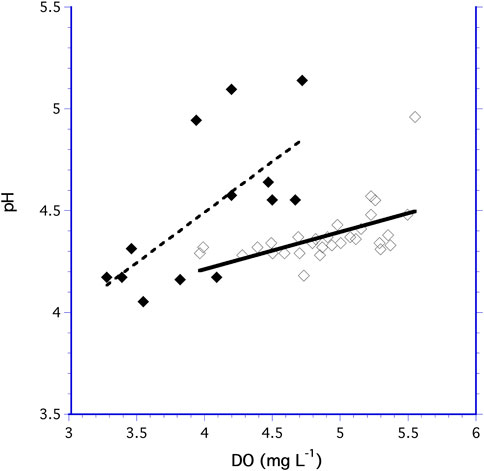
FIGURE 5. Measurements of pH as a function of DO for the 60 ml bioreactor (◆) and the 10.5 ml bioreactor (♢).
The pH decreased as biomass increased in both bioreactors, indicating that acidity increased with increasing biomass concentration (Figure 6A). Similarly, DO decreased as biomass increased as result of cell respiration (Figure 6B). While there was no difference in the slopes of pH and DO as a function of biomass in the 10.5 ml bioreactor (F1,47 = 2.88, p = 0.103), the slopes for pH and DO in the 60 ml bioreactor were significantly different (F1,23 = 8.03, p = 0.02).
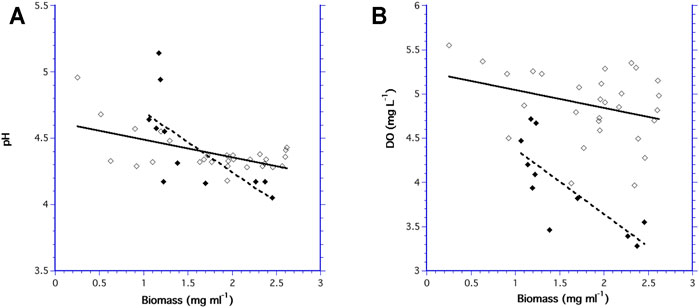
FIGURE 6. Measurement of pH verses biomass for the 60 ml bioreactor (◆) and the 10.5 ml bioreactor (♢); and (B) DO verses biomass for the 60 ml bioreactor (◆) and the 10.5 ml bioreactor (♢).
Both bioreactors had the same range in biomass concentrations, yet the mean pH was not significantly different (F1,47 = 1.20, p = 0.279) between the two bioreactors. In contrast, mean DO was different (F1,40 = 32.9, p ≤ 0.001) in each bioreactor with consistently higher DO values in the 10.5 ml bioreactor.
Comparisons of Time Series
Trends in the time series of the 60 ml and 10.5 ml cultures were somewhat different. For the 60 ml bioreactor, the biomass initially increased slightly after inoculation then decreased as slow growing biomass was mixed and diluted, after which biomass remained steady at 1.32 ± 0.43 mg ml−1 by day 6.6 (Figure 7A). While biomass was constant, the DO and pH continually rose. On days 5.5 and 12 (indicated by the black vertical lines in the graph), the medium bottle was replaced with new medium that was saturated at a DO of 6 mg L−1, so these peaks in DO were likely the result of the change in medium bottles and the unavoidable shaking of the sampling chamber. The same response occurred in preliminary experiments (not shown).
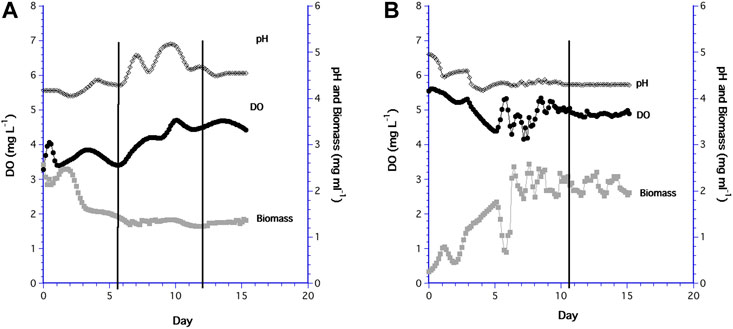
FIGURE 7. Long term time series of DO (•), pH (♢), and biomass (⬛) in: (A) the 60 ml bioreactor; (B) the 10.5 ml bioreactor.
The low initial biomass in the 10.5 ml system was a result of a low cell concentration in the inoculum, which increased except when cells accumulated for a short time in the PDMS filter before being flushed-out (Figure 7B). However, biomass in the 10.5 ml bioreactor attained a steady state value of 1.73 ± 0.55 mg ml−1 about the same time as the 60 ml bioreactor (i.e. day 6), although more variable than in the 60 ml system. DO in the 10.5 ml system remained steady and relatively high after biomass was constant. Replacement of the medium bottle on day 11 had no effect on the DO signal since the sampling chamber was isolated from the medium line. Biomass concentrations for both 15 day time series were not different (F1,37 = 0.871, p = 0.357), but the steady state biomass in the 10.5 ml bioreactor had a higher mean value (1.73 mg ml−1) than the 60 ml bioreactor (1.32 mg ml−1), which was statistically different (F1,118 = 5.64, p < 0.001).
Overall, it appears the 10.5 ml system was more effective at oxygenating the small volume of culture. This implies that the filter took longer to transfer DO into the larger volume while higher O2 transfer rates occurred in the smaller volume bioreactor. Still, the hollow fiber filter maintained DO at sufficiently high levels for aerobic metabolism in both bioreactors. When compared to literature values of DO for steady state S. cerevisiae cultures (Table 2) there were no significant differences with either the 10.5 ml (df = 71, |t| = 1.75 p = 0.084) or the 60 ml (df = 78, |t| = 0.24 p = 0.808) bioreactors.

TABLE 2. S. cerevisiae cultures in both bioreactors and from the literature.
The ratio of DO to biomass in both bioreactors was significantly different for unsteady state conditions (Table 2), which is expected given the different initial conditions. The ratio for steady state conditions was also significantly different between the 10.5 and 60 ml bioreactors. However, only the DO to biomass ratio of 10.5 ml bioreactor was significantly different from literature values of other steady state systems. Even though these means and distributions at steady state were statistically different, the 95% confidence limits were not extremely large (0.2–1.45). Since there were no significant differences in the DO levels at steady state, changes in the ratios reflect changes in biomass.
Discussion
Limitations of the Measurements
For the 60 ml bioreactor, OD in the 50 ml sampling chamber corresponded to a pathlength >14 mm for maximum light penetration. For the 10.5 ml bioreactor the sampling chamber volume was 1.5 ml with a pathlength of approximately 1 mm, which was below the plateau of the 14 mm pathlength. Since reflectance changes at pathlengths less than 14 mm it is essential that the volume and pathlength of small sampling chambers remain constant throughout the experiment otherwise biomass measurements will be inaccurate and unreliable. This can be accomplished by maximizing the surface area of the chamber. For example, a cylindrical sampling chamber would have a volume (V) equal to its surface area (SA) times sample depth, equivalent to pathlength (PL) or V = SA*PL. By maximizing the surface area, the pathlength can be minimized so that small changes in volume have a minor influence on pathlength. For larger bioreactor volumes with pathlengths greater than 14 mm, reflectance will not change with increased volume, however, such systems must be well-mixed to ensure representative samples.
The biomass measurement has special significance for continuous cultures where both fluid volume and cell biomass are constant. This is highlighted by the1.5 ml sampling chamber where pathlength was easily maintained since there was no headspace and flow in equaled flow out. In contrast, volumes in batch-fed cultures will increase as medium is added but not removed. Volume in batch cultures will remain constant since no medium is added. Additionally, biomass increases over time in both batch and batch-fed cultures. These increases in volume and biomass will reduce the pathlength of light and effect OD measurements, especially using our optical sensor array. If the dynamic range of the photodetector is insufficient, even if the pathlength is optimum, OD measurements can saturate for conventional transmission measurements. This problem is averted for the optical sensor array. The optical array also has the advantage that dissolved oxygen and pH are non-invasively measured therefore this optical method does not influence hydrogen ion or oxygen concentrations in the bioreactor. Electrode sensors have permeable membranes and consume oxygen and hydrogen ions to determine their concentrations. In large volume bioreactors these probes have a negligible effect on solution concentrations but this may not be the case for small volume bioreactors. Further, Aroniada et al. (2020) cautioned that the use of membrane DO probes have slow response times at high DO levels which increase when DO tends to zero. The use of the optical array eliminates these types of variability.
Comparison of Bioreactor Configurations
Generally, hollow fiber filters have high oxygen transfer rates (Granata et al., 2021). PDMS filters have been shown to have higher oxygen transport rates than stirred reactors at lower shear rates (Orgill et al., 1996). The major difference in the configurations of the 60 ml and 10.5 ml bioreactors, was in the later the PDMS filter functioned as the growth chamber reducing the total volume of the bioreactor system. One draw-back of the PDMS filter is its construction. It allowed cells to accumulate at the ends of the bioreactor where the filter diameter increases, resulting in a larger cross-sectional area and consequently a reduction in velocity. This allowed cells to sediment-out at the extreme ends of the filter. However, cells eventually were entrained in the flow and were sampled by the optical array, resulting in some variation in cell biomass over time, which is especially evident in the 1.5 ml sampling volume, but not in the 50 ml sampling volume.
The development of the 1.5 ml plastic, sampling chamber also reduced the system volume. Additionally, this sampling chamber was 3-D printed so that different designs and materials could be easily printed and tested. The innovative combination of the hollow fiber filter, as the bioreactor, and the small volume sampling chamber eliminated the need for the large chamber, significantly reducing the total system volume.
Yeast Metabolism
Saccharomyces cerevisiae can metabolize glucose by aerobic respiration consuming 1 mole of O2 and producing 1 mole of CO2. However, cells can switch to a mixed respiro-fermentative metabolism, resulting in carbon partitioned between CO2 and ethanol production with lower concentrations of volatile organic acids (Whiting 1976). Switching from strict obligate aerobes to facultative anaerobes is determined by glucose concentrations >10 g L−1 (Pejin and Razmov, 1993; Hagman and Piškur 2015), dilution rates (i.e. growth rates) ≥ 0.28 h−1 (Van Hoek et al., 1998; Jouhten et al., 2008; Hagman and Piškur 2015) and by oxygen levels <1.7 mgO2 L−1 (Jouhten et al., 2008). Otterstedt et al. (2004) found that aerobic metabolism of Saccharomyces cerevisiae can be reduced for glucose concentrations >40 g L−1 in the presence or absence of oxygen, a phenomenon known as the Crabtree effect.
Since we did not measure CO2 directly, nor were ethanol and volatile acids determined, we cannot conclude that pH changes were solely caused by aerobic respiration of CO2. Thus, two alternatives can explain the decreases in DO and concomitant decreases in pH, respiro-fermentation and aerobic respiration.
Peña et al. (2015) showed that S. cerevisiae growth rates in shaken flasks were optimum at pH = 6 but were reduced 20% at pH’s of 4 and 7. At pH’s of 8 and 9, growth rate was severely reduced. In terms of carbonate chemistry, they found at pH = 6, 80% of the total CO2 produced by respiration was dissolved and only 20% of the carbon (C) was fixed into metabolites. In contrast, at pH = 8, the opposite was found, 20% C was dissolved and 80% C was fixed, which was also reflected in uptake of labelled leucine into proteins. We found only small changes in pH in both bioreactors as steady state was reached, which did not inhibit cell growth. The fact that pH in both the 60 ml and 10.5 ml bioreactors hovered near 6, suggests that cells were aerobic and C-CO2 dominated pH measurements. This is supported by the data of Hagman and Piškur (2015). For the same glucose concentration as in our bioreactors, they reported no ethanol was produced and the respirator quotient (RQ) of O2:CO2 was 1, indicating aerobic respiration. Given the high DO levels with the PDMS filter and the optimal pH level with no large variations in biomass, we suggest that conditions in the bioreactors promoted aerobic respiration, ensuring yeast cells completely metabolize glucose (Rienger et al., 1983).
Another factor that may indicate cells were undergoing aerobic respiration is based on the ratio of DO to biomass. The DO to biomass ratio for the 60 ml bioreactor was comparable to the literature values for Saccharomyces cerevisiae at low growth rates (0.10.2 h−1) and aerobic conditions (RQ ≈ 1). In contrast, this ratio was slightly lower for the 10.5 ml bioreactor, indicating that higher biomass can be supported at the same DO levels as conventional bioreactor systems. However, further research is needed with these small bioreactors under the same environmental conditions to understand the complex metabolism of S. cerevisiae and to distinguish aerobic respiration from respiro-fermentative metabolism.
Space Applications
Yeast have been an ideal model to study mutations and nucleic acid repair of radiation-induced lesions in microgravity space experiments (Levy et al., 2012). While early experiments had short exposure time over a few generations, more interest has focused on long-term space exploration that can be related to effects on astronauts (Kiefer and Pross 1999). Most space experiments on microorganisms have been conducted in bioreactors in low Earth orbit (Walther 2002; Nickerson et al., 2004). One of the first yeast bioreactors was produced by our Space Biology Group at the Swiss Federal Institute of Technology in Zurich (ETHZ), which consisted of a 345 ml bioreactor (Walther et al., 1994). This system was used to study yeast budding at different growth rates with cell divisions from 2 days−1 to 0.38 days−1 aboard SpaceLab (Walther et al., 1996). Unfortunately, only 100 ml of medium was used in this system, which limited division rates and hence total generations in the 8-days experiments. Fukuda et al. (2000) and Takahashi et al. (2001) were able to grow yeast for up to 10 generations aboard MIR.
More recently, Nislow et al. (2015) used three cascading (i.e. in series) batch reactors aboard the International Space Station to extend yeast growth to 20 generations and found DNA damage and negative effects on cell reduction-oxidation. The BioSensor bioreactor (Padgen et al., 2021) will be one of the first to monitor yeast cells out of low Earth orbit when it launches in late 2021. The BioSensor can measure trends in reduction-oxidation potential and optical density (i.e. biomass) of cell cultures reconstituted from dried yeast. Cultures are isolated in chambers that are filled with oxygenated medium (Santa Maria et al., 2020). This configuration limits cell aeration and cannot be operated in steady state for continuous cultures. Given a maximum chamber volume of 28.8 ml (not including tubing) and a maximum medium volume of 424 ml (after filling all chambers), cultures are limited to approximately 21 generation times before nutrients are depleted. In contrast, our systems are capable of producing 100 yeast generations since steady state biomass can be maintained, and even longer generation times if more medium can be supplied.
Additionally, our system will sample not only biomass but also pH and oxygen, advancing the previous yeast bioreactor design of the Space Biology Group (now the Space Science Hub www.spacehub.uzh.ch). The innovation of the PreSens optical array allowed cell metabolism to be monitored in a non-invasive way that complimented the 10.5 ml system. The next step will be to substitute miniature peristaltic and valves to reduce the hardware size. One of the most significant consequences of the reduced bioreactor size is that a 2-L containment volume, which is specified for upcoming space missions will not be completely occupied by the bioreactor hardware. This leaves more space for other containers and experiments. For example, the addition of a larger medium container would allow cells to be grown longer, resulting in more generations exposed microgravity and radiation. Different containers for treatments could be added to study the effects of different stressors on cells under space conditions for extended missions.
In summary, the PDMS bioreactor in-line with the SFR vario optical array can maintain cells in aerobic environments with steady state growth rates for extended generations times to monitor cell metabolism and the effects of radiation and microgravity for long-term space exploration. The current 10.5 ml system will be improved by reducing the size of the fluidics hardware and the optical array so that the volume of medium can be increased to prolong a variety of experiments. The system will be ready for deployment in upcoming Lunar and Martian missions to study how microbial bioreactors can be utilized to produce biomaterials, including carbon fiber (Mathijsen 2020), bioplastics (Ross et al., 2016), bioconcrete (Rosas et al., 2020), food and health stuffs (DuFossé and Fouillaud 2019), and in waste remediation and life support for space stations such as the biologically oriented MELiSSA program (ESA 2019).
Data Availability Statement
The original contributions presented in the study are included in the article. Inquires for supplemental material can be directed to the corresponding author.
Author Contributions
TG conducted the study and wrote the manuscript. BR and GJ edited the text.
Funding
Financial support was provided by the European Space Agency’s PRODEX program under the guidance of Dr. M. Haag.
Conflict of Interest
The remaining authors declare that the research was conducted in the absence of any commercial or financial relationships that could be construed as a potential conflict of interest.
Publisher’s Note
All claims expressed in this article are solely those of the authors and do not necessarily represent those of their affiliated organizations, or those of the publisher, the editors and the reviewers. Any product that may be evaluated in this article, or claim that may be made by its manufacturer, is not guaranteed or endorsed by the publisher.
Acknowledgments
Preliminary work was supported by Dr. C. Follonier and Ms. C. Burkhardt for media and inocula preparations. Special thanks to Dr. M. Egli for initiating the original yeast project. We also thank the three reviewers for their comments and suggestions which helped to better this paper.
References
Baryshnikova, A., Costanzo, M., Kim, Y., Ding, H., Koh, J., Toufighi, K., et al. (2010). Quantitative Analysis of Fitness and Genetic Interactions in Yeast on a Genome Scale. Nat. Methods 7, 1017–1024. doi:10.1038/nmeth.1534
Botstein, D., Chervitz, S. A., and Cherry, M. (1997). Yeast as a Model Organism. Science 277 (5330), 1259–1260. doi:10.1126/science.277.5330.1259
Botstein, D., and Fink, G. R. (20112011). Yeast: an Experimental Organism for 21st century Biology. Genetics 189 (3), 695–704. doi:10.1534/genetics.111.130765
Botstein, D., and Fink, G. R. (1988). Yeast: an Experimental Organism for Modern Biology. Science 240, 1439–1443. doi:10.1126/science.3287619
Dufossé, L., and Fouillaud, M. (2019). Editorial: Microbial Biotechnology Providing Bio-Based Components for the Food Industry. Front. Microbiol. 10, 2843. doi:10.3389/fmicb.2019.02843
ESA-European Space Agency (201930 April 2019). Human Spaceflight, Microgravity and Exploration Programme Board-Life Support System Working Group ReportESA/PB-HME(2019)30 Report. Paris. https://www.melissafoundation.org › download.
Fukuda, T., Fukuda, K., Takahashi, A., Ohnishi, T., Nakano, T., Sato, M., et al. (2000). Analysis of Deletion Mutations of the rpsL Gene in the Yeast Saccharomyces cerevisiae Detected after Long-Term Flight on the Russian Space Station Mir. Mutat. Research/Genetic Toxicol. Environ. Mutagenesis 470 (2), 125–132. doi:10.1016/s1383-5742(00)00054-5
Granata, T., Follonier, C., Burkhardt, C., and Rattenbacher, B. (2021). Methods for Oxygenation of Continuous Cultures of Brewer’s Yeast, Saccharomyces cerevisiae. Fermentation 7 (4), 282. doi:10.3390/fermentation7040282
Hagman, A., and Piškur, J. (2015). A Study on the Fundamental Mechanism and the Evolutionary Driving Forces behind Aerobic Fermentation in Yeast. PLoS ONE 10 (1), e0116942. doi:10.1371/journal.pone.0116942
Jouhten, P., Rintala, E., Huuskonen, A., Tamminen, A., Toivari, M., Wiebe, M., et al. (2008). Oxygen Dependence of Metabolic Fluxes and Energy Generation of Saccharomyces cerevisiae CEN.PK113-1A. BMC Syst. Biol. 2, 60. doi:10.1186/1752-0509-2-60
Kiefer, J., and Pross, H. D. (1999). Space Radiation Effects and Microgravity. Mutat. Research/Fundamental Mol. Mech. Mutagenesis 430 (2), 299–305. doi:10.1016/S0027-5107(99)00142-6
Lee, J. H., Lim, Y. B., Park, K. M., Lee, S. W., Baig, S. Y., and Shin, H. T. (2003). Factors Affecting Oxygen Uptake by Yeast Issatchenkia Orientalis as Microbial Feed Additive for Ruminants. Asian Australas. J. Anim. Sci. 16, 1011–1014. doi:10.5713/ajas.2003.1011
Levy, E. D., De, S., and Teichmann, S. A. (2012). Cellular Crowding Imposes Global Constraints on the Chemistry and Evolution of Proteomes. Proc. Natl. Acad. Sci. 109 (50), 20461–20466. doi:10.1073/pnas.1209312109
Mathijsen, D. (2020). Algae to Sustainably Produce Carbon Fiber and Simultaneously Take CO2 Out of the Atmosphere. Reinforced Plastics 64 (1), 50–53. doi:10.1016/j.repl.2019.04.070
Nickerson, C. A., Ott, C. M., Wilson, J. W., Ramamurthy, R., and Pierson, D. L. (2004). Microbial Responses to Microgravity and Other Low-Shear Environments. Microbiol. Mol. Biol. Rev. 68 (2), 345–361. doi:10.1128/mmbr.68.2.345-361.2004
Nislow, C., Lee, A. Y., Allen, P. L., Giaever, G., Smith, A., Gebbia, M., et al. (20152015). Genes Required for Survival in Microgravity Revealed by Genome-wide Yeast Deletion Collections Cultured during Spaceflight. Biomed. Res. Int. 2015, 1–10. pg 10. doi:10.1155/2015/976458
Orgill, J. J., Atiyeh, H. K., Devarapalli, M., Phillips, J. R., Lewis, R. S., and Huhnke, R. L. (1996). A Comparison of Mass Transfer Coefficients between Trickle-Bed, Hollow Fiber Membrane and Stirred Tank Reactors. Bioresour. Technol. 133, 340–346. doi:10.1016/j.biortech.2013.01.124
Otterstedt, K., Larsson, C., Bill, R. M., Ståhlberg, A., Boles, E., Hohmann, S., et al. (2004). Switching the Mode of Metabolism in the Yeast Saccharomyces cerevisiae. EMBO Rep. 5, 532–537. doi:10.1038/sj.embor.7400132
Padgen, M. R., Liddell, L. C., Bhardwaj, S. R., Gentry, D., Marina, D., Parra, M., et al. (2021). BioSentinel: A Biofluidic Nanosatellite Monitoring Microbial Growth and Activity in Deep Space. Astrobiology 21 (5). doi:10.1089/ast.2020.2305)
Peddie, F. L., Simpson, W. J., Kara, B. V., Robertson, S. C., and Hammond, J. R. M. (1991). Measurement of Endogenous Oxygen Uptake Rates of Brewers' Yeasts. J. Inst. Brew. 97, 21–25. doi:10.1002/j.2050-0416.1991.tb01048.x
Pejin, D., and Razmovski, R. (1993). Continuous Cultivation of the yeastSaccharomyces Cerevisiae at Different Dilution Rates and Glucose Concentrations in Nutrient media. Folia Microbiol. 38 (2), 141–146. doi:10.1007/BF02891696
Peña, A., Sánchez, N. S., Álvarez, H., Calahorra, M., and Ramírez, J. (2015). Effects of High Medium pH on Growth, Metabolism and Transport in Saccharomyces cerevisiae. FEMS Yeast Res. 15. doi:10.1093/femsyr/fou005
PreSens manual (2019). PreSens Precision Sensing GmbH. https://www.presens.de/support-services.
Rienger, M., Kappel, O., and Fiechter, A. (1983). The Role of Limited Respiration in the Incomplete Oxidation of Glucose by Saccharomyces Cevevisiae. J. Gen. Microbiol. 129, 653–661. doi:10.1099/00221287-129-3-653
Rosa, I., Roedel, H., Allende, M. I., Lepech, M. D., and Loftus, J. (2020). On Designing Biopolymer-Bound Soil Composites (BSC) for Peak Compressive Strength. J. Renew. Mater. 8 (8), 845–861. doi:10.32604/jrm.2020.09844
Ross, G., Ross, S., and Tighe, B. J. (2016). “Bioplastics,” in Brydson's Plastics Materials (Eighth Edition). Editor M. Gilbert (Amsterdam: Elsevier), 631–652. doi:10.1016/B978-0-323-35824-8.00023-2
Santa Maria, S. R., Marina, D. B., Massaro Tieze, S., Liddell, L. C., and Bhattacharya, S. (2020). BioSentinel: Long-TermSaccharomyces cerevisiaePreservation for a Deep Space Biosensor Mission. Astrobiology 20 (8). doi:10.1089/ast.2019.2073
Scannell, D. R., Butler, G., and Wolfe, K. H. (2007). Yeast Genome Evolution-The Origin of the Species. Yeast 24, 929–942. doi:10.1002/yea.1515
Takahashi, A., Ohnishi, K., Takahashi, S., Masukawa, M., Sekikawa, K., Amano, T., et al. (2001). The Effects of Microgravity on Induced Mutation in Escherichia coli and Saccharomyces cerevisiae. Adv. Space Res. 28 (4), 555–561. doi:10.1016/s0273-1177(01)00391-x
Van Hoek, P., van Dijken, J. P., and Pronk, J. T. (1998). Effect of Specific Growth Rate on Fermentative Capacity of Baker's Yeast. Appl. Environ. Microbiol. 64 (11), 4226–4233. doi:10.1128/AEM.64.11.4226-4233.1998
Walther, I., Bechler, B., Cogoli, A., Müller, O., Hunzinger, E., and Cogoli, A. (1996). Cultivation of Saccharomyces cerevisiae in a Bioreactor in Microgravity. J. Biotechnol. 47, 113–127. doi:10.1016/0168-1656(96)01375-2
Walther, I. (2002). Advances in Space Biology and Medicine, 8. Elsevier, 197–213. doi:10.1016/S1569-2574(02)08020-6Space Bioreactors and Their Applications
Walther, I., van der Schoot, , van der Schoot, B. H., Jeanneret, S., Arquint, P., de Rooij, N. F., et al. (1994). Development of a Miniature Bioreactor for Continuous Culture in a Space Laboratory. J. Biotechnol. 38 (1), 21–32. doi:10.1016/0168-1656(94)90144-9
Keywords: yeast bioreactor, SFR vario optical array, case study, system development, lunar missions, optical measurements
Citation: Granata T, Rattenbacher B and John G (2022) Micro-Bioreactors in Space: Case Study of a Yeast (Saccharomyces cerevisiae) Bioreactor With a Non-Invasive Monitoring Method. Front. Space Technol. 2:773814. doi: 10.3389/frspt.2021.773814
Received: 10 September 2021; Accepted: 30 November 2021;
Published: 03 January 2022.
Edited by:
Timothy Grant Hammond, Duke University, United StatesReviewed by:
Po Bian, Hefei Institutes of Physical Science (CAS), ChinaCorey Nislow, University of British Columbia, Canada
Copyright © 2022 Granata, Rattenbacher and John. This is an open-access article distributed under the terms of the Creative Commons Attribution License (CC BY). The use, distribution or reproduction in other forums is permitted, provided the original author(s) and the copyright owner(s) are credited and that the original publication in this journal is cited, in accordance with accepted academic practice. No use, distribution or reproduction is permitted which does not comply with these terms.
*Correspondence: Tim Granata, dGltb3RoeS5ncmFuYXRhQGhzbHUuY2g=