 D. Beysens
- Physique et Mécanique des Milieux Héterogènes, UMR 7636, CNRS, ESPCI Paris—PSL University, Sorbonne Université, Paris, France
Fluids near their liquid-vapor critical point, liquid mixtures near their miscibility critical point, exhibit universal behavior in their transport properties. Weightlessness is most often mandatory to properly evidence these properties. This review is concerned with some of the most important results obtained thanks to space experiments concerning thermal, mass, and momentum transport. Thermal aspects in pure fluids are mainly concerned with the discovery of a new thermalization process, the Piston Effect, leading to paradoxical effects such as a “critical speeding up” instead of the classical “critical slowing down”, heat seemingly flowing backwards and cooling resulting from heating. Mass transport deals with the process of boiling in the liquid phase, and phase transition when the fluid or the liquid mixture is thermally quenched from the homogeneous, supercritical region, to the two-phase region where it phase separates. Weightlessness makes universal the dynamics of phase separation. Momentum transport is concerned with the scaled behavior of viscosity and the effects of vibrations. Vibrations lead to effects (interface position, instabilities) that resemble buoyancy effects seemingly caused by an artificial gravity. Although weightlessness has led to solve important problems, many questions are still opened.
1 Introduction
During the last decades, access to space offered the opportunity to investigate transport phenomena in fluids without the unavoidable gravity-driven contributions. Under such conditions of weightlessness, fluids are not affected by gravity-induced phenomena such as stratification or buoyancy-induced convections (Moldover et al., 1979). At the same time, the effect of vibration-induced acceleration could be clearly put in evidence. Although transport phenomena are present in all fluids with more or less intensity, it appeared that the vicinity of the critical point (CP), where many fluid properties exhibit divergence or convergence, was of great interest to magnify the effects related to the absence of gravity. In addition, thanks to scaling, all fluids exhibit in this CP vicinity the same universal behavior.
Orbital flights or free falls as provided by drop towers, sounding rockets, parabolic flights, can compensate gravity to within 10−2 or even 10−6 g (g is the Earth’s gravity acceleration constant), depending on the specific resource which is used (e.g., Barmatz et al., 2007 and Refs. therein). Other means can be considered to compensate partially or totally the gravity effects (for a review Beysens and van Loon, 2015). On the other hand, these means suffer from drawbacks that can make them inappropriate for a specific study. The suppression of gravity-induced density stratification can be performed by stirring (e.g., Moldover et al., 1979; Gillis et al., 2005), however at the cost of a nearly adiabatic temperature gradient. Gravity can also be completely or partially compensated in pure fluids by a volumic force provided by a strong magnetic field gradient (e.g. in H2, considered below, which exhibits a relatively large diamagnetic susceptibility). However, the compensation cannot be made strictly uniform unless very complex magnets are used (Nikolayev et al., 2010). Electric field gradients have been envisaged (Moldover et al., 1979), but the field modifies the coordinates of the critical point. In partially miscible fluids that exhibit a miscibility critical point, partial deuteration of one component has been used to match the density of both phases to within 10−6 (methanol with partially deuterated cyclohexane; Houessou et al., 1985). Nevertheless, the fact that the capillary length goes to zero at the critical point can limit the useful range of this Plateau method. One notes that these means have the interest of producing variable g-levels.
Comprehensive reviews on transport phenomena near the critical point have been given by Sengers and Perkins (2014) and Abdulagatov and Skripov (2021). Critical phenomena in zero-gravity have been thoroughly reviewed by Barmatz et al. (2007). This review paper updates the Barmatz et al. review and is organized as follows. After a brief description of the universal behavior of fluids near their CP, the first section deals with thermal processes and some paradoxical behavior. Mass transport is then investigated during the process of phase transition, followed by the analysis of momentum transport: Viscosity and the effect of harmonic accelerations (vibrations). In the conclusion are reviewed still open questions.
2 Universality of Critical Behavior
In the pressure (p)–temperature (T) diagram of pure fluids, liquid and vapor phase coexist at equilibrium on the saturation line. This line is the projection in the p–T plane of the 3-dimensional pressure-temperature-density surface. The projection in the temperature–volume (V) plane or equivalently the temperature–density (ρ) plane is the liquid-vapor coexistence curve (Figure 1A). This curve exhibits a maximum, the gas-liquid CP. This point represents the place where the difference between liquid and gas vanishes. The critical point data of SF6, CO2 and H2 fluids, used throughout this paper, are listed in Table 1.
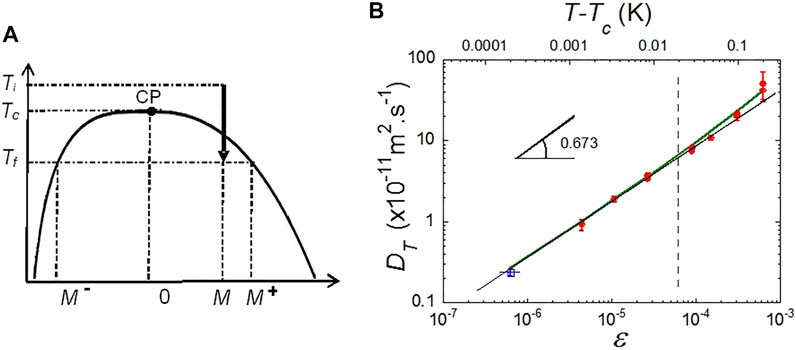
FIGURE 1. (A) Schematic phase diagram for pure fluids. M = (ρ−ρc)/ρc is the order parameter of the liquid-vapor transition. Ti,,f: Initial, final temperature in a phase separation process. CP: Critical point. (B) Behavior of the thermal diffusivity DT of SF6 in weightlessness showing the asymptotic behavior. Red dots: From density relaxation measurements (Wilkinson et al., 1998). Open blue square: From image analysis of the density fluctuations (Oprisan et al., 2012). The vertical interrupted line indicates the lower temperature limit where measurements (light scattering) can be performed on ground. The bold green line is Eq. 7 with
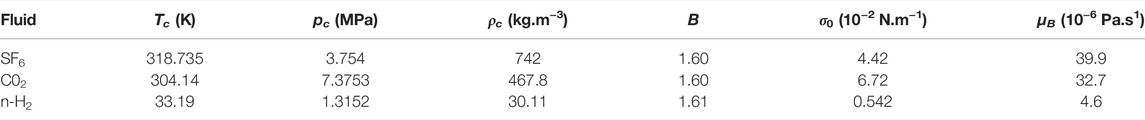
TABLE 1. Some critical parameters of different fluids (see also Table 2). Tc: Temperature; pc: Pressure; ρc: Density; B: Coexistence curve amplitude as defined in Table 2; σ0: Surface tension amplitude as defined in Table 2; μB: Shear viscosity as defined in Table 2. (From Zappoli et al., 2015 and Refs. therein).
Fluids are called near-critical around the CP. The corresponding near-critical region corresponds to a wide range of temperature and pressure around their CP. Such near-critical fluids exhibit a large compressibility, particularly close to the CP. Above their critical temperatures and pressures, fluids are called “supercritical”. Fluids in this region display interesting properties such as large density compared to a gas, low viscosity compared to a liquid and large mass diffusivity, which makes them intermediary between gases and liquids. In such supercritical conditions fluids appear as non-polluting solvents or hosts of chemical reactions with high yield. Under weightlessness, the use of cryogenic fluids under supercritical conditions has the benefit of using a fluid of high density without the difficulty of localizing a liquid and a vapor phase in a weightless environment (Oschwald et al., 2006; Air Liquide, 2022).
A key feature of the critical region is concerned with the fact that the thermodynamic and transport properties can be written as scaled, universal power law functions with respect to the CP coordinates (e.g., Stanley, 1971; Chimowitz, 2005; Barmatz et al., 2007; Zappoli et al., 2015). One can therefore generalize the results obtained with one single fluid to an entire class of systems, the “class of fluids”. This class includes (this is a non-exhaustive list) pure fluids, liquid mixtures, polymer melts and solutions, micro-emulsions, molten salts, monotectic liquid metals. The archetype of this class is the 3D magnetic uniaxial Ising model. This scaling is fundamental; it originates from the scaled behavior that the free energy must asymptotically achieve to fulfill the conditions of the CP 2nd order phase transition.
The transition is governed by an order parameter (OP), M. The OP defines the CP coordinates. It is zero for T > Tc, the CP temperature, where the system is homogeneous (symmetrical), and non-zero for T < Tc, where the system exhibits two phases (non-symmetrical) (Figure 1A). The order parameter for fluids is the relative density difference M = (ρ−ρc)/ρc, with ρ (ρc) the (critical) density. On the critical density path (critical isochore) above the CP, supercritical fluids correspond to M = 0; gas and liquid phases at coexistence below the CP correspond to M = M+ or M−, i.e., ρ = ρl or ρv.
The proximity of the CP is characterized by the occurrence of large fluctuations of the OP. Such fluctuations are at the origin of an intense scattering of light, the so-called “critical opalescence”. The importance of fluctuations corresponds to a space-dependent susceptibility correlation function χ(r):
Here the parameter ξ is the correlation length of the OP fluctuations and
The exponent ν (= 0.630, Table 2) is universal; ξ0 is an amplitude which depends on the considered system. The correlation length varies with temperature; it goes to infinite at the CP. It is the natural lengthscale of the CP phenomena. The behaviors of other important fluid parameters with their definition are listed in Table 2.
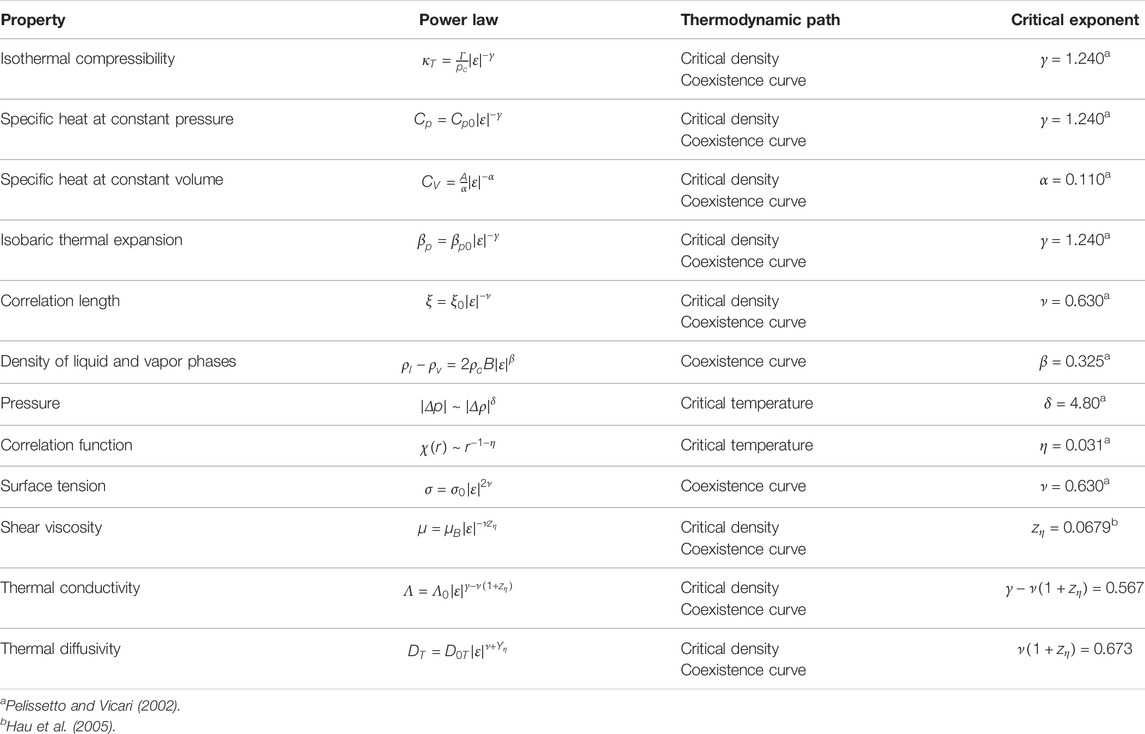
TABLE 2. Asymptotic power laws of the critical behavior of some fluid parameters with their amplitudes. The isothermal compressibility
One also finds universal scaling laws in dynamics for the transport coefficients. However, the universality classes are fewer than the classes for static properties as described just above. The natural timescale of CP phenomena appears to be the dynamics of the OP fluctuations, alike the correlation length for CP lengthscale. The timescale is thus determined by the decay time of a fluctuation of size ξ on lengthscale ξ. The fluctuation dies out by a diffusion process, corresponding to a diffusion coefficient DT. The latter can be estimated (Kawasaki, 1970) from the Brownian diffusion of a cluster of size ξ:
In this formula kB is the Boltzmann constant and η is the shear (or dynamic) viscosity.
Note that the thermal diffusion coefficient can be also written as
with Λ the thermal conductivity and Cp the specific heat at constant pressure. They both diverges at Tc, however with different exponents (Table 2).
The typical diffusion time on lengthscale ξ follows from Eq. 3:
The temperature dependence of tξ is related to the temperature dependence of ξ3, that is
According to Eq. 6 the fluctuations of the OP relax more and more slowly when nearing the CP temperature. This is the well-known anomaly called “critical slowing-down”. In contrast to the pressure fluctuations which equilibrate very rapidly, at the velocity of sound, density and temperature fluctuations are much slowed down.
The fluctuation lifetime thus appears as the natural timescale of the CP phenomena, in the same way as the correlation length of fluctuations is the natural lengthscale. After being appropriately scaled by ξ and tξ, most of the behavior should follow universal laws.
3 Thermal Phenomena
Three modes for thermalization are classically reported: diffusion (conduction), convection and radiation. In what follows one will consider only the diffusion and convection modes. However, in near critical, very compressible fluids, another thermalization process, called the “Piston effect”, can take place. (Detailed information can be found in the book by Zappoli et al., 2015).
3.1 Thermal Conductivity and Thermal Diffusivity
Thermal conductivity and thermal diffusivity are related by Eq. 4. Measurements of the thermal diffusion coefficient can be classically performed by detecting the light scattered by density fluctuations. On ground, even data in thin samples where the effect of the hydrostatic pressure is lowered cannot be obtained closer than 20 mK from the critical point (Jany and Straub, 1987). The density relaxation experiments in weightless of Wilkinson et al. (1998) with SF6 have been performed up to 1.4 mK from Tc and corresponds to the extrapolation of the ground data (Figure 1B). Other measurements were performed by Oprisan et al. (2012) closer to Tc (200 µK) by analyzing the images of critical density fluctuations. In Figure 1B one sees that microgravity data are mandatory to evidence the true asymptotic power law, whose expected exponent is 0.673 (Table 2). The full variation including the background contribution is also drawn in Figure 1B; it corresponds to:
The first term is the asymptotic behavior (Table 2) and the second corresponds to the background contribution (Luettmer-Strathmann et al., 1995), the amplitude of which being
The thermal diffusion coefficient DT thus progressively goes to zero when nearing the CP. This means that the heat diffusion process becomes extremely slowed down. For instance, thermal equilibration of a CO2 sample with thickness 2L = 1 cm at 1 mK from Tc would demand a time tD ≈ L2/DT ≈ 1 month to attain thermal equilibrium. It was thus currently anticipated at the commencement of space experimentations that homogenizing in temperature and density a sample of fluid under weightlessness near its CP was impossible to be carried out in a practical experiment time.
3.2 Thermalization by the Piston Effect
Nonetheless, another process, called “adiabatic heating” (Boukari et al., 1990a; Onuki and Ferrell, 1990) or “Piston Effect” (Zappoli et al., 1990; Zappoli et al., 2015), invisible on Earth because partially hidden by convection, appears to be quite efficient due to the large values of the coefficients of compressibility and thermal expansion. This process explains the fast equilibration observed by Nitsche and Straub (1986) and in subsequent experiments by Klein et al. (1991) Guenoun et al., 1993; Straub et al., 1995a; Straub et al., 1995b; Fröhlich et al., 1996; De Bruijn et al., 1997; Wunenburger et al., 2000; Garrabos et al., 2001a; Wunenburger et al., 2002; Bartscher and Straub, 2002.
The Piston Effect can be described (Zappoli et al., 1990; Zappoli et al., 2015; Beysens et al., 2021) by the expansion of the hot diffuse boundary layer that forms at the heating wall of a closed cell (Figure 2A). This layer expands and compresses adiabatically the whole fluid, as a piston would do. Thermalization thus proceeds at the velocity of sound, as calculated by Zappoli et al. (1990) and observed by Miura et al. (2006). It results a spatially uniform heating of the bulk fluid outside the boundary layer, as observed by Guenoun et al. (1993). In addition, the development of the hot boundary layer produces a flow in the fluid, whose velocity is maximum at the edge of the layer (Zappoli, 1992; Zappoli and Carles, 1995). It is the motion of the fluid at the edge of the boundary layer which compresses the bulk fluid by transferring a small amount of fluid. The boundary layer thus operates as a transformer, converting the thermal energy into kinetic energy. Note that the flow at the edge of the boundary layer is actual; under intense heating conditions it was observed under weightlessness as a “jet” (Fröhlich et al., 2006).
FIGURE 2. (A) The mechanism of the Piston Effect. A thin hot boundary layer develops and compresses the bulk fluid. The resultant temperature profile shows i) a small zone of high gradients near the heated boundary, defining the extent δ of the thermal boundary layer and ii) a uniform increase in the other part of the fluid arising at the sound velocity. (B): When heat seemingly flow backwards. The vapor phase of a SF6 sample at 10 K below the CP (ALICE in MIR, 1999) undergoes large overheating during a continuous rise of the cell wall temperature Twall. (Data from Wunenburger et al., 2000). (C) When heat can cool. Undercooling of SF6 fluid after heating by a 100 mW, 4 s heat pulse on Earth at 16.5 K above the CP and (inset) under the weak acceleration of a space shuttle maneuver [three different locations in the fluid;
According to the clear demonstration by Onuki et al. (1990), the first characteristic Piston Effect time scale is the time, tc, to deliver from the boundary layer the amount of energy, Eb, needed to adiabatically heat by compression the remaining fluid of size L–δ ≈ L, whose temperature adiabatically rise by ΔTb ≈ Eb/LCV. (CV is the specific heat at constant volume; the sample is of unit area and unit mass). The transfer of energy takes place on several acoustic times scale and is thus nearly instantaneous with respect to tc, which involves a diffusion process in the boundary layer.
As a consequence, a thermal equilibrium is obtained on the new time scale tc, intermediate between the acoustic and diffusion timescales. This equilibration time is reached when the boundary layer temperature equals the bulk temperature. It corresponds to the time when the energy E(t) diffusing in the boundary layer during tc equals Eb. It results the temperature equality Eb/(δCp) ≈ Eb/LCV giving δ ≈ L/γ0, with γ0 = Cp/CV. Ferrel and Hao (1993), from a more rigorous calculation, obtained δ = L/(γ0–1). As a result, the value of tc, using Eq. 4, can be written as
where tD = L2/DT represents the time scale of diffusion on length L.
According to Table 2, the temperature dependence of
Another very particular behavior was observed by Wunenburger et al. (2000) in the two-phase region below the CP. When heating a cell under weightlessness, the vapor bubble temperature became superior to the heating wall temperature (Figure 2B). Heat was apparently flowing from cold to hot, seemingly contradicting the laws of thermodynamics. It has to be noted, nevertheless, that the process corresponds to a thermo-mechanical exchange where the homogeneous pressure rise due to the expansion of the hot boundary layer gives a larger effect in the vapor than in the liquid, the pressure derivative of temperature at constant entropy
In the Earth’s environment or when the cell is submitted to accelerations in space, a coupling arises between the thermal boundary layers and acceleration-induced flows. Paradoxical cooling of the fluid after a heat pulse can be observed on Earth or during spacecraft rotations and maneuverings (Figure 2C; Beysens et al., 2011). This cooling is related to the buoyancy convection of the hot thermal boundary layer, which couples with the PE. Note that these studies certified the numerical codes used for the pressurization of the tanks in the Ariane 5 rocket (Air Liquide, 2022).
3.3 Heat Transport
Temperature outside the thermal boundary layers is uniform; then the bulk fluid acts as an actual thermal short circuit. The possibility to use the Piston Effect as a sort of heat pipe to transport heat on long distances has been investigated. Beysens et al. (2010) carried out experiments and simulation with magnetically levitated H2 and extrapolated to CO2 (magnetic gradients compensate gravity forces, e.g., Nikolayev et al., 2010). Very fast heat transfer is obtained at short times, the dynamics of which being only limited by the thermal properties of the heat pipe materials. Nonetheless, the yield expressed in terms of ratio of transported/injected powers does not exceed 10–30%, a value connected to the limiting pipe heat capacity.
4 Mass Transport
In this section are addressed two processes of phase transition. The first process, called phase separation, is met when changing temperature from the homogeneous, supercritical phase. The second process is boiling, where the evaporation of a liquid phase is made in the two-phase, liquid-vapor region below Tc.
4.1 Phase Separation
One considers a fluid initially above its CP (at temperature Ti and density ρi). It is thermally quenched in the two-phase region where it separates in liquid and vapor phases (Figure 1A). Beysens and Garrabos (2000) have evidenced the different routes that a fluid, initially in its supercritical state, takes to phase separate. If the fluid initial density ρi < ρc, liquid droplets nucleate on critical fluctuations (of mean size ξ) and develop by incorporating by diffusion the molecules from the bulk phase. The density of this phase decreases to reach the vapor density. If ρi > ρc, vapor bubbles follow the same process: Nucleation on critical fluctuations of mean size ξ, then growth by evaporative diffusion towards the bulk phase, which eventually reach the liquid density. The typical time to reach local equilibrium is thus the typical diffusion time tξ (Eq. 5).
Further growth is driven by coalescence events. When the volume fraction
This law depends only on T and is weakly dependent on the distance (T−Tc) from the CP. When ϕ > 0.3, the flow engendered by a coalescence event can move a nearby drop, hence inducing another coalescence event (Nikolayev et al., 1996). A chain reaction of coalescence is thus generated, creating an interconnected pattern. In the viscous limit and late times, the interface motion and the evolution of Lm corresponds to the balance between the capillary pressure gradient σ/R (here σ is the vapor-liquid surface tension) and the friction related to the shear viscosity µ, giving:
The parameter b ≈ 0.03 is a universal constant. For early times, coalescence is not effective and the domain evolution follows Eq. 9 with
with the adjustable parameters
When experimental data are rescaled as noted just above, they all fall on only two curves (Figure 3A). For volume fractions ϕ > 0.3, one finds a “fast” growth law and an interconnected morphology (Eq. 10). For ϕ < 0.3, one obtains a “slow” growth and a disconnected morphology (Eq. 9). Note that the above behavior can also be applied to the phase separation of binary liquids, which belongs to the same universality class as fluids. One simply has to consider the OP “concentration” instead of the OP “density”.
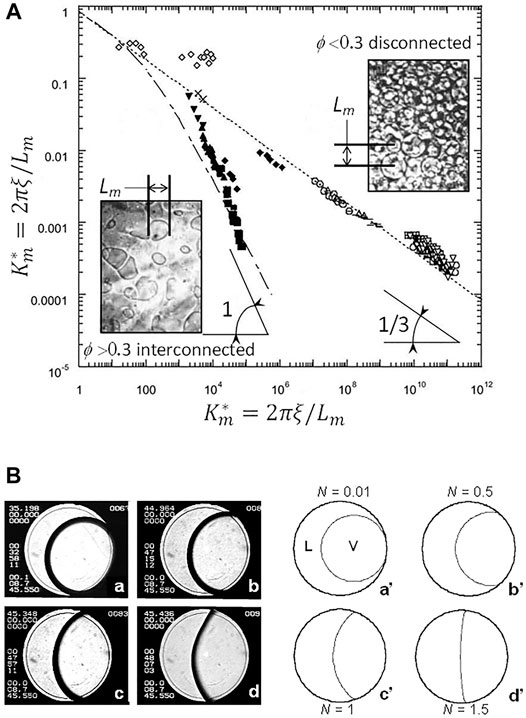
FIGURE 3. (A) Universal scaled growth laws of liquid or vapor domains during phase separation when gravity effects are removed. Fluids (SF6, CO2): All data points except open squares (liquid mixtures). The mean distance between domains (Lm) is expressed in the scaled units Km* and t* = t/tξ; lines and curves represent the theoretical predictions (see text). (B) Critical boiling. (a–d) Typical images of a SF6 sample in a thin 12 mm diameter cell (the engraved ring on the windows is 10 mm diameter). Temperature of the cell walls are ramping up towards Tc from well below the CP. Temperatures are indicated at the top left of the images; Tc = 45.950°C. L: Liquid; V: Vapor. (a’–d’): Calculated bubble shape for different values of the non-dimensional strength of vapour recoil N corresponding to the images. N goes to zero at the CP (Eq. 11). (Adapted from Garrabos et al., 2001b).
4.2 Critical Boiling and Boiling Crisis
Boiling as a result of liquid-vapor transition has been the object of many studies under weightlessness (e.g., Konishi and Mudawar, 2015; Colin et al., 2017). Much less have been performed in the vicinity of a critical point. However, close but below the critical point, interesting behavior concerning the nature of the boiling crisis can be clearly evidenced.
The boiling crisis is the formation of a vapor film between the heater and the liquid when the heat supply exceeds a critical value, the Critical Heat Flux (CHF). Nikolayev and Beysens (1999) proposed a mechanism for the boiling crisis that is based on the spreading of the dry spot under a vapor bubble by the action of a vapor recoil force. This force comes from the uncompensated mechanical momentum of the vapor coming into the bubble. Since the evaporation intensity increases sharply near the gas-liquid-solid triple contact line, the influence of the vapor recoil can be interpreted in terms of a change of the apparent contact angle (Figure 3B).
One can define a non-dimensional number N corresponding to the ratio of the recoil force at the contact line (the place where the evaporation rate is the highest because the temperature gradient is the largest) to the capillary force. This parameter determines the deformation of the bubble from its circular or spherical shape by the drying of the contact surface area and the manifestation of an apparent finite contact angle in the vicinity of the contact line. Following Nikolayev and Beysens (1999) and Garrabos et al. (2001b), near the CP one can write N as:
One sees that N goes to infinite at the CP, which means that in the vicinity of the CP the bubble can be highly deformed. Figure 3B illustrates this behavior in SF6 under microgravity.
Since the vapor recoil force is always directed towards the liquid side, it increases the dry spot under the bubble. For the most usual case of complete wetting of the heating surface by the liquid, the boiling crisis can be thus understood as an out of equilibrium drying transition from complete to partial wetting. Figure 4A report the heat flux dependence with the heater temperature in weightless experiments as provided by a magnetic field gradient. The fluid is H2. According to Nikolayev et al. (2006) the CHF decreases to zero with T–Tc following the power law:
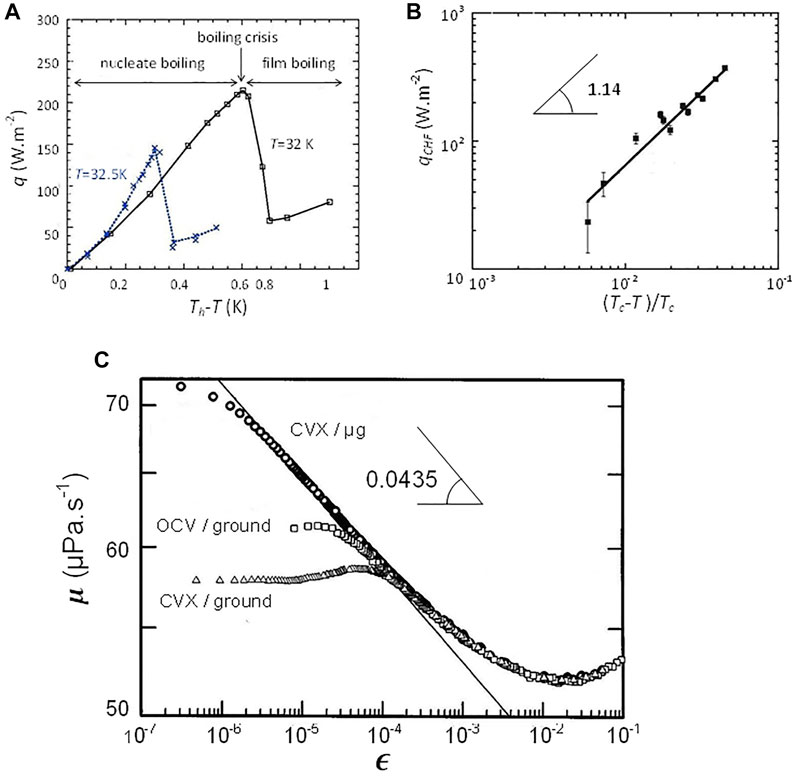
FIGURE 4. (A) Typical boiling curves in H2 (Tc = 33.2 K) for different pressures (temperatures) T. The boiling regimes are indicated for T = 32 K. Th is the heater temperature, q is the heat flux. The lines are guides for the eye. (B) Critical heat flux qCHF as a function of the reduced distance to the CP. The straight line corresponds to the vapor recoil model of Eq. 16. (Adapted from Nikolayev et al., 2006). (C) Viscosity of Xenon measured near the critical point (log-log plot; Tc ≈ 290 K) from the CVX (Berg et al., 1999) and OCV (Berg and Moldover, 1990) setups. Ground and microgravity data are shown. The straight line corresponds to the asymptotic behavior of microgravity data and has the slope
This power law is well visible in Figure 4B. The decrease in critical heat flux when nearing Tc explains the easy drying of the wetting film under the vapor bubble close to Tc as observed in Figure 3B and quantitatively studied by Hegseth et al. (2005).
5 Momentum Transport and Viscosity
In a non-equilibrium fluid submitted to a shear stress, there is a relative motion of different layers with respect to one another. The layer moving faster conveys momentum to the layer moving slower to bring about an equilibrium state. As a consequence the transport of momentum generates the phenomenon of viscosity. The shear or dynamic viscosity µ can be related to the correlation function of the pressure fluctuations by the Kubo-Green relation, which relates in general the fluctuations near the thermodynamic equilibrium to a transport coefficient. An anomalous increase of the viscosity is found near the critical point because the OP correlation function becomes long range in time. Noting
It results that the viscosity diverges near the critical point, following the power law behavior (e.g., Sengers and Perkins, 2014; Abdulagatov and Skripov, 2021) (Table 2):
Here
Berg et al. (1999) developed a novel viscometer (CVX) and carried out a careful experiment in weightlessness (Figure 4C). In contrast to ground experiments, the microgravity experiment exhibit a clear power law over about three decades in ε. The data, however, depart from the asymptotic power law when very close the critical temperature due to the increasing viscoelasticity near the critical point (Bhattacharjee and Ferrell, 1983). The exponent value
6 Momentum Transport and Vibrations
Fluids submitted to linear harmonic vibrations
Vibrations can induce instabilities of thermo-vibrational type in a supercritical, homogeneous fluid submitted to gradients of density originating from temperature gradients. Long-ranged mean flows are generated, seemingly due to an artificial gravity. Near the CP, these phenomena are amplified, because many parameters exhibit significant divergences, and especially the isobaric thermal expansion coefficient
When the fluid is diphasic (liquid-vapor), various instabilities can be induced by vibrations according to the relative direction of the interface with the vibration direction. One can indeed observe Faraday-type (parametric) instabilities and/or Rayleigh-Taylor type instabilities, which grow on the liquid-vapor interface perpendicular to the vibration. On the liquid-vapor interface parallel to the vibration Kelvin-Helmholtz type instabilities (“frozen waves”) can develop. On the other hand, the liquid-vapor interface can orientate itself perpendicular to the interface; this is reminiscent of the Kapitza pendulum, stabilized upside down when its support is horizontally vibrated. Vibrations in the above examples mimic in space the effects of gravity. A better management in space of fluids and their phase change is therefore expected.
The shear flow resulting from the difference in velocity between the liquid-vapor density differences only matters for length-scales greater than the viscous boundary layer. The fluid internal structure is not concerned at the molecular level. However, shear flow can reduce the extent and amplitude of the density fluctuations near the CP. It results a deep modification of the critical behavior, with different values (“mean-field”) for the critical exponents (e.g., Beysens et al., 1983; Onuki, 2002).
6.1 Supercritical Thermo-Vibrational Instabilities (T > Tc)
One now examines a vibrated fluid in the Rayleigh-Bénard configuration (two parallel plates separated by distance e with temperature difference ΔT). The fluid is thus submitted to a vibrational acceleration in a thermal gradient. The occurrence of the instability depends on the presence of the Bernoulli pressure, which destabilizes the fluid depending on the direction of the vibration with respect to the thermal gradient direction. When the vibration is parallel to the gradients, the Bernoulli pressure drives the inhomogeneities on an isotherm and the fluid is stable. The less unstable situation corresponds to vibrations perpendicular to the gradient where a vibrational Rayleigh-Bénard instability can appear when the vibrational Rayleigh number Rav becomes larger than 2,100 (Gershuni and Lyubimov 1998):
The fluid becomes more and more sensitive to vibration as the CP is neared because Rav increases as (T−Tc)−1.9. Measurements and numerical simulations have been carried out by Garrabos et al. (2007) concerning the flows of SF6 fluid around a point-like heat source (thermistor, Figure 5) submitted to an harmonic oscillation. Data compare well with theory. Two different regimes were evidenced according to the vibration parameters. For “large amplitude and low vibration frequency”, as defined above at the beginning of Section 6, the instantaneous acceleration is seen to drive the process. The hot fluid is convected during each vibration period parallel to the vibration and develops as “plumes” (Figure 5A). Under “small amplitudes and high frequency”, an average flow connected to the vibrational Rayleigh instability develops. The hot fluid is convected by four rolls perpendicularly to the vibration direction (Figure 5C), corresponding to the most unstable situation.
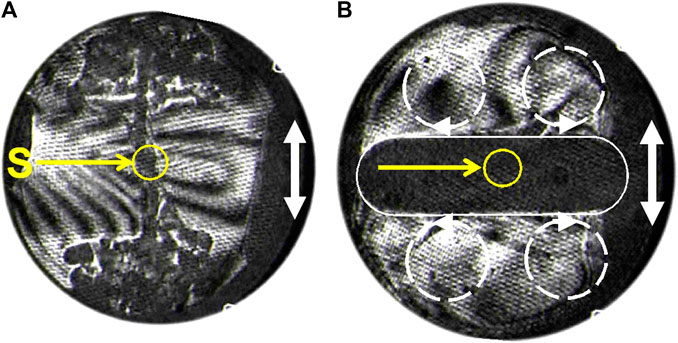
FIGURE 5. Interferometry pictures in SF6 at Tc + 0.5 K of the hot fluid regions (dark) around a heating point source S (thermistor). The vibration direction is indicated by a white double arrow. (A) Low frequency and large amplitude vibration. The hot regions are convected from S as plumes parallel to the vibration direction. (B) High frequency vibration. The hot region (underlined white), is convected perpendicular to the vibration direction due to four convection rolls (symbolized by interrupted circles) (Adapted from Garrabos et al., 2007).
When the temperature of the fluid is very rapidly varied (thermal quench), a thermal boundary layer forms. The latter can be destabilized; a vibrational Rayleigh instability can indeed develop parallel to the thermal boundary layer. Its study has been carried out by Amiroudine and Beysens (2008) and Gandikota et al. (2013). Viscous digitations (Figures 6A,D) appear in H2 vibrated under magnetic levitation and CO2 vibrated in a sounding rocket (Beysens et al., 2009).
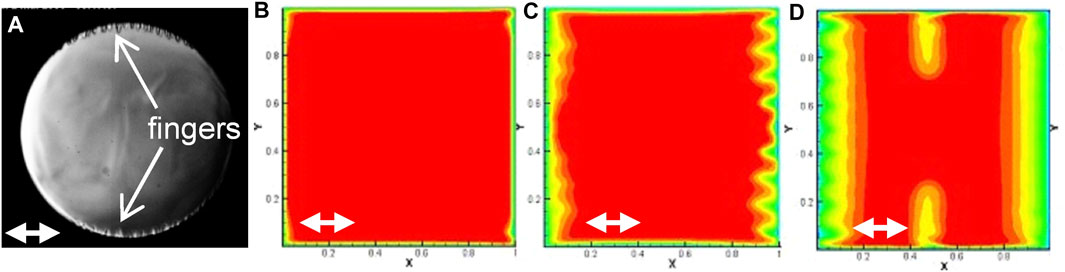
FIGURE 6. Different instabilities observed during a negative thermal quench. (A): Cold fingers in a 10 mm diameter cylindrical cell filled with C02 (vibration direction: Double white arrow) with 0.3 mm amplitude and 20 Hz frequency. Initial temperature Tc +2 mK, quench −2.4 mK. (Adapted from Beysens et al., 2009). (B–D): Simulation of the thermal field evolution in a square cell of 7 mm length with isothermal walls filled with H2. Vibration (direction: Double white arrow) is 20 mm amplitude and 5.56 Hz frequency. Initial temperature Tc + 1 K, quench −0.1 K. Several instabilities are present: (B) Corner instability; (C) parametric instability on the vertical walls; (D) vibrational Rayleigh instability on the horizontal walls. (Adapted from Gandikota et al., 2013).
Instabilities of parametric nature can in turn develop when the vibration direction is perpendicular to the thermal boundary layer. A 2D numerical analysis was carried out by Gandikota et al. (2013) in a square cell with supercritical H2 (Figures 6C,D). The vibration amplitudes were varied between 0.05 and 5 times the cell side and the frequencies ranged from 2.78 to 25 Hz. Different thermal conditions of border were also considered (all isothermal walls, adiabatic vertical wall/isothermal horizontal wall, adiabatic horizontal wall/isothermal vertical wall) and several temperatures (T–Tc = 10 mk, 100 mk, and 1 K). In this study the roles of the Rayleigh vibrational and parametric instabilities in a thermal field were emphasized, as the importance of the corners of the cells in triggering a “corner” instability (Figure 6B).
6.2 Liquid-Vapor Phase Transition Under Vibration
The phase transition process under vibration was investigated in fluids H2 under magnetic levitation and CO2 in sounding rockets. Following section 4, a phase change without vibrations is concerned with only two cases. When the volume fraction of the nucleated phase is less than 30%, a pattern of vapor bubble (or liquid droplets) develop at the expense of the other, homogeneous phase. When the volume fraction of the nucleated phase is greater than 30%, an interconnected pattern of the nucleated phase shows up.
When the phase change process is carried out under vibration, inertial effects can affect the nucleated domains whose density is different from the matrix phase. Domains acquire a velocity different from the surrounding phase provided that their size is larger than the viscous boundary layer, l, where the effect of viscosity is important. The condition above can thus be written as:
A Bernoulli pressure develops perpendicularly to the interface because of the difference between the liquid and vapor phase velocities. It results a force that increase in the direction perpendicular to vibration the coalescence events between domains. In the other direction, parallel to vibration, coalescence between domains are not affected and growth can proceed as if there were no vibrations.
The pattern of disconnected drops or bubbles (Figure 7A) is unaffected by vibrations in region (A) where the size of domains (radius R) is lesser than the viscous boundary layer. Here the radius grows as R∼t1/3, corresponding to a growth only limited by Brownian diffusion (Eq. 9). When R > l, (region B in Figure 7A), the evolution becomes R∼t1/2. This growth law is the signature of coalescences limited by Levy flights (Beysens et al., 2008). Because of the existence of hydrodynamical forces which repulse bubbles parallel to the vibration direction or attract them perpendicular to the vibration direction (Lyubimov et al., 2001), drops eventually order in periodic rows perpendicular to the vibration direction (Figure 7A).
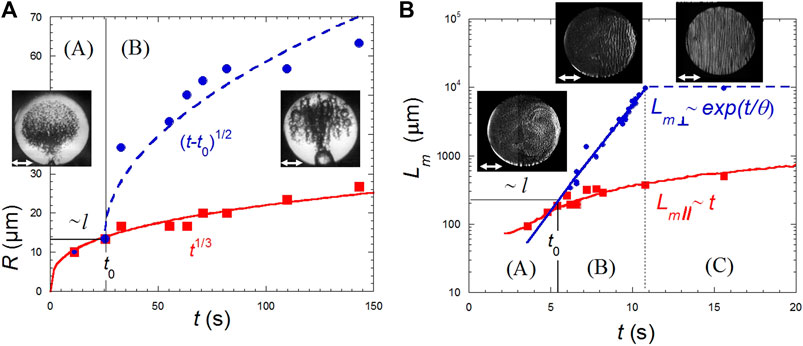
FIGURE 7. Phase separation under harmonic vibration of amplitude ≈0.3 mm and frequency ≈20 Hz. The double white arrows indicate the vibration direction. The region (A) is for Lm < l (the viscous boundary layer) and (B,C) for Lm > l, corresponding to time t0 (see text). Region (C) corresponds to the time where domains size reaches the sample dimension. (A) Evolution in H2 of a disconnected bubble pattern with mean radius, R, with typical pictures. Red squares: Bubble population unaffected by vibrations (Eq. 9). Blue dots: Bubbles aligned in rows coalescing in region (B) in the direction perpendicular to vibrations. The full curve is a fit to a t1/3 growth law and the interrupted curve a fit to (t−to)1/2 growth law. The cell diameter is 3 mm. (Data from Beysens et al., 2008). (B) Evolution (semi-log plot) of an interconnected domain pattern, with typical pictures, in the direction parallel to vibration direction (typical domain lengthscale Lm//, crosses) and perpendicular (Lm⊥, open circles). Red squares correspond to domains parallel to the vibration direction,
The interconnected pattern evolution is different in three characteristic time regions (Beysens et al., 2005; Beysens et al., 2009; Figure 7B). Region (A) corresponds to phase separating domains smaller than the viscous boundary length l, Lm < l (Eq. 18) where vibration is not “felt” by the domains. For Lm > l, region (B), the Bernoulli pressure imposes an exponential growth perpendicular to the vibration direction, a direction along which the domains are stretched. The evolution of the characteristic length follows
with the typical time, where Δρ = ρl − ρv
Region (C) corresponds to the time when the domains extent attains the sample dimension. The pattern exhibits periodic bands perpendicular to the vibration direction and continues to rearrange in the direction parallel to vibration (Wunenburger et al., 1999; Lyubimova et al., 2017). These bands correspond to “frozen waves” and are studied in section 6.3.3.
6.3 Vibrational Instability Below the Critical Point (T < Tc)
A liquid-vapor fluid at equilibrium under weightlessness shows a liquid phase which wets the cell walls, surrounding a single vapor bubble. The bubble can be more or less spherical according to its volume fraction and the form of the cell, which imposes geometrical constraints. When the fluid is submitted to vibrations, the vibration direction can be in certain regions of the interface parallel (or tangential) to the liquid-vapor interface and in other regions perpendicular, thus authorizing different kinds of instabilities. These instabilities have different thresholds depending on the value of the important parameters of the fluid, the interfacial tension σ and the liquid-vapor difference Δρ. Since the latter parameters strongly diminishes when nearing the CP with different power law exponents (Table 2), diverse instabilities can show up at various distances from the CP.
6.3.1 Dynamical Liquid-Vapor Interface Equilibrium at Various Gravity Levels
The orientation of the H2 liquid-vapor interface has been investigated under the effect of a harmonic horizontal vibration at various effective gravity levels by Gandikota et al. (2014a). Gravity can be varied in magnetic levitation by simply modifying the magnetic field amplitude. The situation is similar to a simple pendulum which can be stabilized in an upside-down position by vibrating horizontally its support at a frequency much higher than the natural frequency of the pendulum. A similar phenomenon happens with a vapor-liquid interface submitted to a horizontal harmonic vibration. The interface attains an equilibrium position at an angle α with vertical (Figure 8A) above a critical value of the vibrational velocity
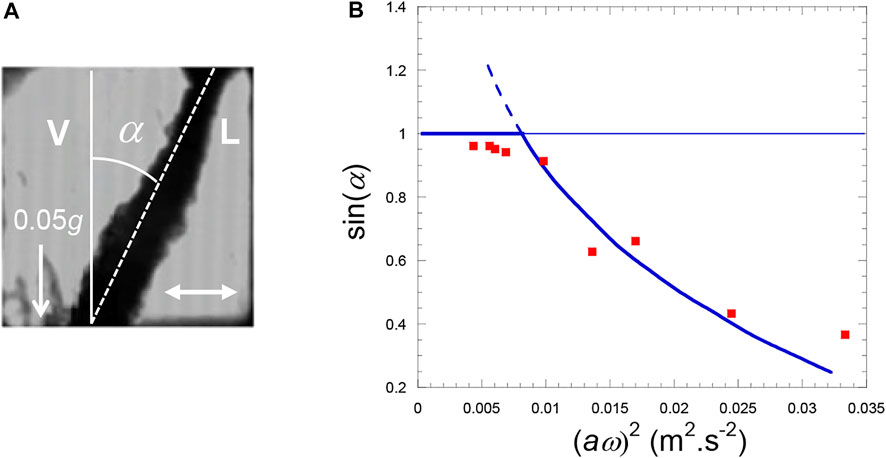
FIGURE 8. (A) H2 liquid (L)−vapor (V) interface orientates at angle α with respect to gravity direction (white arrow; effective gravity g* = 0.05 g) under the influence of vibration (white double arrow; amplitude a = 0.83 mm, frequency f = 35 Hz). Temperature is Tc−45 mK. The cell is a cube with side 7 mm. (B) Comparison of the experimental data with the Wolf’s theory (Eq. 21) (gravity level: 0.05 g, temperature Tc−45 mK). (Data from Gandikota et al., 2014a).
The results at different vibration amplitudes a and angular frequencies ω for effective gravity g* = 0.05 g compare well with the theory of Wolf (1969) as seen in Figure 8B.
6.3.2 Frozen Wave Instability Under Various Gravity Levels
Experiments in SF6 under 1-g gravity have been carried out by Wunenburger et al. (1999) and in H2 in partial or total magnetic levitation by Gandikota et al., 2014c in the same configuration as in the above section 6.3.1. The frozen wave instability was investigated at various temperatures and gravity levels.
The frozen wave instability develops at a vapor-liquid interface submitted to a harmonic vibration in a tangential direction. The instability condition is expressed in the same way as in the conventional Kelvin-Helmholtz instability, from a linear stability analysis. By analyzing the linear stability of the quasi-equilibrium state, Lyubimov and Cherepanov (1986) obtained an explicit formula for the neutral curve:
Here
where
is the critical value of the squared vibration velocity amplitude at the instability onset.
The diagram of stability is reported in Figure 9A. The experiments at various g levels show a good agreement with the inviscid model of Lyubimov and Cherepanov (1986), whatever is the gravity level. In the experiments the amplitude of the frozen waves is seen to slightly vary with temperature. The amplitude increases with g according to a power law with exponent—0.7. The wave height thus unavoidably becomes on the order of the cell size as g is decreased enough (Figure 9B). The vapor-liquid interface therefore appears as a pattern of alternate liquid and vapor bands. This phenomenon is analyzed in the next section 6.3.3.
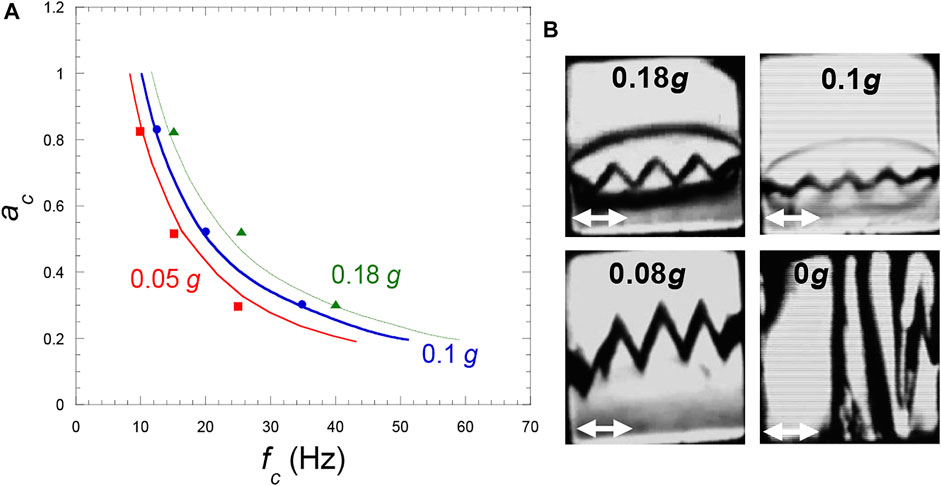
FIGURE 9. (A) Frozen wave instability phase diagram (vibration amplitude versus frequency) in H2 at three gravity levels. The curves represent the Eq. 23 at Tc–1 mK for the indicated g-values and the symbols the experimental values. (Data from Gandikota et al., 2014c). (B) Frozen wave amplitude for various gravity levels at 1 mK from the CP in a cubic cell of 7 mm side. (Vibration a = 0.53 mm, f = 35 Hz; same cell as in Figure 8A). The white double arrow is the vibration direction. (Adapted from Gandikota et al., 2014c).
6.3.3 Band Instability Under Weightlessness
When g is equal to zero, a band pattern is effectively observed near Tc in CO2 in sounding rocket experiments (Figure 10A; Beysens et al., 1998; Beysens et al., 2007; Beysens et al., 2009) and in H2 under magnetic compensation of gravity (Figures 9B, 10B; Gandikota et al., 2014c). The formation of such band patterns when g is negligible with respect to the vibrational acceleration was predicted by Lyubimov and Lyubimova (1990) and observed by Beysens et al. (1998). Whereas the band pattern is evocative of the frozen wave which form under a gravity field (section 6.3.2. above), the investigation by Lyubimova et al. (2017) show that they are not identical.
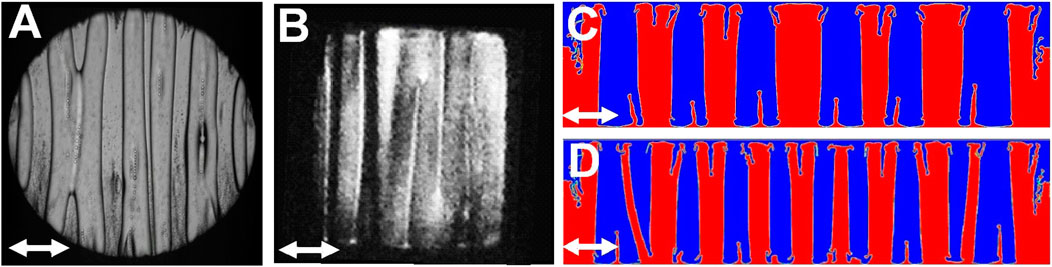
FIGURE 10. Band pattern under weightlessness under vibration (white double arrow). (Adapted from Lyubimova et al., 2017). (A) CO2 at Tc–2.4 mK; cell of 10 mm diameter and 2.189 mm thickness; vibration a = 0.7 mm, f = 10.37 Hz. (B) H2 at Tc–5 mK; cell 3 × 3 × 2 mm3; vibration a = 0.29 mm, f = 40 Hz. (C,D) Numerical simulation with zero surface tension and diminution of shear viscosity from (C) to (D). Viscosity is identical in both fluids as T is close to Tc. Vibration a = 1.8 mm, f = 30 Hz. (C) µ = 0.075 Pa.s; (D) µ = 0.05 Pa.s. The pattern wavelength diminishes with the decrease of viscosity.
It follows from Eq. 22 that stability is lost under zero gravity conditions (cf. the terms under bracket), in the same way as the Kelvin-Helmholtz instability occuring at the interface of two steady parallel flows. The difference is the absence of instability threshold. Indeed the neutral curve Eq. 22 does not exhibit a minimum. Then the instability grows even at small values of the vibrational velocity aω. Following Burnysheva et al. (2011), the wavelength selection should correspond to the wavelength giving the maximal growth rate to the perturbations. The following expression is thus obtained for the exponential growth rate
The coordinates of the maximum of the curve
This relation can be written in dimensionless form with
Equation 26 therefore becomes:
It is not possible to derive an analytical expression as Eqs 25, 26 for viscous fluids. The solution has to be found numerically from the linearized problem concerning the evolution of small perturbations of the base state (Lyubimova et al., 2017). Direct numerical simulations were also performed by Lyubimova et al. (2017); the importance of viscosity is there emphasized in the pattern formation (Figures 10C,D), the critical wavelength strongly depending on viscosity (Figure 11A).
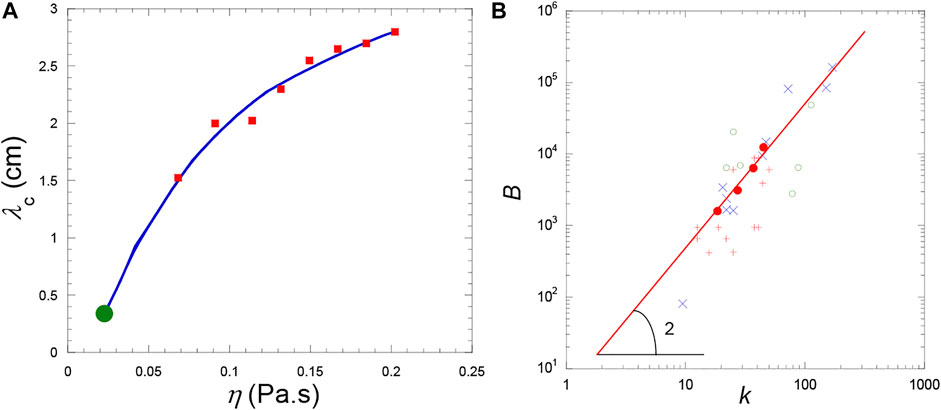
FIGURE 11. (A) Variations of the pattern wavelength λc = 2π/kc (cm) on shear viscosity η (Pa.s) (vibration characteristics a = 1.8 mm and f = 30 Hz). Red squares: Direct numerical simulation. The solid curve is a smoothing function. The full green circle is the value determined from the analytical formula Eq. 26 for inviscid fluids. (Data from Lyubimova et al. (2017). (B) Dimensionless vibration parameter B as a function of the dimensionless band wavevector
Comparison with experiments by Lyubimova et al. (2017) is concerned with CO2 in sounding rockets. The variations of B with the dimensionless band wavevector
6.3.4 Faraday Instability Under Weightlessness
6.3.4.1 One Single Interface
In H2 under magnetic levitation, a Faraday instability (frequency half of the vibration), develops on the part of the liquid-vapor interface perpendicular to the direction of vibration for vibration parameters above the onset of instability (Figure 12A; Gandikota et al., 2014b). The latter observation shows that Faraday waves can indeed form under weightlessness.
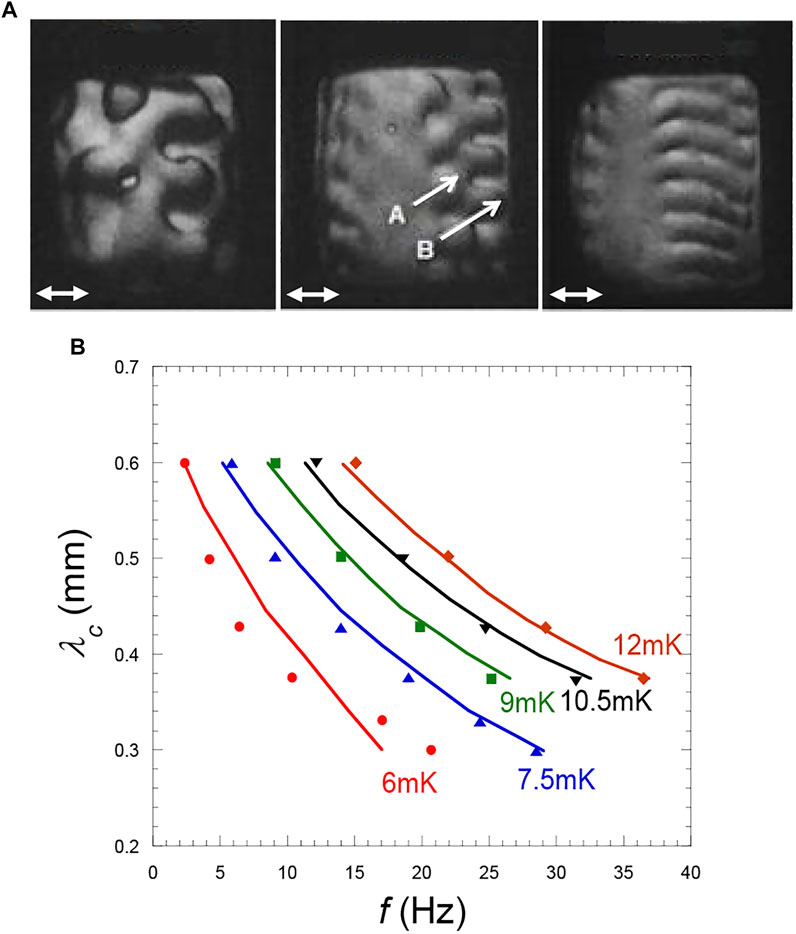
FIGURE 12. (A) Variation with Tc–T of the wavelength of a Faraday wave instability (from three fingers at Tc–T = 20 mK to nine fingers at Tc–T = 10.5 mK. A and B indicate two rows of fingers in two different planes. At Tc–T ≈ 8 mK, a transition square-roll occurs (see text). The instabilities develop symmetrically on the left and right parts of the interface that are directed perpendicular to the vibration direction. (Vibration a = 0.29 mm and f = 40 Hz; direction: double arrow same cell as in Figure 10A). (Adapted from Gandikota et al., 2014b). (B) Faraday critical wavelength λc at the instability threshold with respect to frequency f for different values of Tc–T. The curves are theoretical values from Eq. 29. (Data from Gandikota et al., 2014b).
The Faraday wave instability under vibration in the absence of gravity can be schematized by considering two layers of immiscible and incompressible viscous fluids submitted to a vibration perpendicular to the interface. Kumar and Tuckerman (1994) solved the stability problem in a 1-g environment by using a Floquet analysis. They performed numerical calculations founded on the linearized Navier-Stokes equations and analytical calculations; for low viscous fluids, they introduced phenomenologically the viscosity into the Mathieu equation. For low fluid viscosities the dispersion relation for g = 0 conditions is then:
The critical amplitude at the onset of instability, as obtained by Shevtsova et al. (2016) for a single fluid interface, is written as:
In the above equation the liquid and vapor shear viscosities were assumed to be equal
According to Eq. 29, the instability wavelength decreases with surface tension σ tending to zero when approaching the CP (Table 2). To this decrease corresponds an increase of viscous dissipation. When the dissipation becomes too large, the classical square pattern transforms itself into a roll (line) pattern. The transition square—line occurs for temperature
6.3.4.2 Pattern of Interfaces
Very near Tc where the band pattern develops, and for large enough vibration velocity an instability can occur on the interfaces perpendicular to vibrations. It leads to the appearance of Faraday rolls (Figures 13A,B) because of the closeness to Tc (section 6.3.4.1 above). Interactions between the bands make the situation different from the classical Faraday instability on a single interface between two fluid layers.
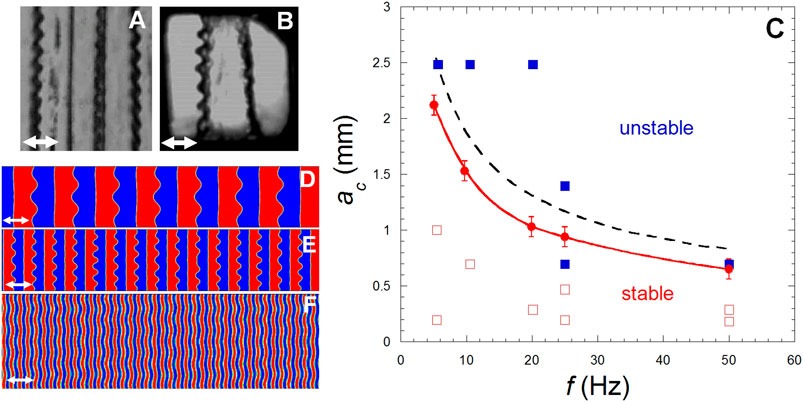
FIGURE 13. (A,B) Faraday waves on bands (roll pattern) under weightlessness. The black lines are the liquid-vapor interfaces. Both phases appear as alternate vapor and liquid bands oriented perpendiculary to the vibration direction (white double arrows). (Adapted from Lyubimova et al., 2017). (A) CO2 at Tc−2.4 mK, in the same cell as in Figure 10A. Vibration a = 0.7 mm and f = 10.37 Hz. (B) H2 at Tc − 10 mK in the same cell as in Figure 10B. Vibration a = 0.83 mm and f = 20 Hz. (C). Stability map from the results of experiments, analytical analysis and numerical simulation. Experimental results with H2: Red squares with open squares for stable states and full squares for instability. The red dots and red curve (smoothening) correspond to numerical simulations. The interrupted black curve represents the analytical estimation (Eq. 32). (Data from Lyubimova et al., 2019). (D–F). Faraday waves on bands near Tc in weightlessness for vibration parameters: (D) a = 2.5 mm, f = 5 Hz, pattern wavelength λ = 0.8 mm; (E) a = 1.1 mm, f = 25 Hz, λ = 0.4 mm, (F) a = 1.6 mm, f = 20 Hz, λ = 0.1 mm. The double white arrow is vibration direction. (Data from Lyubimova et al., 2019).
Theoretical, numerical and experimental investigations of the Faraday instability onset and development in such band pattern were carried out by Lyubimova et al. (2019), taking into account the interaction between bands. An analytical solution was found assuming fluid low viscosity and low surface tension as it the case near a CP. Assuming small viscosity, the neutral curve can be written as, with γ = 4k2μ/(ρl +ρv):
One obtains the critical amplitude at the onset of instability by minimizing the neutral curve (Eq. 31) with respect to the wavenumber. Due to the vicinity of the critical point, both liquid and vapor shear viscosities were assumed to be equal (=
The dimensionless wavelength of the band pattern is written as H=kh. The variation of
The 2D numerical modeling of Faraday waves uses the Navier-Stokes equations and, for interface tracking, the volume of fluid method (Figures 13D–F). It is found that for small band pattern wavelengths the interactions between the interfaces stabilize the system. The Faraday wave dynamics on the band interfaces are similar to sub-harmonic oscillations: the waves correspond to classical Faraday waves.
Good agreement is found when comparing the analytical results obtained on the critical amplitude of the vibration with the stability curves determined by direct numerical simulation and experiments (Figure 13C). However, the analytical analysis exhibits a small overestimation of the critical vibration amplitude. This deviation was expected since similar deviation was observed by Shevtsova et al. (2016) for a single fluid interface.
7 Conclusion
The absence of gravity effects in space, or on Earth when compensating gravity by magnetic fields, leads to uncover and/or magnify transport phenomena hidden partially or totally on Earth. Fluids near their critical point, because of their large or small anomalous values of thermodynamic and transport parameters, which accentuate the effects of gravity, make more apparent the effects of weightlessness and highlight the other processes.
Thermal effects lead to paradoxical phenomena as the critical speeding up by adiabatic heating or Piston effect, instead of the expected critical slowing down due to heat diffusion. It results that transient phenomena can go again the common sense such as heat flow flowing backwards, or cooling resulting from heating. The Piston Effect is in itself now rather well understood, but some important questions remain open when going very near the critical point. For instance, the effect of bulk viscosity can make uncertain or even wrong the assumption of a uniform pressure distribution in the early stages of the Piston Effect and a critical slowing down may occur (Carlès, 1998; Carlès and Dadzie, 2005). Very near the CP, the thermal equilibration time can become so small such as to reach the typical acoustic time for sound waves to cross the fluid sample, where it should saturate at this value (Zappoli and Carles, 1996). No experimentations yet have checked this expectation. The typical boundary layer thickness, which becomes smaller and smaller as the critical point is neared, can become smaller than the correlation length, which in contrast diverges at the critical point. A novel and unknown situation may occur.
Mass transport during liquid-vapor phase separation from supercritical conditions, once unaffected by gravity effects, lead to universality in the evolution of the phase separating domains (drops or bubbles). Although the mechanisms involved in this process are now well known, some situations have not been well investigated, such as phase separation when starting in the two-phase region. Also the thermal problems associated to the release of latent heat have not been well investigated. Furthermore the role of a wall with the different wetting properties of liquid and vapor at its contact and the local heat flux are not well understood, in particular near the critical point when the effect of the Piston Effect becomes important. Concerning boiling, different mechanisms can occur when going further from the CP. As noted by Konishi and Mudawar (2015), there is a severe shortage of useful correlations, mechanistic and computational models, which compromises readiness to adopt flow boiling in future space systems.
Vibrations, which correspond to momentum transport, are seen to affect the shape of the liquid-vapor interface, which flattens and orientates perpendicularly to the vibration direction, making vibration working as a kind of artificial gravity. Under some conditions of vibrations, this interface order in bands, a reminiscence of “frozen” waves observed under gravity. Perpendicularly to vibrations, Faraday instabilities can develop, whose square wave pattern transforms into rolls very near the critical point. Special Faraday instability can also develop on bands, with flow correlations between the neighboring wave patterns. The diversity of instabilities triggered by small amplitude and large frequency vibrations can be large and other instabilities, not yet observed, are likely to be present. The behavior of fluids in presence of large amplitude and/or small frequency vibrations could be an interesting topic to investigate. Very few theoretical and experimental investigations have been still devoted to this question.
It is thus a rich phenomenology that arises for transport phenomena near the critical point under weightlessness. It permits to understand various behaviors which were misunderstood or ignored on Earth or misleadingly attributed to buoyancy effects. More generally, these investigations give us the possibility to predict and better understand the complex and in some aspects still unexplored behavior of fluids in the spatial ambiance of weightlessness and time-dependent accelerations and vibrations.
Author Contributions
The author confirms being the sole contributor of this work and has approved it for publication.
Conflict of Interest
The author declares that the research was conducted in the absence of any commercial or financial relationships that could be construed as a potential conflict of interest.
Publisher’s Note
All claims expressed in this article are solely those of the authors and do not necessarily represent those of their affiliated organizations, or those of the publisher, the editors and the reviewers. Any product that may be evaluated in this article, or claim that may be made by its manufacturer, is not guaranteed or endorsed by the publisher.
Acknowledgments
This review has been made possible thanks to the friendly help and contribution of many friends. I would like to particularly thank Y. Garrabos, B. Zappoli, C. Lecoutre, T. Lyubimova and D. Chatain. The long-term supports of ESA and CNES, the latter with financial support, are gratefully acknowledged.
References
Abdulagatov, I. M., and Skripov, P. V. (2021). Thermodynamic and Transport Properties of Supercritical Fluids. Part 2: Review of Transport Properties. Russ. J. Phys. Chem. B 15, 1171–1188. doi:10.1134/s1990793121070022
Air Liquide (2022). Available at: https://advancedtech.airliquide.com/liquid-helium-tanks.
Amiroudine, S., and Beysens, D. (2008). Thermovibrational Instability in Supercritical Fluids Under Weightlessness. Phys. Rev. E 78, 036325. doi:10.1103/PhysRevE.78.036325
Bailly, D., and Zappoli, B. (2000). Hydrodynamic Theory of Density Relaxation in Near-Critical Fluids. Phys. Rev. E 62, 2353–2368. doi:10.1103/physreve.62.2353
Barmatz, M., Hahn, I., Lipa, J. A., and Duncan, R. V. (2007). Critical Phenomena in Microgravity: Past, Present, and Future. Rev Mod. Phys. 79, 1–52.
Bartscher, C., and Straub, J. (2002). Dynamic Behavior of a Pure Fluid at and Near its Critical Density Under Microgravity and 1g. Int. J. Thermophys. 23, 77–87. doi:10.1023/a:1013944824998
Berg, R. F., and Moldover, M. R. (1990). Critical Exponent for the Viscosity of Carbon Dioxide and Xenon. J. Chem. Phys. 93, 1926–1938. doi:10.1063/1.459679
Berg, R. F., Moldover, M. R., and Zimmerli, G. A. (1999). Viscoelasticity of Xenon Near the Critical Point. Phys. Rev. Lett. 82, 920–923. doi:10.1103/physrevlett.82.920
Beysens, D. A., and Garrabos, Y. (2000). The Phase Transition of Gases and Liquids. Phys. A Stat. Mech. Its Appl. 281, 361–380. and refs. therein. doi:10.1016/s0378-4371(00)00030-3
D. A. Beysens, and J. J. van Loon (Editors) (2015). Generation and Applications of Extra-Terrestrial Environments on Earth (Gistrup: Rivers Publishers).
Beysens, D., Gbadamassi, M., and Moncef-Bouanz, B. (1983). New Developments in the Study of Binary Fluids Under Shear Flow. Phys. Rev. A 28, 2491–2509. and Refs. therein. doi:10.1103/physreva.28.2491
Beysens, D., Wunenberger, R., Chabot, C., and Garrabos, Y. (1998). Effect of Oscillatory Accelerations on Two-Phase Fluids. Microgravity Sci. Technol. 11, 113–118.
Beysens, D., Chatain, D., Evesque, P., and Garrabos, Y. (2005). High-Frequency Driven Capillary Flows Speed Up the Gas-Liquid Phase Transition in Zero-Gravity Conditions. Phys. Rev. Lett. 95, 034502. doi:10.1103/PhysRevLett.95.034502
Beysens, D., Chatain, D., Garrabos, Y., Lecoutre, C., Palencia, F., Evesque, P., et al. (2007). The Effect of Vibrations on Heterogeneous Fluids: Some Studies in Weightlessness. Acta Astronaut. 61, 1002–1009. doi:10.1016/j.actaastro.2006.12.041
Beysens, D., Chatain, D., Evesque, P., and Garrabos, Y. (2008). Nucleation and Growth of a Bubble Pattern Under Vibrations in Weightlessness. Europhys. Lett. 82, 36003. doi:10.1209/0295-5075/82/36003
Beysens, D., Garrabos, Y., Chatain, D., and Evesque, P. (2009). Phase Transition Under Forced Vibrations in Critical CO2. Europhys. Lett. 86, 16003. doi:10.1209/0295-5075/86/16003
Beysens, D., Chatain, D., Nikolayev, V. S., Ouazzani, J., and Garrabos, Y. (2010). Possibility of Long-Distance Heat Transport in Weightlessness Using Supercritical Fluids. Phys. Rev. E 82, 061126. doi:10.1103/PhysRevE.82.061126
Beysens, D., Fröhlich, T., and Garrabos, Y. (2011). Heat Can Cool Near-Critical Fluids. Phys. Rev. E. 84, 051201. doi:10.1103/PhysRevE.84.051201
Beysens, D. A., Garrabos, Y., and Zappoli, B. (2021). “Thermal Effects in Near-Critical Fluids: Piston Effect and Related Phenomena,” in Handbook of Research on Advancements in Supercritical Fluids Applications for Sustainable Energy Systems (Hershey: IGI Global), 1–31. doi:10.4018/978-1-7998-5796-9.ch001
Bhattacharjee, J. K., and Ferrell, R. A. (1983). Frequency-Dependent Critical Viscosity of a Classical Fluid. Phys. Rev. A 27, 1544–1555. doi:10.1103/physreva.27.1544
Boukari, H., Shaumeyer, J. N., Briggs, M. E., and Gammon, R. W. (1990a). Critical Speeding Up in Pure Fluids. Phys. Rev. A 41, 2260–2263. doi:10.1103/physreva.41.2260
Boukari, H., Briggs, M. E., Shaumeyer, J. N., and Gammon, R. W. (1990b). Critical Speeding Up Observed. Phys. Rev. Lett. 65, 2654–2657. doi:10.1103/physrevlett.65.2654
Burnysheva, A. V., Lyubimov, D. V., and Lyubimova, T. P. (2011). Disturbance Spectrum of a Plane Fluid-Fluid Interface in the Field of Tangential High-Frequency Vibrations Underweightlessness. Fluid Dyn. 46, 1000–1009. doi:10.1134/s0015462811060184
Carlès, P., and Dadzie, K. (2005). Two Typical Time Scales of the Piston Effect. Phys. Rev. E 71, 066310. doi:10.1103/PhysRevE.71.066310
Carlès, P. (1998). The Effect of Bulk Viscosity on Temperature Relaxation Near the Critical Point. Phys. Fluids 10, 2164–2176.
Chimowitz, E. H. (2005). Introduction to Critical Phenomena in Fluids. Oxford: Oxford University Press.
Colin, C., Kannengieser, O., Bergez, W., Lebon, M., Sebilleau, J., Sagan, M., et al. (2017). Nucleate Pool Boiling in Microgravity: Recent Progress and Future Prospects. Comptes Rendus Mécanique 345, 21–34. doi:10.1016/j.crme.2016.10.004
De Bruijn, R., Van Diest, R. J. J., Karapantsios, T. D., Michels, A. C., Wakeham, W. A., and Trusler, J. P. M. (1997). Heat Transfer in Pure Critical Fluids Surrounded by Finitely Conducting Boundaries in Microgravity. Phys. A Stat. Mech. Its Appl. 242, 119–140. doi:10.1016/s0378-4371(97)00197-0
Deutch, J. M., and Zwanzig, R. (1967). Anomalous Specific Heat and Viscosity of Binary van der Waals Mixtures. J. Chem. Phys. 46, 1612–1620. doi:10.1063/1.1840914
Fauve, S., Kumar, K., Laroche, C., Beysens, D., and Garrabos, Y. (1992). Parametric Instability of a Liquid-Vapor Interface Close to the Critical Point. Phys. Rev. Lett. 68, 3160–3163. doi:10.1103/physrevlett.68.3160
Ferrell, R. A., and Hao, H. (1993). Adiabetic Temperature Changes in a One-Component Fluid Near the Liquid-Vapor Critical Point. Phys. A Stat. Mech. Its Appl. 197, 23–46. doi:10.1016/0378-4371(93)90456-e
Fisher, M. E. (1964). Correlation Functions and the Critical Region of Simple Fluids. J. Math. Phys. 5, 944–962. doi:10.1063/1.1704197
Fröhlich, T., Guenoun, P., Bonetti, M., Perrot, F., Beysens, D., Garrabos, Y., et al. (1996). Adiabatic versus Conductive Heat Transfer in Off-Critical SF6 in the Absence of Convection. Phys. Rev. E 54, 1544–1549. doi:10.1103/physreve.54.1544
Fröhlich, T., Beysens, D., and Garrabos, Y. (2006). Piston-Effect-Induced Thermal Jets in Near-Critical Fluids. Phys. Rev. E 74, 046307. doi:10.1103/PhysRevE.74.046307
Furukawa, H. (1985). A Dynamic Scaling Assumption for Phase Separation. Adv. Phys. 34, 703–750. doi:10.1080/00018738500101841
Gandikota, G., Amiroudine, S., Chatain, D., Lyubimova, T., and Beysens, D. (2013). Rayleigh and Parametric Thermo-Vibrational Instabilities in Supercritical Fluids Under Weightlessness. Phys. Fluids 25, 033401. doi:10.1063/1.4811400
Gandikota, G., Chatain, D., Lyubimova, T., and Beysens, D. (2014a). Dynamic Equilibrium Under Vibrations of H₂ Liquid-Vapor Interface at Various Gravity Levels. Phys. Rev. E 89, 063003. doi:10.1103/PhysRevE.89.063003
Gandikota, G., Chatain, D., Amiroudine, S., Lyubimova, T., and Beysens, D. (2014b). Faraday Instability in a Near-Critical Fluid Under Weightlessness. Phys. Rev. E 89, 013022. doi:10.1103/PhysRevE.89.013022
Gandikota, G., Chatain, D., Amiroudine, S., Lyubimova, T., and Beysens, D. (2014c). Frozen-Wave Instability in Near-Critical Hydrogen Subjected to Horizontal Vibration Under Various Gravity Fields. Phys. Rev. E 89, 012309. doi:10.1103/PhysRevE.89.012309
Garrabos, Y., Bonetti, M., Beysens, D., Perrot, F., Fröhlich, T., Carlès, P., et al. (1998). Relaxation of a Supercritical Fluid after a Heat Pulse in the Absence of Gravity Effects: Theory and Experiments. Phys. Rev. E 57, 5665–5681. doi:10.1103/physreve.57.5665
Garrabos, Y., Dejoan, A., Lecoutre, C., Beysens, D., Nikolayev, V., and Wunenburger, R. (2001a). Piston Effect in a Supercritical Fluid Sample Cell : A Phenomenological Approach of the Mechanisms. Le J. de Physique IV11 (PR6), Pr6–23. doi:10.1051/jp4:2001603
Garrabos, Y., Lecoutre-Chabot, C., Hegseth, J., Nikolayev, V. S., Beysens, D., and Delville, J. P. (2001b). Gas Spreading on a Heated Wall Wetted by Liquid. Phys. Rev. E 64, 051602. doi:10.1103/PhysRevE.64.051602
Garrabos, Y., Beysens, D., Lecoutre, C., Dejoan, A., Polezhaev, V., and Emelianov, V. (2007). Thermoconvectional Phenomena Induced by Vibrations in Supercritical SF6 Under Weightlessness. Phys. Rev. E 75, 056317. doi:10.1103/PhysRevE.75.056317
Gillis, K. A., Shinder, I. I., and Moldover, M. R. (2005). Bulk Viscosity of Stirred Xenon Near the Critical Point. Phys. Rev. E 72 (5), 051201. doi:10.1103/PhysRevE.72.051201
Guenoun, P., Khalil, B., Beysens, D., Garrabos, Y., Kammoun, F., Le Neindre, B., et al. (1993). Thermal Cycle Around the Critical Point of Carbon Dioxide Under Reduced Gravity. Phys. Rev. E 47, 1531–1540. doi:10.1103/physreve.47.1531
Hau, H., Ferrell, R. A., and Bhattacharjee, J. K. (2005). Critical Viscosity Exponent for Classical Fluids. Phys. Rev. E 7, 1021201. doi:10.1103/PhysRevE.71.021201
Hegseth, J., Oprisan, A., Garrabos, Y., Nikolayev, V. S., Lecoutre-Chabot, C., and Beysens, D. (2005). Wetting Film Dynamics During Evaporation Under Weightlessness in a Near-Critical Fluid. Phys. Rev. E 72, 031602. doi:10.1103/PhysRevE.72.031602
Houessou, C., Guenoun, P., Gastaud, R., Perrot, F., and Beysens, D. (1985). Critical Behavior of the Binary Fluids Cyclohexane-Methanol, Deuterated Cyclohexane-Methanol and of Their Isodensity Mixture: Application to Microgravity Simulations and Wetting Phenomena. Phys. Rev. A 32, 1818–1833. doi:10.1103/physreva.32.1818
Jany, P., and Straub, J. (1987). Thermal Diffusivity of Fluids in a Broad Region Around the Critical Point. Int. J. Thermophys. 8, 165–180. doi:10.1007/bf00515200
Kawasaki, K. (1970). Kinetic Equations and Time Correlation Functions of Critical Fluctuations. Ann. Phys. 61, 1–56. doi:10.1016/0003-4916(70)90375-1
Klein, H., Schmitz, G., and Woermann, D. (1991). Temperature Propagation in Near-Critical Fluids Prior to and During Phase Separation. Phys. Rev. A 43, 4562–4563. doi:10.1103/physreva.43.4562
Konishi, C., and Mudawar, I. (2015). Review of Flow Boiling and Critical Heat Flux in Microgravity. Int. J. Heat Mass Transf. 80, 469–493. doi:10.1016/j.ijheatmasstransfer.2014.09.017
Kumar, K., and Tuckerman, L. S. (1994). Parametric Instability of the Interface Between Two Fluids. J. Fluid Mech. 279, 49–68. doi:10.1017/s0022112094003812
Luettmer-Strathmann, J., Sengers, J. V., and Olchowy, G. A. (1995). Non‐Asymptotic Critical Behavior Of The Transport Properties Of Fluids. J. Chem. Phys. 103, 7482–7501. doi:10.1063/1.470718
Lyubimov, D. V., and Cherepanov, A. A. (1986). Development of a Steady Relief at the Interface of Fluids in a Vibrational Field. Fluid Dyn. 21, 849–854. doi:10.1007/bf02628017
Lyubimov, D. V., and Lyubimova, T. P. (1990). About One End-To-End Account Method to Solve Problems with the Deformable Surface of the Section. Simul. Mech. 4, 136–140. (In Russian).
Lyubimov, D. V., Lyubimova, T. P., and Shklyaev, S. V. (2001). “Behaviour of a Drop (Bubble) in a Pulsating Flow Near Vibrating Rigid Surface,” in Proceedings of the 1st International Symposium on Microgravity Research & Applications in Physical Sciences and Biotechnology:10–15 September, 2000, Sorrento, Italy, ESA SP 454 (Noordwijk: European Space Agency), 879–886.
Lyubimova, T., Ivantsov, A., Garrabos, Y., Lecoutre, C., Gandikota, G., and Beysens, D. (2017). Band Instability in Near-Critical Fluids Subjected to Vibration Under Weightlessness. Phys. Rev. E 95, 013105. doi:10.1103/PhysRevE.95.013105
Lyubimova, T., Ivantsov, A., Garrabos, Y., Lecoutre, C., and Beysens, D. (2019). Faraday Waves on Band Pattern Under Zero Gravity Conditions. Phys. Rev. Fluids 4, 064001. doi:10.1103/physrevfluids.4.064001
Miura, Y., Yoshihara, S., Ohnishi, M., Honda, K., Matsumoto, M., Kawai, J., et al. (2006). High-Speed Observation of the Piston Effect Near the Gas-Liquid Critical Point. Phys. Rev. E 74, 010101. doi:10.1103/PhysRevE.74.010101
Moldover, M. R., Sengers, J. V., Gammon, R. W., and Hocken, R. J. (1979). Gravity Effects in Fluids Near the Gas-Liquid Critical Point. Rev. Mod. Phys. 51, 79–99. doi:10.1103/revmodphys.51.79
Nikolayev, V. S., and Beysens, D. A. (1999). Boiling Crisis and Non-Equilibrium Drying Transition. Europhys. Lett. 47, 345–351. doi:10.1209/epl/i1999-00395-x
Nikolayev, V. S., Beysens, D., and Guenoun, P. (1996). New Hydrodynamic Mechanism for Drop Coarsening. Phys. Rev. Lett. 76, 3144–3147. doi:10.1103/physrevlett.76.3144
Nikolayev, V. S., Chatain, D., Beysens, D., and Pichavant, G. (2010). Magnetic Gravity Compensation. Microgravity Sci. Technol. 23, 113–122. doi:10.1007/s12217-010-9217-6
Nikolayev, V. S., Chatain, D., Garrabos, Y., and Beysens, D. (2006). Experimental Evidence of the Vapor Recoil Mechanism in the Boiling Crisis. Phys. Rev. Lett. 97 (18), 184503.
Nitsche, K., and Straub, J. (1986). Die isochore Wärmekapazität am kritischen Punkt unter reduzierter Schwere. Naturwissenschaften 73, 370–373. doi:10.1007/bf00367269
Onuki, A., and Ferrell, R. A. (1990). Adiabatic Heating Effect Near the Gas-Liquid Critical Point. Phys. A Stat. Mech. its Appl. 164, 245–264. doi:10.1016/0378-4371(90)90198-2
Onuki, A., Hao, H., and Ferrell, R. A. (1990). Fast Adiabatic Equilibration in a Single-Component Fluid Near the Liquid-Vapor Critical Point. Phys. Rev. A 41, 2256–2259. doi:10.1103/physreva.41.2256
Oprisan, R., Oprisan, S. A., Bayley, B., Hegseth, J. J., Garrabos, Y., Lecoutre-Chabot, C., et al. (2012). Dynamic Structure Factor of Density Fluctuations From Direct Imaging Very Near (Both Above and Below) the Critical Point of SF6. Phys. Rev. E 86 (6), 061501.
Oschwald, M., Smith, J. J., Branam, R., Hussong, J., and Schik, A. (2006). Injection of Fluids into Supercritical Environments. Combust. Sci. Tech. 178, 49–100. doi:10.1080/00102200500292464
Pelissetto, A., and Vicari, E. (2002). Critical Phenomena and Renormalization-Group Theory. Phys. Rep. 368, 549–727. doi:10.1016/s0370-1573(02)00219-3
Sengers, J. V., and Perkins, R. A. (2014). Advances in Transport Properties of Fluids. Editors M. J. Assael, A. R. H. Goodwin, V. Vesovic, and W. A. Wakeham (Cambridge: IUPAC, RSC Publishing), 337–361.
Shevtsova, V., Gaponenko, Y. A., Yasnou, V., Mialdun, A., and Nepomnyashchy, A. (2016). Two-Scale Wave Patterns on a Periodically Excited Miscible Liquid-Liquid Interface. J. Fluid Mech. 795, 409–422. doi:10.1017/jfm.2016.222
Siggia, E. D. (1979). Late Stages of Spinodal Decomposition in Binary Mixtures. Phys. Rev. A 20, 595–605.
Stanley, H. E. (1971). Introduction to Phase Transitions and Critical Phenomena. Oxford: Clarendon Press.
Straub, J., Eicher, L., and Haupt, A. (1995a). Dynamic Temperature Propagation in a Pure Fluid Near its Critical Point Observed Under Microgravity During the German Spacelab Mission D-2. Phys. Rev. E 51, 5556–5563. doi:10.1103/physreve.51.5556
Straub, J., Eicher, L., and Haupt, A. (1995b). The Process of Heat and Mass Transport at the Critical Point of Pure Fluids. Int. J. Thermophys. 16, 1051–1058. doi:10.1007/bf02081274
Wilkinson, R. A., Zimmerli, G. A., Hao, H., Moldover, M. R., Berg, R. F., Johnson, W. L., et al. (1998). Equilibration Near the Liquid-Vapor Critical Point in Microgravity. Phys. Rev. E 57, 436–448.
Wolf, G. H. (1969). The Dynamic Stabilization of the Rayleigh-Taylor Instability and the Corresponding Dynamic Equilibrium. Z. Phys. 227, 291–300. doi:10.1007/bf01397662
Wunenburger, R., Evesque, P., Chabot, C., Garrabos, Y., Fauve, S., and Beysens, D. (1999). Frozen Wave Induced by High Frequency Horizontal Vibrations on a CO2 Liquid-Gas Interface Near the Critical Point. Phys. Rev. E 59, 5440–5445. doi:10.1103/physreve.59.5440
Wunenburger, R., Garrabos, Y., Lecoutre-Chabot, C., Beysens, D., and Hegseth, J. (2000). Thermalization of a Two-Phase Fluid in Low Gravity: Heat Transferred from Cold to Hot. Phys. Rev. Lett. 84, 4100–4103. doi:10.1103/physrevlett.84.4100
Wunenburger, R., Garrabos, Y., Lecoutre, C., Beysens, D., Hegseth, J., Zhong, F., et al. (2002). Thermal Response of a Two-Phase Near-Critical Fluid in Low Gravity: Strong Gas Overheating as Due to a Particular Phase Distribution. Int. J. Thermophys. 23, 103–115. doi:10.1023/a:1013948925906
Zappoli, B., and Carles, P. (1996). Acoustic Saturation of the Critical Speeding Up. Phys. D: Nonlinear Phenom. 89 (3-4), 381–394.
Zappoli, B., and Carles, P. (1995). The Thermo-Acoustic Nature of the Critical Speeding Up. Eur. J. Mech. B/Fluids 14, 41–65.
Zappoli, B., Bailly, D., Garrabos, Y., Le Neindre, B., Guenoun, P., and Beysens, D. (1990). Anomalous Heat Transport by the Piston Effect in Supercritical Fluids Under Zero Gravity. Phys. Rev. A 41, 2264–2267. doi:10.1103/physreva.41.2264
Zappoli, B., Beysens, D., and Garrabos, Y. (2015). Heat Transfer and Related Phenomena in Supercritical Fluids. Berlin Heidelberg: Springer-Verlag.
Keywords: fluids in microgravity, near-critical point, thermal effects in weightlessness, phase transition in weightlessness, vibration effects in weightlessness
Citation: Beysens D (2022) A Review on Transport Phenomena Near the Critical Point of Fluids Under Weightlessness. Front. Space Technol. 3:876642. doi: 10.3389/frspt.2022.876642
Received: 15 February 2022; Accepted: 11 April 2022;
Published: 25 May 2022.
Edited by:
Jack J. W. A. van Loon, VU Amsterdam, NetherlandsReviewed by:
Marco Marengo, University of Brighton, United KingdomJan Vincent Sengers, University of Maryland, College Park, United States
Copyright © 2022 Beysens. This is an open-access article distributed under the terms of the Creative Commons Attribution License (CC BY). The use, distribution or reproduction in other forums is permitted, provided the original author(s) and the copyright owner(s) are credited and that the original publication in this journal is cited, in accordance with accepted academic practice. No use, distribution or reproduction is permitted which does not comply with these terms.
*Correspondence: D. Beysens, ZGFuaWVsLmJleXNlbnNAZXNwY2kuZnI=