 Joe Louca
 John Vrublevskis
 Kerstin Eder
 Antonia Tzemanaki
- 1School of Engineering Mathematics and Technology, University of Bristol, Bristol, United Kingdom
- 2Bristol Robotics Laboratory, Bristol, United Kingdom
- 3Advanced Concepts Team, Thales Alenia Space (UK), Bristol, United Kingdom
- 4Trustworthy Systems Laboratory, University of Bristol, Bristol, United Kingdom
Introduction: Physical regolith simulants are valuable tools for developing In-Situ Resource Utilisation hardware. However, using virtual models of regolith instead can reduce costs, limit exposure to hazardous materials, and offer a practical method of testing the effects of reduced gravity.
Methods: We verify a virtual model of regolith as macroparticles against physical tests. Using space partitioning techniques to identify neighbouring particles, we present a scalable model of regolith, in which the computation time increases roughly proportionally with the number of particles. We evaluated the performance of this virtual simulant vs. a physical simulant (Exolith LMS-1) by comparing the flow rate through funnels of various diameters, and the resultant angle of repose of material on both large (500 g) and small (16 g) scale tests.
Results: For large scale tests, the flow rates were within the predicted range for macroparticles with radii 3–7 mm, with the greatest accuracy achieved for radii 4–5 mm. However, the macroparticles blocked the simulated funnels more easily than in the physical trials, due to their high cohesion. The angle of repose was not accurately represented by this model for either of the tests.
Discussion: The high efficiency of this model makes it best suited for applications which require large scale approximations of regolith with real-time execution, such as virtual training for robot operators or providing visual and haptic feedback in model-mediated teleoperation systems. The results of this model in reduced gravity could be further verified against data from upcoming lunar missions in future work.
1 Introduction
The high financial and environmental costs of space launches means that it is unfeasible to transport all of the resources required for the developing space industry from the Earth’s surface (Bennett et al., 2020). Instead, extracting key materials from resources readily available outside the Earth’s gravitational influence could enable humans to expand our presence in space in a sustainable and sustained manner (Austin et al., 2020). In-situ resource utilisation (ISRU) of lunar regolith to extract oxygen, water, or construction materials, in particular, would provide many of the key components for habitats, spacecraft fuel and human life support (Corrias et al., 2012; Crawford, 2015; Schlüter and Cowley, 2020), reducing the tonnes of material that would otherwise have been needed to be launched from Earth. Recent advancements in ISRU technology include terrestrial demonstrators of the carbothermal reduction process for extraction of water (Prinetto et al., 2023) and oxygen (White et al., 2023), and additive manufacture of glassy lunar regolith simulant products using laser powder bed fusion (Wang et al., 2023). To carry out these processes, regolith must first be collected from the lunar surface.
Lunar regolith is a difficult material to work with: having been exposed to harsh solar radiation and meteoroid bombardment for billions of years, without the usual weathering processes encountered on Earth, the dust on the Moon’s surface is fine-grained, electro-statically charged, and irregularly shaped (Heiken et al., 1991). This results in highly cohesive and abrasive particles which can stick to tools and themselves. These properties affect the flow characteristics of regolith, which can lead to clogging, for example, of funnels (Reiss et al., 2014). It is important to consider these characteristics when developing collection and processing equipment, as a blockage could impact the success of the mission (Otto et al., 2018). This has led to the development of novel methods of sorting and transporting regolith using electrodynamic traveling waves to avoid any reliance on mechanical systems (Kawamoto et al., 2022; Olson, 2022). The reduced gravity on the lunar surface adds further challenges for regolith handling, but this can be difficult to replicate on Earth. Therefore, it is important, but non-trivial, to provide astronauts, robot operators, or component designers with a suitably realistic practice environment on which they can familiarise themselves with the related tasks.
Currently, lunar hardware components are tested and developed using artificial lunar regolith, i.e., lunar regolith simulants (Long-Fox et al., 2023). While these are certainly an important development tool, they can be costly and involve safety considerations as, due to their fine particulate size, they can be hazardous to humans if inhaled (Ludivig et al., 2020). Large scale indoor testing arenas, such as the University of Luxembourg’s ‘LunaLab’ or the European Space Agency (ESA) and the German Aerospace Center’s (DLR) ‘Luna’ facilities, the ‘Lunar Lab and Regolith Testbeds’ at NASA Ames Lab (NASA AMES Research Center, 2023) and provide large quantities of basalt or regolith simulant on which robots and teams can be tested, developed and trained (Ludivig et al., 2020). Although these installations provide largely realistic representations of the lunar environment, there are still aspects which are practically difficult to replicate, such as the behaviour of regolith under reduced gravity or in a vacuum. Additionally, access to these facilities is limited and have a geographical constraint (Casini et al., 2020) and, hence, they could be more suited for testing in the later stages of development.
A less resource-demanding testing environment would reduce these constraints (Otto et al., 2018) and encourage earlier testing of components. With this in mind, virtual models of lunar regolith are being developed, based on a combination of Discrete Element Method (DEM) and Computational Fluid Dynamics (CFD), and have resulted in accurate representations of physical regolith behaviours (Kuang et al., 2013; Otto et al., 2018). By using a virtual regolith, it is easy to adjust the strength of gravity, which would otherwise have been practically challenging. However, due to the small particle size, and the subsequently high number of particles (N) to be computed, these models have a high computational cost. For example, a 0.6 s duration simulation of 5 g lunar regolith (N = 1 million), carried out on a 128-processor (2,100 GHz/processor) machine, took 9 days 10 h to complete (Otto et al., 2018). While the high fidelity of these simulations will be valuable for fine-tuning hardware designs, there are many applications such as early stage prototyping and robot operator training which would benefit from a less resource intensive virtual representation of regolith.
Pereira and Schmidt (2021) presented an efficient model of lunar regolith which can compute haptic interactions of particles with a tool in real time, refreshing at rates
Their model can be summarised as follows. Inter-particle forces are modelled as an attractive force at the macroparticle edge. Eq. 1 computes the magnitude of these forces, F(a), as a non-linear function of the distance between the two macroparticle, a. When a is greater than the minimum separation distance required for attraction, Rattr (set to 1.1 R in the original work, where R is the macroparticle radius), there is no interaction force between the two macroparticles. athr is the separation distance below which the particles act as a linear spring, with the spring constant, k.
Friction and cohesion forces on a macroparticle are modelled using (3). The original work set λ = 0.8, to avoid the slow creep of particles.
Collisions between macroparticles and the tool are represented using a viscoelastic model (5), where z is the penetration of the macroparticle with the tool, and
While faster than the high fidelity simulations mentioned above, this model still calculates interactions of all combinations of particle pairs. Therefore, computation time increases proportionally to N2, where N is the number of particles. This severely limits the scalability of the model. The intention of this work was to generate a “convincing haptic feel” of lunar regolith, and, as such, was validated by users for the subjective “feel” of the haptic feedback. In our work, we examine the feasibility of Pereira and Schmidt (2021)’s model in simulating the behaviour of regolith, by verifying it against a physical system.
In the following sections, we present an updated algorithm to virtually model lunar regolith, followed by an experimental verification of the model vs. a physical regolith simulant. We aim to build on Pereira and Schmidt (2021)’s previous work and attempt to answer the following questions:
• Q1: Can the scalability of Pereira and Schmidt’s model be improved?
• Q2: Are virtual macroparticles a valid representation of fine grained particles?
• Q3: Is the cohesion and friction in the model a valid representation of physical samples?
Q1 is addressed in Section 2.1, where we utilise a space partitioning approach to reduce the number of inter-particle collision pairs, and compare how the number of particles affects computation time of this updated algorithm against that of the original. Using this updated algorithm, we then experimentally verify the virtual model against a physical equivalent, using two granular materials: sand and a lunar regolith simulant. To assess the validity of representing these materials as virtual macroparticles (Q2), we measure how changing the macroparticle size impacts the accuracy of the model. Finally, we virtually replicate flow rate and angle of repose tests using two materials to assess the model’s representation of friction and cohesion (Q3). The results of these verification tests are described in Sections 3.1 and 3.2.
2 Methods
Our work is separated into two sections: improving the scalability of the model, and experimentally verifying the model. In this section, first, we give details of the steps taken to improve the scalability of the model, and demonstrate how it compares with the original algorithm. Next, we set out the procedure for experimentally verifying the model through three tests: two assessing the flow rate of the material, and another to assess the angle of repose. We also describe our methods for varying the macroparticle size (to explore Q2 from the previous section). Finally, we report the two sample materials used in these validations, selected to address Q3.
2.1 Improving the scalability of the model
The main issue with the scalability of the model is that it relies on checking each particle-particle pair for collisions (Pereira and Schmidt, 2021). This results in N2 calculations, where N is the number of particles, for each simulation frame. Here, we improve the efficiency of the algorithm by, instead, only checking for collisions with nearby particles. To achieve this, first, the virtual environment is divided into a 3D grid of cubic cells, where the length of each cell side is 2Rattr, the distance at which particles begin to exert an attractive force towards each other (Figure 1). Each of these cells is assigned an ID number based on its position in the grid, starting with ‘0’ at the origin, and ascending sequentially along the x, then y, then z directions. These cells are represented in the software as a 1-dimensional array, ‘cell world’, and the ID number of a cell is its index number in the array. For each cell in the grid, the ID numbers of the 26 neighbouring cells (those with a contacting face, edge, or corner) are subsequently identified and stored in an index. This is achieved by, firstly, using (6) to computes the ‘cell space’ co-ordinates in the x, y and z direction (a, b and c, respectively). These values are then used in (7) to compute the IDs of the cells in neighbouring rows, columns and layers. ID is the index number of the cell; x, y and z are the Cartesian positions; L is the length of the side of each cell, and A and B are the number of rows of cells in the virtual environment in the x and y directions, respectively.
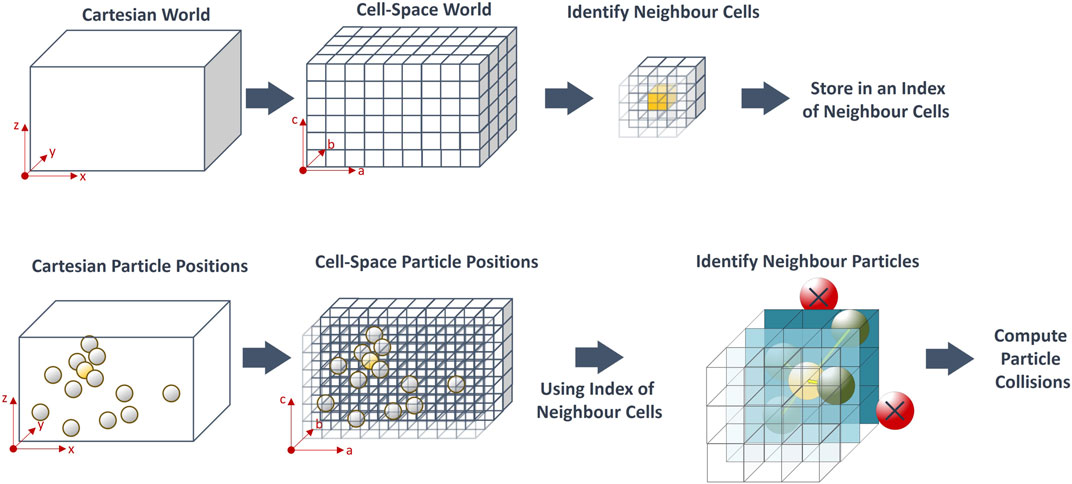
FIGURE 1. Identification of nearby particles in neighbouring cells. The world is divided into cubic cells. For a given particle (yellow), neighbouring particles (green) are identified as those in cells that share a face, edge, or corner, with the original particle. These neighbouring particles are checked for collisions, whereas particles in cells outside of this range (red) are ignored.
To set up the simulation, the Cartesian start position of each particle is converted to ‘cell space’ using (8), to identify the IDs of the cells in which they lie. Using these cell IDs, the particles are stored in the relevant element of the ‘cell world’ array, to represent that particle being in that cell.
In the main simulation loop, inter-particle interaction forces are computed. For each particle, the cell ID is calculated based on its current position. This ID is used to identify the 26 IDs of all the neighbouring cells from the neighbouring cells index. Elements of the ‘cell world’ array are accessed using each of these neighbouring cell IDs, to check for particles in neighbouring cells. Collision checking is only carried out on these particles; particles outside of the neighbouring cells are ignored. When N is large, this vastly reduces the number of collisions to compute compared with the original algorithm.
To evaluate the impact of this change on computation time and scalability, both algorithms were run using the C++ library, Chai3D (Conti et al., 2003), on an Intel i7-10850H CPU 2.70 GHz, 16 GB RAM machine. The number of simulated particles was increased from 1 to 10,000, recording the mean time taken to compute the inter-particle interactions for each frame. In the original algorithm, computation time increased exponentially with N, whereas, in our modified neighbour-based algorithm, this increased linearly with N (Figure 2).
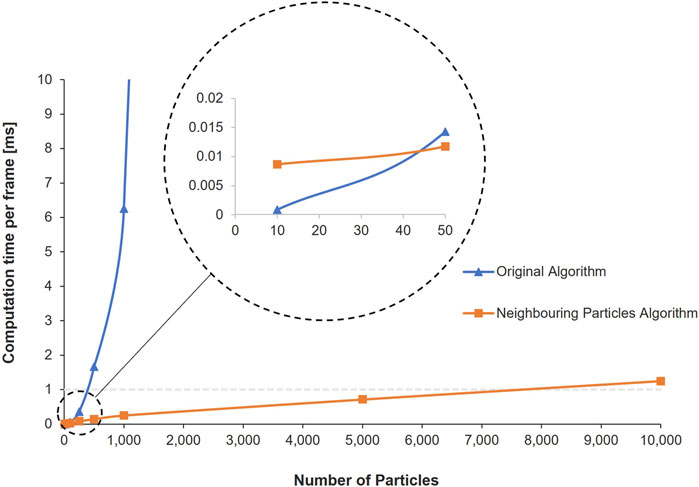
FIGURE 2. Effect of number of particles on computation times of the original algorithm Pereira and Schmidt (2021) and the neighbouring particles algorithm used in this paper. Dashed grey line represents the maximum computation time that would achieve 1 kHz refresh rate required for haptic feedback.
2.2 Experimental verification of the model
To verify the accuracy of the model, the behaviour of the virtual material was compared against that of its physical equivalent. Identical physical and virtual test setups were constructed for three scenarios: the flow rate tests and the angle of repose tests described by Long-Fox et al. (2023), and a similar flow rate test using a smaller sample. Funnel tests have been previously used to examine the behaviour of lunar regolith, as its mechanical properties affect its ability to flow, which can lead to blocking funnels (Reiss et al., 2014; Otto et al., 2018). It is likely that any practical method for the collection and processing of lunar regolith would involve transferring the material from one container to another, and, hence, it is important to understand its flow properties.
2.2.1 Experimental tests
2.2.1.1 Large-scale flow rate tests
Firstly, to assess large-scale behaviours of the material, the flow rate experiment used to characterise the properties of LMS-1 by Long-Fox et al. (2023) was replicated in simulation. In Long-Fox et al. (2023)’s procedure, 500 g of LMS-1 were gently placed into polycarbonate funnels with a slope angle of 30°, initially with the hole blocked. In order to prevent cohesive arches forming and blocking the funnel, four 3 V DC coin-style vibration motors were fixed to the outside of the funnel to mechanically agitate the material during these physical experiments. Once the material was stationary and it was confirmed that the funnel was level, the vibration motors were activated, the stopper blocking the hole was removed, and the rate of material flowing through the funnel was recorded using an Intelligent Weighing Technology PBW-A 3200 laboratory balance. They repeated this process for funnel hole diameters 2.5–5.0 cm, at 0.5 cm intervals. From these experimental data, they produced a best-fit curve of flow rate through varying hole diameters, based on five repeated trials. We replicated this procedure, in simulation, to compare their curve against the flow rate results of the model (Section 3.1.1). As the virtual macroparticles blocked the flow through the smaller funnels, we extrapolated the best-fit curve from Long-Fox et al. (2023)’s physical trials, in order to compare the flow rates for additional, larger funnel diameters: 5–9 cm, at 1 cm intervals. The experimental setup for the virtual large funnel tests can be seen in Figure 3. Full details and images of the experimental setup used by Long-Fox et al. (2023) are provided in their original paper.
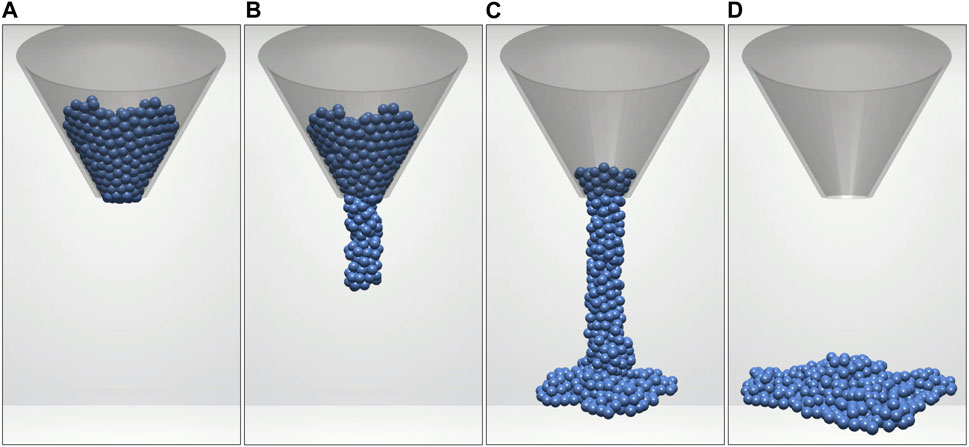
FIGURE 3. Virtual experimental setup for large funnel tests with 5 cm hole diameter and 4 mm macroparticle radius. Starting with a blocked funnel (A), the virtual sample was allowed to flow (B–C) through a 30° funnel with a variable hole diameter to land on a flat surface (D), imitating the setup described by Long-Fox et al. (2023).
2.2.1.2 Small-scale flow rate tests
Secondly, to verify the performance of the simulation for a smaller-scale task, we set up a comparable funnel experiment. 16 g of simulant were placed onto one side of a rectangular funnel, 50 mm across, with a 45°slope, and a 20 mm deep spout with varying hole widths (5 mm, 10 mm, 15 mm, Open). The funnel was 3D printed using polylactic acid (PLA), and the surface roughness parameters of the components were: Ra = 0.400 μm, Rq = 0.511 μm, Rsk = −0.503. The open condition represents a funnel hole so wide that it could be considered infinite for the volume of sample material. A 45°slope was chosen as it is greater than the angle of repose of LMS-1 (35°), to ensure that the material would flow through the funnel without the need for vibration. Once stationary, the material was released to flow through the funnel. In the physical setup, this was done via a release flap operated using a 28BYJ-48 stepper motor to reduce variability between test runs. After releasing the material, we measured the flow rate in g s−1. In the physical setup, flow rate was measured using a 6-axis force-torque sensor (ATI Axia80-M8, United States) which recorded the mass of material over time. In the virtual setup, the flow rate was calculated by measuring the number of particles below the bottom of the funnel at each timestep. Here, we report flow rates as the mean flow rate over the time period between the first and last particle falling through the funnel. The experimental setup for the small funnel tests can be seen in Figure 4, with a comparison of physical and virtual flow tests depicted in Figure 5.
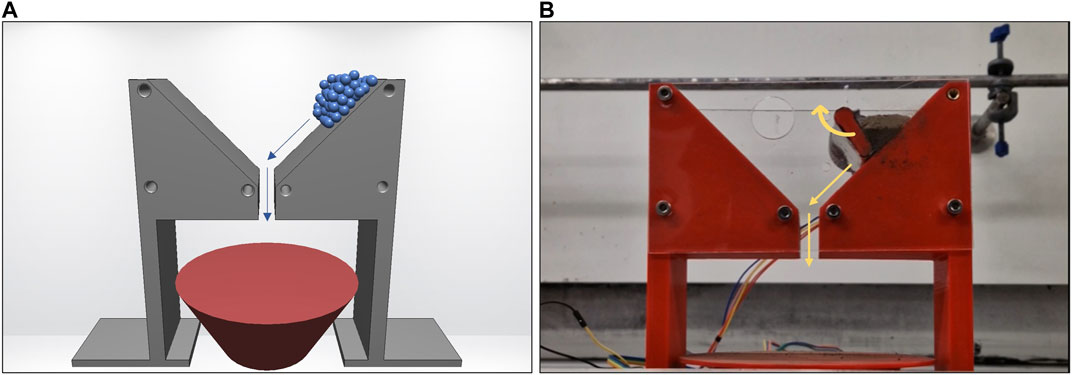
FIGURE 4. Virtual (A) and physical (B) experimental setup for small funnel tests. The sample was released from the top right-hand side, allowing it to fall down a 45° slope through holes of variable widths.
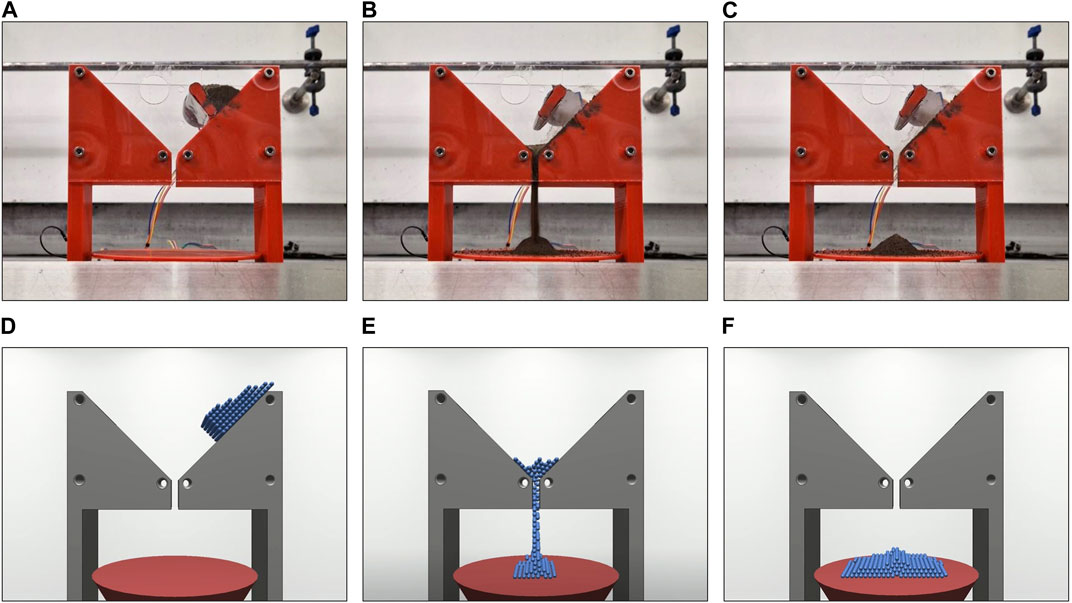
FIGURE 5. From left to right, flow of material during the physical (A–C) and virtual (D–F) small funnel tests.
Each of the trials for the physical conditions were repeated five times, as was the case in the work by Long-Fox et al. (2023). These tests were then repeated using the same volume of dry sand to compare the results against a cohesion-less material of comparable internal friction.
2.2.1.3 Angle of repose tests
In addition, we replicated in simulation the angle of repose tests described by Long-Fox et al. (2023). For these tests, 500 g of material were poured through a funnel of 3 cm hole diameter onto a 30°chute, which then allowed the sample material to gently fall against a vertical wall. The angle of repose of the resultant pile was then recorded, and compared against the results of Long-Fox et al. (2023). Full details and images of the experimental setup used by Long-Fox et al. (2023) are provided in their original paper.
2.2.2 Particle size
In both virtual models, there is a trade-off of the computational demand vs. the number of particles (N) and, subsequently, the particle radius (R). Setting N = 128, Pereira and Schmidt (2021) were able to achieve simulation refresh rates required for haptic feedback (≥1,000 Hz), their size (R = 7 mm) was much larger than in physical regolith (R = 0.030–0.045 mm) (McKay et al., 1972). This may lead to an inaccurate representation of regolith. Therefore, to address question Q2 (Section 1), we repeated each of the virtual flow rate and angle of repose trials with varying particle radii (R = 2–7 mm) to compare with the results of the physical trials. The smallest particle radius was 2 mm because, beyond this, N would become too large to render graphically.
2.2.3 Materials
Two materials were used to verify the performance of this model: Lunar Mare Simulant 1 (LMS-1) (Exolith Lab) and dry sand (40–100 mesh, CAS: 14808–60–7, Fischer Scientific). LMS-1 is a readily available lunar regolith simulant which is commonly used in research (Stupar et al., 2021; Isachenkov et al., 2022; Meurisse et al., 2022). It was chosen for this work due to its well documented physical properties (Long-Fox et al., 2023), including the density, cohesion and friction parameters required for this model. Sand was selected as a comparison material, as it has a similar grain size and internal friction to LMS-1 (Carter and Bentley, 1991), but can be assumed to be a cohesionless material (US Navy, 1982). The particle size distributions of the two materials are as follows: Sand—Mean particle diameter = 301.1 μm (SD = 128.4 μm), median = 256.7 μm (Young and Ball, 1997); LMS-1—Mean particle diameter = 85.65 μm (SD = 27.68 μm), median = 62.48 μm (Long-Fox et al., 2023). Table 1 summarises the physical properties of the two test materials used in this study. By comparing the differences between LMS-1 and sand in physical trials, we can identify the impact of cohesion. If a similar change is observed in virtual trials, we can then determine whether the model’s representation of cohesion between macroparticles is valid.
TABLE 1. Physical properties of test materials.
3 Results
In this section, we report the results of the three experimental verification tests described in Section 2. First, we describe the results of virtual large funnel LMS-1 flow rate experiments and compare these against the data from the equivalent physical experiment reported by Long-Fox et al. (2023). Next, we describe the results of the virtual and physical small funnel flow rate experiments conducted as part of this study, using LMS-1 and sand. Finally, we report the results of the virtual angle of repose tests conducted in this study and compare these against the equivalent physical tests.
3.1 Flow rate tests
3.1.1 Large funnels
Figure 6 shows the average flow rate of LMS-1 through large funnels of different hole widths for our virtual trials and the physical trials by Long-Fox et al. (2023). The changes in flow rate of each virtual condition, compared with the best-fit curve of the physical test results from Long-Fox et al. (2023), are shown in Table 2 for LMS-1. For funnel diameters ≤3 cm the virtual macroparticles blocked flow through the funnel. For funnel diameter = 3.5 cm, for all particle radii blocked the funnel except for 5 mm where the flow of virtual LMS-1 was heavily restricted, causing the flow to stop and start. For funnel diameters ≥5 cm, the virtual model overestimated the flow rate for larger macroparticles, but underestimated the flow rate for smaller macroparticles, when compared with the physical results. Macroparticles with 4 mm or 5 mm radii produced results most similar to the physical trials. Flow rates were within the upper and lower bounds of the results (and extrapolated results) of the physical trials, with the exception of the conditions which were blocked, and those which were close to being blocked (5 mm particles through 3.5 cm funnel, 4 mm particles through 4 cm funnel, and 3 mm particles through 5 cm funnel). In those trials where flow was heavily reduced but not blocked, an intermittent flow behaviour was observed. This was similar, although less pronounced, to the cohesive arch formation and collapse of LMS-1 reported by (Reiss et al., 2014).
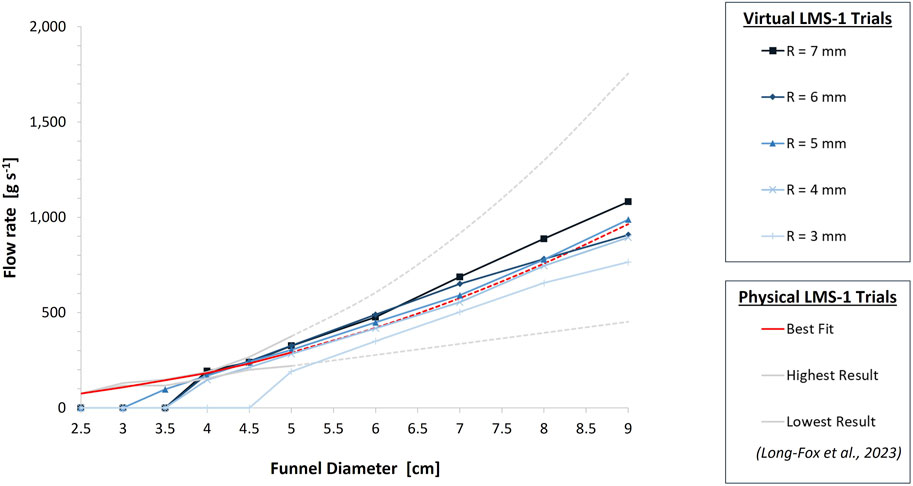
FIGURE 6. Comparison of flow rates of virtual LMS-1 (blue) of different macroparticle sizes against physical LMS-1 (red) during the large funnel tests. Physical trial data comes from Long-Fox et al. (2023), virtual trial data comes from the simulations conducted in this work. The solid red line represents the best-fit curve of their results and the solid grey lines represent the upper and lower limits of their individual physical trials, up to 5 cm funnel diameter. The dashed red and grey lines are extrapolations of their best-fit and physical data for funnel diameters
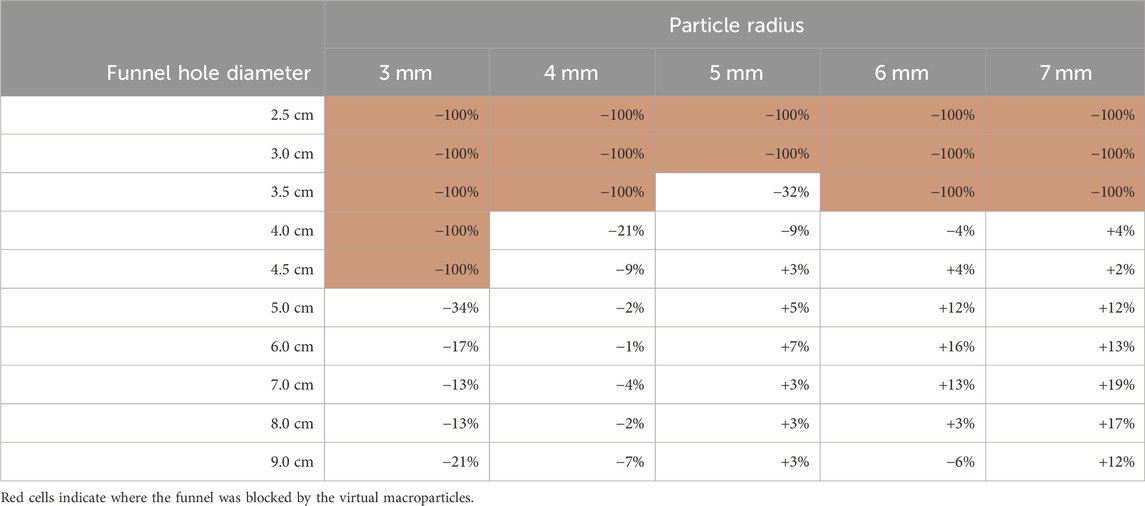
TABLE 2. Change in flow rate of virtual LMS-1 through large funnels of varying hole width, compared with physical trials.
3.1.2 Small funnels
Figures 7, 8 show the average flow rate of sand and LMS-1, respectively, through small funnels of different widths for virtual and physical trials. The changes in flow rate of each virtual condition, compared with the mean physical test result, are shown in Tables 3, 4 for sand and LMS-1, respectively.
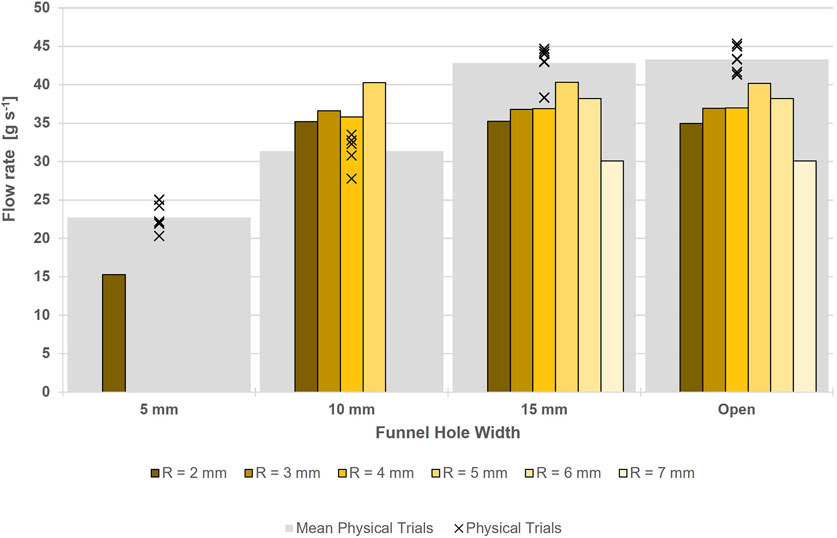
FIGURE 7. Comparison of flow rates of virtual (yellow) sand of different macroparticle sizes against physical sand (grey) in the small funnel tests.
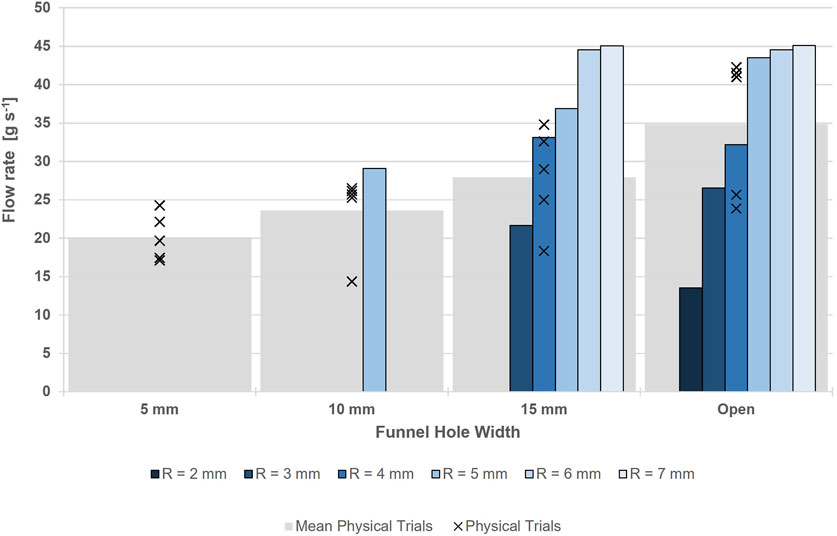
FIGURE 8. Comparison of flow rates of virtual LMS-1 (blue) of different macroparticle sizes and physical LMS-1 (grey) in the small funnel tests.
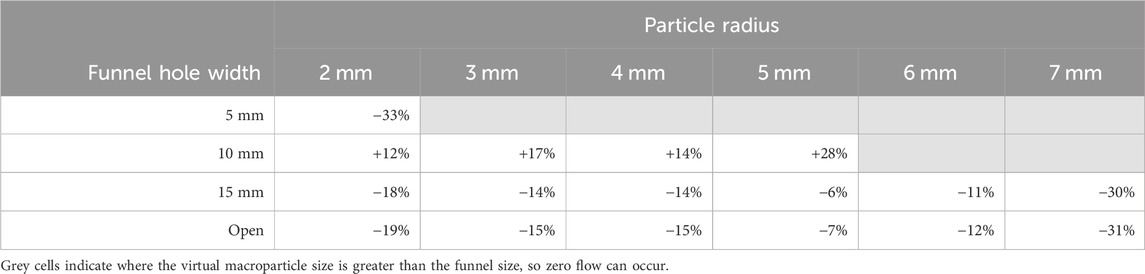
TABLE 3. Change in flow rate of virtual sand through small funnels of varying hole width, compared with physical trials.
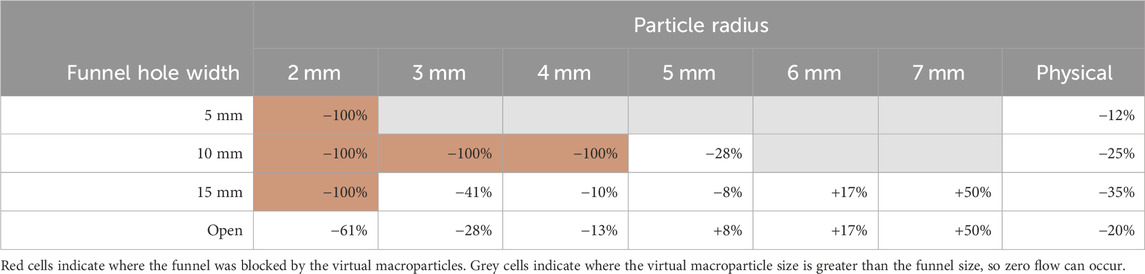
TABLE 4. Change in flow rate of LMS-1 through small funnels of varying hole width, compared with that of sand.
The physical tests showed an increasing flow rate as funnel width was increased, reaching a plateau at 15 mm. The results (Figure 7) showed reducing the funnel width had little effect on reducing the flow of virtual sand for R = 3–7 mm, except for when the macroparticles were too large to fit through the hole. This was due to the lack of cohesive forces between particles causing the sample pile to collapse and flow through the funnel as a single layer. Therefore, if the particle diameter was smaller than the funnel width, there was no interaction with the opposite side of the funnel, and, as such, the virtual sand behaved similarly to in the open condition. However, when R = 2 mm, the larger number of layers (as illustrated in Figure 9) in the sample meant that it had not fully collapsed by the time it reached the funnel hole (Figure 10) and, hence, the flow rate was reduced through the smallest funnels for the smallest particles. Table 3 shows that the virtual sand tended to have a slower flow rate than the physical tests for the open and 15 mm funnels. This decrease was 6%–19% for R = 2–6 mm, whereas for the largest macroparticle size (R = 7 mm), there was a larger decrease (30%–31%). Funnels only became blocked when the particle size was greater than the funnel width.
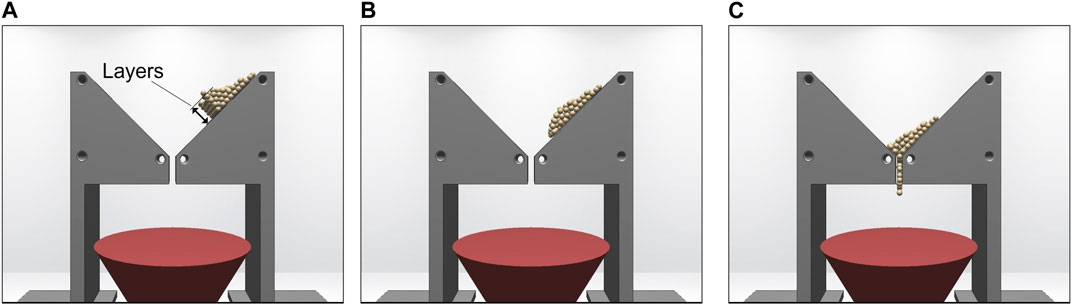
FIGURE 9. Virtual sand falling through the 5 mm small funnel (A–C) for macroparticles of R = 2 mm. To start, the particles are stacked in layers four particles deep. As the particles reach the funnel, the sample is still stacked in several layers, slowing the flow material when compared with the open funnel condition.
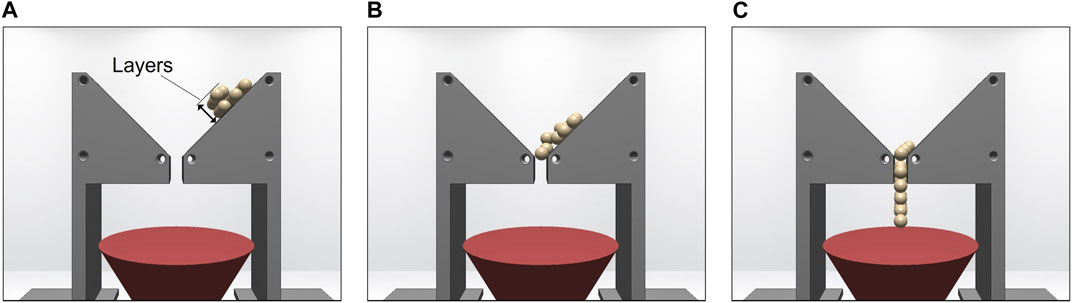
FIGURE 10. Virtual sand falling through the 10 mm small funnel (A–C) for macroparticles of R = 5 mm. To start, the particles are stacked in layers two particles deep, which collapse by the time the particles reach the funnel. This results in a similar flow rate the open funnel condition.
As for sand, the physical tests using LMS-1 showed that the flow rate increased with the funnel width. However, this continued to increase beyond 15 mm and did not plateau. The results (Figure 8) showed a decrease in flow rate for macroparticles with R ≤ 5 mm, as funnel width decreased, and also did not plateau. Unlike virtual sand, the virtual LMS-1 tended to have a faster flow rate through the funnels compared to the physical tests for macroparticles with R ≥ 5 mm (Table 4).
The cohesive properties of LMS-1 were demonstrated in these virtual tests. Unlike the sand trials, funnels became blocked with virtual LMS-1 when the particle size was greater than the funnel width, or for smaller particles. Although the particles were smaller and should, therefore, flow more easily, there were a greater number of inter-particle cohesive forces, which led the material to coalesce and block the funnel. For R = 2 mm, for example, flow was completely blocked in all but the open funnels.
The density of LMS-1 is approximately 7.6% greater than that of sand and, as such, one might expect its flow rate to increase proportionally to this. The physical trials, however, show that LMS-1 flows more slowly than sand, by 12%–35% (Table 5). Of the virtual tests in which the funnels were not blocked, a similar decrease was seen in the virtual tests for: R = 5 mm in the 15 mm funnel, R = 4 mm in the open and 15 mm funnels, and R = 3 mm in the open funnel. For larger particles (R ≥ 6 mm), the reduced number of particles in the sample resulted in fewer cohesive interparticle forces, causing virtual LMS-1 to flow faster than virtual sand. Consequently, the greater gravitational forces applied to LMS-1 particles due to their greater density became the predominant difference between these tests. Conversely, for R = 2 mm, virtual LMS-1 flowed 61% slower than virtual sand as the stronger cohesive interparticle forces of LMS-1 counteracted the forces resulting from their increased density.
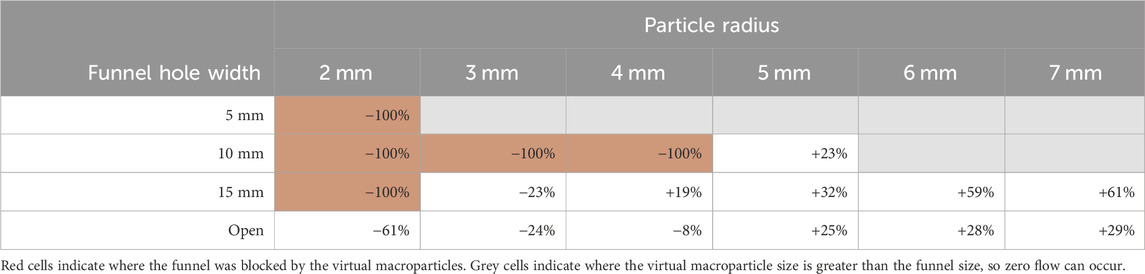
TABLE 5. Change in flow rate of virtual LMS-1 through small funnels of varying hole width, compared with physical trials.
3.2 Angle of repose tests
The original method for measuring the angle of repose involved pouring regolith from a funnel with a hole diameter of 3 cm. However, as demonstrated in Section 3.1.1, the virtual regolith blocked funnels of this size, meaning that the original method would be unsuitable in this case. We, therefore, measured the angle of repose of material resulting from the small funnel tests, instead. The experimentally obtained angle of repose resulting from pouring the physical samples through the small funnels was 21.58° for sand and 35.58° for LMS-1. This result for LMS-1 was comparable to that of the larger scale (500 g) tests by Long-Fox et al. (2023) (37.5° ± 3.4°). These results were not successfully replicated in the virtual models because, although the internal friction was calculated based on the physical properties of regolith, this was simplified to reduce computation time by calculating the friction force based on the total sum of contacting forces on that particle (3), as opposed to a sum of multiple friction forces from multiple particles (Pereira and Schmidt, 2021). Friction against the tool objects was also simplified using an arbitrary cohesion parameter (5). These simplifications meant that because the total friction forces were insufficient to hold the particles in place, they eventually slipped down to a single layer in all conditions, resulting in an angle of repose of 0°. Long-Fox et al. (2023) identified that adjusting λ = 1.0 to λ = 0.8 in (3) led to improved friction behaviour by eliminating the “slow creep” of particles. However, this proved to be insufficient in our trials. This was, perhaps, because the original simulation held the particles in a virtual box, which provided some support to the particles, whereas our task was carried out in a more ‘open’ world, where the particles could spread more easily.
4 Discussion
This section discusses the results of the tests presented above, with respect to the three questions, outlined in Section 1, along with the implications for practical applications and further research.
4.1 Model scalability
The neighbouring particles algorithm described in Section 2.1 was an effective way of preventing computation time from increasing exponentially with the number of particles, N. As demonstrated in Figure 2, the computation time per frame using neighbouring particles algorithm increases approximately linearly with N. This resulted in a faster computation time per frame, providing N was not very small, i.e., N > 45.
However, a consequence of increasing N for a given sample volume is that the macroparticle size must decrease. The reduced size of the particles means that their movements in each frame of the simulation are larger, relative to their size. This can cause instabilities in the model because, between each discrete frame, particles will move greater distances relative to their size. This can result in them moving to positions where their sphere boundary has a large overlap with a neighbouring particle, which would subsequently apply a large repulsive force to separate the two particles, and cause the particles to jitter even while undisturbed. The way to mitigate this is to calculate interactions at smaller time steps; for example, instead of refreshing at 1 kHz for particle with R = 7 mm, the model requires a refresh rate of 100 kHz when R = 1 mm. The model must, therefore, compute 100 times more frames per second of simulation time for the smaller particles.
If the required refresh rate to ensure stability is less than that which is achievable computationally, the simulation can run in real-time. However, if the refresh rate for stability increases above the computational limit, the simulation will run at a fraction of real-time. This has implications for model-mediated teleoperation, as real-time control would be required. If haptic feedback is required, the refresh rate must be ≥1 kHz (Pereira and Schmidt, 2021). To achieve the 1 kHz frame-rate required for haptic feedback on the hardware used in our work, this algorithm could simulate 7,500 particles, a 15-fold increase compared to the original algorithm. For design testing, however, the simulation could run at a fraction of real-time. For very large sample volumes, this is not an issue as R can remain large enough for a practical simulation refresh rate, whilst also having a large number of particles. For small samples, however, increasing N can decrease R so much that the required refresh rate for stability is not feasible, computationally. Although the neighbouring particles algorithm significantly improved the scalability of the simulation, further improvements to the model are needed to ensure stability when using small macroparticles.
4.2 Macroparticles
The size of macroparticles affected the flow rate in both the large and small funnel tests. In the large funnel tests which were not blocked (funnel diameter ≥3 cm) and in the small funnel tests, flow rate decreased as the particle size decreased. This occurred because the granular material was discretised into macroparticles. Larger macroparticles, therefore, recorded a more sudden, step-wise increase of mass through the funnel. Compounding this, the samples of smaller particles would have a greater number of layers (Figure 9). These layers collapsed as the sample flowed down the funnel slope, spreading out the sample. The first particles of the sample would therefore exit the funnel sooner and the final particles would exit later, resulting in a longer total flow time and, subsequently, a reduced flow rate.
The most obvious issue with using this macroparticle representation was that funnels became blocked far more easily than in the physical systems. This would be particularly problematic for virtual design testing applications. Furthermore, although we saw slight indications of cohesive arch formation, we did not observe any of the more complex behaviours mentioned in the literature, such as “ratholing” or “dust fountains” (Reiss et al., 2014; Schulze, 2021).
The accuracy of the virtual macroparticle representations varied with particle size, when compared with the physical test data. In the large funnel tests, the model overestimated or underestimated the flow rate for larger and smaller macroparticles, respectively. The most accurate results were obtained using macroparticles with R = 4 mm, although flow rates were within the range of projected results from Long-Fox et al. (2023) for nearly all trials where the funnel was not completely blocked. Conversely, in the small funnel tests, as particle size decreased, the flow rate rapidly declined and became less accurate. In wider funnels, as R increased, the flow rate plateaued at values greater than the physical tests. This suggests that the macroparticle representations are more accurate on a large scale rather than at small scales where the behaviour is not realistic.
One major assumption of this model is that regolith can be represented as a collection of uniform spheres, which is contrary to a realistic regolith sample which would contain a range of particle sizes. Adding some variation in particle sizes may create more realistic behaviour, for instance, by disrupting the ordered layering seen in the small funnel tests (Figure 9). However, the original model parameters were derived by analysing the hexagonal close-packing structure of equal macroparticle spheres (Pereira and Schmidt, 2021). Therefore, as well as increasing the computational demand due to increased complexity, introducing a particle size distribution may introduce further inaccuracies without significant revisions to the model. For example, additional smaller particles would occupy interstitial spaces in the virtual regolith, leading to more numerous inter-particle contacts, which we predict would result in an overestimation of cohesive forces. Another challenge is that the true particle size distribution of regolith covers several orders of magnitude (McKay et al., 1972), which would be computationally demanding to model and visualise. One method of efficiently representing a range of particle sizes could be to revise the model parameters based on a more complex binary or ternary sphere packing structure.
4.3 Cohesion and friction
In the small funnel tests, the reduced flow rate effect of smaller macroparticles was seen more strongly in the virtual LMS-1, compared with the virtual sand, due to the addition of a cohesive interparticle force. Smaller macroparticles mean that there is a greater number of macroparticles in a sample of a given volume. This will increase the number of inter-particle contacts, and, therefore, increase the total cohesive force of the sample. Even in the open funnel condition, these cohesive forces in virtual LMS-1 slowed the flow by 32% compared with virtual sand, for R = 2 mm.
In the large funnel tests, unexpectedly, the smallest macroparticles (R = 3 mm) blocked the largest diameter funnels (≤4.5 mm). This was due to the cohesive forces between many macroparticles across the funnel hole forming a plug which could resist the pull of gravity and the mass of particles in the funnel, above. As particle size decreases, and the number of particles increases, the number of interparticle contacts, and subsequently, the cohesive force increases. The cohesion in this model appears to be overstated, particularly as particle size decreases.
The results in Section 3.2 demonstrate that friction is not accurately represented in the simulation due to insufficient modelling of the inter-particle friction, and the friction between the macroparticles and the funnel, wall or floor objects. In particular, this appears to be an issue with the dynamic friction. Adjusting λ in (3) may be one method of addressing this qualitatively, although this may impact other aspects of the model. To build a more accurate model, the different friction properties of specific tool materials need to be included.
4.4 Practical implications
This model may be suitable for rough virtual demonstrations of regolith moving through a system, but it lacks the accuracy to carry out fine design testing. Other virtual models of regolith have been developed which achieve greater accuracy, albeit at the cost of longer computation times (Otto et al., 2018). Although the neighbouring particles algorithm allows us to scale up the number of simulated particles, the remaining limitations with respect to particle size mean that this system would be best suited towards larger volume simulations.
As suggested by Pereira and Schmidt (2021), this model would be of benefit for time-adjusted, model-mediated teleoperation system (Hulin et al., 2021), where a more general approximation of regolith would be acceptable. It could also be used to train operators using virtual robots in a low-risk scenario, which we have previously identified as a key requirement for developing trust in teleoperated systems (Louca et al., 2023). When compared with using physical simulants, conducting early training using a simulation such as this would likely be cheaper and safer. Furthermore, it offers a reusable solution where experiments could be set up quickly by avoiding the need for hardware, and, crucially, it allows a practical method of interacting with regolith in reduced gravity.
4.5 Limitations and future work
The model is largely based on data from the Apollo missions (McKay et al., 1972; Mitchell et al., 1972; Houston et al., 1974; Heiken et al., 1991). It is known that regolith cohesion and friction forces are stronger in a vacuum and under lunar gravity (Heiken et al., 1991; Chang and Hicher, 2009), whereas the physical tests of this work were conducted under Earth’s gravity in ambient pressure. The assumptions of the model take this into account and may be the root of some of the inaccuracies when compared against physical tests. Future work which compares the results of this model against a physical reduced gravity test would be required before using this for teleoperation tasks. This could be carried out during a parabolic flight, as a dedicated test during spaceflight, or by virtually replicating example tasks from upcoming rover missions (Potter, 2023).
Although this work uses just one example of a lunar regolith simulant, several others have been developed that represent the chemical and physical properties of regolith, to varying degrees of accuracy (Toklu and Akpinar, 2022). The assumptions in the model used here, evidently, do not lead to a perfect representation of LMS-1 behaviour. Further comparisons of these results against other simulants, considering their physical properties, could lead to the identification of other parameters which could be included in to improve the accuracy of the model.
Furthermore, the properties and composition of regolith vary across different lunar regional areas (Papike et al., 1982). One limitation of this work is that the simulant used is representative only of mare regions. Highland regions will also be relevant for upcoming lunar missions, for example, Artemis III which is targeting the south pole of the Moon (Smith et al., 2020), based in the southern highlands (Spudis et al., 2007). Similar verification tests using lunar highland simulants are, therefore, recommended area for future work.
The model used in this work represents regolith as a collection of homogenous macroparticles. Although this simplification helps to reduce the computational demand of the model, this is not representative of a physical sample which would have a wider particle size distribution. Further work is required to assess whether using a range of macroparticle sizes to represent the particle size distribution of the sample would improve the performance of the model, whilst also considering the impact of this change on the computation time. Inclusion of smaller macroparticles, as a result, may necessitate a faster simulation refresh rate to ensure stability, as discussed in Section 4.1, which should also be taken into account.
4.6 Summary
In this work, we have presented an updated algorithm which improves the scalability of Pereira and Schmidt (2021)’s model of lunar regolith, and have reported the results of three experiments comparing the virtual model against physical equivalents. This method of modelling granular material as a collection of macroparticles provides a computationally efficient representation of regolith behaviour on a large scale, but is not suitable for smaller scale, high resolution tests. The inter-particle cohesion appears to be overstated in this model, and the friction is understated, when compared against one physical simulant (LMS-1). Additional testing against other examples of simulants would confirm this.
Other simulations are available which offer greater accuracy and resolution (Otto et al., 2018), albeit at the cost of lengthy computation times. The main advantage of this model over using other virtual representations, however, is that it is lightweight enough to run in real-time. In addition, this model offers a cheap, safe, and reusable method of examining regolith behaviour, with the possibility of easily adjusting key parameters such as cohesion, density and gravity, which is practically challenging if using physical simulants. The minimal hardware requirements of this simulation reduce the barrier of entry for those interested in testing ISRU systems.
5 Conclusion
The model of lunar regolith presented by Pereira and Schmidt (2021) predicted flow rate of a physical system with reasonable accuracy when used on a large scale (500 g sample through funnels of 4–9 cm diameter). When macroparticle radius = 5 mm, for example, the virtual flow rate through funnels of these diameters was on average 2% greater than the extrapolated mean experimental result reported by Long-Fox et al. (2023) Although the macroparticles tended to block small funnels more readily than in physical experiments, when the material flowed consitently, the flow rate was within the extrapolated range of upper and lower-bound results for nearly all the conditions tested. However, for smaller scale, finer tests (16 g sample through funnels of 5–15 mm width), the model did not accurately replicate the physical system.
The neighbouring particles algorithm presented in this paper is a computationally efficient method of simulating greater numbers of particles. However, as small particles require a faster frame-rate to ensure stability, this means that this can simulate larger volumes of material, rather than the same volumes in higher fidelity. This points towards the model being useful as an approximation of regolith behaviour on a large scale (100 s of grams), rather than for detailed design testing. It would be particularly useful for applications such as training robot operators in unfamiliar environments, such as reduced gravity, or in model-mediated teleoperation of robots for delayed Earth-Moon systems.
Data availability statement
The datasets presented in this study can be found in online repositories. Data are available at the University of Bristol data repository, data.bris, at https://doi.org/10.5523/bris.2qq66srmernh62kzpqbfdtojwa.
Author contributions
JL: Conceptualization, Data curation, Methodology, Software, Writing–original draft. JV: Conceptualization, Funding acquisition, Writing–review and editing. KE: Conceptualization, Writing–review and editing. AT: Conceptualization, Funding acquisition, Writing–review and editing.
Funding
The author(s) declare financial support was received for the research, authorship, and/or publication of this article. This research was funded by EPSRC (Grant no. EP/V519650/1) and Thales Alenia Space (United Kingdom). Thales Alenia Space was not involved in the study design, analysis, interpretation of data, the writing of this article or the decision to submit it for publication.
Conflict of interest
Author JV was employed by company Thales Alenia Space in the UK.
The remaining authors declare that the research was conducted in the absence of any commercial or financial relationships that could be construed as a potential conflict of interest.
Publisher’s note
All claims expressed in this article are solely those of the authors and do not necessarily represent those of their affiliated organizations, or those of the publisher, the editors and the reviewers. Any product that may be evaluated in this article, or claim that may be made by its manufacturer, is not guaranteed or endorsed by the publisher.
References
Austin, A., Sherwood, B., Elliott, J., Colaprete, A., Zacny, K., Metzger, P., et al. (2020). Robotic lunar surface operations 2. Acta Astronaut. 176, 424–437. doi:10.1016/j.actaastro.2020.06.038
Bennett, N. J., Ellender, D., and Dempster, A. G. (2020). Commercial viability of lunar in-situ resource utilization (ISRU). Planet. Space Sci. 182, 104842. doi:10.1016/j.pss.2020.104842
Carter, M., and Bentley, S. P. (1991). Correlations of soil properties. London: Pentech Press Publishers.
Casini, A. E., Mittler, P., Cowley, A., Schlüter, L., Faber, M., Fischer, B., et al. (2020). Lunar analogue facilities development at EAC: the LUNA project. J. Space Saf. Eng. 7, 510–518. doi:10.1016/j.jsse.2020.05.002
Chang, C. S., and Hicher, P.-Y. (2009). Model for granular materials with surface energy forces. J. Aerosp. Eng. 22, 43–52. doi:10.1061/(asce)0893-1321(2009)22:1(43)
Cirio, G., Marchal, M., Hillaire, S., and Lécuyer, A. (2011). Six degrees-of-freedom haptic interaction with fluids. IEEE Trans. Vis. Comput. Graph. 17, 1714–1727. doi:10.1109/TVCG.2010.271
Conti, F., Barbagli, F., Balaniuk, R., Halg, M., Lu, C., Morris, D., et al. (2003). The CHAI libraries. Proc. Eurohaptics 2003, 496–500. Dublin, Ireland.
Corrias, G., Licheri, R., Orrù, R., and Cao, G. (2012). Optimization of the self-propagating high-temperature process for the fabrication in situ of Lunar construction materials. Chem. Eng. J. 193-194, 410–421. doi:10.1016/j.cej.2012.04.032
Crawford, I. A. (2015). Lunar resources: a review. Prog. Phys. Geogr. 39, 137–167. doi:10.1177/0309133314567585
Heiken, G. H., Vaniman, D. T., and French, B. M. (1991). Lunar sourcebook: a user’s guide to the Moon. Cambridge University Press, 285–356. chap. The Lunar.
Hoffmann, R. (2006). DEM simulations of toner particles with an O (N log N) hierarchical tree code algorithm. Granul. Matter 8, 151–157. doi:10.1007/s10035-006-0002-6
Houston, W. N., Mitchell, J. K., and Carrier, W. D. (1974). “Lunar soil density and porosity” In Proceedings Lunar Science Conference, 5th, Houston, Tex., March 18-22, 1974, Vol. 3.(A75-39540 19-91) New York, Pergamon Press, Inc. 2361–2364.
Hulin, T., Panzirsch, M., Singh, H., Coelho, A., Balachandran, R., Pereira, A., et al. (2021). Model-augmented haptic telemanipulation: concept, retrospective overview, and current use cases. Front. Robotics AI 8, 611251–611322. doi:10.3389/frobt.2021.611251
Isachenkov, M., Chugunov, S., Smirnov, A., Kholodkova, A., Akhatov, I., and Shishkovsky, I. (2022). The effect of particle size of highland and mare lunar regolith simulants on their printability in vat polymerisation additive manufacturing. Ceram. Int. 48, 34713–34719. doi:10.1016/j.ceramint.2022.08.060
Kawamoto, H., Morooka, H., and Nozaki, H. (2022). Improved electrodynamic particle-size sorting system for lunar regolith. J. Aerosp. Eng. 35. doi:10.1061/(asce)as.1943-5525.0001371
Kuang, S. B., LaMarche, C. Q., Curtis, J. S., and Yu, A. B. (2013). Discrete particle simulation of jet-induced cratering of a granular bed. Powder Technol. 239, 319–336. doi:10.1016/j.powtec.2013.02.017
Long-Fox, J. M., Landsman, Z. A., Easter, P. B., Millwater, C. A., and Britt, D. T. (2023). Geomechanical properties of lunar regolith simulants LHS-1 and LMS-1. Adv. Space Res. 71, 5400–5412. doi:10.1016/j.asr.2023.02.034
Louca, J., Vrublevskis, J., Eder, K., and Tzemanaki, A. (2023). Elicitation of trustworthiness requirements for highly dexterous teleoperation systems with signal latency. Front. Neurorobotics 17, 1187264. doi:10.3389/fnbot.2023.1187264
Ludivig, P., Calzada-Diaz, A., Mendez, M. O., Voos, H., and Lamamy, J. (2020). “Building a piece of the moon: construction of two indoor lunar analogue environments,” in Proceedings of the International Astronautical Congress, IAC 2020-Octob, 12–14.
McKay, D. S., Heiken, G. H., Taylor, R. M., Clanton, U. S., Morrison, D. A., and Ladle, G. H. (1972). “Apollo 14 soils: size distribution and particle types,” in Proceedings of the Lunar Science Conference, Houston, Texas (Cambridge, MA: MIT Press), 983.
Meurisse, A., Lomax, B., Selmeci, Ã., Conti, M., Lindner, R., Makaya, A., et al. (2022). Lower temperature electrochemical reduction of lunar regolith simulants in molten salts. Planet. space Sci. 211, 105408. doi:10.1016/j.pss.2021.105408
Mitchell, J. K., Houston, W. N., Scott, R. F., Costes, N. C., Carrier, W. D., and Bromwell, L. G. (1972). Mechanical properties of lunar soil: density, porosity, cohesion and angle of internal friction. Proc. Lunar Sci. Conf. 3, 3235.
Olson, A. D. (2022). “Design and testing of a prototype electrodynamic regolith conveyor for lunar ISRU,” in Proceedings of the International Astronautical Congress, IAC 2022-Septe, 18–22.
Otto, H., Kerst, K., Roloff, C., Janiga, G., and Katterfeld, A. (2018). CFD–DEM simulation and experimental investigation of the flow behavior of lunar regolith JSC-1A. Particuology 40, 34–43. doi:10.1016/j.partic.2017.12.003
Papike, J. J., Simon, S. B., and Laul, J. C. (1982). The lunar regolith: chemistry, mineralogy, and petrology. Rev. Geophys. 20, 761–826. doi:10.1029/RG020i004p00761
Pereira, A., and Schmidt, A. (2021). “Efficient haptic rendering of regolith,” in 2021 IEEE International Conference on Robotics and Automation (ICRA) (IEEE), 13975–13981.
Prinetto, J., Colagrossi, A., Dottori, A., Troisi, I., and Lavagna, M. R. (2023). Terrestrial demonstrator for a low-temperature carbothermal reduction process on lunar regolith simulant: design and AIV activities. Planet. Space Sci. 225, 105618. doi:10.1016/j.pss.2022.105618
Reiss, P., Hager, P., Hoehn, A., Rott, M., and Walter, U. (2014). Flowability of lunar regolith simulants under reduced gravity and vacuum in hopper-based conveying devices. J. Terramechanics 55, 61–72. doi:10.1016/j.jterra.2014.04.005
Schlüter, L., and Cowley, A. (2020). Review of techniques for In-Situ oxygen extraction on the moon. Planet. Space Sci. 181, 104753. doi:10.1016/j.pss.2019.104753
Smith, M., Craig, D., Herrmann, N., Mahoney, E., Krezel, J., McIntyre, N., et al. (2020). The Artemis program: an overview of NASA’s activities to return humans to the moon. IEEE Aerosp. Conf. Proc. 1–10. doi:10.1109/AERO47225.2020.9172323
Spudis, D., Plescia, J., Bussey, B., Josset, J.-L., Beauvivre, S., and Team, t. A. (2007). “The geology of the south Pole of the moon and age of shackleton crater,” in 39th Annual Lunar and Planetary Science Conference, League City, Texas, 1626. doi:10.1029/2007GL029954
Stupar, D., Chabrol, G., Razak, A., Lecler, S., Tessier, A., Cutard, T., et al. (2021). “Feasibility of additive manufacturing processes for lunar soil simulants,” in MMA 2021-14th International scientific conference MMA 2021-Flexible technologies, 223–227.
Toklu, Y. C., and Akpinar, P. (2022). Lunar soils, simulants and lunar construction materials: an overview. Adv. Space Res. 70, 762–779. doi:10.1016/j.asr.2022.05.017
Wang, R., Qiao, G., and Song, G. (2023). Additive manufacturing by laser powder bed fusion and thermal post-treatment of the lunar-regolith-based glass-ceramics for in-situ resource utilization. Constr. Build. Mater. 392, 132051. doi:10.1016/j.conbuildmat.2023.132051
White, B. C., Haggerty, N. P., and Space, S. (2023). Carbothermal reduction system overview and developments in support of the Artemis program and a commercial lunar economy
Keywords: in-situ resource utilisation (ISRU), lunar regolith simulant, model-mediated teleoperation (MMT), verification and validation (V & V), teleoperation, virtual training
Citation: Louca J, Vrublevskis J, Eder K and Tzemanaki A (2024) Verification of a virtual lunar regolith simulant. Front. Space Technol. 5:1303964. doi: 10.3389/frspt.2024.1303964
Received: 28 September 2023; Accepted: 19 January 2024;
Published: 22 February 2024.
Edited by:
Florian Kehl, University of Zurich, SwitzerlandReviewed by:
Andrea Colagrossi, Polytechnic University of Milan, ItalyJames A. Nabity, University of Colorado Boulder, United States
Copyright © 2024 Louca, Vrublevskis, Eder and Tzemanaki. This is an open-access article distributed under the terms of the Creative Commons Attribution License (CC BY). The use, distribution or reproduction in other forums is permitted, provided the original author(s) and the copyright owner(s) are credited and that the original publication in this journal is cited, in accordance with accepted academic practice. No use, distribution or reproduction is permitted which does not comply with these terms.
*Correspondence: Joe Louca, am9lLmxvdWNhQGJyaXN0b2wuYWMudWs=