 Thirsa Huisman
 Axel Ahrens
 Ewen MacDonald
- 1Hearing Systems Section, Department of Health Technology, Technical University of Denmark, Kgs. Lyngby, Denmark
- 2Institute of Clinical Research, Faculty of Health Sciences, University of Southern Denmark, Odense, Denmark
- 3Systems Design Engineering, University of Waterloo, Waterloo, ON, Canada
To reproduce realistic audio-visual scenarios in the laboratory, Ambisonics is often used to reproduce a sound field over loudspeakers and virtual reality (VR) glasses are used to present visual information. Both technologies have been shown to be suitable for research. However, the combination of both technologies, Ambisonics and VR glasses, might affect the spatial cues for auditory localization and thus, the localization percept. Here, we investigated how VR glasses affect the localization of virtual sound sources on the horizontal plane produced using either 1st-, 3rd-, 5th- or 11th-order Ambisonics with and without visual information. Results showed that with 1st-order Ambisonics the localization error is larger than with the higher orders, while the differences across the higher orders were small. The physical presence of the VR glasses without visual information increased the perceived lateralization of the auditory stimuli by on average about 2°, especially in the right hemisphere. Presenting visual information about the environment and potential sound sources did reduce this HMD-induced shift, however it could not fully compensate for it. While the localization performance itself was affected by the Ambisonics order, there was no interaction between the Ambisonics order and the effect of the HMD. Thus, the presence of VR glasses can alter acoustic localization when using Ambisonics sound reproduction, but visual information can compensate for most of the effects. As such, most use cases for VR will be unaffected by these shifts in the perceived location of the auditory stimuli.
Introduction
With the recent increase in quality and availability, head mounted virtual reality displays (HMDs) are now regularly used in combination with virtual sound environments to create more realistic and immersive audio-visual experiments (e.g., Echevarria Sanchez et al., 2017; Kessling and Görne, 2018; Suárez et al., 2019). Although for many studies, headphones might suffice as the playback method for this acoustic environment, there are also many cases where loudspeaker playback might be preferred to preserve the participants own head-related transfer function or to be able to wear hearing aids or other ear-worn devices. This is where potential problems can arise, as recent studies have shown that HMDs affect the acoustic signals (Genovese et al., 2018; Gupta et al., 2018; Ahrens et al., 2019). The shape of the ear, head and body modify sound as it reaches the ear, resulting in interaural level differences, interaural time differences and spectral changes which are used for the localization of sound sources (for an overview see Blauert (1997) or Hartmann (1999)). The added volume of the HMD modifies these cues, increasing the lateralization of the perceived location of stimuli (Gupta et al., 2018; Ahrens et al., 2019). Such changes in the perceived location of the sound could not only affect the perceived spatial location of a sound, but also the integration of audio-visual stimuli. Current experiments have only assessed the effect of the HMD when presenting sound from a single loudspeaker. However, VR will regularly require more complex playback methods to be able to present spatial audio from any location, independent of the loudspeaker setup. Ambisonics is a commonly used playback method for such a purpose. It encodes audio by decomposing a sound field into spherical harmonics and can provide full-sphere surround sound (Gerzon, 1973). In its basic form (1st-order Ambisonics), four channels corresponding to the first four spherical harmonics are used to encode the sound field. However, additional spherical harmonics can be included to improve the directional resolution of the reproduction (Gerzon, 1973; Bertet et al., 2013; Ahrens et al., 2020), referred to as higher-order Ambisonics (HOA). To accurately reproduce the encoded sound field, the number of loudspeakers should match the number of spherical harmonics used for the encoding. Thus, at least
Methods
Participants
21 participants (9 females and 12 males, average 25 ± 3 years) were recruited to participate in the experiment. To ensure normal hearing, audiometric thresholds were measured at octave frequencies between 125 and 8 kHz. Data from participant seven were excluded due to audiometric thresholds above 20 dB HL. Data from the remaining 20 participants were used in the analysis. The participants were compensated with an hourly rate of 122 DKK. The experimental procedure was approved by the Science-Ethics Committee for the Capital Region of Denmark (H-16036391) and all participants provided written informed consent.
Acoustic Reproduction
The experiment took place in the Audio-Visual-Immersion Lab (AVIL) shown in Figure 1, left panel. AVIL is an anechoic chamber containing 64 KEF LS50 loudspeakers, placed in a 4.8 m diameter sphere around a height adjustable chair. For this experiment, only the horizontal ring, containing 24 loudspeakers spaced equidistantly (15° separation), was used for sound reproduction. Audio signals were generated in MATLAB (The Mathworks, Natick, MA) and sent, via 2 TESIRA biamp DSPs with TESIRA SOC-4 Audio DSP cards (biamp Systems, Beaverton, OR), to the amplifiers (Sonible GmbH, Graz, Austria) that drive the loudspeakers.
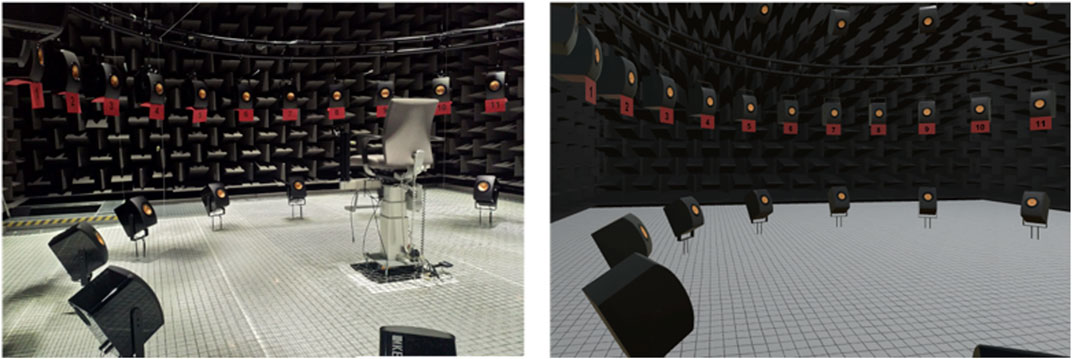
FIGURE 1. Experimental setup. AVIL (left) and the 1:1 model of AVIL (right). The rightmost loudspeakers, 12 and 13, are not shown.
Visual Reproduction
The virtual environment, shown in Figure 1 (right panel), was a 1:1 reproduction of AVIL. This environment was created in UNITY3D (Unity Technologies, San Francisco, CA) and presented via an HTC VIVE PRO (HTC Corporation, New Taipei City, Taiwan) VR setup. Three HTC VIVE trackers at known positions were used to ensure the spatial alignment between the real and virtual world, by recalibrating the virtual world if discrepancies larger than 1 cm occurred (see Ahrens et al., 2019 for details). When the HMD was not in use, it was placed in front of the participant in sight of the HTC lighthouses that track the position of the HMD and the handheld controllers, to ensure proper calibration of the virtual world also during the real-world conditions.
Pointing Apparatus
A handheld HTC VIVE controller was used to record the localization judgements of the participants in all conditions. By pressing the trigger button on the back of the controller, their judgement was recorded. A model of this controller was rendered in the virtual environment, however there was no physical representation of the participants themselves in the virtual environment. As it was hypothesized that visual information of the body could affect pointing, a condition was included to measure the difference in pointing at visual targets in the real and virtual environment. In the conditions where this pointing bias might have affected data (i.e., when participants had access to visual information), a correction for this pointing bias was applied.
Stimuli and Spatialization
The stimuli were created in MATLAB. The auditory stimulus consisted of a 240 ms pink noise burst with a 20 ms ramp, raised cosine window. The stimuli were presented, on average, at 65 dB sound pressure level (dB SPL). To reduce directional loudness cues (Makous and Middlebrooks, 1990; Musicant and Butler, 1984) the sound level was roved by values drawn from a uniform distribution between ± 3 dB. The stimuli were spatialized using Ambisonics panning (Gerzon, 1973). The highest order Ambisonics that can be reproduced with a 24-loudspeaker array in the horizontal plane is 11th-order. To decrease the Ambisonics order, the number of loudspeakers used to produce the stimulus was reduced and the decoder was adjusted accordingly. In this manner stimuli were presented in 1st-, 3rd-, 5th-order Ambisonics, using, respectively, 4, 8 and 12 loudspeakers, spaced equidistantly. The individual loudspeakers used to reproduce each Ambisonics order are indicated in Figure 2. An Ambisonics decoder with dual-band energy normalization was used as in (Favrot & Buchholz, 2010) and (Ahrens et al., 2020). The low-frequency region received no weighting (basic decoding) and in the high-frequency region 'max-re’ decoding was applied. The transition frequency between the weighting methods was set to the Ambisonics order multiplied by 800 Hz. Stimuli were presented from −90° to 90° azimuth in 7.5-degree steps, i.e., at each loudspeaker and halfway in between each loudspeaker. Each position was repeated five times for each Ambisonics order in each condition, resulting in 500 trials per auditory condition and 2000 auditory trials in total.
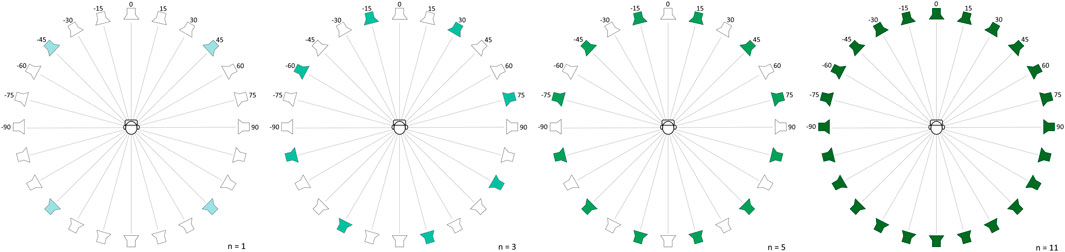
FIGURE 2. Loudspeakers used per Ambisonics order. The loudspeakers used for the reproduction of 1st-, 3rd-, 5th- and 11th-order Ambisonics, respectively. The loudspeaker pictogram indicates the loudspeaker positions and the coloring the loudspeakers that were used for each of the Ambisonics order conditions.
Pointing Bias
To measure the potential pointing bias, as was found in (Ahrens et al., 2019) perhaps as a result of a lack of Avatar in VR (Schwind et al., 2018), participants were asked to point, both in the real environment and in the virtual environment, at static visual targets, namely the loudspeakers. As shown in Figure 1, the loudspeakers, that were positioned between −90° and 90° azimuth, were numbered from 1 to 13. In this task, participants were shown a number, either on a virtual screen in VR or on an iPad that was placed in front of the participant, and then pointed, in the same manner as in the auditory localization task, at the center of the loudspeaker with that number. The iPad and the virtual screen were only present during this task. Note that participants only pointed at visual, instead of auditory, sources in this last condition. Again, each position was repeated 5 times for each position, resulting in 65 trials per condition for a total of 130 trials in block 3.
Experimental Conditions
The experiment consisted of six conditions, presented in three blocks (see Table 1). The blocks were presented in a fixed order, but within a block, the order of the conditions was counterbalanced across participants. The various Ambisonics orders were tested interleaved, i.e., within each condition the stimuli were presented in all Ambisonics orders. To investigate the effect of the HMD, without any visual biases, participants performed the localization experiment blindfolded in the first block. For the condition with the HMD, the HMD was placed over the blindfold. The second block then investigated if visual information could compensate for the potential effects of the HMD found in the first block. Finally, in the third block, the potential pointing bias, due to the lack of a physical representation of the participants in VR, was measured. Since participants did not have access to any potential biasing visual information in the blindfolded condition, no corrections were applied here. Each acoustic condition started with 20 training trials to ensure participants understood and followed the instructions with regards to pointing and how to proceed through the block. The different conditions are summarized in Table 1 above.

TABLE 1. Experiment conditions.
Procedure
The experiment was conducted in two sessions with a maximum of 2.5 h, with at least three enforced breaks per session (halfway through and in-between blocks). At the start of the experiment, participants were told that sounds would be presented using an Ambisonics sound system which could simulate sounds from anywhere in the room. They were instructed to face forward from their seated position before and during each stimulus, and to point with the controller at the direction where they perceived the sound originated from. After stimulus presentation, the participants were allowed to freely turn around while pointing. After indicating the perceived origin of the stimulus, participants faced forward again and 1.5 s after recording the response, the next stimulus played automatically. Participants were instructed to use their entire arm and fixate their wrist whilst pointing and to maintain the same pointing method throughout the experiment. Finally, participants were encouraged to take additional breaks during the experiment (besides the aforementioned three breaks per session) if they needed them. Participants were then guided into the experimental room, seated at the center of the array and were shown the VR headset. In the first block they were then blindfolded and, depending on the condition, were either fitted with headset or the headset was placed in front of them. In the conditions with visual information participants were fitted with the headset and given the option to adjust the settings to their preferences. The non-rotating chair was then raised to ensure their ears were positioned at height of the loudspeakers.
Analysis
Pointing Bias
For the calculation of the pointing bias, responses with an error larger than 15° were treated as outliers and removed from the analysis. 0.011% of the visual trials were rejected based on this criterion. For every participant, the mean pointing bias was then calculated per visual stimulus location in both the real and virtual environment. For the stimuli presented in between loudspeakers, where no pointing bias was measured, the subtracted pointing bias was calculated by linearly interpolating the nearest measured pointing biases. Each response in the second block (with visual information) was then corrected by subtracting the individual pointing bias, i.e., same participant, environment, and location. The visual localization data itself (without the interpolated data points) was also analyzed. For this, a mixed linear model was fitted to the responses with the stimulus location and experimental condition as fixed effects, while the participants and repetitions were considered as random effects. For the computational analysis, the statistical software R (R Core Team, 2020) was used together with the “lmerTest” package (Kuznetsova et al., 2017).
Auditory Localization
No outlier removal was conducted on the acoustic localization data. As participant 20 was left-handed, which has been shown to affect auditory space perception (Ocklenburg et al., 2010), data from the left and right hemisphere was flipped for the analysis. For the statistical analysis of the auditory localization responses, a mixed linear model was fitted to the (corrected) azimuth error using the same computational methods as for the pointing bias. As mentioned previously, in the blindfolded conditions no correction for the pointing bias was applied, as no visual information was available in both the real and virtual world. However, as described in Pointing Bias. in the visual condition, the localization error was corrected by subtracting the pointing bias. The stimulus location, Ambisonics order and condition were considered fixed effects, while the participants and repetitions were considered as random effects. To investigate how the different factors affected the localization performance, post-hoc analyses of within factor comparisons were performed. To determine the effect of the HMD, the blindfolded conditions with and without the HMD were compared. To find the effect of visual information on this effect, results between blocks one and two were compared.
Results
Pointing Bias
Figure 3 shows the signed pointing error to visual objects for the real (blue) and virtual (orange) environment. The pointing error is defined as the difference between the response angle and the source angle in degrees azimuth. A large variation in pointing behavior across participants can be seen, especially at more eccentric angles. Additionally, a shift in the pointing direction towards the left side (negative angles) can be seen in the virtual environment relative to the real environment. The statistical analysis of the responses showed a significant difference between the pointing in the real environment versus pointing in the virtual environment [F1,2563 = 166.294, p < 0.0001]. The post-hoc comparison estimated the effect size between the real and the virtual environment to be 1.76° [t(2563) = 12.896, p < 0.0001]. Additionally, an effect of the stimulus location was found [F12,2563 = 49.953, p < 0.0001], but no significant interaction between the environment and the stimulus location [F12,2551 = 1.309, p = 0.2058].
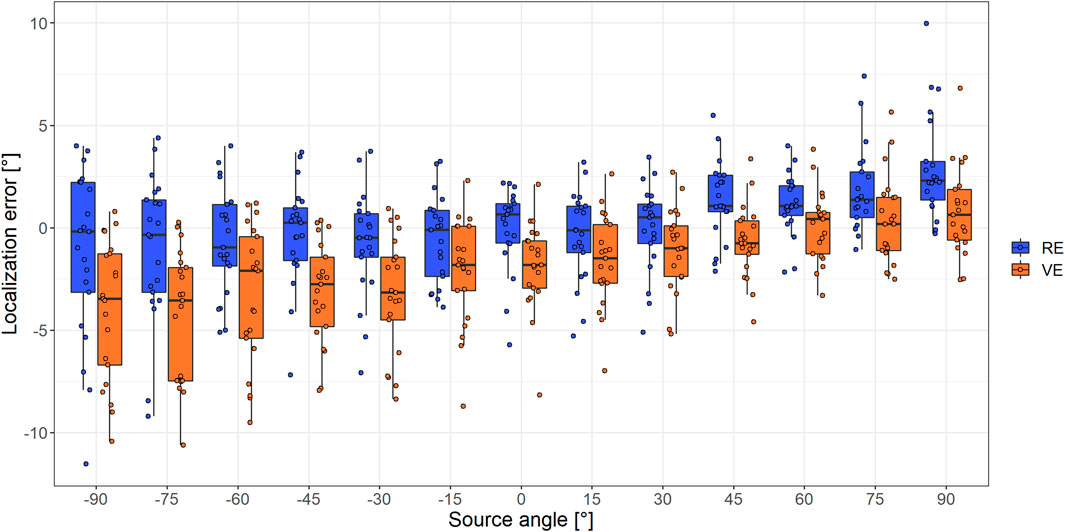
FIGURE 3. Pointing bias with (orange) and without HMD (blue). The pointing bias in the visual pointing task is shown per angle for both the virtual (VE) and the real (RE) environment. The dots indicate the mean pointing error per person and the boxplot shows the distribution. The boxes extend from the first to the third quartile, with the median shown as the center black line.
Effect of Ambisonics Order
Figure 4 shows the signed localization error, that is the difference between the response angle and the source angle in degrees azimuth, as a function of the source angle for the different Ambisonics orders. As no interaction between the conditions and the Ambisonics order was found, data from all conditions are included in this figure. The localization error was found to vary with the stimulus location [F24,39806 = 142.178, p < 0.0001] and Ambisonics order [F3, 39806 = 29.631, p < 0.0001]. Moreover, a significant interaction between the Ambisonics order and the stimulus location was found [F72, 39806 = 73.144, p < 0.0001]. A discrepancy between 1st-order Ambisonics responses and higher order Ambisonics responses can be seen. This difference was significant at all angles, except at 7.5°−22.5° (1st–3rd, [7.5°: t(39806) = −0.618, p = 1.00], [15°: t(39806) = −1.372, p = 1.00], [22.5° t(39806) = −2.175, p = 0.1778]; 1st–5th, [7.5°: t(39806) = −1.207, p = 1.00], [15°: t(39806) = −1.372, p = 1.00]; 1st–11th, [7.5°: t(39806) = −1.015, p = 1.00]). As can be seen in Figure 4, for the 1st-order Ambisonics results, the absolute localization error increased with the absolute source azimuth. Such consistent increase of error with azimuth was not found when higher Ambisonics orders were used to simulate the sources. For all Ambisonics orders, at the outermost angles, i.e., ±82.5–90°, the simulated sources were perceived insufficiently lateralized. Here again results were most pronounced when 1st-order Ambisonics was used. With the 1st-Ambisonics order, the localization error reached ±30° at ±90° azimuth, i.e., participants perceived the source two entire loudspeakers closer to the center. For sources reproduced using higher Ambisonics orders this discrepancy was highly reduced, although not fully diminished. Few differences were found between the perceived location of the presented sources with the Ambisonics orders larger than one; a small decrease in error was observed when increasing the Ambisonics order at the outer source angles (3rd–5th, [90°: t(39806) = −4.172, p = 0.0002]; 3rd–11th, [82.5°: t(39806) = −3.889, p = 0.0006], [90°: t(39806) = −4.099, p = 0.0002]). Besides that, there was a small difference between 3rd- and 5th-order at −67.5° [t(29806) = 2.727, p = 0.0384] and 5th- and 11th-order Ambisonics at 52.5° [t(29806) = −2.770, p = 0.0337]. At all other angles no significant difference within the higher Ambisonics orders were found.
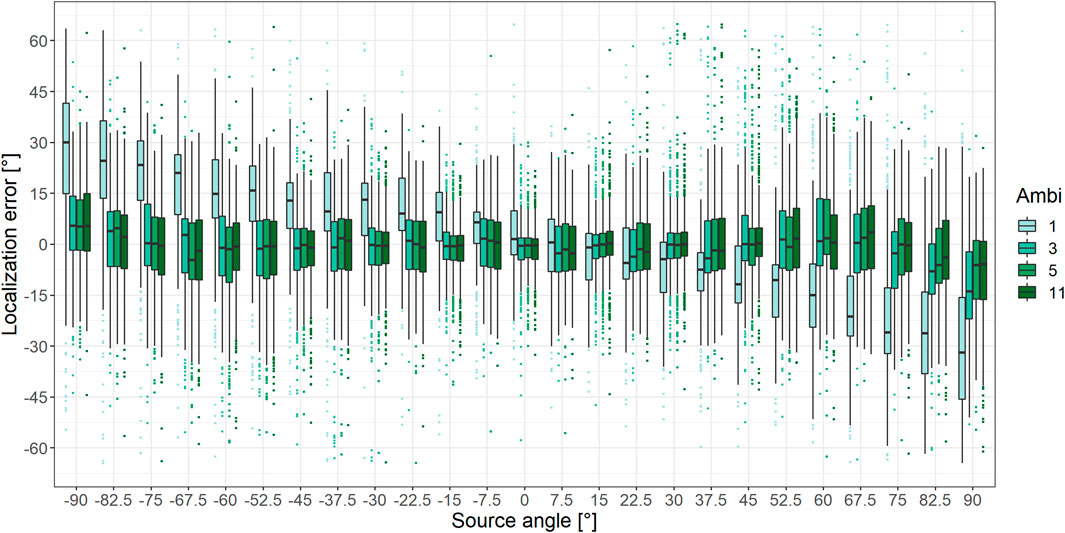
FIGURE 4. Localization error for the various Ambisonics orders. The perceived source angle is plotted as a function of the stimulus position. Data from all acoustic conditions are included in the figure, except for 450 outliers (1.125%) that occurred outside of the figure boundaries (localization error larger than ± 65°). Data are separated by the Ambisonics order used to produce the stimuli. The boxes extend from the first to the third quartile, with the median shown as the center black line. Responses that exceeded 1.5 times the interquartile range are considered outliers and are indicated as dots.
Effect of the Head Mounted Virtual Reality Displays
The localization error in the blindfolded conditions is shown in Figure 5. Data without the HMD are shown in blue and data with the HMD are shown in orange. The localization error varied with presentation angle [F24,39806 = 142.178, p < 0.0001] and depended on the condition, i.e., with or without the HMD [F3,39806 = 59.077, p < 0.0001]. Additionally, a significant interaction was found between the presentation angle and the condition [F72,39806 = 12.819, p < 0.0001]. At negative angles, i.e., in the left hemisphere, the localization error tended to be more negative, i.e., sources were perceived more to the left, when wearing the HMD, compared to when participants were not wearing the HMD. At positive angles, i.e., in the right hemisphere, instead sounds were perceived more to the right when wearing the HMD. The post-hoc analysis showed that the increase in the perceived lateralization of the sound sources when wearing the HMD was larger in the right hemisphere than in the left hemisphere. In the right hemisphere the difference in the conditions was significant at all angles (7.5°–67.5°, p < 0.0001; 75°, p = 0.0001; 82.5°, p = 0.0073; 90°, p = 0.0152). In the left hemisphere, the effect of the HMD only reached statistical significance at -82.5° [t(39806) = 3.209, p = 0.0080] and −37.5 [t(39806) = 2.692, p = 0.0427]. Furthermore, the difference between the conditions with and without HMD was less pronounced in the left hemisphere; the maximum difference between the RE (without HMD) and VE (with HMD) was 3.5° in the left hemisphere, and between 3.7° and 8.4° in the right hemisphere.
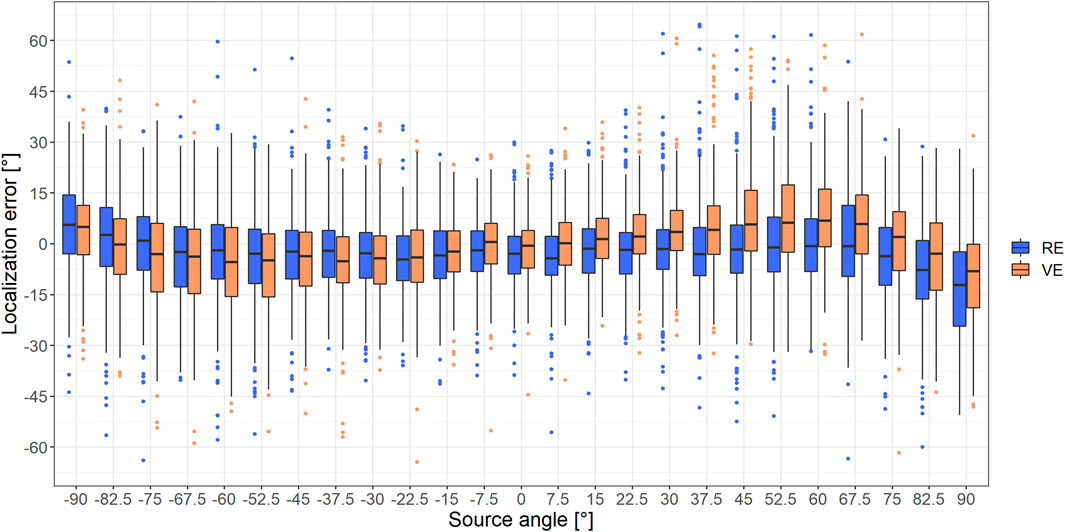
FIGURE 5. The localization error in the blindfolded conditions with (orange) and without (blue) HMD. Due to the discrepancy in the first versus higher order Ambisonics data, only higher order (3rd-, 5th-, 11th-order) Ambisonics data is included in the figure. The boxes extend from the first to the third quartile, with the median perceived response shown with black lines. Responses that exceeded 1.5 times the interquartile range are considered outliers and are indicated as dots. 158 outliers (0.527%) are not shown as they occurred outside of the figure boundaries (localization error larger than ± 65°).
Effect of Visual Information
Figure 6 shows the effect of the HMD when visual information is present. Data from the condition without the HMD is shown in blue and data from the condition with the HMD is shown in orange. Although, at most angles, the disparity between the two conditions was reduced either partially or fully, compared to the disparity in Figure 5, significant differences between the RE and VE condition remained. In the left hemisphere a significant difference was still found at -60° azimuth [t(39806) = 3.181, p = 0.0088], while in the right hemisphere significant differences remained at several angles ([0°: t(39806) = −3.386, p = 0.0043], [7.5°: t(39806) = −4.238, p = 0.0001], [22.5°: t(39806) = −3.629, p = 0.0017], [45°: t(39806) = −2.643, p = 0.0493], [52.5°: t(39806) = −5.223, p < 0.0001], [60°: t(39806) = −3.677, p = 0.0014], [67.5°: t(39806) = -2.822, p = 0.0287]). These difference between Figures 5, 6 shows that visual information of the loudspeaker locations affected the localization error.
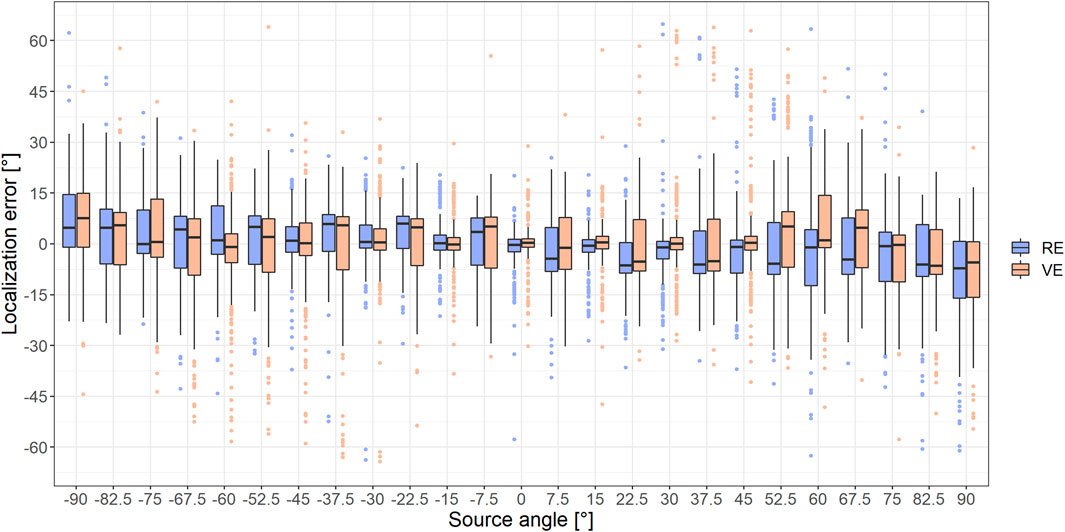
FIGURE 6. Boxplot of the (pointing bias corrected) localization error with (orange) and without HMD (blue) in the conditions with visual information. Only higher order Ambisonics data is included in the figure. The boxes extend from the first to the third quartile, with the median perceived response shown with black lines. Responses that exceeded 1.5 times the interquartile range are considered outliers and are indicated as dots. 142 outliers (0.473%) are not shown as they occurred outside of the figure boundaries (localization error larger than ± 65°).
Moreover, a pattern in the localization error was found, which was consistent with participants pointing at visual loudspeakers locations. From Figure 6 it can be seen that the error is smaller at integer multiples of 15° than at the other angles. As sound was presented not only at exact loudspeaker positions (integer multiples of 15°), but also halfway in between, it was hypothesized that the visual information of the loudspeaker location might have an effect on the response pattern. To more clearly investigate this behavior, data from Figure 6 (right hemisphere only) was replotted in Figure 7.
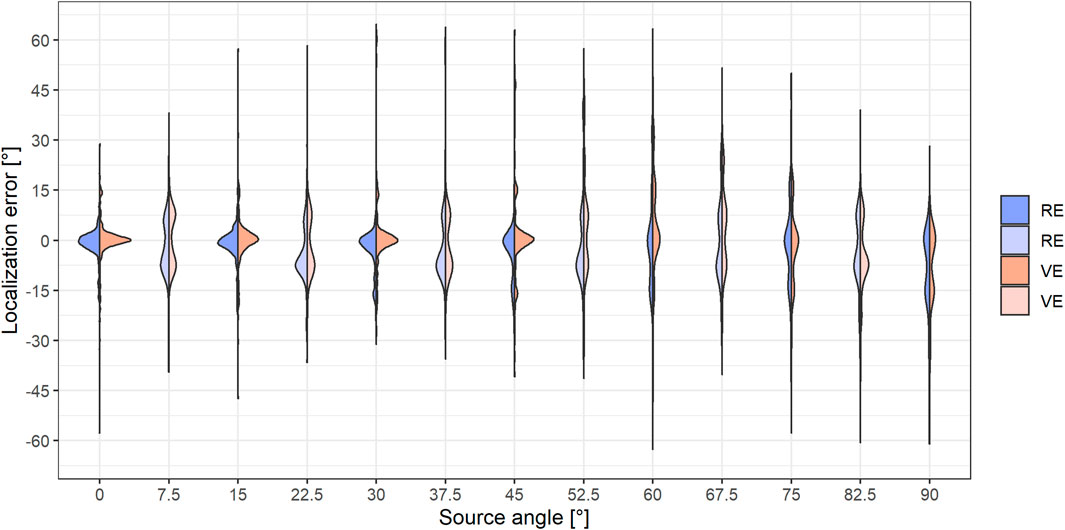
FIGURE 7. Violin plot of the (pointing bias corrected) localization error with (orange) and without HMD (blue) in the conditions with visual information, right hemisphere data only. The distributions of the localization error are shown as function of the azimuth location when visual information is presented. Both the environment (RE and VE) as well as the presence of a loudspeaker at the azimuth location are color-coded. The violin plot shows the spread of the responses per angle and per condition, in the form of a sideways histogram. Only higher order Ambisonics data, right hemisphere, are included. 86 outliers (1.103%) are not shown as they occurred outside of the figure boundaries (localization error larger than ± 65°).
Figure 7 shows the data from Figure 6, as a violin plot, where the probability density of the responses is shown per azimuth angle. Darker colors indicate that the sound was simulated at an angle with a loudspeaker, while the lighter colors indicate that sound was presented halfway in-between loudspeakers. At small angles, when sound sources were simulated at loudspeaker locations, the errors were unimodally distributed around 0° localization error. When sound was instead simulated in between loudspeakers, responses were bimodally distributed, i.e., responses were split between the two closest loudspeakers. At larger source angles, multiple peaks can be seen in the distributions. The centers of these peaks remain consistent with loudspeaker locations.
Mean Results
Figure 8 shows the mean absolute localization error for the acoustic conditions, separated by Ambisonics order and condition. The benefit of using higher order Ambisonics, compared to 1st-order Ambisonics is clearly visible in the reduced localization error. Additionally, visual information, indicated in light colors, decreases the localization error when higher order Ambisonics is used. Finally, the effect of the HMD can be seen when comparing the blue and the orange boxes, as an increase in the localization error for the higher Ambisonics orders.
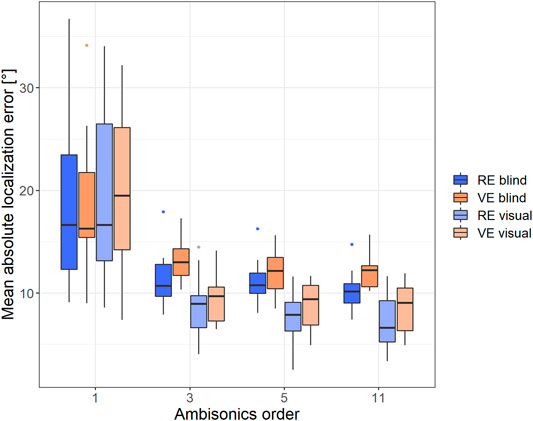
FIGURE 8. The mean absolute localization error per condition, separated by Ambisonics order. The average localization error was grouped by angle, condition, and azimuth, after which the mean localization error was calculated. The boxes extend from the first to the third quartile, with the median perceived response shown with black lines. Responses that exceeded 1.5 times the interquartile range are considered outliers and are indicated as dots.
Discussion
Shift in the Perceived Location due to the Head Mounted Virtual Reality Displays
As in Ahrens et al. (2019) and Gupta et al. (2018) we found that the HMD increased the perceived lateralization of the stimuli. Interestingly, despite the symmetric setup, this effect was found to be stronger in the right hemisphere. In the left hemisphere, there was a similar trend in the data, but it was much smaller and not significant. In contrast, Ahrens et al. (2019) found the larger effect in the left hemisphere (although significance levels were only reached at few stimulus positions, which might be related to fewer participants). In both the RE blindfolded and VE blindfolded indications of bias were found. In the RE participants tended to point slightly more to the left, whereas in the VE participants tended to point slightly more towards the right. Together these biases might have increased the effect of the HMD in the right hemisphere, while decreasing the effect in the left hemisphere. Interestingly this difference remained also in the visual condition, although strongly reduced. The distribution of the responses showed that, when in doubt, participants tended to favor the closest loudspeaker to the left more often in the RE, whereas in the VE they tended to favor the closest loudspeaker to the right. To confirm this, we calculated the percentage of responses that occurred to the right of the actual position. In the right hemisphere, 38.05% of the responses occurred to the right of the speaker in the RE, compared to 49.85% in the VE. That the effect occurred in both the blindfolded and the visual condition suggests that there was some consistent effect of the HMD. It could be that the HMD affects pointing also when there is no visual information, potentially due the size and weight of the HMD.
Ambisonics Order Does Not Influence the Effect of the Head Mounted Virtual Reality Displays
Although it was hypothesized that the effect of the HMD might vary with Ambisonics order, no such interaction was found. Localization itself, however, was clearly affected by Ambisonics order. Firstly, when using 1st-order Ambisonics, stimuli were consistently perceived slightly more towards the center, especially at the most extreme angles. This difference between the intended location and the perceived location was large enough that responses were regularly shifted by an entire loudspeaker at the outer angles in the condition where visual information was available. This suggests that the 1st-order Ambisonics system could not fully achieve the intended lateralization. This “under lateralization” of the stimuli was also found by Pulkki and Hirvonen (2005), who also found that the lateralization appeared capped between 60–70° azimuth. As in previous studies (Pulkki and Hirvonen, 2005; Bates et al., 2007; Bertet et al., 2013; Thresh et al., 2017), increasing the Ambisonics order from 1st- to 3rd-order, greatly improved lateralization. Increasing the Ambisonics order further, however, did not improve localization much, again in line with previous studies (Thresh et al., 2017). Similar effects of the Ambisonics order have also been shown for speech intelligibility (Ahrens et al., 2020). However, in the current experiment participants were seated in the center of the array. For off-center listenening positions, studies have found that increasing Ambisonics order improves localization accuracy (Stitt et al., 2013, Stitt et al., 2014) also beyond the third order (Frank et al., 2008). Moreover, the current study tested localization in anechoic conditions. Previous studies showed that reverberation can mask some of the errors that are due to the Ambisonics reproduction (Oreinos and Buchholz, 2015; Ahrens et al., 2020). Thus, adding reverberation might further affect localization performance and interactions with the Ambisonics orders (Sampedro Llopis et al., 2019).
Some Compensation From Visual Information
Visual information strongly affected the responses of the participants and reduced the effect of the HMD at many locations. However, due to stimuli being presented also in between loudspeakers, it did not always improve localization. Similarly, the tendency to point at loudspeakers also increased the effect of the HMD at some locations where the HMD shift affected which loudspeaker was perceived as the nearest (see for example Figure 6, 52.5°). In the right hemisphere visual information reduced the effect of the HMD at almost all angles. In the left hemisphere, the results were mostly unaffected by visual information, as the difference between the VE and RE were already very small. Nevertheless, significant differences between localization with and without the HMD remained. However, these remaining differences can also be the result of the correction applied.
Limited Impact on Virtual Reality
As visual information compensated for most of the effect of the HMD, it is likely that in most use-cases, such as playing audio-visual recordings, VR games etc. the effects of the HMD will be negligible. Even if the effects are not fully compensated for, it is likely that presence (“the feeling of being there”), one of the key factors of VR, remains unaffected. Presence has been shown to be facilitated by audio (Nordahl, 2004; Larsson and Västfjäll, 2007; Hruby, 2019; Kern and Ellermeier, 2020), especially spatialized audio (Hendrix and Barfield, 1995; Riecke et al., 2009). However, the accuracy of the spatialized audio was found not to influence presence (Riecke et al., 2009). Moreover, the shift in the perceived location in the frontal area (where we are most sensitive to spatial audio-visual disparities) is within the spatial distance where visual and auditory stimuli are integrated (Thurlow and Jack, 1973; Godfroy et al., 2003; Lewald and Guski, 2003; Stenzel, 2017). As a result, integration of the audio-visual scenes should be mostly unaffected. However, because a shift in the perceived location of the auditory stimulus is present, it will be important to take the effect of the HMD into account in experiments where the exact positioning of the stimuli is relevant, such as audio (-visual) localization experiments. These results only extend to the combination of the HMD with loudspeaker reproduced Ambisonics, headphone reproductions will not be shifted in the same way.
Conclusion
In line with previous studies, we found that the HMD increased the perceived lateralization of auditory stimuli, especially in the right hemisphere. In the left hemisphere the effect was much smaller and only significant at a few angles. However, significant effects mostly occurred in the right hemisphere. Although an interaction between the Ambisonics order used to present the stimuli and the effect of the HMD was hypothesized, no such interaction was found. Localization itself, however, was found to be strongly affected by the Ambisonics order. Sounds presented with 1st-order Ambisonics were generally perceived to be originating from a more central location. This “under lateralization” of the stimuli increased with azimuth, reaching an error of up to 30° at a source angle of 90°. Increasing the Ambisonics order from 1st- to 3rd-order greatly improved the accuracy of the reproduction, however increasing the order beyond this only minimally affected the localization accuracy at a few angles. Finally, visual information led to a compensation for most of the effect of the HMD, but not fully, as significant differences between the RE and VE conditions remained. The impact of this shift in the perceived location is likely small, but in cases where the exact location of the stimuli is important, it will be important to account for effects of the HMD on the auditory stimuli.
Data Availability Statement
The original contributions presented in the study are publicly available. This data can be found here: 10.11583/DTU.13912274.
Ethics Statement
The studies involving human participants were reviewed and approved by Science-Ethics Committee for the Capital Region of Denmark (H-16036391). The patients/participants provided their written informed consent to participate in this study.
Author Contributions
TH, AA, and EM contributed to conception and design of the study. TH organized the database. TH and AA performed the statistical analysis. TH wrote the first draft of the article. All authors contributed to article revision, read, and approved the submitted version.
Funding
This research was supported by the Centre for Applied Hearing research (CAHR) through a research consortium agreement with GN Resound, Oticon, and Widex. The funders had no role in study design, data collection and analysis, decision to publish, or preparation of the article.
Conflict of Interest
The authors declare that the research was conducted in the absence of any commercial or financial relationships that could be construed as a potential conflict of interest.
Publisher’s Note
All claims expressed in this article are solely those of the authors and do not necessarily represent those of their affiliated organizations, or those of the publisher, the editors, and the reviewers. Any product that may be evaluated in this article, or claim that may be made by its manufacturer, is not guaranteed or endorsed by the publisher.
Acknowledgments
This work was carried out as part of the research activities at the Centre for Applied Hearing Research (CAHR) at DTU, supported by GN Hearing, Oticon and WSA. Audiograms were measured by audiologist Rikke Skovhøj Sørensen. The model of the room and loudspeaker array used in the experiment was created by Kasper Duemose Lund. This work was shared on a preprint server (Huisman et al., 2021).
References
Ahrens, A., Lund, K. D., Marschall, M., and Dau, T. (2019). Sound Source Localization with Varying Amount of Visual Information in Virtual Reality. PLoS ONE 14 (3), e0214603. doi:10.1371/journal.pone.0214603
Ahrens, A., Marschall, M., and Dau, T. (2020). The Effect of Spatial Energy Spread on Sound Image Size and Speech Intelligibility. The J. Acoust. Soc. America 147 (3), 1368–1378. doi:10.1121/10.0000747
Alais, D., and Burr, D. (2004). The Ventriloquist Effect Results from Near-Optimal Bimodal Integration. Curr. Biol. 14 (3), 257–262. doi:10.1016/j.cub.2004.01.029
Bates, E., Kearney, G., Furlong, D., and Boland, F. (2007). Localization Accuracy of Advanced Spatialisation Techniques in Small Concert Halls. J. Acoust. Soc. America 121 (5), 3069–3070. doi:10.1121/1.4781867
Bertet, S., Daniel, J., Parizet, E., and Warusfel, O. (2013). Investigation on Localisation Accuracy for First and Higher Order Ambisonics Reproduced Sound Sources. Acta Acustica United with Acustica 99 (4), 642–657. doi:10.3813/AAA.918643
Blauert, J. (1997). Spatial Hearing: The Psychophysics of Human Sound Localization. Harvard, MA: MIT Press.
Dufour, A., Després, O., and Pebayle, T. (2002). Visual and Auditory Facilitation in Auditory Spatial Localization. Vis. Cogn. 9 (6), 741–753. doi:10.1080/13506280042000250
Echevarria Sanchez, G. M., Van Renterghem, T., Sun, K., De Coensel, B., and Botteldooren, D. (2017). Using Virtual Reality for Assessing the Role of Noise in the Audio-Visual Design of an Urban Public Space. Landscape Urban Plann. 167, 98–107. doi:10.1016/j.landurbplan.2017.05.018
Favrot, S., and Buchholz, J. M. (2010). LoRA: A Loudspeaker-Based Room Auralization System. Acta Acustica united with Acustica 96 (2), 364–375. doi:10.3813/AAA.918285
Frank, M., Zotter, F., and Sontacchi, A. (2008). “Localization Experiments Using Different 2D Ambisonics Decoders,” in 25th Tonmeistertagung – VDT International Convention, Leipzig, Germany, November 13–16, 2008.
Freeman, L. C. A., Wood, K. C., and Bizley, J. K. (2018). Multisensory Stimuli Improve Relative Localisation Judgments Compared to Unisensory Auditory or Visual Stimuli. J. Acoust. Soc. America. 143 (6), EL516–EL522. doi:10.1121/1.5042759
Genovese, A., Zalles, G., Reardon, G., and Roginska, A. (2018). “Acoustic Perturbations in HRTFs Measured on Mixed Reality Headsets,” in Proceedings of the Aes International Conference — 2018, Redmond, WA, United States, August 20–22, 2018, 268–283.
Gerzon, M. A. (1973). Periphony: With-Height Sound Reproduction. AES: J. Audio Eng. Soc. 21 (1), 2–10.
Godfroy, M., Roumes, C., and Dauchy, P. (2003). Spatial Variations of Visual-Auditory Fusion Areas. Perception 32 (10), 1233–1245. doi:10.1068/p3344
Gori, M., Sandini, G., Martinoli, C., and Burr, D. C. (2014). Impairment of Auditory Spatial Localization in Congenitally Blind Human Subjects. Brain 137 (1), 288–293. doi:10.1093/brain/awt311
Gupta, R., Ranjan, R., He, J., and Gan, W. S. (2018). “Investigation of Effect of VR/AR Headgear on Head Related Transfer Functions for Natural Listening,” in Proceedings of the Aes International Conference — 2018, Redmond, WA, United States, August 20–22, 2018, 130–139.
Hendrix, C., and Barfield, W. (1995). “Presence in Virtual Environments as a Function of Visual and Auditory Cues,” in Proceedings - Virtual Reality Annual International Symposium, Research Triangle Park, NC, United States, March 11–15, 1995, 74–82. doi:10.1109/vrais.1995.512482
Hruby, F. (2019). The Sound of Being There: Audiovisual Cartography with Immersive Virtual Environments. KN J. Cartogr. Geogr. Inf. 69 (1), 19–28. doi:10.1007/s42489-019-00003-5
Huisman, T., Ahrens, A., and MacDonald, E. (2021). Sound Source Localization in Virtual Reality with Ambisonics Sound Reproduction. PsyArXiv 26. doi:10.31234/osf.io/5sef6
Jackson, C. V. (1953). Visual Factors in Auditory Localization. Q. J. Exp. Psychol. 5 (2), 52–65. doi:10.1080/17470215308416626
Kern, A. C., and Ellermeier, W. (2020). Audio in VR: Effects of a Soundscape and Movement-Triggered Step Sounds on Presence. Front. Robot. AI. 7 (February), 1–13. doi:10.3389/frobt.2020.00020
Kessling, P., and Görne, T. (2018). “Studio for Immersive media Research and Production: Immersive Audio Lab at HAW Hamburg,” in 145th Audio Engineering Society International Convention, (AES) 2018, New York, United States, October 17–20, 2018.
Kuznetsova, A., Brockhoff, P. B., and Christensen, R. H. B. (2017). lmerTest Package: Tests in Linear Mixed Effects Models. J. Stat. Soft. 82 (13), 1–26. doi:10.18637/jss.v082.i13
Larsson, P., and Västfjäll, D. (2007). “When what You Hear Is what You See: Presence and Auditory-Visual Integration in Virtual Environments,” in Proceedings of the 10th Annual International Workshop on Presence, Barcelona, Spain, October 25–27, 2007, 11–18.
Lewald, J., and Guski, R. (2003). Cross-modal Perceptual Integration of Spatially and Temporally Disparate Auditory and Visual Stimuli. Cogn. Brain Res. 16 (3), 468–478. doi:10.1016/S0926-6410(03)00074-0
Makous, J. C., and Middlebrooks, J. C. (1990). Two‐dimensional Sound Localization by Human Listeners. J. Acoust. Soc. America. 87 (5), 2188–2200. doi:10.1121/1.399186
Musicant, A. D., and Butler, R. A. (1984). The Influence of Pinnae‐based Spectral Cues on Sound Localization. J. Acoust. Soc. America. 75 (4), 1195–1200. doi:10.1121/1.390770
Nordahl, R. (2004). “Self-induced Footsteps Sounds in Virtual Reality: Latency, Recognition, Quality and Presence,” in Proceedings of the Eight Annual International Workshop Presence. London, UK. 21-23 September 2005, 5–6.
Ocklenburg, S., Hirnstein, M., Hausmann, M., and Lewald, J. (2010). Auditory Space Perception in Left- and Right-Handers. Brain Cogn. 72 (2), 210–217. doi:10.1016/j.bandc.2009.08.013
Odegaard, B., Wozny, D. R., and Shams, L. (2015). Biases in Visual, Auditory, and Audiovisual Perception of Space. Plos Comput. Biol. 11 (12), e1004649. doi:10.1371/journal.pcbi.1004649
Oreinos, C., and Buchholz, J. M. (2015). Objective Analysis of Ambisonics for Hearing Aid Applications: Effect of Listener's Head, Room Reverberation, and Directional Microphones. J. Acoust. Soc. America. 137 (6), 3447–3465. doi:10.1121/1.4919330
Pulkki, V., and Hirvonen, T. (2005). Localization of Virtual Sources in Multichannel Audio Reproduction. IEEE Trans. Speech Audio Process. 13 (1), 105–119. doi:10.1109/TSA.2004.838533
R Core Team (2020). R: A Language and Environment for Statistical Computing. Vienna, Austria: R Foundation for Statistical Computing.
Riecke, B. E., Väljamäe, A., and Schulte-Pelkum, J. (2009). Moving Sounds Enhance the Visually-Induced Self-Motion Illusion (Circular Vection) in Virtual Reality. ACM Trans. Appl. Percept. 6 (2), 1–27. doi:10.1145/1498700.1498701
Sampedro Llopis, H., Pind Jörgensson, F. K., and Jeong, C.-H. (2019). “Effects of the Order of Ambisonics on Localization for Different Reverberant Conditions in a Novel 3D Acoustic Virtual Reality System,” in Proceedings of 23rd International Congress on Acoustics, 747–754. doi:10.18154/RWTH-CONV-239043
Schwind, V., Mayer, S., Comeau-Vermeersch, A., Schweigert, R., and Henze, N. (2018). “Up to the Finger Tip,” in Proceedings of the 2018 Annual Symposium on Computer-Human Interaction in Play, Melbourne, VIC, Australia, October 28–31, 2018, 477–488. doi:10.1145/3242671.3242675
Stenzel, H. (2017). “Modeling Horizontal Audio-Visual Coherence with the Psychometric Function,” in 142nd Audio Engineering Society International Convention AES 2017, Berlin, Germany, May 20–23, 2017.
Stitt, P., Bertet, S., and Van Walstijn, M. (2014). Off-centre Localisation Performance of Ambisonics and HOA for Large and Small Loudspeaker Array Radii. Acta Acustica United With Acustica. 100 (5), 937–944. doi:10.3813/AAA.918773
Stitt, P., Bertet, S., and Van Walstijn, M. (2013). “Perceptual Investigation of Image Placement with Ambisonics for Non-centred Listeners,” in Dafx 2013 - 16th International Conference on Digital Audio Effects, Maynooth, Ireland, September 2–5, 2013.
Suárez, A. S., Kaplanis, N., Serafin, S., and Bech, S. (2019). “In-virtualis: A Study on the Impact of Congruent Virtual Reality Environments in Perceptual Audio Evaluation of Loudspeakers,” in 2019 AES International Conference on Immersive and Interactive Audio, York, United Kingdom, March 27, 2019.
Tabry, V., Zatorre, R. J., and Voss, P. (2013). The Influence of Vision on Sound Localization Abilities in Both the Horizontal and Vertical Planes. Front. Psychol. 4, 932. doi:10.3389/fpsyg.2013.00932
Thresh, L., Armstrong, C., and Kearney, G. (2017). A Direct Comparison of Localisation Performance when Using First, Third and Fifth Order Ambisonics for Real Loudspeaker and Virtual Loudspeaker Rendering. 143rd Audio Eng. Soc. ConventionAes 1, 489–497.
Keywords: sound localization, virtual reality, ambisonics, audiovisual, HMD
Citation: Huisman T, Ahrens A and MacDonald E (2021) Ambisonics Sound Source Localization With Varying Amount of Visual Information in Virtual Reality. Front. Virtual Real. 2:722321. doi: 10.3389/frvir.2021.722321
Received: 08 June 2021; Accepted: 10 September 2021;
Published: 14 October 2021.
Edited by:
Daniel Thalmann, École Polytechnique Fédérale de Lausanne, SwitzerlandReviewed by:
Matthias Frank, University of Music and Performing Arts Graz, AustriaJoan Llobera, Faculty of Psychology, University of Barcelona, Spain
Copyright © 2021 Huisman, Ahrens and MacDonald. This is an open-access article distributed under the terms of the Creative Commons Attribution License (CC BY). The use, distribution or reproduction in other forums is permitted, provided the original author(s) and the copyright owner(s) are credited and that the original publication in this journal is cited, in accordance with accepted academic practice. No use, distribution or reproduction is permitted which does not comply with these terms.
*Correspondence: Thirsa Huisman, thuis@dtu.dk