 Annalise G. Blum1*
 Ben Zaitchik1
 Sarah Alexander2
 Shu Wu2
 Ying Zhang1
 Shraddhanand Shukla3
 Temesgen Alemneh1
 Paul Block2
- 1Department of Earth & Planetary Sciences, Johns Hopkins University, Baltimore, MD, United States
- 2Civil and Environmental Engineering, University of Wisconsin-Madison, Madison, WI, United States
- 3Department of Geography, University of California, Santa Barbara, Santa Barbara, CA, United States
When complete, the Grand Ethiopian Renaissance Dam (GERD) will be the largest hydropower dam in Africa. The GERD has become a focal point of geopolitical tensions because it will allow Ethiopia greater control over the Blue Nile River, Egypt's main source of freshwater. To inform discussions of filling plans and responses, we created a probabilistic seasonal forecast for Upper Blue Nile rainfall and streamflow in the GERD basin. Eight statistical models and eight dynamical models were used to forecast the rainy season (June–September), which were then converted into river flow for June–December 2018. Both statistical and dynamical models predicted a high probability of average to above average rainfall as well as Upper Blue Nile flow in the GERD basin. Actual summer precipitation in 2018 was slightly below the long-term mean but well within the range considered to be “near normal.” Leveraging the increasingly online media landscape for science communication, we made the forecast publicly available through a blog and shared with regional decision-makers in advance of the 2018 rainy season. The blog attracted news coverage in the region focusing primarily on the relatively low likelihood of below-average Nile flow across the forecast ensemble. When asked for feedback on the blog, Ethiopian decision-makers and forecasters reported that flow predictions included in our blog were useful and not part of existing products. Access and comprehension were noted barriers to the use of these types of forecasts, consistent with prior research in forecast communication and dissemination. Forecasts available on such blogs can inform a shared understanding among decision-makers in the management of transboundary waters, yet effective communication and dissemination remain a challenge.
Introduction
Soon to be the largest hydropower dam in Africa, the controversial Grand Ethiopian Renaissance Dam (GERD) will allow Ethiopia greater control over the Blue Nile River, Egypt's main source of freshwater. The GERD is expected to have the capacity to generate 15,000 gigawatt hours/year (SaliniImpregilo, 2014), substantially increasing Ethiopia's power generation capacity for both use within Ethiopia and export to neighboring countries. The merits of placing a large hydropower dam at the GERD site have been discussed and debated for decades. The site was first formally identified in a survey by the United States Bureau of Reclamation (USBR, 1964), and it was included in analyses of hydrodevelopment of the Nile Basin well prior to the beginning of construction (Blackmore and Whittington, 2008). Ethiopia formally announced its intentions to construct the GERD in 2011, and, since that time, many studies have examined the potential impacts of the project on Ethiopia, on downstream riparians Sudan and Egypt, and on the East African power grid (Chen and Swain, 2014; Mulat and Moges, 2014; Satti et al., 2015; Tawfik, 2016; Wheeler et al., 2016).
To begin generating electricity, Ethiopia must fill the 74 cubic kilometer reservoir behind the GERD, which will impact downstream countries including Sudan and Egypt (King and Block, 2014; Zhang et al., 2016). If the filling of the reservoir occurs during years without much rain, Nile flows could be substantially reduced. This possibility has fueled speculation about the potential for a “water war” in the region (BBC, 2018). In contrast, reservoir filling that occurs during wet years may be felt less acutely downstream. Ethiopia has vowed to fill the GERD without causing significant harm to downstream countries, but, in trilateral meetings with Egypt and Sudan, the three countries have struggled to agree on what this means (The New Times, 2018). There have been calls for an agreement among affected countries to be made before filling of the GERD begins (Zhang et al., 2016).
With GERD reservoir filling initially expected to begin during the summer of 2018, we developed a seasonal forecast for Upper Blue Nile rainfall and streamflow at the GERD and made the forecast publicly available on a blog in May 2018. Our aim in publishing our forecast on a blog was to provide decision-makers with timely access to our findings and to further the regional conversation on filling. The shifting media landscape and rise of online news environments has altered the traditional interface between scientists and the public, resulting in more people turning to online environments, such as blogs, for science news (Brossard and Scheufele, 2013; Luzón, 2013). While these changes introduce challenges for science communication best practice, they also open up avenues for decision-makers to connect with science and access relevant content. Some research has suggested that blogs may serve as “boundary layers” to enhance communication and knowledge sharing between scientists and the public and allow greater engagement or active interaction that moves beyond a top-down traditional communication approach (Shanahan, 2011). Others have explored how blog formats allow researchers to contextualize knowledge to share with more diverse audiences than traditional formats allow (Luzón, 2013). Given this shifting communication landscape, we decided to share our Upper Blue Nile rainfall and streamflow forecasts with prospective decision-makers through an easily-accessible online blog format.
In a surprise to many observers, Ethiopia did not begin filling the GERD reservoir in 2018, as the project was behind schedule. Filling is now expected to commence in 2020 or soon after. While the effort to characterize, explain, and predict rainfall in the Ethiopian Blue Nile is an active focus of climate research (see reviews by Berhane et al., 2014; Nicholson, 2017), the forecasting tools developed in these academic studies are not operational. There are existing operational forecasts, such as the Famine Early Warning System (FEWS), the Greater Horn of Africa Climate Outlook Forum (GHACOF), and the Ethiopian National Meteorological Agency forecast products, however these are not hydrological and they do not specifically target the GERD basin.
Next, we describe the Upper Blue Nile Basin upstream of the GERD, followed by an introduction of our probabilistic forecasts for summer rainfall in the GERD basin. We used eight statistically-based and eight dynamically-based forecast models which were converted to Upper Blue Nile streamflow forecasts using a water balance model. We then describe our communication of the forecast using the blog and present our quantitative and qualitative evaluation of both the forecast and blog.
Data and Methods
GERD Basin
The Ethiopian Blue Nile, or Abay River, is located in the western part of Ethiopia (Figure 1). In this region, most rainfall occurs during the summer kiremt season, which extends from June-September. Strong spatial and temporal variability in rainfall exists across the mountainous basin, with an average seasonal rainfall of 760 mm (Zhang et al., 2018). Given the relative wealth in water resources, a majority of the nation's agriculture and infrastructure are located in this basin (Awulachew et al., 2007). The strong seasonality of precipitation in the region, a tendency for intense convective storms during the rainy season, steep topography, and a lack of water control infrastructure on the main stem of the river all conspire to make the Ethiopian Blue Nile a highly seasonal and flood-prone river (Berhane et al., 2014). This flashiness has been both a resource and a curse to downstream countries. Flood recession agriculture is practiced on the Sudanese Blue Nile and, prior to construction of the High Aswan Dam, was a critical mode of cultivation in Egypt. At the same time, Blue Nile flooding is a risk to communities in Sudan, including Khartoum, and the seasonality and high silt load of the river present a management challenge in Sudan (Blackmore and Whittington, 2008). One of the most dramatic impacts of the GERD, after the reservoir is filled, will be the reduction of variability in the Blue Nile River downstream of the GERD site. This change in seasonality and silt load of flows will have substantial implications for downstream countries (Satti et al., 2015).
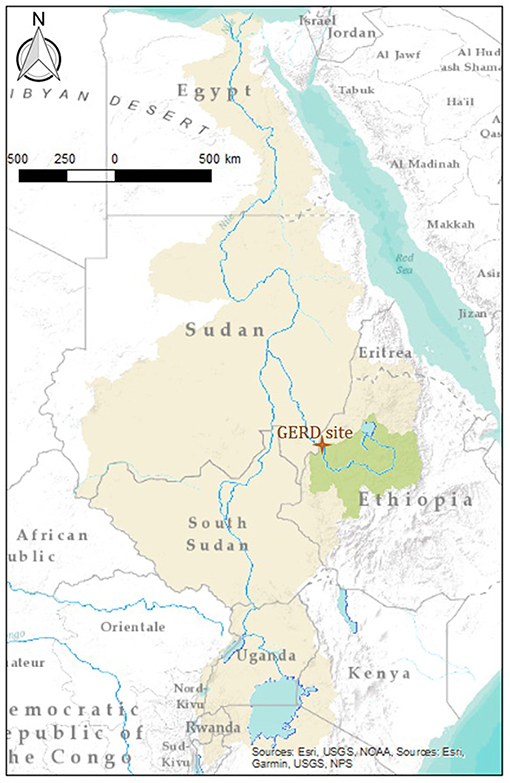
Figure 1. The Nile Basin (yellow), including the GERD site (orange star), and GERD catchment (green).
Statistically-Based Models to Forecast Rainfall
We adapted four statistically-based forecast models that are published in the peer reviewed literature, but are not operational, and four of our own statistically-based models (Table 1). For the already published statistical approaches, which are detailed next, we refit the models to be specific to the basin upstream of the GERD using a consistent suite of datasets for the period from 1982 to 2017. Gissila et al. (2004) developed a linear regression model which predicted summertime Ethiopian rainfall as a function of western Indian Ocean sea surface temperature (SST) and tropical Pacific Ocean SST (Niño 3.4 region). The regression model developed by Korecha and Barnston (2007) relied on tropical Atlantic Ocean SSTs as well as Niño 3.4 SST. They found a positive relationship between East African rainfall and springtime cooling in the Niño 3.4 region, thus their model also captured the evolution of SSTs across the months leading up to the rainy season. The regression model created by Nicholson (2014) was based on predictors of SST gradients in the tropical and subtropical Pacific Ocean, zonal wind strength related to the Tropical Easterly Jet, and tropical Indian Ocean sea level pressure (SLP). The fourth published statistical model we used, Segele et al. (2015), calculated the mean of an ensemble of regression models with atmospheric predictors during the March preceding each rainy summer season.
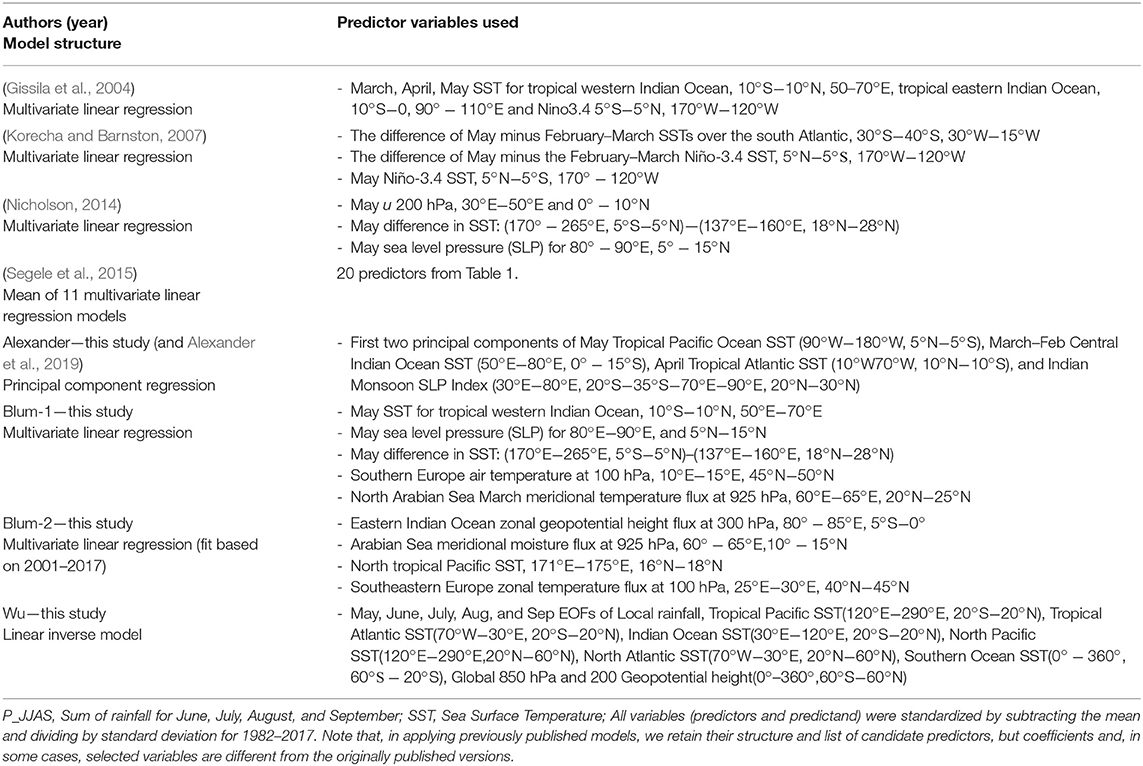
Table 1. Statistical models used in this study.
Our own statistical models (Alexander2018, Blum2018_1, Blum2018_2, and Wu2018) relied on similar predictors included in the published-models and employed a range of regression approaches. Alexander2018 relied on a principal component regression with SST and SLP predictors, retaining the first two principal components (Alexander et al., 2019). Blum2018_1 and Blum2018_2 were both simple linear regression models with differing calibration periods: Blum2018_1 was fit using the full record of data (1982–2017), whereas Blum2018_2 was fit only on the most recent years (2000–2017) because the relationship between climate predictors and rainfall in the GERD basin may have shifted. A step-wise procedure was used to select predictors from the range of predictors included in the published literature. Wu2018 adapted a Linear Inverse Model to the region which is described in Wu et al. (2018). To create “ensembles” for the statistical models which predicted a single value, we randomly selected residuals from the fitting of each regression model 100 times (with replacement) and added these to the model forecast.
To fit these statistical models, we used June–September total rainfall from the Climate Hazards InfraRed Precipitation with Stations dataset (CHIRPS; Funk et al., 2015), as the predictand. Combining high resolution (0.05°) rainfall with current satellite-derived estimates of rainfall, CHIRPS has been demonstrated to provide reliable rainfall estimates in the Ethiopian highlands (Dinku et al., 2018). We used a combination of predictors from National Centers for Environmental Prediction (NCEP) and National Center for Atmospheric Research (NCAR) reanalysis product (https://www.esrl.noaa.gov/psd/data/reanalysis/reanalysis.shtml) and North American Multi-Model Ensemble (NMME) lag-0 forecast products (Kirtman et al., 2014), referring to forecasts for May, made in May of the predictor variables (Table 1). When fitting these models, we used a cross validation approach of iteratively leaving out each year to assess out-of-sample predictive accuracy. The period 1982–2017 was used for validation as it represented the longest record with available data to inform both statistical and dynamically-based models.
Dynamically-Based Forecasts
We also obtain dynamically-based seasonal forecasts from eight models participating in the NMME (Kirtman et al., 2014) which are all based on dynamic global climate models. We selected these models as we could obtain both historical and operational forecasts. We extracted the gridded rainfall field from each NMME model for the GERD basin, summed across the basin, and then adjusted for bias on the basis of historical GERD basin rainfall estimates drawn from CHIRPS dataset using the delta change approach (Maraun, 2016). The NMME models each include between 4 and 24 ensemble members (Table 2), and each ensemble member was treated as an independent prediction. These NMME forecasts can be considered to be “operational” as they are routinely produced and publicly accessible. Historical forecasts for 2011 and 2017 were unavailable for all NMME models so our evaluation period for these models included 1982–2010 and 2012–2016.
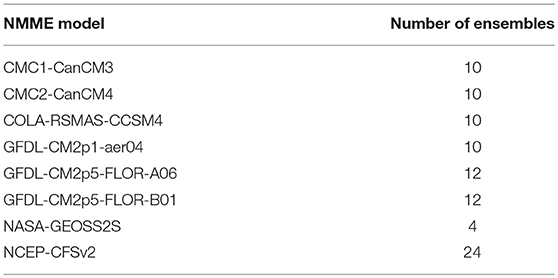
Table 2. North American Multi-Model Ensemble (NMME) Models included in this study and number of ensembles for each model; more details on model resolution and hindcast period available from Kirtman et al. (2014).
Upper Blue Nile Streamflow Forecast
To convert our rainfall forecasts to Upper Blue Nile streamflow forecasts, we applied the water balance model “WatBal” (Yates, 1996; Zhang et al., 2015) which converts monthly rainfall, monthly mean temperature, and diurnal temperature range averages into monthly streamflow. As the original WatBal model has been shown to replicate well the historical streamflow at the Upper Blue Nile Basin (Yates and Strzepek, 2002; Zhang et al., 2015), we retain the published model parameters which can be found in Yates (1996). We used Climate Research Unit data (CRU; Version 3.20, 1901–2014) for monthly mean temperature and diurnal temperature range averages (Harris et al., 2014). To calibrate the hydrological model, we used both CenTrends and CHIRPS rainfall data because CenTrends is available for a longer period of record (1900–2014) and is nearly identical to CHIRPS across the overlapping period (1982–2014). After adjusting the CenTrends rainfall data using a regression to match CHIRPs, we calibrated the water balance model against streamflow observations at the El Diem site for 1965–2009. The El Diem river gauge is located at the Sudan/Ethiopia border, adjacent to the GERD site (Figure 1). The monthly time series between the predictions and historical record show a correlation of 0.96 (p < 0.0001). Annually, we find that predicted streamflow is about 4% higher than the observed streamflow, with overestimation generally occurring during January–August and underestimation later in the year (Figure 2). To estimate the streamflow forecasts in June–December 2018, we disaggregated the June–September (JJAS) rainfall forecasts to a monthly scale, applied WatBal to generate monthly forecasts of streamflow for those months, and used climatological monthly rainfall for October–December of 2018. We made predictions of streamflow through December 2018 because October–December months also include relatively high streamflow, due to the lagged relationship with rainfall.
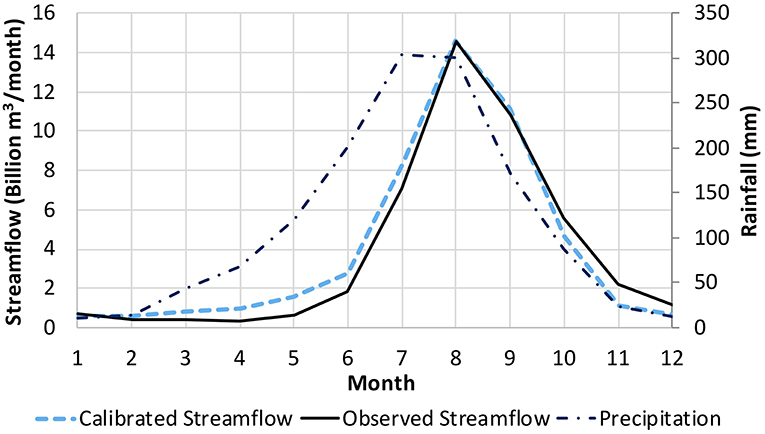
Figure 2. Calibrated streamflow from WatBal, monthly average streamflow (1965–2009) based on observations at El Diem site close to construction of the GERD, and climatological monthly average rainfall for the GERD catchment area (CenTrends data). Months are numbered starting in January (month 1) to December (month 12) and streamflows are in billions of cubic meters per month.
Communication of Consensus Forecast in an Online Blog
As our aim was to inform the regional conversation about filling of the GERD reservoir, we wanted to provide the seasonal forecast in a timely manner. We thus decided that a blog would be the best way to quickly make our forecast widely available to anyone who might be interested. As our target audience was rather small and specific—experts involved in water resource analysis and decision making in East Africa—we chose to distribute the post through the Climate Hazards Center blog (http://blog.chg.ucsb.edu/), which frequently releases climate and food and water security analyses for East Africa and is associated with the Famine Early Warning System (FEWS) Network.
Following background on the area of study, the blog shows a series of comparative figures illustrate the probabilistic forecast for 2018. Accompanying text provides a high-level summary of methods used to develop the rainfall and streamflow forecasts and highlights the categorical predictions for the coming rainy season. The explanation of methods and results in the blog may have been more technical than a general public audience would desire; however, this information was included for its potential value to aid understanding by water managers and other decision-makers in the region with relevant expertise. Our hope was that the overview figures and summary text were accessible to most blog visitors and provided a sense of the likely conditions for the upcoming season.
Evaluation of Model Performance, Forecast, and Blog Communication
To evaluate and compare model performance, we generated hindcasts of June–September rainfall for 1982–2017. For each model, we estimated anomaly correlation coefficient (ACC) as a measure of linear relationships between predictions and observations, root mean square error (RMSE) of anomalies to quantify errors in variance and bias, Hit Score estimating the fraction of predictions that fell into the correct category over the period of analysis, and a Hit Score for Extremes, the hit rate for only top and bottom tercile events (Wilks, 2006). For the statistical models, all scores are for cross-validation out-of-sample predictions in which each year was predicted by a model was fit excluding that year to be a fair comparison to a future forecast.
At the end of the rainy season, we conducted both quantitative and qualitative assessments to evaluate our forecast as well as our communication through the blog. For our quantitative evaluation of the rainfall forecast, we compared the percent bias of each of our 16 forecasts to the observed rainfall in the Upper Blue Nile during the summer of 2018. We also compared the overall performance of statistical verses NMME forecasts. While we used historical streamflow data to calibrate our streamflow model, we did not have access to observed 2018 streamflow data so focus our evaluation on the rainfall forecasts.
Given our aim of informing discussions regarding the GERD reservoir filling, we also solicited feedback from thirteen regional decision-makers and experts with an online questionnaire. The questionnaire focused on aspects of the forecast presented on the blog which they found to be most useful or interesting, areas for improvement, and suggestions for improving dissemination of future blog forecasts. These questionnaires also included some background questions related to how often the respondents used seasonal forecasts and where they had obtained the forecasts they used.
Results: Forecast and Evaluation
Hindcast and Evaluation of Forecast Models
Model hindcasts indicate that the statistical approaches had moderate skill due to some unexplained variance, but also that skillful predictions could be obtained using a number of different model structures and predictor sets (Table 3 and Figure 3). The NMME models varied more widely in their performance, consistent with previous work on ensembles of dynamically-based prediction systems (Shukla et al., 2016). The average across the NMME ensemble did provide a respectable performance comparable to many statistical approaches. Some NMME models initially had large biases, however we corrected for this bias (as described in the section on Dynamically-Based Forecasts) which does not affect the application of the models to study anomalies.
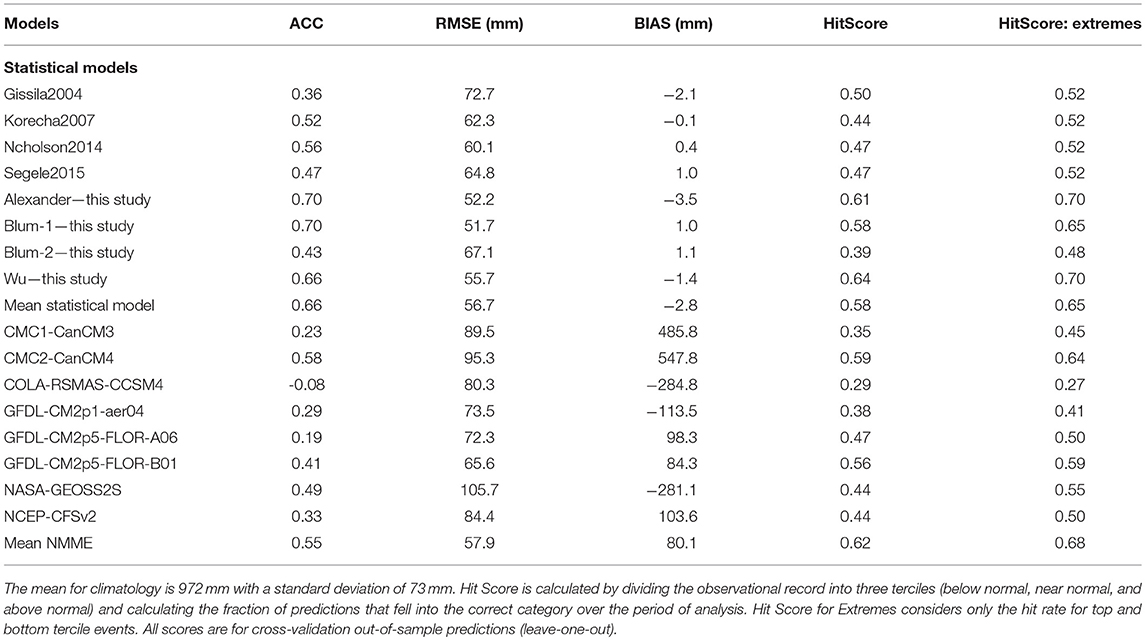
Table 3. Evaluation of statistical and dynamically-based rainfall hindcasts for the period 1982–2017 (for NMME models only 1982–2010 and 2012–2016 were available for all models).
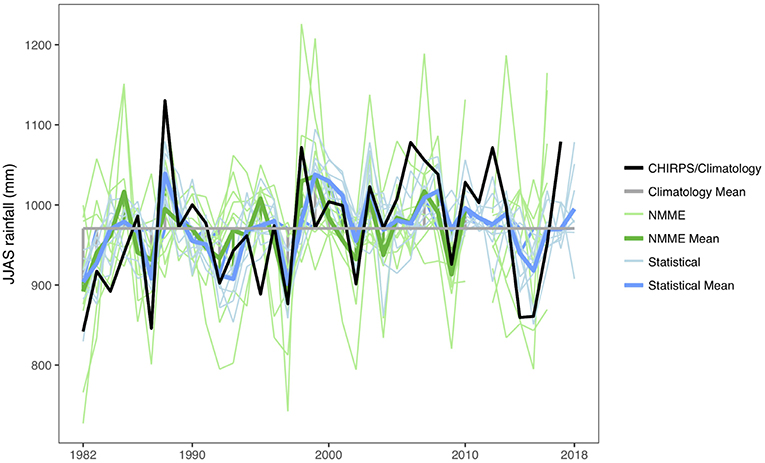
Figure 3. 1982–2017 hindcasts for June–September Upper Blue Nile GERD basin rainfall. Light blue lines are statistical models, with the darker blue line showing the ensemble average of statistical models applied in this project. Green lines are NMME forecasts initialized in May of each year—each light green line is the ensemble average of a single model and the dark green line is the full NMME ensemble average for all models that had complete data records (other than 2011 and 2017 which were unavailable for all models). The black line shows the CHIRPS total June–September rainfall in each year and the gray horizontal line shows the average across the record.
Forecast for 2018
On May 18, 2018, we released our forecast with the headline “Average to above average Blue Nile Streamflow expected in 2018” (http://blog.chg.ucsb.edu/?p=364). The main message of the blog was that our multi-method seasonal forecast ensemble showed a strong likelihood of a normal or wet year for the Upper Blue Nile in 2018. Predictions of a relatively wet summer were informed by being in the waning months of a La Niña event, and our forecast was consistent with regional seasonal outlooks issued by independent modeling centers such as Columbia University's International Research Institute for Climate and Society (IRI, 2018).
All except for one of our 16 models predicted near- or above-normal conditions for 2018 (Figure 4). While summarizing the range of forecasts in an easily interpretable figure, Figure 4 has limitations as this simple figure does not include uncertainty associated with individual models. It is thus important to look also to the boxplots shown in Figure 5, which give a better sense of the uncertainty associated with individual predictions. Each boxplot for the NMME models depicts the range of forecast ensemble spread and, for the statistical models, predictions including a resampling of model residuals. Figure 5 illustrates that while both statistical and dynamical models suggested a strong likelihood of average to above average rainfall in the GERD basin in 2018, these models did so with varying degrees of uncertainty.
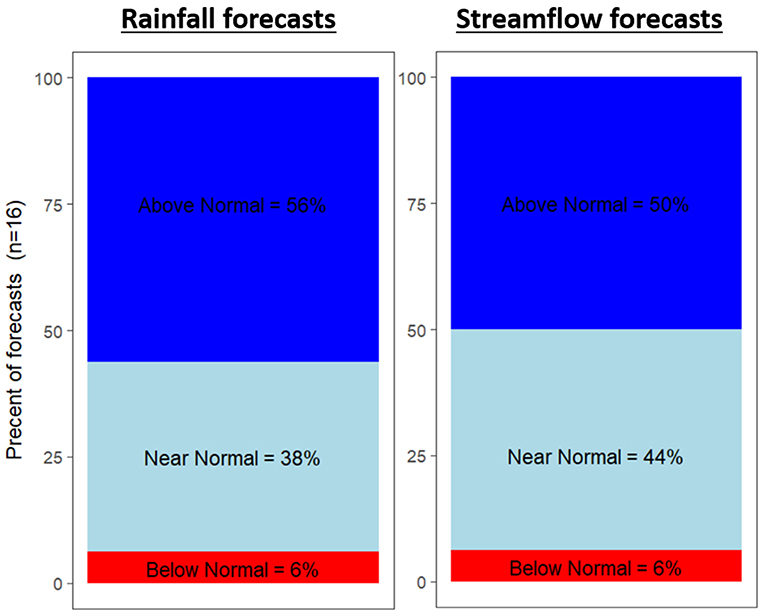
Figure 4. Percentage of forecasts in this study predicting below normal, near normal, and above normal June–September rainfall (Left) and June-December streamflow at the GERD site (Right) for 2018, including eight NMME models (ensemble mean for each model) and eight statistical models. NMME forecasts are adjusted for mean biases. No variance adjustment was applied to any of the model forecasts.
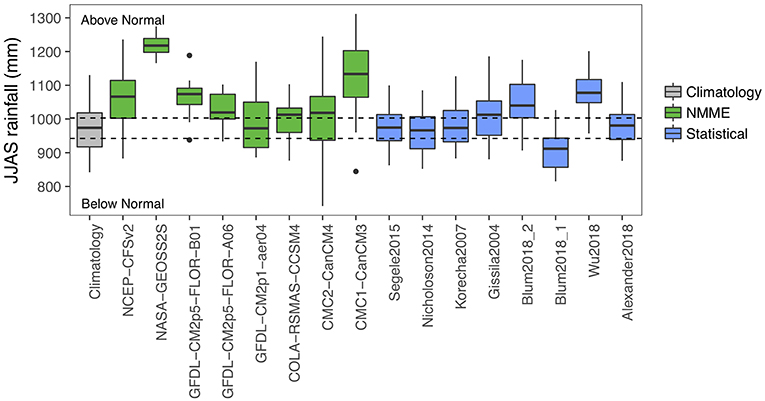
Figure 5. Boxplots (representing the 25th−75th percentiles and with whiskers extending to 1.5 times this interquartile range) of rainfall forecasts by model, illustrating NMME ensemble spread and statistical models prediction with 100 randomly-selected residuals. Dashed lines show below/above normal conditions. Statistical boxes represent range of 2018 forecast plus 100 resampled errors (from 1982 to 2017 leave-one-out predictions).
Across the statistical approaches, there were model forecasts falling within all three terciles, which were defined based on climatology for 1982–2017. In contrast, the majority of the forecasts for the dynamically-based NMME models fell within the top tercile. Variability in forecasts across different NMME models reflects both differences in rainfall variability between models as well as in differences in the 2018 forecast relative to each model's historical record. Additionally, ensemble spread within a given NMME model is also substantial, with a few ensemble members of several models forecasting below average rainfall.
Evaluation of Forecast
Observed rainfall (from CHIRPS) for the GERD basin in June–September 2018 was near-normal at 963 mm (Figure 6A), very slightly below the long term mean of 971 mm, and corresponding to estimated streamflow of just over 41 billion m3/month (Figure 6B). Near-normal categories are often the most difficult for prediction models given minimal signals from dominant large-scale climate phenomena. Over half of the statistical models accurately predicted this “near normal” category for streamflow, though only a quarter of the NNME models did so. Two statistical models, Nicolson2014 and Alexander2018, provided a forecast that was closer to the 2018 rainfall observation than the long term average (1982–2017). Looking at percent bias (Figure 7), we again see that the statistical models showed the lowest bias overall, though a few NMME models also showed relatively low bias. Also, we find that 15 of the 16 models had a positive bias reflecting overprediction by most models compared to observed conditions.
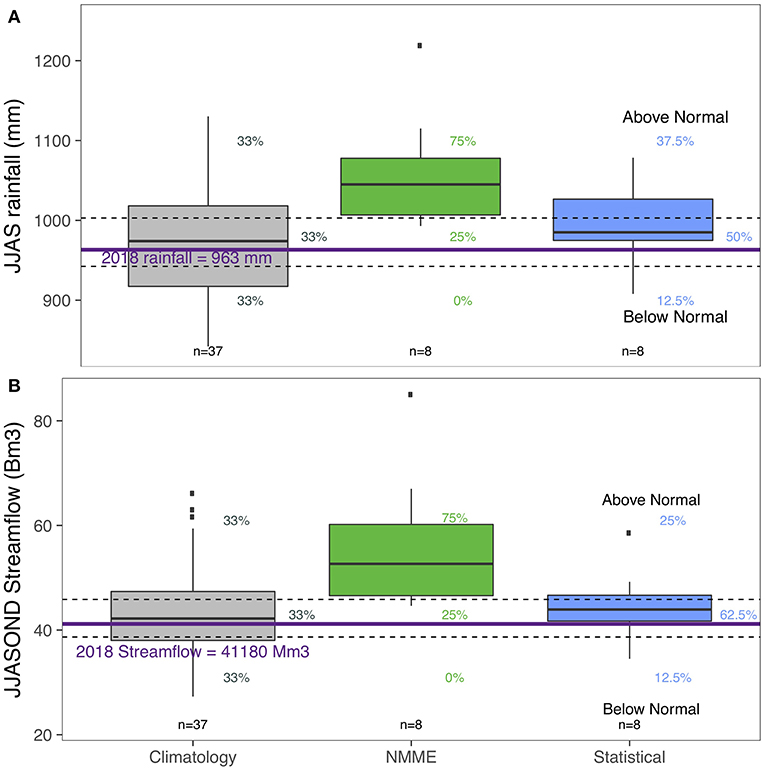
Figure 6. (A) Boxplots of June-September historical rainfall, 1982–2017, according to CHIRPS rainfall estimates (gray), and of the 2018 forecasts for dynamically-based models participating in the North American Multimodel Ensemble (NMME; green) and for statistically-based models applied in this study (blue). Dashed lines show the upper and lower terciles of historical rainfall totals and percentages indicate the percent of each streamflow within each tercile, corresponding to the closest box and with matching color. (B) As in (A), but for the June–December 2018 calibrated and forecast Upper Blue Nile streamflow at the GERD site.
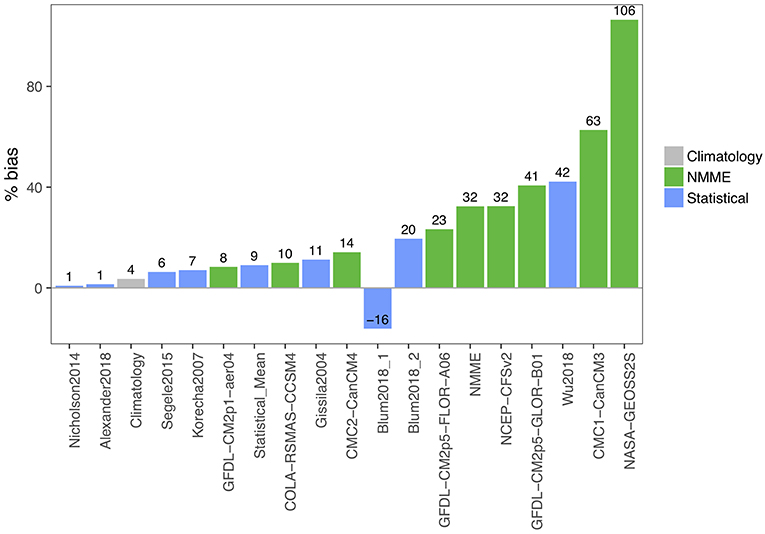
Figure 7. Percent bias of each 2018 GERD inflow streamflow forecast relative to 2018 estimated streamflow of 41,180 million m3/month (based on observed CHIRPS rainfall). Numbers at the top of the bars give the % bias associated with each forecast. The bar labeled NMME refers to the mean of all NMME predictions and the bar labeled Statistical_Mean refers to the mean of all of the statistical models.
Half-way through the summer, we released an update to the blog (http://blog.chg.ucsb.edu/?p=419). At this point, El Niño conditions were beginning to emerge and, as a result, July NMME forecasts were generally lower compared to their corresponding May forecasts (Figure 8). About half of these July NMME forecasts were relatively accurate, however, the other half were less accurate compared to the May forecasts.
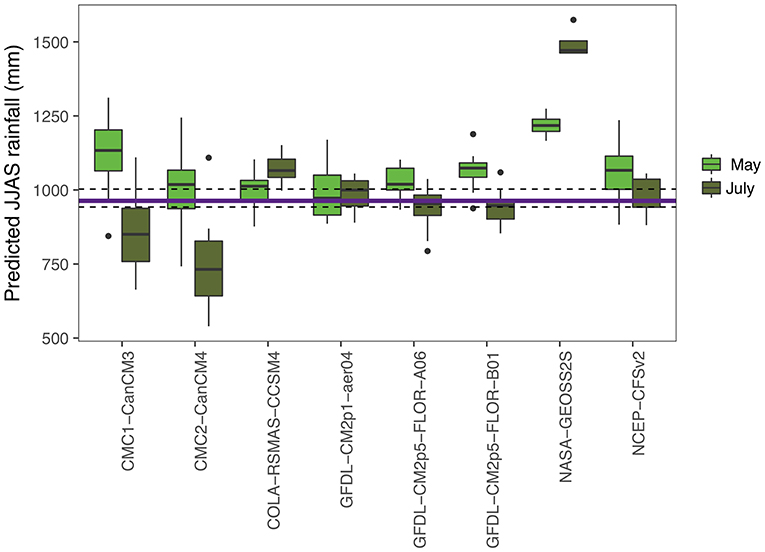
Figure 8. Comparison of GERD basin June–September 2018 rainfall forecasts forecasted in May 2018 (also plotted in Figure 5) and in July 2018. The horizontal purple line indicates CHIRPS estimate of total rainfall 963 mm.
Regional Reception of the Blog
Visits to our blog peaked in May 2018, following publication of the blog on May 23, 2018, with a total of 345 visitors during that month. The blog was re-published on a number of other websites, including the blog of a former US ambassador to Ethiopia (Immediate Outlook for Filling Grand Ethiopian Renaissance Reservoir, 2018).
The forecast was also covered in the Ethiopia Observer, a local newspaper, in a story entitled “Study predicts strong 2018 Blue Nile Flow as Ethiopia prepares to start filling GERD reservoir” (Davison, 2018). Within the context of Ethiopia's plan to start filling the reservoir that year, the article noted that Egypt, Ethiopia, and Sudan were still discussing how to mitigate risk. The article's major take away from the blog was that “experts predict only 6% chance of low Blue Nile Flow.” Focus on this value suggests that it will be critical to report the chance of low conditions as accurately as possible and with appropriate uncertainty in future forecasts.
Five of the thirteen regional experts to whom we sent the online questionnaire responded. Overall, respondents reported that the blog contained useful information not available from other products, in particular the prediction of Upper Blue Nile streamflow. They also expressed interest in longer lead time of the forecast: the blog was released mid-May for the upcoming June-September rainfall and June-December Upper Blue Nile streamflow to the GERD site. Additionally, respondents cited several barriers to the use of such forecasts for decision-making including access to information, limitations of short lead times, and scientific understanding. Multiple respondents noted the need for greater capacity building on this topic.
Discussion
Filling the reservoir of the Grand Ethiopian Renaissance Dam (GERD) will have economic, social, and political implications for the region. As a group of scientists working outside of the region and drawing upon published forecast methods, we aimed to provide a forecast to complement and support high quality forecasts produced in the region. To make our forecast more accessible, we released it as a publicly available blog. Forecasts used by regional decision-makers often come from a national meteorological agency within a country, which can lead to real or perceived political influence on the forecast, as well as the potential for contradictory forecasts issued by different countries. Our forecast was intended as politically neutral backstop to national agency forecasts to support negotiations regarding filling of the GERD.
While the predictive power of both dynamic and statistical predictions continues to improve, uptake and use of forecasts by the intended users often remains limited (Pfaff et al., 1999; Vogel and O'Brien, 2006; Harrison et al., 2008; Gilles and Valdivia, 2009; Lemos et al., 2012). Communication literature has repeatedly suggested numerous challenges that hinder uptake, including: concerns over forecast skill, uncertainty in the forecast, and social, cultural, political, and institutional barriers to forecast use (Roncoli, 2006; Millner and Washington, 2011; Kiparsky et al., 2012). The lack of predictions at a sufficient spatial or temporal resolution, the form or format of the predictions, and poor availability/access to predictive information are further challenges (Ziervogel and Calder, 2003; Plotz et al., 2017). Our forecast thus aimed to fill this gap of providing an easily accessible, operational forecast specifically for the GERD basin that leverages the findings from published but non-operational statistical forecast approaches as well as an ensemble of forecasts from dynamic global climate models.
Recent studies have emphasized decision-makers' interest in scientifically developed forecasts as traditional forecasting methods become less reliable, increasing attention to the communication and integration of seasonal climate forecasts (Ingram et al., 2002; Plotz et al., 2017). However, it can be challenging to balance interpretability with sufficient scientific details as the amount of information needed for individuals to make a decision varies widely (Ziervogel and Calder, 2003). Additionally, effective communication of probabilistic information is a particular challenge (Millner and Washington, 2011). By combining high level overviews and figures with relevant technical information, our blog attempted to appeal to a wide range of decision-makers with interest in GERD water management.
While we had information about the number of visitors to the blog, we did not have additional data such as the location of blog visitors which would have helped us assess the blog's impact. Additionally, use of an online questionnaire to obtain feedback from regional decision-makers limited the scope of questions we could ask as well as the information we could obtain. Future evaluation of these sorts of communication tools could look to the variety of methods available to assist the dissemination of predictive climate information, including participatory methods, workshops, focus groups and semi-structured interviews (Ingram et al., 2002; Roncoli, 2006). Challenges also remain regarding dissemination of the forecast to the relevant decision-makers as well as creating a forecast that meets the scientific demands of stakeholders while remaining clear and understandable to a non-scientific audience. If some decision-makers (or the media) are only interested in one number, such as the probability of an adverse outcome, perhaps that value should be a focus for future forecasts. Yet, for decision makers who are technical experts in water management, a more detailed and comprehensive prediction may be warranted to have value in their decision-making. Finally, careful communication of uncertainty in such forecasts is critical as over or under predictions could both result in harmful consequences.
There also were some limitations and challenges in the creation of our probabilistic forecast. We included a range of forecast types, but were still limited by the 16 statistical and dynamical models that we selected. The statistical approaches were sensitive to calibration period, which can be problematic if relationships between the predictors and predictand used in published literature are not stationary (Gissila et al., 2004; Korecha and Barnston, 2007; Segele et al., 2015; Nicholson, 2017). As the ENSO teleconnection to the Upper Blue Nile basin is not fully understood, and appears it may be changing over time, this is an important area of ongoing research. The dynamically-based models suffer from uncharacterized spatial biases and the limitations of forecasting an imperfectly-understood system. Additionally, there are challenges associated with summarizing the results of both statistical and dynamical models in a single figure as the dynamical forecasts come from multiple ensemble members whereas the statistical models produced a single forecast.
Due to the filling of GERD, some have predicted that a “period of contentious diplomacy lies ahead” (Benaim and Hanna, 2018). Ethiopia's decisions regarding filling of the GERD—including both timing and speed—will depend on many factors beyond seasonal Nile River flow forecasts. Nevertheless, operationalizing published forecast models for the Upper Blue Nile River have the potential to support filling decisions by providing stakeholders with a common set of expectations for water availability. Consensus seasonal hydrological forecasts can inform those expectations annually to ease one source of regional tension during the filling of the GERD reservoir. A conflict over the GERD could reverberate across the greater East Africa—Middle East region, and potentially beyond. When filling of the GERD reservoir begins, a shared understanding of Upper Blue Nile rainfall and streamflow can support a regional conversation to mitigate risk. With climate change, managing transboundary water resources is becoming even more difficult. Non-traditional approaches to communicating scientific findings have the potential to support peaceful and effective management of these resources.
Data Availability
The datasets generated for this study are available on request to the corresponding author.
Author Contributions
BZ and PB conceived of the study. AB, SA, SS, TA, and YZ designed the methods. AB drafted the manuscript, with writing contributions from all authors. AB, SA, SW, YZ, and SS performed primary data analysis.
Funding
This work was partially supported by NSF INFEWS award BCS-1639214 and NSF PIRE award 1545874. The NMME forecasts data were downloaded from the Institute of Research Institute (IRI) data library (http://iridl.ldeo.columbia.edu/SOURCES/.Models/.NMME/). SS acknowledges support from US Geological Survey (USGS) cooperative agreement #G09AC000001 and NASA Grant NNX15AL46G.
Conflict of Interest Statement
The authors declare that the research was conducted in the absence of any commercial or financial relationships that could be construed as a potential conflict of interest.
Acknowledgments
The authors thank the CPC, IRI, and NCAR personnel in creating, updating and maintaining the NMME archive. The NMME project and data dissemination is supported by NOAA, NSF, NASA, and DOE. AB is grateful for the Glenadore & Howard L. Pim Postdoctoral Fellowship, which supported her while carrying out this work.
References
Alexander, S., Wu, S., and Block, P. (2019). Model selection based on sectoral application scale for increased value of hydroclimate-prediction information. J. Water Resour. Plan. Manag. 145, 04019006. doi: 10.1061/(ASCE)WR.1943-5452.0001044
Awulachew, S. B., Yilma, A. D., Loulseged, M., Loiskandl, W., Ayana, M., and Alamirew, T. (2007). “Water resources and irrigation development in Ethiopia.” Working Paper 123. Retrieved from: https://dlc.dlib.indiana.edu/dlc/bitstream/handle/10535/4738/WP123.pdf?sequence=1
BBC (2018, February 18). The ‘Water War' Brewing Over the New River Nile Dam. Retrieved from: https://www.bbc.com/news/world-africa-43170408
Berhane, F., Zaitchik, B., and Dezfuli, A. (2014). Subseasonal analysis of precipitation variability in the Blue Nile River Basin. J. Clim. 27, 325–344. doi: 10.1175/JCLI-D-13-00094.1
Blackmore, D., and Whittington, D. (2008). Opportunities for Cooperative Water Resources Development on the Eastern Nile: Risks and Rewards. Report to the Eastern Council of Ministers. Entebbe: World Bank.
Brossard, D., and Scheufele, D. A. (2013). Science, new media, and the public. Science 339, 40–41. doi: 10.1126/science.1232329
Chen, H., and Swain, A. (2014). The Grand Ethiopian Renaissance Dam : evaluating its sustainability standard and geopolitical significance. Energy Dev. Front. 3, 11–19.
Davison, W. (2018, May 30). Study Predicts Strong 2018 Blue Nile Flow as Ethiopia Prepares to Start Filling GERD Reservoir. Ethiopia Observer.
Dinku, T., Funk, C., Peterson, P., Maidment, R., Tadesse, T., Gadain, H., et al. (2018). Validation of the CHIRPS satellite rainfall estimates over eastern Africa. Quarterly J. Royal Meteorol. Soc. 144, 292–312. doi: 10.1002/qj.3244
Funk, C., Peterson, P., Landsfeld, M., Pedreros, D., Verdin, J., Shukla, S., et al. (2015). The climate hazards infrared precipitation with stations—a new environmental record for monitoring extremes. Sci. Data 2:150066. doi: 10.1038/sdata.2015.66
Gilles, J. L., and Valdivia, C. (2009). Local forecast communication in the altiplano. Bull. Am. Meteorol. Soc. 85–92. doi: 10.1175/2008BAMS2183.1
Gissila, T., Black, E., Grimes, D. I. F., and Slingo, J. M. (2004). Seasonal forecasting of the Ethiopian summer rains. Int. J. Climatol. 24, 1345–1358. doi: 10.1002/joc.1078
Harris, I., Jones, P. D., Osborn, T. J., and Lister, D. H. (2014). Updated high-resolution grids of monthly climatic observations - the CRU TS3.10 Dataset. Int. J. Climatol. 34, 623–642. doi: 10.1002/joc.3711
Harrison, M., Troccoli, A., Coughlan, M., and Williams, J. B. (2008). “Seasonal forecasts in decision making,” in Seasonal Climate: Forecasting and Managing Risk, eds A. Troccoli, M. Harrison, D. L. T. Anderson, and S. J. Mason (Dordrecht: Springer), 13–41. doi: 10.1007/978-1-4020-6992-5_2
Immediate Outlook for Filling Grand Ethiopian Renaissance Reservoir (2018). Available online at: http://davidshinn.blogspot.com/2018/05/immediate-outlook-for-filling-grand.html (retrieved December 29, 2018).
Ingram, K. T., Roncoli, M. C., and Kirshen, P. H. (2002). Opportunities and constraints for farmers of west Africa to use seasonal precipitation forecasts with Burkina Faso as a case study. Agric. Syst. 74, 331–349. doi: 10.1016/S0308-521X(02)00044-6
IRI (2018) Seasonal Climate Forecast. Retrieved from: https://iri.columbia.edu/our-expertise/climate/forecasts/seasonal-climate-forecasts/
King, A., and Block, P. (2014). An assessment of reservoir filling policies for the Grand Ethiopian Renaissance Dam. J. Water Clim. Chang. 5:233. doi: 10.2166/wcc.2014.043
Kiparsky, M., Milman, A., and Vicuna, S. (2012). Climate and water: knowledge of impacts to action on adaptation. Annu. Rev. Environ. Resour. 37, 163–194. doi: 10.1146/annurev-environ-050311-093931
Kirtman, B. P., Min, D., Infanti, J. M., Kinter, J. L., Paolino, D. A., Zhang, Q., et al. (2014). The North American multimodel ensemble: phase-1 seasonal-to-interannual prediction; phase-2 toward developing intraseasonal prediction. Bull. Am. Meteorol. Soc. 95, 585–601. doi: 10.1175/BAMS-D-12-00050.1
Korecha, D., and Barnston, A. G. (2007). Predictability of June–September Rainfall in Ethiopia. Mon. Weather Rev. 135, 628–650. doi: 10.1175/MWR3304.1
Lemos, M. C., Kirchhoff, C. J., and Ramprasad, V. (2012). Narrowing the climate information usability gap. Nat. Clim. Chang. 2, 789–794. doi: 10.1038/nclimate1614
Luzón, M. J. (2013). Public communication of science in blogs: recontextualizing scientific discourse for a diversified audience. Writ. Commun. 30, 428–457. doi: 10.1177/0741088313493610
Maraun, D. (2016). Bias correcting climate change simulations - a critical review. Curr. Clim. Chang. Rep. 2, 211–220. doi: 10.1007/s40641-016-0050-x
Millner, A., and Washington, R. (2011). What determines perceived value of seasonal climate forecasts? A theoretical analysis. Glob. Environ. Chang. 21, 209–218. doi: 10.1016/j.gloenvcha.2010.08.001
Mulat, A. G., and Moges, S. A. (2014). Assessment of the impact of the Grand Ethiopian Renaissance Dam on the performance of the High Aswan Dam. J. Water Resour. Prot. 6, 583–598. doi: 10.4236/jwarp.2014.66057
Nicholson, S. E. (2014). The predictability of rainfall over the Greater Horn of Africa. Part I: prediction of seasonal rainfall. J. Hydrometeorol. 15, 1011–1027. doi: 10.1175/JHM-D-13-062.1
Nicholson, S. E. (2017). Climate and climatic variability of rainfall over Eastern Africa. Rev. Geophys. 55, 590–635. doi: 10.1002/2016RG000544
Pfaff, A., Broad, K., and Glantz, M. (1999). Who benefits from climate forecasts? Nature 397, 645–646. doi: 10.1038/17676
Plotz, R. D., Chambers, L. E., and Finn, C. K. (2017). The best of both worlds: a decision-making framework for combining traditional and contemporary forecast systems. J. Appl. Meteorol. Climatol. 2377–2392 doi: 10.1175/JAMC-D-17-0012.1
Roncoli, C. (2006). Ethnographic and participatory approaches to research on farmers' responses to climate predictions. Clim. Res. 33, 81–99. doi: 10.3354/cr033081
SaliniImpregilo (2014). Grand Ethiopian Renaissance Dam Project. Retrieved from: https://www.salini-impregilo.com/en/projects/in-progress/dams-hydroelectric-plants-hydraulic-works/grand-ethiopian-renaissance-dam-project.html
Satti, S., Zaitchik, B., and Siddiqui, S. (2015). The question of Sudan: a hydro-economic optimization model for the Sudanese Blue Nile. Hydrol. Earth Syst. Sci. 19, 2275–2293. doi: 10.5194/hess-19-2275-2015
Segele, Z. T., Richman, M. B., Leslie, L. M., and Lamb, P. J. (2015). Seasonal-to-interannual variability of ethiopia/horn of Africa monsoon. Part II: Statistical multimodel ensemble rainfall predictions. J. Clim. 28, 3511–3536. doi: 10.1175/JCLI-D-14-00476.1
Shanahan, M. C. (2011). Science blogs as boundary layers: creating and understanding new writer and reader interactions through science blogging. Journalism 12, 903–919. doi: 10.1177/1464884911412844
Shukla, S., Roberts, J., Hoell, A., Funk, C. C., Robertson, F., and Kirtman, B. (2016). Assessing North American multimodel ensemble (NMME) seasonal forecast skill to assist in the early warning of anomalous hydrometeorological events over East Africa. Clim. Dyn. 1–17. doi: 10.1007/s00382-016-3296-z
Tawfik, R. (2016). The Grand Ethiopian Renaissance Dam: a benefit-sharing project in the Eastern Nile? Water Int. 41, 1–19. doi: 10.1080/02508060.2016.1170397
The New Times (2018 September 26). Ethiopia, Egypt, Sudan commence tripartite ministerial meeting over disputed dam. New Times.
Vogel, C., and O'Brien, K. (2006). Who can eat information? Examining the effectiveness of seasonal climate forecasts and regional climate-risk management strategies. Clim. Res. 33, 111–122. doi: 10.3354/cr033111
Wheeler, K. G., Basheer, M., Mekonnen, Z. T., Eltoum, S. O., Mersha, A., Abdo, G. M., et al. (2016). Cooperative filling approaches for the Grand Ethiopian Renaissance Dam. Water Int. 41, 611–634. doi: 10.1080/02508060.2016.1177698
Wu, S., Notaro, M., Vavrus, S., Mortensen, E., Montgomery, R., Piérola, J., et al. (2018). Efficacy of tendency and linear inverse models to predict southern Peru's rainy season precipitation. Int. J. Climatol. 38, 2590–2604. doi: 10.1002/joc.5442
Yates, D. N. (1996). WatBal: an integrated water balance model for climate impact assessment of river basin runoff. Int. J. Water Resour. Dev. 12, 121–140. doi: 10.1080/07900629650041902
Yates, D. N., and Strzepek, K. M. (2002). Modeling the Nile Basin under climatic change. J. Hydrol. Eng. 3, 98–108. doi: 10.1061/(ASCE)1084-0699(1998)3:2(98)
Zhang, Y., Block, P., Hammond, M. J., and King, A. (2015). Ethiopia's Grand Renaissance Dam: implications for downstream riparian countries introduction and background. J. Water Resour. Plann. Manage. 141:05015002. doi: 10.1061/(ASCE)WR.1943-5452.0000520
Zhang, Y., Erkyihum, S. T., and Block, P. (2016). Filling the GERD: evaluating hydroclimatic variability and impoundment strategies for Blue Nile riparian countries. Water Int. 41, 593–610. doi: 10.1080/02508060.2016.1178467
Zhang, Y., Moges, S., and Block, P. (2018). Does objective cluster analysis serve as a useful precursor to seasonal precipitation prediction at local scale? Application to western Ethiopia. Hydrol. Earth Syst. Sci. 22, 143–157. doi: 10.5194/hess-22-143-2018
Keywords: seasonal forecasting, blog, Grand Ethiopian Renaissance Dam, science communication, hydropower, Horn of Africa, East Africa, probabilistic forecast
Citation: Blum AG, Zaitchik B, Alexander S, Wu S, Zhang Y, Shukla S, Alemneh T and Block P (2019) A Grand Prediction: Communicating and Evaluating 2018 Summertime Upper Blue Nile Rainfall and Streamflow Forecasts in Preparation for Ethiopia's New Dam. Front. Water 1:3. doi: 10.3389/frwa.2019.00003
Received: 29 March 2019; Accepted: 14 June 2019;
Published: 02 July 2019.
Edited by:
Roman Seidl, Oeko Institut, GermanyReviewed by:
Letícia Santos De Lima, Federal University of Minas Gerais, BrazilSeifu Admassu Tilahun, Bahir Dar University, Ethiopia
Copyright © 2019 Blum, Zaitchik, Alexander, Wu, Zhang, Shukla, Alemneh and Block. This is an open-access article distributed under the terms of the Creative Commons Attribution License (CC BY). The use, distribution or reproduction in other forums is permitted, provided the original author(s) and the copyright owner(s) are credited and that the original publication in this journal is cited, in accordance with accepted academic practice. No use, distribution or reproduction is permitted which does not comply with these terms.
*Correspondence: Annalise G. Blum, YW5uYWxpc2VAamh1LmVkdQ==