 James Fluke
 Ricardo González-Pinzón
 Bruce Thomson
- Department of Civil, Construction & Environmental Engineering, University of New Mexico, Albuquerque, NM, United States
High concentrations of fecal indicator bacteria (FIB) can result in exceedance of surface water quality standards, particularly in urban areas which receive stormwater runoff. Although FIB are considered to be an indicator of mammalian waste, there is increasing evidence of regrowth in sediments of warm streams. However, the role that sediment-water interactions play on the spatiotemporal distribution of FIB is not well-understood, particularly on scales relevant to water quality management. We examined E. coli loads in river water and concentrations in sediments in a 60 km reach of the Rio Grande near Albuquerque, USA to determine seasonal and spatial trends of the coupling between FIB in the water column and those in sediments. Our study reach progresses from a narrow, coarse-bottom channel (0–9.4 km) with insignificant anthropogenic FIB sources to a wide, sand-braided channel with prevalent mid-channel bars and islands (25–61.5 km) that flows through a city with 1 million inhabitants. At upstream sites, we observed low E. coli loads during low discharges and low sediment E. coli concentrations. Conversely, downstream sites had high E. coli loads and high sediment concentrations year-round. Using a simple framework to quantify sediment-water interactions and E. coli transferability, we found that the fine riverbed sediments present at downstream sites served as a source of E. coli to the overlying water and that they promoted the survival of E. coli along this subreach, contributing to frequent violations of the stream standard. Therefore, we propose that sediment-water interactions should be explicitly considered in water quality management, protection, and improvement efforts.
Introduction
Surface water impairment due to fecal contamination is a worldwide concern. In the US, evidence of pathogens accounts for the greatest number of impaired miles of rivers and streams (178,000), of which 160,000 miles are considered impaired for indicators of fecal contamination such as Escherichia coli (E. coli) and other fecal indicator bacteria (FIB) [US Environmental Protection Agency (USEPA), 2018]. This has led regulatory agencies to require implementation of watershed management programs to reduce FIB concentrations in surface waters. However, numerous efforts have shown that identifying point and non-point sources of these organisms is challenging (Nix et al., 1993; Pandey et al., 2014; Goodwin et al., 2017), particularly because natural growth and persistence of FIB in sediments may constitute a significant source of organisms (Crabill et al., 1999; Cinotto, 2005; Pachepsky and Shelton, 2011; Rothenheber and Jones, 2018). Therefore, the resulting lack of ability to reduce FIB concentrations and loads hinders the development, implementation and enforcement of strategies to prevent, mitigate and recover from episodic and/or chronic fecal contamination, and to meet water quality standards [He et al., 2007; Rowny and Stewart, 2012; New Mexico Environment Department (NMED), 2018].
Recent research in lakes and short stream reaches (<20 km) has revealed that key aspects affecting the sources, transport and fate of FIB in surface waters vary so widely that they generate conflicting relationships between FIB and common water quality parameters (Crabill et al., 1999; Cinotto, 2005), and between water and sediment FIB concentrations (Davies et al., 1995; An et al., 2002; Evanson and Ambrose, 2006). Numerous studies in freshwater lakes, marine beaches and estuaries, laboratory microcosms, and stream reaches have documented growth and survival of FIB including E. coli in surface waters and sediments (Davies et al., 1995; Desmarais et al., 2002; Boehm et al., 2009; Badgley et al., 2011; Pachepsky and Shelton, 2011), as well as natural occurrence and regrowth of FIB (Ishii et al., 2006; Vital et al., 2010), which results in high spatial and temporal variations in FIB concentrations (Pachepsky and Shelton, 2011; Harmel et al., 2016). Temporal variability in FIB levels has been attributed to variations in water mixing, sediment-water interactions, inactivation by sunlight, seasonal growth/die-off, and community redistribution (Boehm et al., 2009), while spatial variability in FIB levels has largely been attributed to natural and anthropogenic differences in geomorphologic controls and external inputs (Whitman et al., 2004; Pachepsky and Shelton, 2011; St Laurent and Mazumder, 2014; Oliver and Page, 2016).
While FIB are generally considered effective indicators of health risk from fecal contamination (Wade et al., 2006; Wiedenmann et al., 2006; US Environmental Protection Agency, Office of Water, 2012), the correlation between FIB concentrations and environmental conditions in rivers remains challenging. To date, the dynamic effects of sediment-water interactions on observed E. coli concentrations are particularly not well-understood. Simply put, we cannot predict the relative contribution of stream sediments to FIB concentrations in a stream and how local source/sink behaviors propagate down the fluvial network. The objective of this study was to investigate the seasonal and spatial variability of E. coli sediment-water transfer from upstream to downstream of a major city on a scale commensurate with human-related activities. We studied a ~60 km reach of the Rio Grande near Albuquerque, New Mexico, which is impaired due to high concentrations of E. coli. Frequent exceedances of the stream standard have occurred in this reach despite source reduction strategies focused on urban storm water management. These included development and implementation of a total maximum daily load (TMDL) criterion which has cost local governments ~20 million US dollars [New Mexico Environment Department (NMED), 2018]. High E. coli concentrations occur during both wet and dry weather conditions and at locations upstream from all anthropogenic sources. Our study reach traversed a range of urbanization levels, i.e., the watershed of the upstream reach is undeveloped and provides no human inputs of wastewater or urban stormwater runoff while the lower reach passes through an urban area inhabited by nearly 1 million people and receives treated and disinfected municipal wastewater as well as urban stormwater runoff. Therefore, this study allows investigation of spatiotemporal dynamics of FIB over a longer river reach (>20 km) than previous studies and improves our understanding of the role of human activities and natural phenomena on the dynamics of E. coli concentrations and loads in the arid Southwest USA.
Methods
Study Reach
We studied a 61.5 km reach of the Rio Grande near Albuquerque (Figure 1), which receives most of its discharge from upstream mountain snowmelt and is used for agriculture and drinking water supply for the City of Albuquerque. The study reach is 45 km downstream from a large flood control reservoir (Cochiti Lake) that removes virtually all sediment from the river and has changed the river characteristics from a wide, slow moving stream with a sand and silty channel bottom to a narrow, higher energy stream with a gravel bottom downstream of the reservoir (Mussetter Engineering, Inc., 2002; Makar et al., 2006). Our study reach thus progresses from a narrow coarse-bottom channel (0–9.4 km) to a wide, sand-braided channel with prevalent mid-channel bars and islands (25–61.5 km) (Massong et al., 2006). The watershed draining to the study reach is ~28% developed land, 4% land cultivated for crops, 49% grassland and shrubland, and 14% forest [US Geological Survey (USGS), 2018a]. Diversion structures at both ends of the study reach are used during the growing season to route river water into irrigation canals. The US Army Corps of Engineers (USACE) and Middle Rio Grande Conservancy District (MRGCD) release water from upstream reservoirs and operate diversion structures to manage river water for agricultural irrigation, municipal use, environmental flows, and delivery to downstream users. The United States Geological Survey (USGS) operates several stream gages in this reach, including gages USGS 08329918 at Alameda Bridge and USGS 08330000 at Central Bridge, which provided flow data for this study [US Geological Survey (USGS), 2018a,b]. The US Bureau of Reclamation (USBR) operates several in-situ water quality monitoring stations in this reach, which also provided data for this study [US Bureau of Reclamation (USBR), 2018]. Peak flows from snowmelt occur typically in May, while short duration high flows from monsoonal precipitation events occur between July and November (Passell et al., 2004). Water quality indicators (WQI) up- and downstream of the urbanized area are shown in Table 1. Typically, discharge and DO decrease along the reach, while turbidity, water temperature, and electrical conductivity (EC) increase (Figure 2).
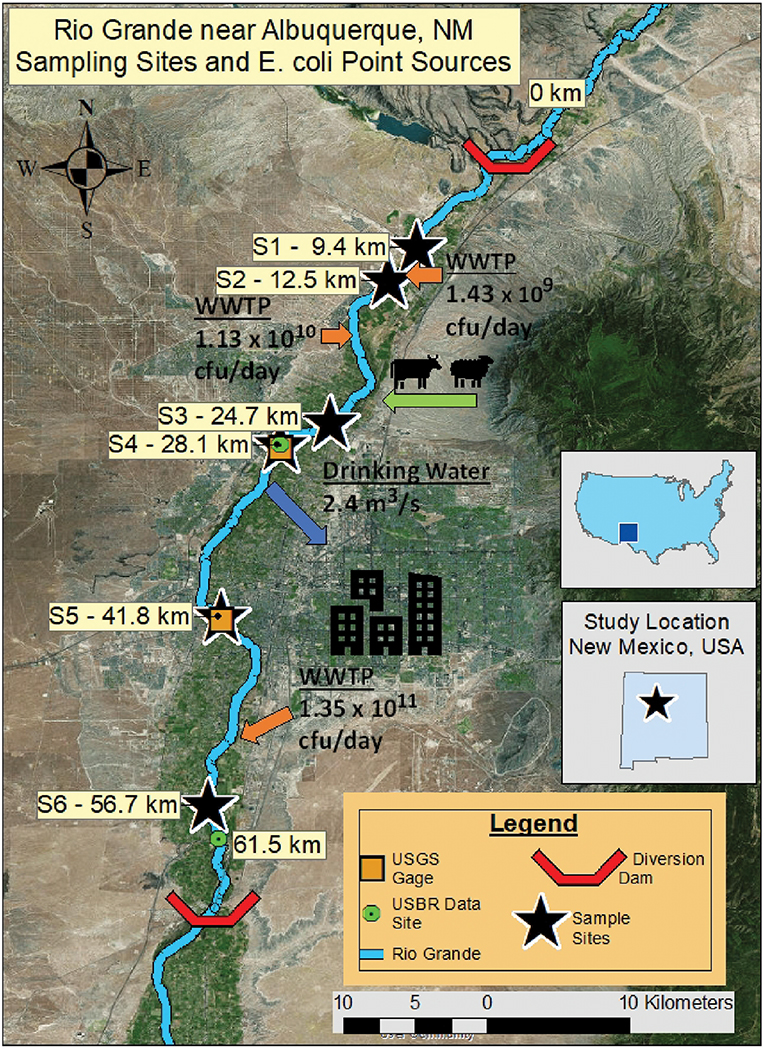
Figure 1. Study reach map showing locations of stream gages (discharges in m3/s), known E. coli sources (colony-forming units of E. coli per day; orange arrows), City of Albuquerque's water intake (blue arrow) and unquantified non-point sources (green arrow).
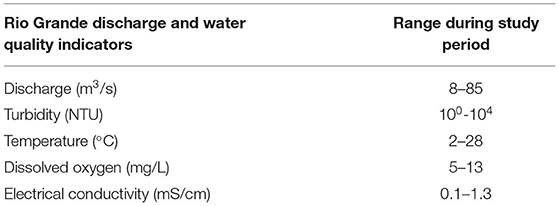
Table 1. Variability of water quality parameters along the study reach during the study period.
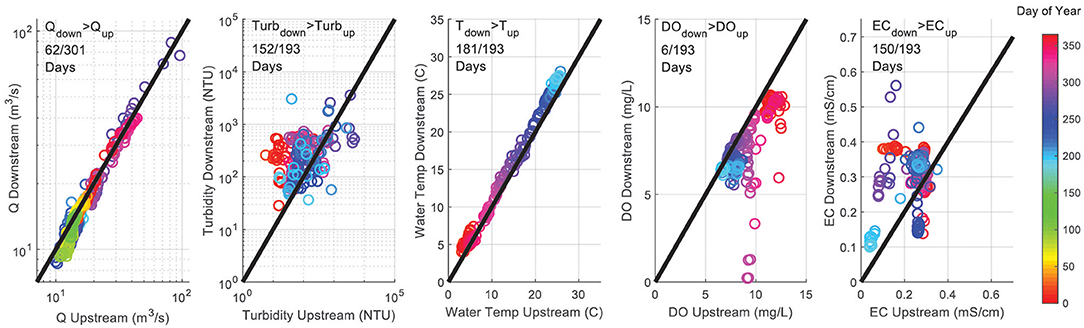
Figure 2. Flow and selected water quality parameters observed at the upstream and downstream ends of the study reach during the study period. Upstream and downstream data have been retrieved from US Bureau of Reclamation (USBR) Gages I25WQ and ALBWQ, and USGS gages 08330000 and 08329918. The upper legends indicate, e.g., that the discharge downstream was greater than the discharge upstream in 62 out of 301 days during the study period.
The designated uses for the river in the urban area are irrigation, marginal warmwater aquatic life, livestock watering, public water supply, wildlife habitat, and primary contact recreation. Based on these uses, the stream standard for E. coli is a monthly geometric mean of 126 colony-forming units (cfu)/100 mL and a single sample maximum concentration of 410 cfu/100 mL. The Isleta Pueblo, a federally recognized Native American tribe, is located immediately downstream from Albuquerque and has adopted their own federally approved water quality standards that include primary contact ceremonial use as a designated use of the river. The E. coli standard for this use is a monthly geometric mean concentration of 47 cfu/100 mL and a single maximum concentration of 88 cfu/100 mL.
Exceedances of stream standards for E. coli in the lower reach of the river have been frequent, triggering the implementation of a TMDL [New Mexico Environment Department (NMED), 2018]. The TMDL limits depend on river flow and location, ranging from an E. coli load of 2.96 × 10⁹ cfu/day for low flow conditions to 5.54 × 10¹² cfu/day for high flow conditions. The monitoring of a major stormwater channel that drains approximately one-third of urban Albuquerque has found high concentrations of E. coli in stormwater, occasionally exceeding 50,000 MPN/100 mL (Storms et al., 2015). However, stormwater flows are infrequent in this arid environment and on average only contribute ~1.4% of the total annual Rio Grande flow; therefore, urban runoff is not believed to be a major contributor to the total E. coli load to the river. Aquatic water fowl, seasonal temperature variation, stormwater runoff and tributary flows, wastewater effluents, and persistence of FIB in sand and sediments have been cited as likely causes for the elevated Summer levels and increase with downstream distance (Parson's Water and Infrastructure, Inc., 2005; CDM Smith, 2015). Finally, monitoring has shown that E. coli levels have not changed since 2001 despite an investment of ~$20 million in non-point source control programs in the Albuquerque urbanized area, and the downstream section of the reach was still considered impaired as of 2018 [New Mexico Environment Department (NMED), 2018].
Sampling Site Description
We conducted synoptic sampling campaigns every 3 weeks, over a year, to measure E. coli concentrations from river sediment and surface water grab samples. During each sampling campaign, we collected samples at each of the 6 sampling sites on the same day (Figure 1). Water quality measurements on the first sampling event were compromised, so only 16 data points are included. Sediment sample collection and analyses were successful for all 17 sampling events.
The sampling sites were selected to capture the effects of major features of the system including urbanized areas, wastewater treatment plant (WWTP) discharges, and large stormwater outfalls. Site#1 (US550) is upstream of any WWTP effluents and urban stormwater discharges and is considered to be unaffected by urbanization. Historically, there have been low E. coli levels between Cochiti Dam (~45 km upstream) and Site #1 [New Mexico Environment Department (NMED), 2018]; of the six small communities located in this river section, only two discharge stormwater to the Rio Grande and none discharge wastewater. Site #6 is the last section of the reach and is located downstream of the City of Albuquerque's WWTP. Table 2 summarizes point sources to the river and drinking water withdrawal between each sample site.
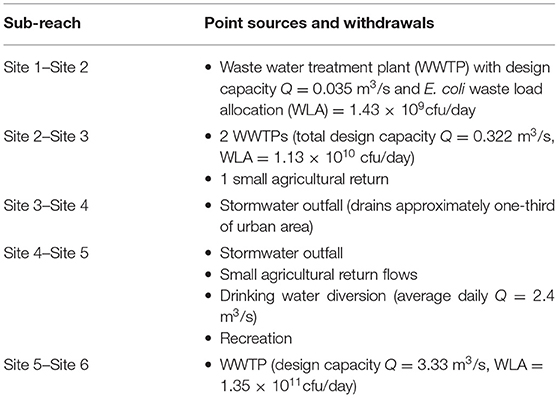
Table 2. E. coli inputs and water withdrawals along the study reach.
Sampling and Analytical Methods
At each sampling site, 2 grab samples of sediment were taken from the sediment-water interface and 1 water sample was collected from the water surface. Sediment grab samples were taken from the thalweg of the river when possible using a Ponar sediment sampler and from near a river bank with shallow depth using a stainless-steel scoop. Surface water grab samples were taken from bridges (US550, Alameda, Central) or from the river bank using pre-sealed, 100 mL coliform sampling bottles containing 0.1 g sodium thiosulfate (US Environmental Protection Agency, 2002).
Sediment samples were placed in a stainless-steel washbowl, and excess water was removed by decanting. A portion of the sediment sample without large rocks or plant matter was placed in a one-quart zip-top bag and labeled with the sample site, date and time collected. Samples were placed on ice and transported to the analytical laboratory and analyzed within 24 h of collection. Surface water samples were analyzed within 8 h of collection in accordance with EPA holding time requirements for bacteriological samples (US Environmental Protection Agency, 2002).
Sediment samples were analyzed using a variation of the Multiple Tube Fermentation (Standard Methods 9221 C-F) method by the Albuquerque Bernalillo County Water Utility Authority's analytical lab. In this method, a phosphate buffer solution was mixed with the sediment sample for 1–2 min in a blender to mix the sediment and buffer solution. The solid matter was allowed to settle, and the supernatant was analyzed for E. coli concentration. The MPN method was used to enumerate the E. coli concentration in the supernatant (LaLiberte and Grimes, 1982; Johnson et al., 1984; An et al., 2002) instead of the membrane filtration technique to avoid interference from sediments suspended in the solution (Davies et al., 1995; Crabill et al., 1999; Badgley et al., 2011; Pandey and Soupir, 2013, 2014).
The mass of dry sediment was determined by drying the sample at 110°C for 5 h and the amount of water in the sample was found as the difference between initial and final mass. The concentration of E. coli in the sediment was calculated from the concentration in the supernatant, normalized by the product of the mass of the wet sediment and the fraction of solids by mass. The concentrations of E. coli in sediment obtained through this method are reported as Most Probable Number (MPN) of colony forming units per 100 g of dry sediment (MPN/100 g). Although the units MPN and colony-forming unit (cfu) indicate measurement of the same analyte, the reported units are different because the MPN method is a probabilistic method while the membrane filtration method involves a direct colony count. These methods of measuring concentration are not statistically different on the log scale (Johnson et al., 1984) and were considered equivalent for the purposes of this study.
E. coli concentrations in surface water were determined using the Membrane Filtration Chromogenic Method (US Environmental Protection Agency, 2002). This method has estimated false-positive and false-negative rates for E. coli of 4.3%, and specificities for E. coli and total coliforms of 95.7 and 93.1%, respectively. We note that Harmel et al. (2016) present a detailed discussion of uncertainty measurement associated with E. coli concentrations in surface water. Following EPA recommendations, aliquots of 0.1, 1, and 5 mL were collected to bracket expected E. coli concentrations. Sample aliquots were diluted with DI water and vacuum-filtered through a 0.45 μm membrane filter. The membrane filters were placed on a petri dish containing the chromogenic nutrient solution and incubated for 72 h at room temperature. Blue colonies associated with E. coli organisms were enumerated automatically using a publicly available image analysis code modified to identify and count blue colonies (Image Analyst, 2015). The final E. coli concentration was reported as the average of the 2 closest concentration values for each of the 3 plates. Digital images of the colonies were automatically generated, displayed, and recorded to verify the automated count. Surface water E. coli concentrations were multiplied by flow data at the time of sample collection to calculate the E. coli loads in units of cfu/day. For this, the USGS daily flow data from July 2017 to May 2018 from the USGS Rio Grande at Alameda Bridge (USGS 08329918) was used for Sites #1–#4 and the USGS Rio Grande at Central Bridge (USGS 08330000) was used for Sites #5 and #6.
To perform statistical calculations on these datasets, results of non-detection for either type of sample were assigned values of the detection limit based on the volume of material analyzed (10 non-detects in water samples, 26 non-detects in sediment samples). A detection limit of 20 cfu/100 mL (corresponding to detection of 1 cfu per 5 mL of water sample) was used for the chromogenic method and 1 MPN/20 g for the sediment samples because ~20 g of sediment was used in the analysis. A log-10 transformation of sediment and water E. coli concentration data, and E. coli load data resulted in an approximately normal distribution (−1 < skewness < 1, magnitude of kurtosis ~3) and the sample size is relatively large (E. coli load and water concentration n = 96, E. coli concentration in sediment n = 204). Since the distributions of the datasets are approximately symmetric, well-represented by the mean, and made up of >40 points, inferences using parametric t-procedures are considered appropriate in accordance with the Central Limit Theorem (Navidi, 2010). Confidence intervals for subsets of the population were generated using Students' t-distribution. One-way Analysis of Variance (ANOVA) tests were used to determine whether mean sediment and water concentrations, and loads were statistically different when grouped by site and by season. Tukey's Honest Significant Difference (HSD) range test was used to evaluate significant differences between estimated means of individual groupings post-hoc. The Pearson Correlation test was used to assess the data for spatial trends when grouped by season. All reported values are back-transformed from logarithmic units to arithmetic units of cfu/100 mL, cfu/day, or MPN/100 g.
Results
A One-Way ANOVA test showed seasonal and longitudinal variations in E. coli river water concentrations, loads and sediment concentrations, and found differences between the groupings by site and season (ANOVA p < 0.05). The mean E. coli concentrations, loads and E. coli sediment concentration showed a decrease from Summer 2017 to Spring 2018 (Figures 3A,B), and an increase with distance downstream (Figures 3C,D).
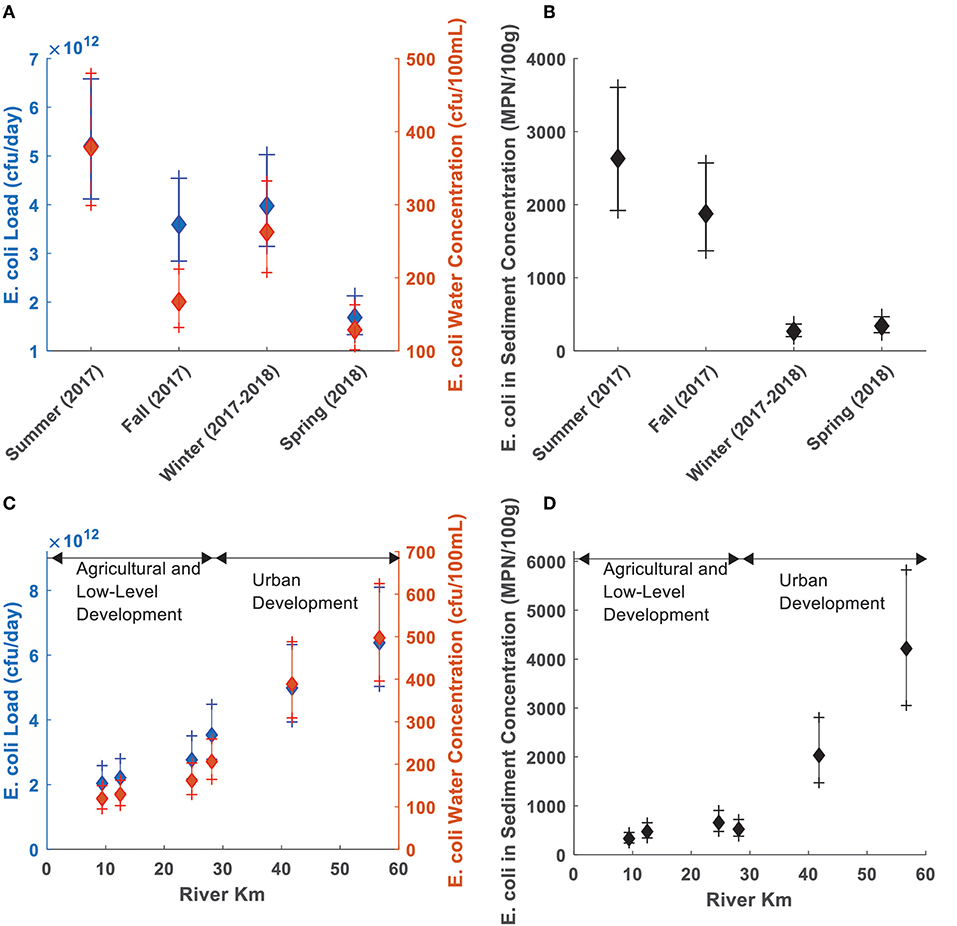
Figure 3. E. coli loads and concentrations in the study reach. Error bars show confidence intervals at 95% (CI's) for mean E. coli loads (blue), water concentrations (red), and sediment concentrations (black) by season (top) and sample site (bottom). (A) E. coli water concentration and load Cls by season. (B) E. coli sediments concentration Cls by season. (C) E. coli water concentration and load Cls by site. (D) E. coli sediments concentration Cls by site.
By season, the Summer mean water concentration and load estimates were different from those in the Spring, and the Summer and Fall mean sediment concentrations were different from Winter and Spring values (Tukey's HSD p < 0.05). The estimated mean E. coli loads and river water concentrations were different between sites along the river (ANOVA p < 0.05), and the estimated mean concentrations of E. coli in sediments at Sites #5 and #6 were different from Site #1 and Sites #1–#4, respectively (Tukey's HSD p < 0.05). E. coli water concentration data groups were different when comparing Site#1 to the Sites # 5 and #6, and comparing Site #2 to Site #6. E. coli concentrations in water concentrations and sediment, and E. coli loads were increased with downstream distance (Pearson's Correlation p < 0.05).
Figure 4 presents a more disaggregated analysis of the data by season, showing that E. coli loads, and concentrations in water and sediment during Fall, Winter, and Spring increase with downstream distance (Pearson's Correlation p < 0.05), while these levels remain nearly constant for all sites during the Summer (Pearson's Correlation p > 0.05). Figure 4 also shows that E. coli loads and sediment concentrations are coupled, and E. coli concentrations in river water appear to be correlated with those in the sediments. Since discharge varied less than an order of magnitude over the sampling period, E. coli water concentrations and loads are highly correlated (R = 0.94).
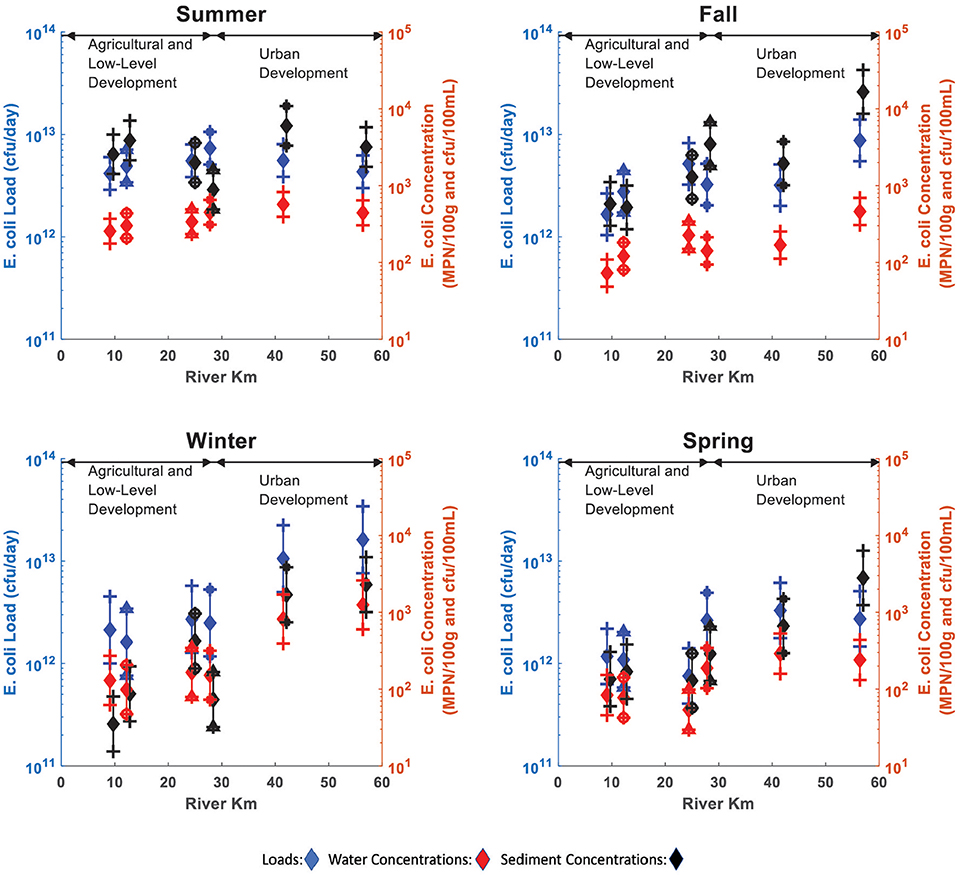
Figure 4. Mean E. coli loads (blue), water concentrations (red) and sediment concentrations (black) by sample site and season. Error bars show confidence intervals at 95% (CI's) for mean E. coli loads (blue), water concentrations (red), and sediment concentrations (black) by sample site.
To evaluate the sediment-water coupling, mean log-transformed loads and sediment concentration values for the data, grouped by season and sub-grouped by site (6 sites for 4 seasons hence n = 24) were tested for correlation. The estimated means by site and season were linearly correlated (p < 0.05) with a Pearson's correlation coefficient (R) of 0.71 (Figure 5). Similarly, E. coli water and sediment concentrations grouped by season and sub-grouped by site were linearly correlated (R = 0.67; Figure 5).
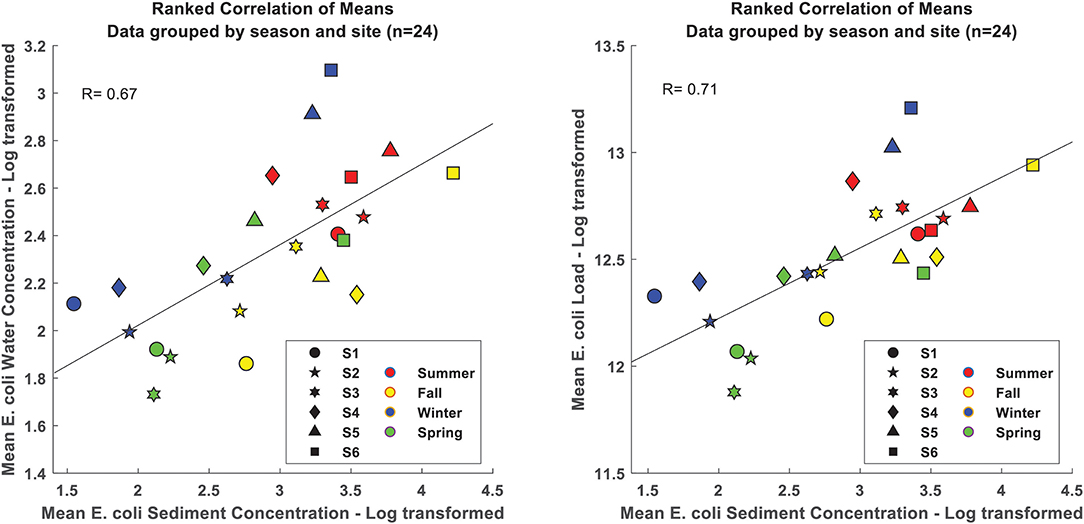
Figure 5. Correlation between mean E. coli concentrations (left), loads (right), and concentrations of E. coli in sediments by sample site and season.
Discussion
Average Seasonal and Longitudinal E. coli Behavior
The concentration of E. coli in water and sediment, and the E. coli load in the river varied seasonally and increased with downstream distance (Figures 3, 4). While the mean load from Summer months was the highest, it was not statistically higher than mean Winter or Fall loads (Tukey's HSD p > 0.05), as data from previous studies suggested (Parson's Water and Infrastructure, Inc., 2005; CDM Smith, 2015; Storms et al., 2015). Mean E. coli loads in this study reach increased approximately linearly with downstream distance (Pearson's R = 0.99; Figure 3), except during the Summer (Figure 4; see next section). A linear increase in loads along the length of the reach suggests that non-point sources dominate overall E. coli loads, instead of point sources such as WWTP effluents or illicit wastewater discharges, agricultural return flows, or stormwater flows, which would cause clear deviations from the overall trends. Contrary to our findings of increasing E. coli concentrations and loads with downstream distance, Harmel et al. (2010) found that E. coli concentrations consistently decreased as watershed scale increased from field to small watershed to river basin scale in the more humid Leon River watershed in central Texas. We propose that the differences between our findings in the Rio Grande, where the average annual precipitation is 230 mm, and those by Harmel et al. (2010) in central Texas, where the average annual precipitation is 800 mm, can be explained by differences in dilution processes. While in our study reach the Rio Grande has only a few lateral runoff inputs, most of them being urban or agricultural point-sources, the Leon River watershed has contributions from multiple non-point sources that carry lower concentrations of E. coli, effectively decreasing concentrations with increasing spatial scale.
In contrast to the linear increase of E. coli loads and concentrations in the river water across the non-urban and urban subreaches, E. coli sediment concentrations observed in the sampling sites in the urban reaches (Sites #5 and #6; Figure 3) presented means and trends that were different from the upstream, non-urban sites (Tukey's HSD p < 0.05). Possible explanations for this behavior include urban sources of E. coli (WWTP discharges, agricultural return flows, surface runoff, etc.), and increased regrowth and persistence of E. coli in riverbed sediments due to more favorable conditions. In particular, lower reaches of the river are shallower, wider and have lower velocities, which increased water temperatures, and increased turbidity levels, which may shield E. coli from photodecay (cf. Figure 2). Perhaps most importantly, the lower reaches of the river have conditions suitable for E. coli survival and regrowth, especially during warm Summer months. Mathematically, the relationship between E. coli sediment concentration vs. distance is better fit by an exponential increase (R2 = 0.99) than by a linear model (R2 = 0.85). However, the differences in land use/land cover between non-urban and urban sites suggests that urban-related sources become relevant in establishing the differences in slope between the E. coli spatial trends in sediments (i.e., one linear trendline does not fit all non-urban and urban sites), suggesting that the mathematical description of a homogeneous, first-order growth of E. coli (exponential function) in the study reach is less realistic.
Spatial E. coli Dynamics by Season
Escherichia coli concentrations in sediments were related to E. coli concentrations and loads in the river water (Figure 4). E. coli concentrations in sediments along the urban reach of the river (Sites #5 and #6) had the highest values and smallest coefficients of variation (CV) of all sites, confirming the impact of the urbanized, downstream reach on E. coli sourcing and persistence (CVs at Sites #5 and #6 are 0.21–0.29, compared to CVs at Sites #1–#4 of 0.37–0.45). However, this reach also had the warmest temperatures and bottom sediment conditions which have been shown by others to support survival and regrowth of E. coli. Literature on environmental FIB report that sandy and fine soils (characteristic of Sites #5 and #6) are more likely to contain higher FIB concentrations, possibly due to their high surface area and lower shear stresses from flowing water, compared to cobble bed channels (Crabill et al., 1999; Pachepsky and Shelton, 2011; Pandey and Soupir, 2013, 2014). The shift in morphology in the Rio Grande from a narrower, cobble-lined channel at the outlet of Cochiti Dam (~45 km upstream of Site #1), to a wider channel with silt and sand bottom sediments in the lower reach, contributes to higher water temperatures and more favorable habitat for regrowth (cf. Figure 2). Other differences in the lower reach which could contribute to elevated E. coli concentrations at Sites #5 and #6 include: (1) five small agricultural return and drainage return channels (4 return channels between Sites #4 and #6, 1 return channel between Sites #2 and #3), (2) Albuquerque WWTP effluent containing nutrients and UV deactivated FIB, (3) effects from urban and recreational use such as shedding from bathers and swimmers (Stevenson, 1953; Whitman et al., 2004) and increased E. coli sources from pets, horses and waterfowl, and (4) stormwater discharge.
Interestingly, during the Summer months E. coli sediment concentrations and E. coli loads and concentrations in the river water were nearly constant along the reach (Figure 4). This is inconsistent with a distributed non-point source of E. coli along the reach, which would result in a linear increase in loads and concentrations with distance. Besides the existence of favorable conditions for E. coli survival regrowth during the Summer, the constant E. coli concentrations and loads along the river might be due to sediment bacterial populations approaching maximum concentrations based on available nutrients and environmental conditions. Another explanation could be that high flows during the Spring snowmelt flush finer, E. coli laden sediments from depositional zones of the riverbed and floodplain, resulting in a net decrease of autochthonous E. coli levels available for redistribution and less favorable organic and fine substrate material in the system to support E. coli survival. Our data suggest that saturation levels in sediments were not reached as higher concentrations were observed in other seasons and thus the second explanation seems more plausible and is supported by unusually high flows observed in 2017, before the Summer. Further explanations of the “equalizer” effect could be (1) a dynamic balance between sources of E. coli such as regrowth and external loadings and sinks such as predation and inactivation by UV light, and (2) a dynamic equilibrium where regrowth occurs in the sediments during warm months, but E. coli are periodically flushed into the water column by transient high flows from Summer thunderstorms. During the summer monsoon season, stormwater discharge from Albuquerque contains higher E. coli concentrations than we found in surface waters (Figure 3), and is enriched in nutrients, including labile organic carbon (Storms et al., 2015; Wise et al., 2019). Changing nutrient limitation conditions, along with increased temperatures favorable to regrowth, may simultaneously increase E. coli growth and predation, and provides initial support for either of the “equalizer” mechanisms.
Implications for Assessing and Monitoring Environmental FIB
The dynamic and difficult-to-quantify nature of river FIB challenges modeling efforts aimed at relating observed concentrations and loads to their sources. We used a simple mixing model framework which compares values of water column and sediment E. coli concentrations to characterize the observed variability of sediment-water E. coli interactions. We assumed that mixing between shallow sediment E. coli and surface water E. coli approaches a dynamic equilibrium and, thus, the concentration gradient at the sediment-water interface lets us estimate the direction of E. coli transfer for different flow regimes, seasons, and locations in our study reach. We used the ratio of E. coli concentration in the river water to estimated sediment pore-water E. coli concentrations (i.e., CW/CPW) to represent the concentration gradient over the sediment-water interface. Pore-water E. coli concentrations were estimated from the E. coli concentration by dry mass of sediment, i.e., CPW = CS • β/Φ , where CPW is the E. coli concentration in the pore water of the sediments (MPN/100 mL), CS is the E. coli concentration per mass of dry sediment (MPN/100 g), β is the density of the sediment solids (assumed 2.65 g/cm3), and Φ is the ratio of pore water volume to solids volume for the saturated sediments (assumed 0.2 for sandy sediments).
When CW/CPW > 1, there is a net transfer of E. coli from the river water to the bed sediments (sediment sink); when CW/CPW < 1, the opposite occurs (sediment source) (Figure 6). This assumes that E. coli behave conservatively and that diffusion controls the transport between the water column and pore water in the bed sediments. Since E. coli in this low velocity turbid, lowland river tend to be either dispersed or attached to fine particles rather than coarser sediments and water flora, this is a reasonable assumption in a turbid stream with little decay from UV light and limited predation by other organisms. We found that CW/CPW < 1 (i.e., E. coli concentration in sediments was greater than in river water; sediment source behavior) dominated throughout the year, at all sites (Figure 6). A value of CW/CPW > 1 (i.e., sediment sink behavior) was observed only during Winter and Spring months, and at upstream sites. This pattern is consistent with the decreased Winter and Spring mean E. coli concentrations in sediments. Also, the magnitudes of CW/CPW are consistent with those previously reported in other fluvial systems, suggesting that bed sediments typically consititute a source of E. coli to river water (Davies et al., 1995; Crabill et al., 1999; Garzio-Hadzick et al., 2010; Badgley et al., 2011; Pachepsky and Shelton, 2011; Pandey and Soupir, 2013, 2014). The magnitude of the contribution of E. coli in river bed sediments to the total E. coli load in the river was not determined in this investigation as it would require an understanding of the mixing zone in the channel bottom. Nevertheless, these results suggest that elevated concentrations of E. coli during storm events are due at least in part to suspension of bed material, including E. coli, by increased flows and associated turbulence.
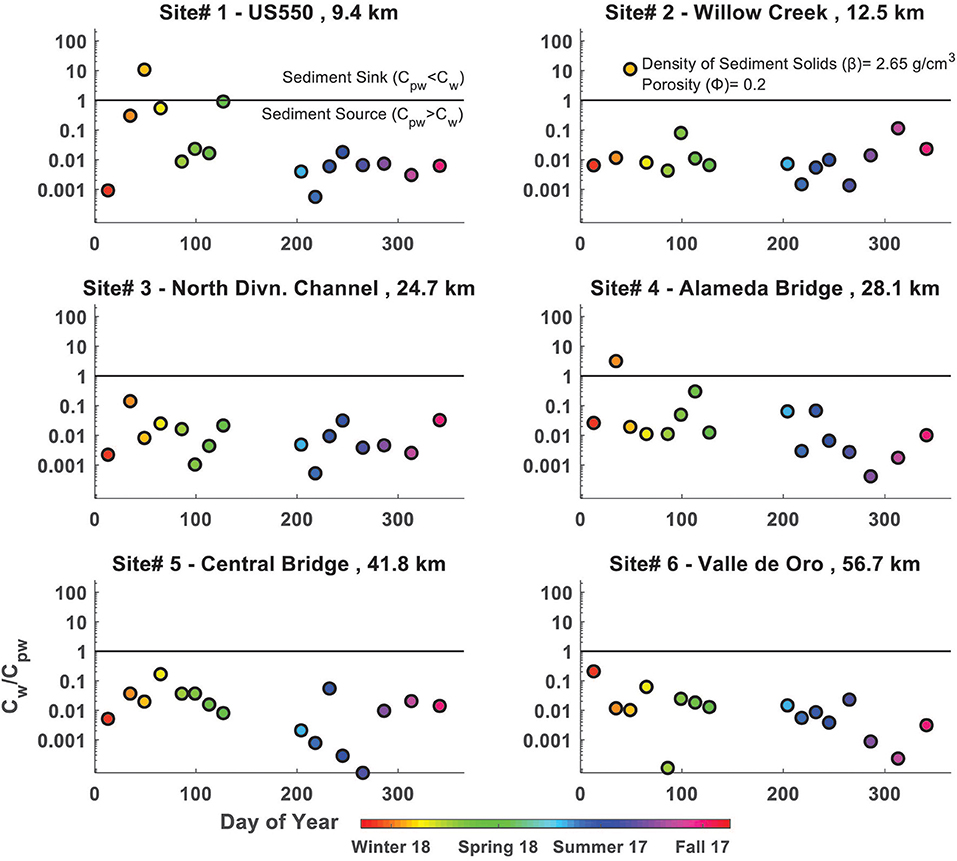
Figure 6. Ratio of E. coli concentrations in river water (CW) to riverbed pore-water concentration (CPW) vs. time, by sample site.
This analysis provides information about how E. coli concentrations in water and sediments relate across time and space. Furthermore, the ratio CW/CPW establishes a simple indicator of easily measured parameters that provides a semi-quantitative explanation of spatial and temporal elevated concentrations of E. coli in the Rio Grande; bacterial sourcing from sediments vs. fecal contamination from human and natural sources. Further application of this framework could yield information about relative contributions of different sources across time and space and make these shifting relations easier to interpret in the context of unpredictable, difficult-to-observe FIB dynamics.
Conclusions
Our results show that riverbed sediments in the Rio Grande are an important contributor of E. coli to the river (Figure 6). This source is lowest during the Winter and at upstream locations, and increases as the weather warms and with downstream distance. Agreeing with past studies, E. coli concentrations in riverbed sediments were typically 10–100 times greater than those in river water throughout the year, with occasional exceptions during the Winter at upstream sampling sites.
Escherichia coli levels showed seasonal variability along the study reach. The highest E. coli concentrations in both the river water and the sediments occurred at the downstream extent, where water temperatures and turbidity are highest, and dissolved oxygen and water velocities are lowest. This reach of the river flows through a large urban area and thus receives treated wastewater, agricultural return flows, and urban stormwater runoff that are usually considered the major source of E. coli in the river and are subsequently the target of efforts to reduce their concentration. Although available monitoring data suggest that these point sources do not control E. coli water concentrations, their co-location with favorable geomorphologic (slow warm river with a silt and sand bottom) conditions likely promote survival and regrowth of E. coli in river bed sediments. This enhanced persistence makes bed sediments a semi-continuous source of E. coli to the river water, augmenting loadings from upstream and contributing to frequent violations of the stream standard.
Our results suggest that the current TMDL for this reach will have limited effectiveness in reducing E. coli concentrations because it does not account for E. coli storage, regrowth, and persistence in river sediments. This conclusion is supported by the observation that traditional source reduction strategies implemented between 2001 and 2010 at a cost of ~$20 M has produced no observable decrease in E. coli levels [New Mexico Environment Department (NMED), 2018]. Since the contribution of natural sources of E. coli to the river is not accounted for by the current regulatory framework, more specific spatiotemporal analysis of relative contaminant levels between different sources and the regulated water body are needed for more appropriate regulatory efforts. Further investigation is thus needed to determine the contribution of sediment-derived E. coli to total loads in rivers. Specifically, information on the sediment mixing depth and resuspension of bed sediments during dry period and storm flows is needed to improve the modeling of the E. coli dynamics. Finally, the complexity of FIB source/sink dynamics and pathways in large river systems justify future investigations toward identifying dominant sources and sinks of FIB, and how their relative importance changes in time and space.
The presence of E. coli is assumed to be an indicator of contamination from human waste that might contain pathogenic organisms. Thus, a stream standard based on this organism is intended to protect human health from infectious agents that might be present in the water. However, the presence of a significant natural source of E. coli calls into question the validity of the parameter as a measure of surface water quality upon which to base an enforceable standard. This study has shown that E. coli concentrations are strongly related to elevated water temperature, slow water velocities, and the presence of thick, silty bottom sediments, all conditions that exist in the lower segments of the reach of the Rio Grande studied in this investigation. Our data show that there is a positive concentration gradient favoring transport of these bacteria from the sediment pore water to the overlying water column. At present, it is not possible to calculate the magnitude of the E. coli load that originates in the bottom sediments; that remains a topic for future research. Nevertheless, it is clear that measurement of E. coli concentrations to quantify river water quality in a slow moving seasonally warm stream is not an appropriate regulatory parameter.
Data Availability Statement
All datasets generated for this study are included in the article/supplementary material.
Author Contributions
JF and RG-P secured funding for the studies, designed and conducted the experiments, and wrote the manuscript. BT provided feedback on the interpretation of the data from the water management perspective and contributed to the manuscript.
Funding
The National Science Foundation provided support to JF, RG-P, and BT through the Center for Water and the Environment (HRD-1345169).
Conflict of Interest
The authors declare that the research was conducted in the absence of any commercial or financial relationships that could be construed as a potential conflict of interest.
Acknowledgments
The experimental design was created with input from the New Mexico Environment Department and the Albuquerque Water Utility Authority. Special thanks to Patrick Chavez for providing sampling and monitoring support. Sample collection and analysis activities were supported by small grants from the New Mexico Environment Department and American Water Work Association and managed by the Ciudad Soil and Water Conservation District.
References
Albuquerque Bernalillo County Water Utility Authority (2018). Data From: Diversion and Recharge Data. Available online at: http://www.abcwua.org/Diversion_Data.aspx (accessed September 23, 2019).
An, Y. J., Kampbell, D. H., and Peter Breidenbach, G. (2002). Escherichia coli and total coliforms in water and sediments at lake marinas. Environ. Pollut. 120, 771–778. doi: 10.1016/S0269-7491(02)00173-2
Badgley, D., Thomas, F. I., and Harwood, V. J. (2011). Quantifying environmental reservoirs of fecal indicator bacteria associated with sediment and submerged aquatic vegetation. Environ. Microbiol. 13:932. doi: 10.1111/j.1462-2920.2010.02397.x
Boehm, A. B., Ashbolt, N. J., Colford, J. M. Jr., Dunbar, L. E., Fleming, L. E., Gold, M. A., et al. (2009). A sea change ahead for recreational water quality criteria. J. Water Health 7, 9–20. doi: 10.2166/wh.2009.122
CDM Smith (2015). Data From: Final Report: Middle Rio Grande E. coli Analysis and Research. Albuquerque Metropolitan Arroyo Flood Control Authority. Available online at: https://web.archive.org/web/20161216114853/http://amafca.org/documents/2015_Annual_Report/AMAFCA%202015%20(Jan%20to%20June)%20Annual%20Report%20II.A%20-%20VI.pdf (accessed September 23, 2019).
Cinotto, P. J. (2005). Occurrence of Fecal-Indicator Bacteria and Protocols for Identification of Fecal-Contamination Sources in Selected Reaches of the West Branch Brandywine Creek. United States Geological Survey Investigations Report 2005-5039. Available online at: https://pubs.usgs.gov/sir/2005/5039/ (accessed September 23, 2019).
Crabill, C., Donald, R., Snelling, J., Foust, R., and Southam, G. (1999). The impact of sediment fecal coliform reservoirs on seasonal water quality in Oak Creek, Arizona. Water Res. 33, 2163–2171. doi: 10.1016/S0043-1354(98)00437-0
Davies, C. M., Long, J. A., Donald, M., and Ashbolt, N. J. (1995). Survival of fecal microorganisms in marine and freshwater sediments. Appl. Environ. Microbiol. 61, 1888–1896.
Desmarais, T. R., Solo-Gabriele, H. M., and Palmer, C. J. (2002). Influence of soil on fecal indicator organisms in a tidally influenced subtropical environment. Appl. Environ. Microbiol. 68, 1165–1172. doi: 10.1128/AEM.68.3.1165-1172.2002
Evanson, M., and Ambrose, R. F. (2006). Sources and growth dynamics of fecal indicator bacteria in a coastal wetland system and potential impacts to adjacent waters. Water Res. 40, 475–486. doi: 10.1016/j.watres.2005.11.027
Garzio-Hadzick, A., Shelton, D. R., Hill, R. L., Pachepsky, Y. A., Guber, A. K., and Rowland, R. (2010). Survival of Manure-Borne E. coli in streambed sediment: effects of temperature and sediment properties. Water Res. 44, 2753–2762. doi: 10.1016/j.watres.2010.02.011
Goodwin, K. D., Schriewer, A., Jirik, A., Curtis, K., and Crumpacker, A. (2017). Consideration of natural sources in a bacteria TMDL—Lines of evidence, including beach microbial source tracking. Environ. Sci. Technol. 51, 7775–7784. doi: 10.1021/acs.est.6b05886
Harmel, R., Karthikeyan, R., Gentry, T., and Srinivasan, R. (2010). Effects of agricultural management, land use, and watershed scale on E. coli concentrations in runoff and streamflow. Trans. ASABE 53:1833. doi: 10.13031/2013.35809
Harmel, R. D., Hathaway, J. M., Wagner, K. L., Wolfe, J. E., Karthikeyan, R., Francesconi, W., et al. (2016). Uncertainty in monitoring E. coli concentrations in streams and stormwater runoff. J. Hydrol. 534, 524–533. doi: 10.1016/j.jhydrol.2016.01.040
He, L. M., Lu, J., and Shi, W. (2007). Variability of fecal indicator bacteria in flowing and ponded waters in Southern California: implications for bacterial TMDL development and implementation. Water Res. 41, 3132–3140. doi: 10.1016/j.watres.2007.04.014
Image Analyst (2015). MATLAB Image Segmentation Tutorial. MATLAB. Available online at: https://www.mathworks.com/matlabcentral/fileexchange/25157-image-segmentation-tutorial (accessed September 23, 2019).
Ishii, S., Ksoll, W. B., Hicks, R. E., and Sadowsky, M. J. (2006). Presence and growth of naturalized Escherichia coli in temperate soils from lake superior watersheds. Appl. Environ. Microbiol. 72, 612–621. doi: 10.1128/AEM.72.1.612-621.2006
Johnson, J. D., Qualls, R. G., Ossoff, S. F., and Chang, J. C. H. (1984). Comparison of methods of enumerating coliforms after UV disinfection. Appl. Environ. Microbiol. 48:699.
LaLiberte, P., and Grimes, D. J. (1982). Survival of Escherichia coli in lake bottom sediment. Appl. Environ. Microbiol. 43, 623–628.
Makar, P., Massong, T., and Bauer, T. (2006). Channel Widths Changes Along the Middle Rio Grande, NM. Available online at: https://pubs.usgs.gov/misc/FISC_1947-2006/pdf/1st-7thFISCs-CD/8thFISC/Poster_Makar.pdf (accessed September 23, 2019).
Massong, T., Tashjian, P., and Makar, P. (2006). Recent Channel Incision and Floodplain Evolution Within the Moddle Rio Grande, NM. Available online at: https://www.usbr.gov/uc/albuq/envdocs/techreports/SedConf/FISC-Massongetal-2006.pdf (accessed September 23, 2019).
Mussetter Engineering, Inc. (2002). Geomorphic and Sedimentologic Investigations of the Middle Rio Grande Between Cochiti Dam and Elephant Butte Reservoir. New Mexico Interstate Stream Commission. Available online at: http://w3.spa.usace.army.mil/urgwops/eis_admin_record/Ref488.PDF (accessed September 23, 2019).
New Mexico Environment Department (NMED) (2018). Final Draft TMDL for the Middle Rio Grande Watershed. Available online at: https://www.env.nm.gov/swqb/Rio_Grande/Middle/index.html (accessed September 23, 2019).
Nix, P. G., Daykin, M. M., and Vilkas, K. L. (1993). Sediment bags as an integrator of fecal contamination in aquatic systems. Water Res. 27, 1569–1576. doi: 10.1016/0043-1354(93)90102-N
Oliver, D. M., and Page, T. (2016). Effects of seasonal meteorological variables on E. coli persistence in livestock feces and implications for environmental and human health. Sci. Rep. 6:37101. doi: 10.1038/srep37101
Pachepsky, Y., and Shelton, D. R. (2011). Escherichia coli and fecal coliforms in freshwater and estuarine sediments. Crit. Rev. Environ. Sci. Technol. 41, 1067–1110. doi: 10.1080/10643380903392718
Pandey, P., and Soupir, M. (2014). Assessing linkages between E. coli levels in streambed sediment and overlying water in an agricultural watershed in Iowa during the first heavy rain event of the season. Trans. ASABE 57, 1571–1581. doi: 10.13031/trans.57.10371
Pandey, P. K., Kass, P. K., Soupir, M. L., Biswas, S., and Singh, V. P. (2014). Contamination of water resources by pathogenic bacteria. AMB Exp. 4:51. doi: 10.1186/s13568-014-0051-x
Pandey, P. K., and Soupir, M. L. (2013). Assessing the impacts of E. coli laden streambed sediment on E. coli loads over a range of flows and sediment characteristics. J. Am. Water Res. Assoc. 49, 1261–1269. doi: 10.1111/jawr.12079
Parson's Water Infrastructure, Inc. (2005). The Middle Rio Grande Microbial Sources Tracking Assessment Report. Available online at: https://www.env.nm.gov/swqb/Rio_Grande/Middle/MST/index.html (accessed September 23, 2019).
Passell, H. D., Dahm, C. N., and Bedrick, E. J. (2004). Hydrological and geochemical trends and patterns in the Upper Rio Grande, 1975 to 1991. J. Am. Water Res. Assoc. 40, 111–127. doi: 10.1111/j.1752-1688.2004.tb01014.x
Rothenheber, D., and Jones, S. (2018). Enterococcal concentrations in a coastal ecosystem are a function of fecal source input, environmental conditions, and environmental sources. Appl. Environ. Microbiol. 84, e01038–e01018. doi: 10.1128/AEM.01038-18
Rowny, J. G., and Stewart, J. R. (2012). Characterization of nonpoint source microbial contamination in an urbanizing watershed serving as a municipal water supply. Water Res. 46, 6143–6153. doi: 10.1016/j.watres.2012.09.009
St Laurent, J., and Mazumder, A. (2014). Influence of seasonal and inter-annual hydro-meteorological variability on surface water fecal coliform concentration under varying land-use composition. Water Res. 48, 170–178. doi: 10.1016/j.watres.2013.09.031
Stevenson, A. H. (1953). Studies of bathing water quality and health. Am. J. Public Health Nations Health 43, 529–538. doi: 10.2105/AJPH.43.5_Pt_1.529
Storms, E. F., Oelsner, G. P., Locke, E. A., Stevens, M. R., and Romero, O. C. (2015). Summary of Urban Stormwater Quality in Albuquerque, New Mexico, 2003–12. U.S. Geological Survey Scientific Investigations Report 2015–5006.
US Bureau of Reclamation (USBR) (2018). Data From: Albuquerque Water Operations. Available online at: https://www.usbr.gov/uc/albuq/water/ETtoolbox/riogrande.html (accessed September 23, 2019).
US Environmental Protection Agency (2002). Method 1604: Total Coliforms and Escherichia Coli in Water by Membrane Filtration Using a Simultaneous Detection Technique (MI Medium). EPA-821-R-02-024. Available online at: https://www.epa.gov/sites/production/files/2015-08/documents/method_1604_2002.pdf (accessed September 23, 2019).
US Environmental Protection Agency (USEPA) (2018). Data From: National Summary of State Information. Available online at: https://ofmpub.epa.gov/waters10/attains_nation_cy.control#causes (accessed September 23, 2019).
US Environmental Protection Agency, Office of Water. (2012). Recreational Water Quality Criteria. Available online at: https://www.epa.gov/wqc/2012-recreational-water-quality-criteria (accessed September 23, 2019).
US Geological Survey (USGS) (2018a). Data From: National Land Cover Database 201. Available online at: https://www.mrlc.gov (accessed September 23, 2019).
US Geological Survey (USGS) (2018b). Data From: National Water Information System (NWIS). Available online at: https://waterdata.usgs.gov/nwis (accessed September 23, 2019).
Vital, M., Stucki, D., Egli, T., and Hammes, F. (2010). Evaluating the growth potential of pathogenic bacteria in water. Appl. Environ. Microbiol. 76:6477. doi: 10.1128/AEM.00794-10
Wade, T. J., Calderon, R. L., Sams, E., Beach, M., Brenner, K. P., Williams, A. H., et al. (2006). Rapidly measured indicators of recreational water quality are predictive of swimming-associated gastrointestinal illness. Environ. Health Perspect. 114, 24–28. doi: 10.1289/ehp.8273
Whitman, R. L., Nevers, M. B., Korinek, G. C., and Byappanahalli, M. N. (2004). Solar and temporal effects on Escherichia coli concentration at a lake Michigan Swimming Beach. Appl. Environ. Microbiol. 70, 4276–4285. doi: 10.1128/AEM.70.7.4276-4285.2004
Wiedenmann, A., Krüger, P., Dietz, K., López-Pila, J. M., Szewzyk, R., and Botzenhart, K. (2006). A randomized controlled trial assessing infectious disease risks from bathing in fresh recreational waters in relation to the concentration of Escherichia coli, Intestinal Enterococci, Clostridium perfringens, and somatic coliphages. Environ. Health Perspect. 114:228. doi: 10.1289/ehp.8115
Keywords: E. coli dynamics, sediment-water interactions, rivers, non-point source pollution, point source pollution, environmental regulations
Citation: Fluke J, González-Pinzón R and Thomson B (2019) Riverbed Sediments Control the Spatiotemporal Variability of E. coli in a Highly Managed, Arid River. Front. Water 1:4. doi: 10.3389/frwa.2019.00004
Received: 23 September 2019; Accepted: 04 November 2019;
Published: 20 November 2019.
Edited by:
Ilka Wallis, Flinders University, AustraliaReviewed by:
Daren Harmel, United States Department of Agriculture, United StatesConstantinos V. Chrysikopoulos, Technical University of Crete, Greece
Copyright © 2019 Fluke, González-Pinzón and Thomson. This is an open-access article distributed under the terms of the Creative Commons Attribution License (CC BY). The use, distribution or reproduction in other forums is permitted, provided the original author(s) and the copyright owner(s) are credited and that the original publication in this journal is cited, in accordance with accepted academic practice. No use, distribution or reproduction is permitted which does not comply with these terms.
*Correspondence: Ricardo González-Pinzón, Z29uemFyaWNAdW5tLmVkdQ==