 Heye R. Bogena1*
 Frank Herrmann1
 Jannis Jakobi1
 Cosimo Brogi1
 Andreas Ilias2
 Johan Alexander Huisman1
 Andreas Panagopoulos2
 Vassilios Pisinaras2
- 1Agrosphere IBG-3, Forschungszentrum Jülich GmbH, Jülich, Germany
- 2Soil and Water Resources Institute, Hellenic Agricultural Organization “DEMETER”, Thessaloniki, Greece
Common snow monitoring instruments based on hydrostatic pressure such as snow pillows are often influenced by various disturbing effects, which result in a reduced quality of the snow cover and snow water equivalent estimates. Such disturbing effects include energy transport into the snowpack, wind fields, and variations of snow properties within the snowpack (e.g., ice layers). Recently, it has been shown that Cosmic-Ray Neutron Probes (CRNP) are a promising technique to monitor snow pack development. CRNP can provide larger support and need lower maintenance compared to conventional sensors. These instruments are sensitive to the intensity of epithermal neutrons that are produced in the soil by cosmic radiation and are widely used to determine soil moisture in the upper decimeters of the ground. The application of CRNP for snow monitoring is based on the principle that snow water moderates the epithermal neutron intensity, which can be directly related to the snow water equivalent (SWE) of the snow pack. In this study, long-term CRNP measurements in the Pinios Hydrologic Observatory (PHO), Greece, were used to test different methods for converting neutron count rates to snow pack characteristics: (i) linear regression, (ii) standard N0-calibration function, (iii) a physically-based calibration approach, and (iv) thermal to epithermal neutron ratio. For this, a sonic sensor located near the CRNP was used to compare CRNP-derived snow pack dynamics with snow depth measurements. We found that the above-ground CRNP is well-suited for measurement of field scale SWE, which is in agreement with findings of other studies. The analysis of the accuracy of the four conversion methods showed that all methods were able to determine the mass of the snow pack during the snow events reasonably well. The N0-calibration function and the physically-based calibration function performed best and the thermal to epithermal neutron ratio performed worst. Furthermore, we found that SWE determination with above-ground CRNP can be affected by other influences (e.g., heavy rainfall). Nevertheless, CRNP-based SWE determination is a potential alternative to established method like snow depth-based SWE methods, as it provides SWE estimate for a much larger scales (12–18 ha).
Introduction
Snow accumulation dynamics are an important indicator of climate change development as it can be used to investigate modifications in precipitation patterns as well as the occurrence of increasingly strong snowmelt events that are caused by rising global temperatures (Kripalani and Kulkarni, 1999; Earman et al., 2006). A recent study showed that snow accumulation is dramatically decreasing over Europe (Fontrodona Bach et al., 2018), which has strong implications for the availability of freshwater (Earman et al., 2006; Akyurek et al., 2011). Unfortunately, data on snow dynamics are still rare because they are difficult to collect and generally distributed over rather inhomogeneous data bases (Kripalani and Kulkarni, 1999; Sun et al., 2004; Deems et al., 2013). Monitoring of snow water equivalent (SWE) in mountainous environments is particularly challenging because snow distribution is strongly and non-linearly related to topographic features such as slope and aspect (Pimentel et al., 2015). Therefore, more information on snow accumulation and melting is needed in climate research, especially for mountainous regions (Fontrodona Bach et al., 2018).
Various devices measuring temporal dynamics of SWE are available, all of which have their strengths and limitations (Pirazzini et al., 2018). Commonly, these devices are based on the measurement of the mass or of the pressure of the overlying snow (e.g., snow cushions and snow scales). Therefore, they are sometimes not well-suited for mountainous regions since they require a large and flat surface for installation (Kinar and Pomeroy, 2015). More sophisticated devices include sub-snow GPSs and ground-penetrating radar (GPR) (Koch et al., 2019). The first method uses two GPS antennas placed below and above the snowpack. Since the GPS signal is affected by the snow cover, the difference between the signals received by the two instruments can be used to quantify SWE. However, the strength of the GPS signal may be limited in mountainous regions depending on slope and location (Koch et al., 2019). In the case of GPR, upward-facing systems are placed below the snowpack to obtain information about snow stratigraphy (Heilig et al., 2009) and snow depth (Schmid et al., 2014). With this technique, the penetration depth strongly depends on the measurement frequency of the GPR system. Generally, high frequency instruments result in higher resolution but are also affected by higher attenuation, thus resulting in reduced depth of penetration. It has long been recognized that airborne gamma radiation surveys with low-flying airplanes can be used to determine snow water equivalent (Peck et al., 1971; Lundberg et al., 2010; Kinar and Pomeroy, 2015). However, high costs and low repeat frequencies hamper the use of airborne techniques. More recently, aboveground gamma-ray scintillators have been suggested to continuously monitor snow pack development (Choquette et al., 2013). A detailed list of instruments for measuring snow properties and their strengths and limitations can be found in Pirazzini et al. (2018).
In the past decade, the Cosmic-Ray Neutron Probe (CRNP) method has emerged as a promising method to non-invasively monitor soil moisture. This method is based on cosmic background radiation and uses the inverse relationship between hydrogen content and cosmic-ray neutron intensity near the soil surface (Zreda et al., 2012). Worldwide, ~200 stationary CRNP have been installed since the introduction of the method in 2008 (Bogena et al., 2015; Andreasen et al., 2017a). Neutrons are sensitive to all sources of hydrogen at the land surface. Therefore, the CRNP method has the potential to measure not only soil moisture but SWE as well. This can be achieved, for example, with a CRNP placed below the snow cover (Kodama et al., 1979; Kodama, 1980; Gugerli et al., 2019). The buried CRNP records the intensity of downward-directed secondary cosmic radiation that penetrates the snow pack, thus providing a response area of up to a few square meters. Alternatively, the CRNP can be placed a few meters above the snow surface (Desilets et al., 2010; Sigouin and Si, 2016; Desilets, 2017; Schattan et al., 2017). As soon as the snowpack is formed, this becomes the dominant control on neutron intensity. Even in the case of small amounts of snow, the concentrated hydrogen layer effectively absorbs fast neutrons reflected from the ground (Desilets et al., 2010). For example, 1 cm of SWE can reduce the neutron count rate by ~10% depending on the soil moisture under the snow cover (Andreasen et al., 2017b). A CRNP placed above the snow cover is influenced by snow up to more than 150 m away from the sensor (Zweck et al., 2013), thus enabling the characterization of larger scale and heterogeneous snow cover dynamics (Desilets et al., 2010).
Several studies already showed the potential of CRNP for snow pack monitoring. For example, a time series of SWE derived from fast neutron intensity corresponded well to snow measurements obtained within the detector footprint and to nearby snow depth measurements (Sigouin and Si, 2016). In a subsequent study, Schattan et al. (2017) determined non-linear regression functions to link both snow depth and SWE to fast neutron intensity. As in the case of all SWE monitoring methods, the CRNP technique has its limitations as well. First, the CRNP method cannot differentiate SWE dynamics from soil moisture dynamics. Second, there is a limited range of SWE that can be detected with the CRNP method. Based on neutron transport modeling, Desilets (2017) suggested that the upper limit should be about 100–150 mm SWE. For an alpine site with high neutron counts rates (>5,000 counts per hour), Schattan et al. (2017) found empirical evidence that the fast neutron intensity measured above the snow cover still shows snow-induced signals up to 600 mm SWE. However, the uncertainty of the CRNP measurements of snow height and SWE increased strongly with increasing snow cover, such that acceptable uncertainty was achieved up to 300 mm SWE only. According to Schattan et al. (2019), the footprint of the CRNP is anisotropic and affected by the spatial distribution of liquid water and snow as well as by the topography of the nearby mountains. Nevertheless, they found that the CRNP is able to accurately estimate SWE without prior knowledge about snow density profiles or other spatial anomalies when the snow cover is closed.
The studies mentioned above converted neutron intensity measurements to SWE with different approaches, including empirical linear regression functions (Sigouin and Si, 2016), a recalibrated version of the standard N0-calibration function (Schattan et al., 2017) and a more physically based approach by Desilets (2017). However, to date, there is no consensus on which method is best suited to convert neutron intensity data into SWE. In addition, these studies applied the conversion methods mostly to single snow events and not continuously over a period of several years.
The aim of this paper is to evaluate the accuracy of the CRNP method for measuring SWE dynamics at a test site situated in the Pinios Hydrologic Observatory (PHO)—central Greece. To this end, four different methods to convert neutron count rates to snow pack dynamics are tested based on a long-term time series of CRNP measurements (~3 years).
Pinios Hydrologic Observatory - The CS3 Test Site
The experimental test site CS3 investigated in this study is part of the PHO, which covers an area of ~45 km2 and is located at the eastern boundary of the Pinios River Basin in the municipality of Agia, Greece (Figure 1). The Pinios river basin is one of the most productive agricultural areas in the country and irrigation practices are responsible for more than 80% of the total fresh water consumption, leading to overuse of groundwater (Pisinaras et al., 2018). The mountain ranges framing the basin are responsible for the majority of groundwater recharge of the aquifer systems (Panagopoulos et al., 2015). Therefore, an accurate assessment of precipitation as rainfall and snow is important for efficient and sustainable water management, in particular with regard to the impacts of climate change (Panagopoulos et al., 2016). In order to support these efforts, the mGROWA model (Herrmann et al., 2015) has recently been applied in the Pinios river basin (Panagopoulos et al., 2018). First analyses of simulation results and associated uncertainties revealed a lack of continuously available climatic data including snowpack data for model calibration purposes, which was the main motivation to establish the Pinios Hydrologic Observatory (Pisinaras et al., 2018).
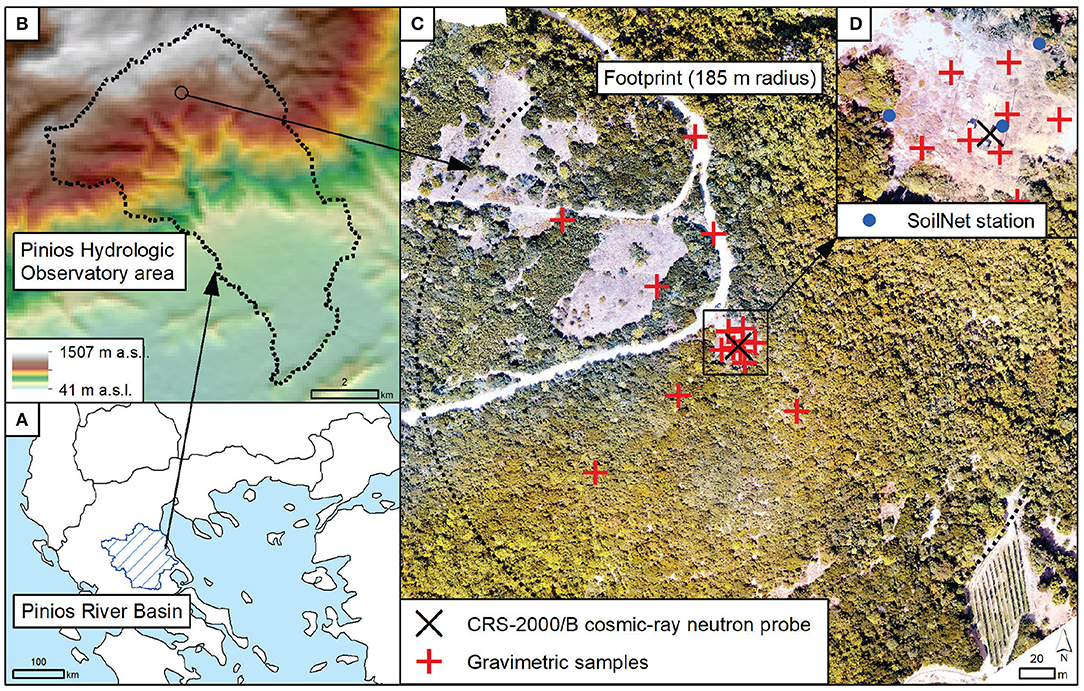
Figure 1. Overview of the study area showing: (A) the extension of the Pinios River Basin, (B) the extension and topography of the Pinios Hydrologic Observatory, (C) a drone image of the CS3 test site and the footprint area of the CRNP with the locations of the gravimetric samples, and (D) the locations of the SoilNet stations.
The CS3 test site was established in April 2017 at an elevation of 1,031 m (Figure 2) on a south-facing slope that ranges between 5° and 25°. The soil was classified as a lithic leptosol with varying rock content depending on the slope inclination and occasionally bare rock outcrops. Approximately 90% of the site is covered by medium to high Mediterranean scrubland (Phrygana) and 10% by grass and herbs. The CS3 site is characterized by Mediterranean climate with dry and hot summers, and precipitation concentrated in winter. Due to the high altitude, significant amounts of winter precipitation occur as snow even though snow cover often exists only for a few days.
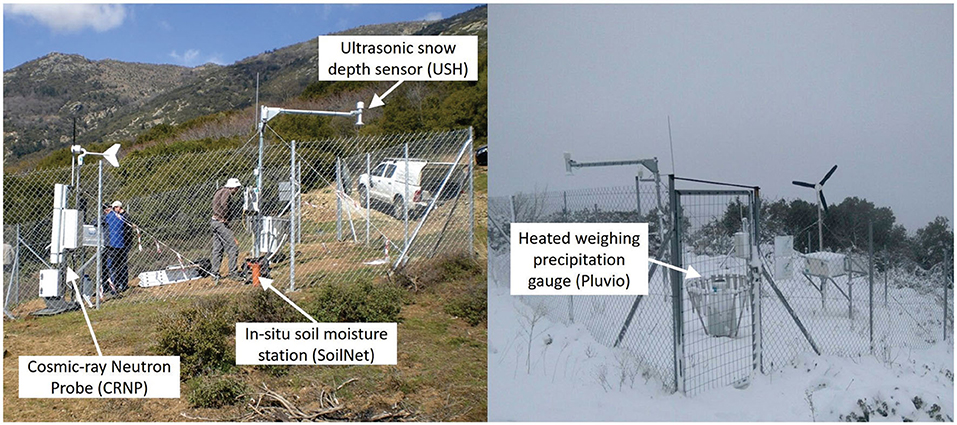
Figure 2. The CS3 test site during installation in spring 2017 (Left) and in the winter period on November 30, 2018 (Right).
The CS3 test site is equipped with a fully autonomous climate station. A heated weighing precipitation gauge (Pluvio2, OTT Hydromet GmbH, Germany) was used to perform high precision monitoring of both liquid and solid precipitation. This system features an automated heating device that reliably keeps the orifice rim free of snow and ice during freezing temperatures. Other instruments of the climate station that were used in this study are: (i) an ultrasonic sensor (USH-8, Sommer GmbH & Co KG, Austria) mounted on a pole at 3 m height to observe snow depth, (ii) a weather multi-sensor (WXT520, Vaisala Oyj, Finland) measuring air temperature, wind speed and direction, atmospheric pressure, and relative air humidity, and (iii) a net radiometer (NR Lite2 net, Kipp & Zonen B.V., The Netherlands) measuring net radiation.
The soil moisture observation system established at CS3 comprises three wireless in-situ soil moisture stations (SoilNet, Forschungszentrum Jülich, Germany; Bogena et al., 2010) and one CRNP (CRS-2000/B, Hydroinnova LLC, Albuquerque, United States). Each SoilNet station consists of six SMT100 soil moisture/temperature sensors (Truebner GmbH, Germany), which are calibrated according to Bogena et al. (2017) and installed in pairs at 5, 20, and 50 cm depth. The SoilNet data are recorded and transmitted at 15-min intervals, while the CRNP records hourly neutron counts. The CRNP probe is equipped with two detector tubes that are filled with 10BF3 enriched gas to obtain high neutron absorption cross sections. When neutrons enter the detector tube, the detector gas absorbs part of the neutrons and generates electrical currents that are counted by a pulse module (Zreda et al., 2012). The thermal detector of the CRS 2000/B probe is sensitive to neutrons with a maximum energy of ~0.025 eV, whereas the moderated detector measures neutrons within the energy range from ~0.2 eV to 100 keV. The CRNP and one of the SoilNet stations are installed a few meters away from the climate station on a grassy clearing within a fence (Figure 2), whereas the other two SoilNet stations measure soil moisture beneath the surrounding scrubs (Figure 1). The quality-checked time series data measured by all the above mentioned sensors is publicly available via a sensor observation service at https://deos-id.org:8000/20.500.11952/DEOS/PHO.
Methods
Neutron Intensity Correction
The ground level neutron intensity is affected by variations in barometric pressure, solar activity (incoming cosmic radiation), and atmospheric water vapor (Zreda et al., 2012). These unwanted fluctuations are addressed by applying a correction factor F(t):
where Ncor is the corrected moderated neutron intensity in counts per hour (cph), and Nraw is the raw neutron intensity in cph. The correction factor F(t) can be decomposed into individual correction factors for barometric pressure (fbar), solar activity (fsol), and atmospheric humidity (fhum). The total correction factor is then (Andreasen et al., 2017b):
Local measurements of atmospheric pressure and humidity were used to determine fbar and fhum whereas data from the neutron monitor at the Jungfraujoch were used to determine fsol (Zreda et al., 2012). The aim of these correction factors is to normalize the neutron counting rate to a number of reference conditions: the barometric reference pressure, the reference humidity, and the solar reference activity level. Following Zreda et al. (2008) and Bogena et al. (2013), a 24 h running average was applied to reduce the inherent noise of the hourly readings and reduce measurement uncertainty.
Conversion of Cosmic-Ray Neutrons to Soil Moisture
The corrected neutron intensity was converted to soil moisture using the standard N0-calibration function proposed by Desilets et al. (2010):
where θ is the volumetric soil water content (m3/m3), ϱbd is the dry bulk density (g/cm3), N0 is the moderated neutron intensity over dry soil that needs to be calibrated using reference in-situ soil moisture data, and αi are fitting parameters (α0 = 0.0808, α1 = 0.372, and α2 = 0.115). Hydrogen stored in lattice water and organic matter was converted into gravimetric soil moisture equivalent (θoff) (g/g) according to Franz et al., 2012.
In-situ Soil Moisture and Snow Sampling
Neutrons originating closer to the neutron detector have a greater influence on the CRNP measurements (Zreda et al., 2008). Therefore, gravimetric samples collected within the CRNP footprint following sampling schemes suggested by Schrön et al. (2017) were used to calibrate the CRNP probe. Schrön et al. (2017) proposed that the calibration should be based on volumetric soil samples taken at 18 locations and at different radial distances from the neutron detector depending on the site wetness (i.e. 2–10, 25–65 and 85–160 m) and in 5 cm increments up to a depth of 30 cm. In this study, a total of 90 gravimetric soil samples were collected at 16 locations (from 0 to 30 cm depth in 5 cm increments) within the footprint of the CRNP at two dates. The irregular distribution of the sample locations shown in Figure 1 is due to the steep topography and challenging accessibility of the study area, especially in the eastern part of the CRNP footprint. Each sampling location was given equal weight for the calculation of the area-average volumetric soil moisture. Water content of the soil samples was determined by oven drying (24 h at 105°C), and used to calibrate the CRNP with respect to soil moisture measurements (see section Soil Moisture Derived From Epithermal Neutron Intensity).
Moreover, an in-situ SWE sampling was conducted at January 7, 2020 during snowmelt conditions. At this time, it was estimated that roughly ~40% of the footprint area was covered with a heterogeneous snow cover in response to the small-scale spatial interplay of vegetation, snowdrift, and variations of melting rates. In an attempt to obtain a more rigorous estimate of the geometry of the snow patches, daily satellite images with a resolution of 3 m (Planet Lab Germany GmbH, Berlin, Germany) were acquired for the 8th and 9th of January (not shown). However, the estimation of snow distribution from satellite data was not possible due to: (i) the image resolution of 3 m which was not able to capture the geometry of small meter-scale snow patches, (ii) the early acquisition time of the images (i.e., 7 a.m.) which reduced illumination, and (iii) the presence of scrubland vegetation which covered the underlying snow. In the SWE sampling campaign, samples were collected at the same locations as during soil sampling in case these were covered with snow. Measured snow depth varied between 6 and 20 cm with an average of 10.83 cm. The corresponding SWE was estimated by weighing the molten snow, which resulted in a SWE range between 11 and 45 mm with an average of 21.63 mm (see also Figure 5). However, in view of the fact that the ground was not completely covered with snow, these values should be considered with caution.
Determination of Snow Water Equivalent Using Cosmic-Ray Neutrons
In this study, we investigate three different approaches to convert measured epithermal neutron intensities to SWE: a linear regression function, the standard N0-calibration function, and a more physically-based model proposed by Desilets (2017). In addition, the thermal to epithermal neutron ratio was considered for SWE estimation.
Linear Regression Function
The linear regression function approach proposed by Sigouin and Si (2016) is based on the assumption that the corrected neutron intensities are linearly related to the SWE surrounding the CRNP. In their study, such a linear regression provided accurate estimates of average SWE within the CRNP footprint. However, Sigouin and Si (2016) found differences in intercepts when using different calibration data sets. Furthermore, overestimation of SWE was observed in the presence of considerable snowmelt as well as increased soil moisture in the first centimeters of soil. However, they found that substantial melt and soil moisture increases were necessary before SWE overestimation occurred, and they also noted that this effect can be well-isolated when continuous measurements of soil moisture are available.
Standard N0-Calibration Function
Schattan et al. (2017) related in-situ measurements of SWE to epithermal neutron intensity using the standard N0-calibration originally developed for relating neutron counts to soil moisture (Equation 3, Desilets et al., 2010). To this end, the coefficients α0, α1, and α2 were recalibrated in addition to N0 using continuous point-scale SWE measurements from an automatic weather station as well as several spatially distributed SWE maps obtained with terrestrial laser scanning. It was found that the sensitivity of this approach decreased with increasing SWE with a depth limit of ~300 mm (Schattan et al., 2017). N0 corresponds to the neutron intensity for dry soil, i.e., without water and snow cover. Therefore, the N0 value resulting from the soil moisture calibration should not need to be recalibrated for the SWE application. Therefore, we only calibrated the coefficients α0, α1, and α2 in this study. An advantage of fixing N0 is the lower degree of freedom in calibration, which makes it easier to transfer the calibration function to other locations.
Physically-Based Calibration Function (Desilets, 2017)
With increasing snow cover, the neutron count rate reaches a constant value for an infinite snow depth (Nsnow) and does not drop to zero. Assuming that the neutron attenuation by water (Λ) is linear, the dependence of neutrons on SWE can be formulated as a first order differential equation (Desilets, 2017):
After integration, this results in Desilets (2017):
where C is an integration constant. Assuming that the neutron count rate in the absence of snow cover (SWE = 0) is controlled by the soil water content (N = NSWC), C is given by Desilets (2017):
The combination of Equations (5) and (6) results in the following expression for SWE as a function of N:
Using neutron modeling, Desilets (2017) found an approximate value of Λ = 4.8 cm. Furthermore, Desilets (2017) suggested that Nsnow could be calculated from N0 using:
Thermal to Epithermal Neutron Ratio
The incoming cosmic radiation is dominated by fast neutrons that are moderated to epithermal neutrons (>1 eV) and thermal neutrons (<1 eV) as they travel and interact with air nuclei, vegetation, and soil (Zreda et al., 2012; Köhli et al., 2015). Andreasen et al. (2016) demonstrated the different physical response of thermal and epithermal neutrons and found that the moderation of epithermal neutrons is high in the soil and low in the air. They also observed that the decrease in thermal neutron intensity is proportional to the height above the ground surface (i.e., the source of thermal neutrons). Desilets et al. (2010) suggested that the neutron energy spectrum might also contain information on the spatial pattern of land surface water. Subsequently, the thermal to epithermal neutron ratio was used to determine aboveground biomass (e.g., Tian et al., 2016; Jakobi et al., 2018). Here, we explore whether the neutron ratio can also be used to predict SWE.
Neutron Signal Separation
For the simultaneous estimation of several variables exclusively from neutron intensity measurements, the time- and space-dependent effects on the measured neutron intensity need to be separated. For this, several studies identified benefits of combining measurements of bare and moderated neutron detectors (Desilets et al., 2010; Tian et al., 2016; Andreasen et al., 2017b; Jakobi et al., 2018). For instance, the ratio between thermal and fast neutrons can be used to distinguish snow events from rain events as shown by Desilets et al. (2010). In their study, it was also shown that snow events are typically characterized by a rapid increase in thermal neutron intensity with the first 1–3 cm of snow followed by a rapid decrease, whereas epithermal neutron intensity decreases monotonically with increasing snow depth. This finding is in accordance with results from neutron modeling of snow cover effects (Zweck et al., 2013). Desilets et al. (2010) also found that changes in the spatial distribution of the snow cover produced a hysteresis loop in the thermal and epithermal neutron intensity.
Results
Precipitation and Neutron Data
Figure 3 shows the continuous measurements of temperature as well as liquid and solid precipitation at the CS3 site from April 3, 2017 to January 13, 2020. The average air temperature during this period was 12.8°C and ranged from −9.6°C to 35.1°C. The total precipitation was 3,187 mm, of which 330 mm occurred during freezing conditions indicating snowfall. In total, 11 snow events that produced a measurable snow cover occurred during the study period (gray areas in Figure 3). During the snow events from January 12, 2018 to January 19, 2018, the operation of the climate station was interrupted several times due to problems with the power supply.
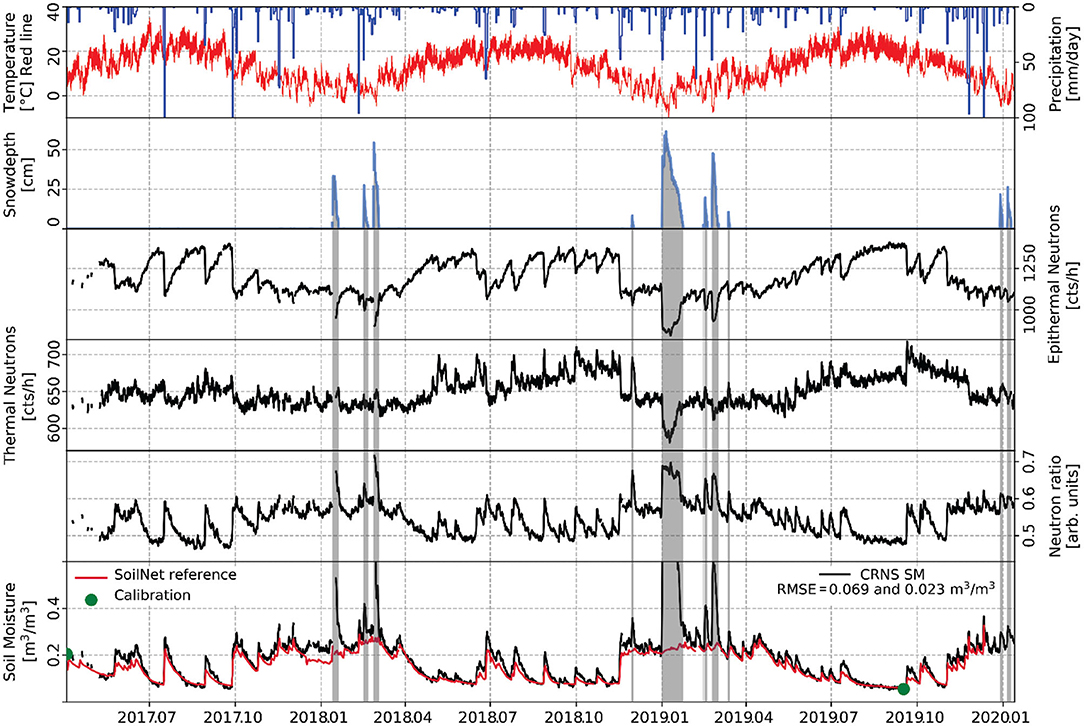
Figure 3. Precipitation, air temperature, snow depth, epithermal neutron and thermal neutron intensity, neutron ratio, vertically and horizontally weighted average in-situ soil moisture (SoilNet), and calibrated CRNP soil moisture from April 3, 2017 to January 13, 2020. The vertically and horizontally weighted average soil moisture from the two calibration campaigns are shown with green dots. The RMSE between soil moisture obtained from CRNP and SoilNet for the whole period and excluding snow events are also shown.
During the investigated period, the average uncorrected epithermal and thermal neutron intensities were 2,946 and 1,457 cph, respectively. These relatively high values are due to the high elevation of the CS3 site (1,031 m) and the increase in cosmic radiation with altitude (Andreasen et al., 2017a). The measurement uncertainty in neutron counts follows Poisson counting statistics. Therefore, the expected standard deviation for a count rate of N is N0.5 (Zreda et al., 2012). As a consequence, the high elevation of the test site approximately doubled the sensitivity of the neutron detectors compared to identical detectors at sea level. Figure 3 shows the epithermal intensity corrected for atmospheric pressure, air humidity, and solar activity and the thermal neutron intensity corrected for atmospheric pressure and air humidity. Due to these corrections, the average epithermal and thermal neutron intensities were reduced to 1,201 and 651 cph, respectively. Generally, snow events led to a significant reduction of both epithermal and thermal neutron intensity, although a stronger reduction was apparent in the case of epithermal neutrons. Consequently, the neutron ratio increased during snow cover periods.
To obtain a better understanding of the interdependency of snow cover, soil moisture, and neutron intensities at different energy levels, a single snow event was investigated in detail. Figure 4 shows the temporal evolution of the most pronounced snowpack during the investigated period that lasted from December 31, 2018 to January 23, 2019. Several snowfall events in the beginning of this period resulted in a total SWE of 109.2 mm with a snow depth of more than 600 mm (Figure 4B). The steep increase in snow depth during the first snowfall event had a strong impact on the neutron signals, especially on the epithermal neutron intensity and the neutron ratio (Figure 4C). After January 6, 2019, the snow depth decreased steadily due to continuous changes in snowpack density, snowmelt, and evaposublimation (Herrero and Polo, 2016). Soil temperature at 5 cm depth was above 0°C during the whole period (data not shown). This led to a continuous low-rate melting at the interface between soil and snowpack, which explains the slowly increasing soil moisture obtained with the in-situ soil moisture sensors (Figure 4B). In the middle and toward the end of the investigated period, liquid precipitation occurred during non-freezing conditions leading to fast soil moisture responses (Figure 4B). Correspondingly, the epithermal neutron intensity decreased and the neutron ratio increased. Warmer conditions with air temperatures above 8°C during daytime led to intense snow melt between January 17 and 21, 2020. During melt, the liquid water storage capacity of the snowpack was exceeded, and this resulted in significant downward percolation as indicated by consecutive peaks in the in-situ soil moisture measurements. The accelerated snowmelt is reflected in a pronounced increase in epithermal neutron intensity and a corresponding decrease in the neutron ratio. In contrast, measured snow depth (point based measurements) did not show an accelerated decline. This discrepancy is attributed to the spatial heterogeneity of the snowpack in the footprint of the CRNP.
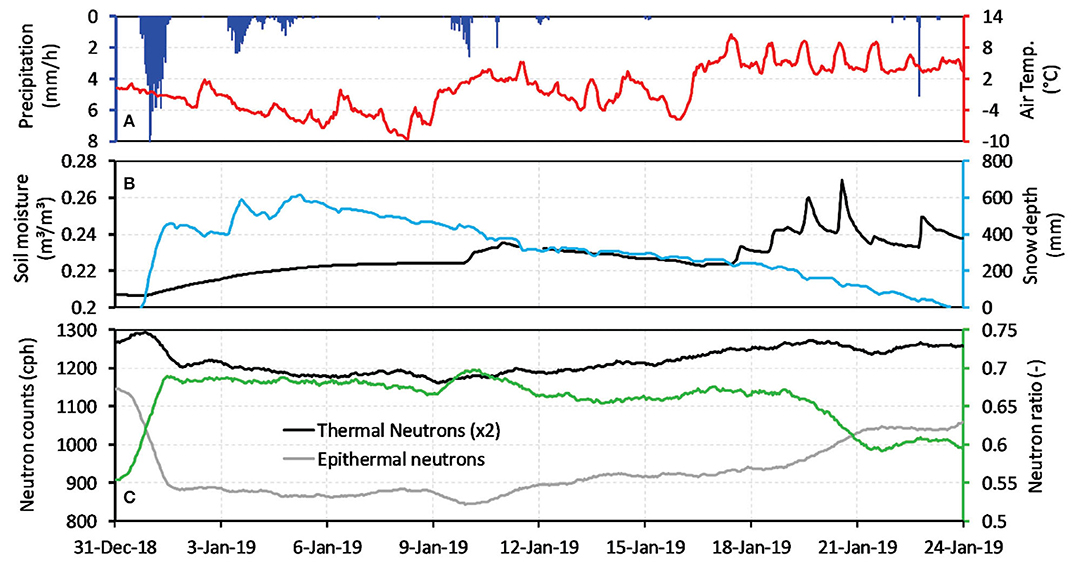
Figure 4. Time series of: (A) precipitation and air temperature, (B) snow depth and vertically and horizontally weighted in-situ soil moisture measured with SoilNet, and (C) epithermal and thermal neutron count rates (24-h moving averages) and the neutron ratio. Note that the thermal neutron intensity is multiplied by two for illustrative purposes.
Soil Moisture Derived From Epithermal Neutron Intensity
In this study, we used the in-situ thermogravimetric reference data from the two calibration campaigns for the conversion of measured epithermal neutron intensity to soil moisture. This was achieved by calibrating the N0 parameter of Equation (3) as suggested by Zreda et al. (2012). For this, we considered an average bulk density of 1.21 g/cm3 and a soil water equivalent of 0.058 mm for soil organic matter and lattice water together. This resulted in an estimated N0 of 1,889 cph. Figure 3 shows the soil moisture derived from epithermal neutron intensity compared to the weighted mean soil moisture measured by the three SoilNet stations and using the horizontal and vertical weighing approaches proposed by Schrön et al. (2017). The CRNP and measured soil moisture time series correspond well, except for the expected mismatches in periods where a snow cover is present. In these periods, the CRNP method strongly overestimated soil moisture due to the strong attenuation of epithermal neutrons by the snow cover. The root-mean-square error (RMSE) between the soil moisture obtained from CRNP and the in-situ measurements is relatively high (RMSE = 0.069 m3/m3). However, the RMSE decreased to 0.023 m3/m3 when the snow events were excluded, which is well within the range reported by other studies (e.g., Franz et al., 2012; Baatz et al., 2014, 2015; Iwema et al., 2015).
Relationship Between SWE and Snow Depth
The available snow depth measurements were converted to snow water equivalent (SWE) in order to perform a comparison with the estimates obtained with CRNP. Here, we used an empirical linear relationship to predict SWE from snow depth. Shook and Gray (1994) previously reported the following linear relationship:
where D is snow depth (cm) and SWE is given in millimeters. Figure 5 shows the measured SWE obtained from the heated precipitation gauge, i.e., the accumulated precipitation readings, and the snow depth measurements. Based on our measurements, we found the following relationship:
It can be seen that the linear function reported by Shook and Gray (1994) considerably overestimated SWE for our site, which is not surprising given the wide range of snow properties. The data from the SWE calibration campaign confirm the correctness of the site-specific regression function (Figure 5). Therefore, this regression is used in the following to derive dynamic changes in SWE from snow depth measurements obtained from the ultrasonic sensor.
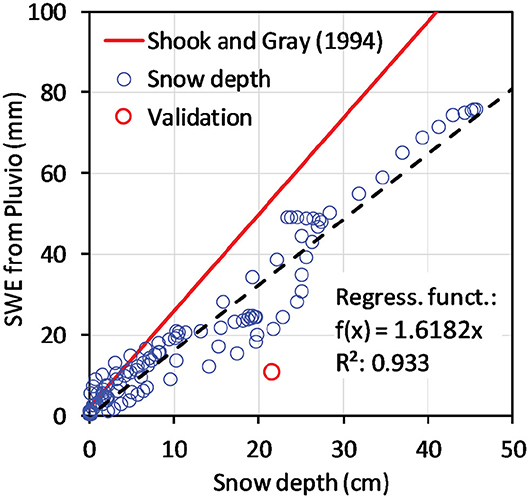
Figure 5. SWE regression function derived from snow water equivalent (SWE) measured by the heated precipitation gauge (Pluvio), i.e., the accumulated precipitation readings, and the snow depth measured by the ultrasonic snow depth sensor. Results from the SWE validation campaign are also presented. In addition, the linear regression function proposed by Shook and Gray (1994) is shown.
Unfortunately, regular in-situ snow measurements during the winter periods were not possible at the site due to its remote location in a mountain range with limited accessibility during snow events. In addition, remote sensing data also did not provide reliable snow information for the test site (see section in-situ Soil Moisture and Snow Sampling). Therefore, we used the Pluvio precipitation gauge instead, because the heating of the gauging rim prevents the blocking of snow and thus ensures reliable SWE measurements. In a similar study, Boudala et al. (2014) compared snow measurements of the Pluvio with in-situ measurements and found that it underestimated the snow amount by only about 4%. Clearly, the use of an empirical relationship between SWE and snow depth implies that the snow density is relatively constant. This assumption may have led to an uncertainty in the estimated SWE data, as the snow density may have varied within and between snow events. Due to the long time series of 3 years and the large number of events during this period, different snow conditions were taken into account in this study. Nevertheless, we found a good agreement between CRNP and the snow height measurements suggesting that changes in snow density were not particularly strong, likely due to the relatively short duration of individual snow events (mostly <1 week). For these reasons, we believe that our validation approach is reliable enough to compare different snow conversion methods for CRNP.
Snow Water Equivalent Derived From Epithermal Neutron Intensity
Regression Analysis
We selected nine snow events with different amounts of snowfall that occurred during the study period (Figure 6). From these nine events, in-situ SWE values were determined from the precipitation measurements as described in section Relationship Between SWE and Snow Depth. For this analysis, only SWE values that occurred during the build-up phase of the snowpack were selected in order to exclude any possible influence of snowmelt, density changes in the snowpack, or evaposublimation (red circles in Figure 6).
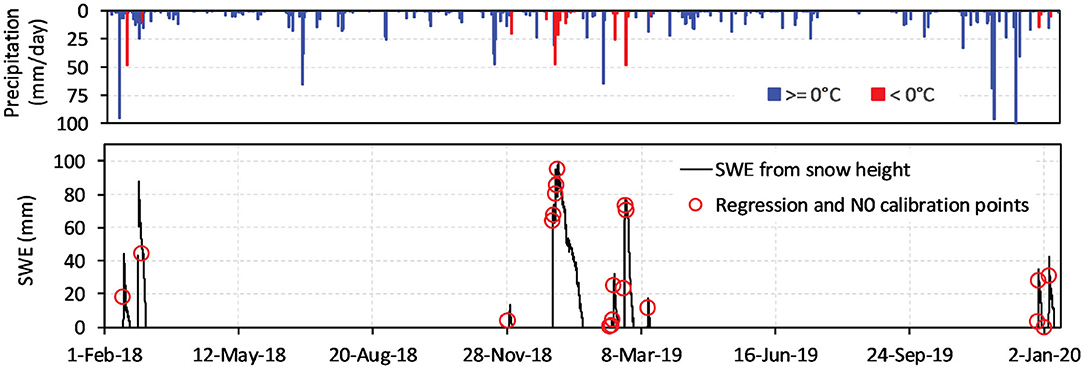
Figure 6. Time series of precipitation and snow water equivalent derived from Equation (10), and the 20 snow depth observations selected for determining the relationship between SWE and CRNP measurements.
Figure 7A shows the relationship between the selected SWE observations (see Figure 6) and the epithermal neutron intensity measurements, and the fitted linear regression model. The coefficient of determination for the fitted model shows that ~95% of the SWE variability can be explained, which indicates that epithermal neutron intensity is an excellent predictor for SWE (RMSE = 7.48 mm). This is also confirmed by the close relationship between all SWE estimates derived from snow depth and CRNP measurements (Figure 7B), which resulted in an R2 of 0.852 and a RMSE of 8.22 mm.
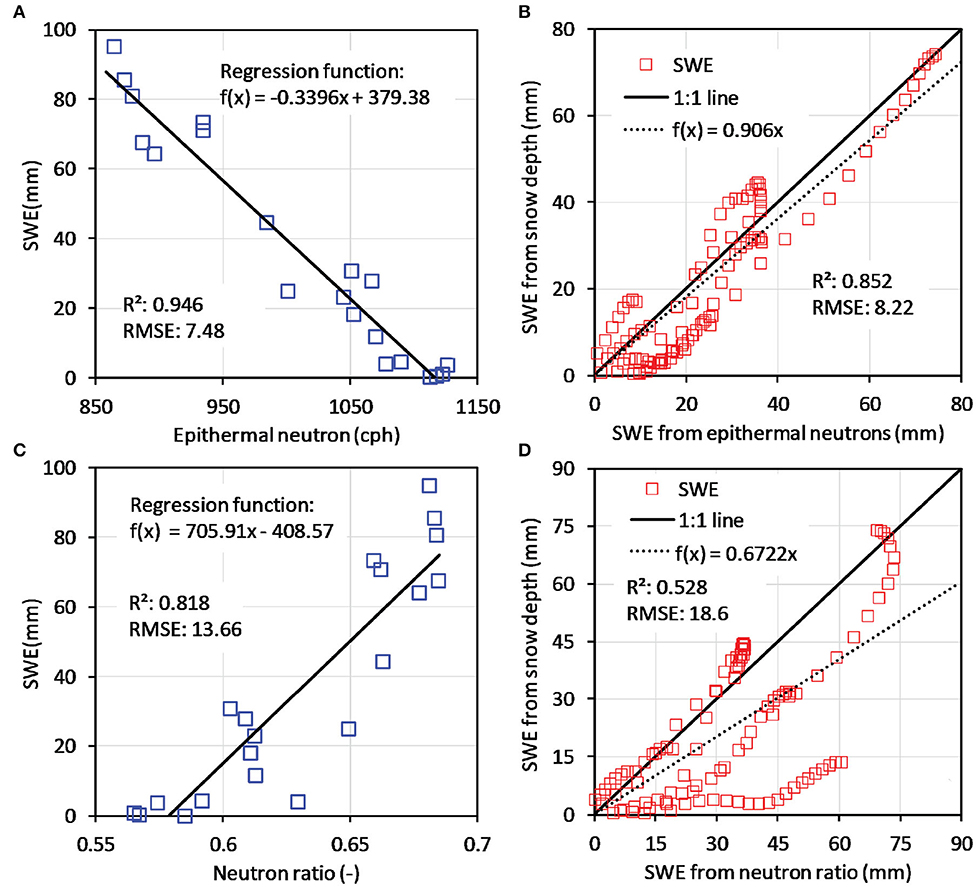
Figure 7. (A) Relationship between SWE derived from 20 snow depth measurements (also shown in Figure 6) and corresponding epithermal neutron measurements; (B) validation of regression function to obtain SWE from epithermal neutron intensity using SWE from all snow depth measurements; (C) relationship between SWE derived from 20 snow depths and corresponding neutron ratios; (D) validation of regression function to obtain SWE from neutron ratio using SWE from all snow depth measurements.
In contrast, the relationship between SWE and neutron ratio is not as good as in the case of epithermal neutron intensity (Figures 7C,D), as indicated by the lower R2 (0.82) and the higher RMSE (13.7 mm). This finding indicates that the neutron ratio is more sensitive to other influences than snow and thus a less robust predictor for SWE. Another explanation for this poorer performance could be the different measuring footprints for thermal and epithermal neutrons. Whereas, the footprint for epithermal neutrons ranges from 12 to 18 ha, the footprint for thermal neutrons covers a much smaller area. Preliminary neutron transport simulations indicate that thermal neutrons have a footprint with a radius of ~35 m at average ambient conditions (Markus Köhli, personal communication). Thus, the neutron ratio may be more strongly affected by spatial heterogeneity of the snow cover than the epithermal neutron intensity. This may explain the larger scatter between SWE derived from snow depth and neutron ratio shown in Figure 7D (R2 = 0.53, RMSE = 18.6 mm). This discrepancy in footprint size represents an even bigger challenge in mountainous areas due the higher spatial variability of snow covers in such environments (Schattan et al., 2019).
We also tested whether a multiple linear regression using both E and T/E leads to a better prediction of SWE from neutron counts. We found that the regression parameter for NR is significant at a 5% confidence level (p-value = 0.0354). However, multiple linear regression using E and NR was only minimally better compared to linear regression using E in terms of R2 (0.953 vs. 0.946). In addition, the multiple regression function showed a lower transferability compared to the simple regression function. Therefore, we decided to not consider multiple linear regression using E and NR as an option for converting neutron counts into SWE in this study.
N0-Calibration Function
As suggested by Schattan et al. (2017), we recalibrated the coefficients of the standard N0 calibration function using the selected SWE observations presented in Figure 6. N0 was fixed to the value found in the soil moisture calibration (1,889 cph). This resulted in α0 = 144.861, α1 = 0, and α2 = 243.172. Interestingly, the α1 parameter was zero and thus could be omitted. The corresponding calibration curve is presented in Figure 8A. Similar to the case of the linear regression function, the N0-function fits the calibration data well (R2 = 0.95, RMSE = 7.45). The validation with all SWE values also showed good results (R2 = 0.762, RMSE = 9.39). Thus, the performance of the N0-calibration function was somewhat lower than that of the linear regression method for the validation measurements.
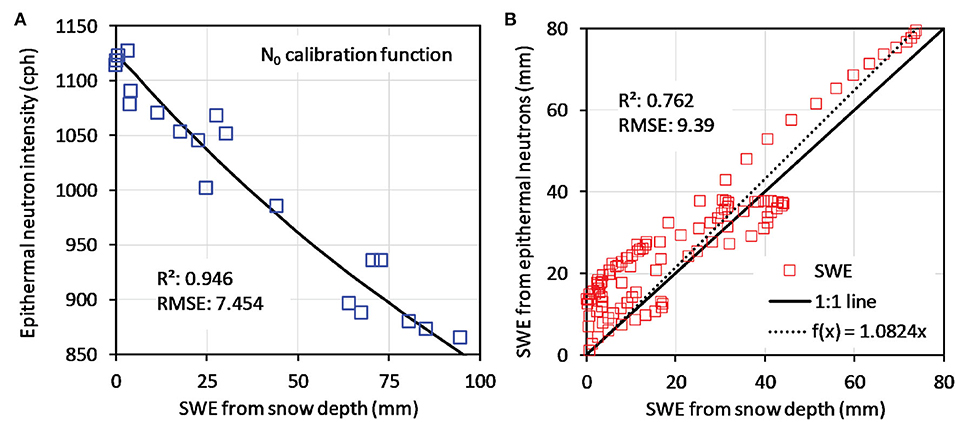
Figure 8. (A) N0-calibration function fitted to 20 selected SWE values obtained from snow level measurements using Equation (10); (B) validation of the N0 calibration function using all SWE values.
Physically-Based Calibration Function
Figure 9 presents the application of the physical-based calibration function proposed by Desilets (2017) using the selected SWE values shown in Figure 6. As suggested by Desilets (2017), we used a value of 4.8 cm for the attenuation length (Λ). We calibrated the remaining two parameters (NSNOW = 824.37 and NSWC = 1133.69). As the summary statistics show, the quality of calibration with the Desilets function is very similar to the epithermal neutron linear regression function and the N0 calibration function (R2 = 0.916, RMSE = 9.89). However, the validation statistics (R2 = 0.81, RMSE = 7.98, Figure 9B) indicate that the physically based model was better able to reproduce all SWE values than the other conversion methods.
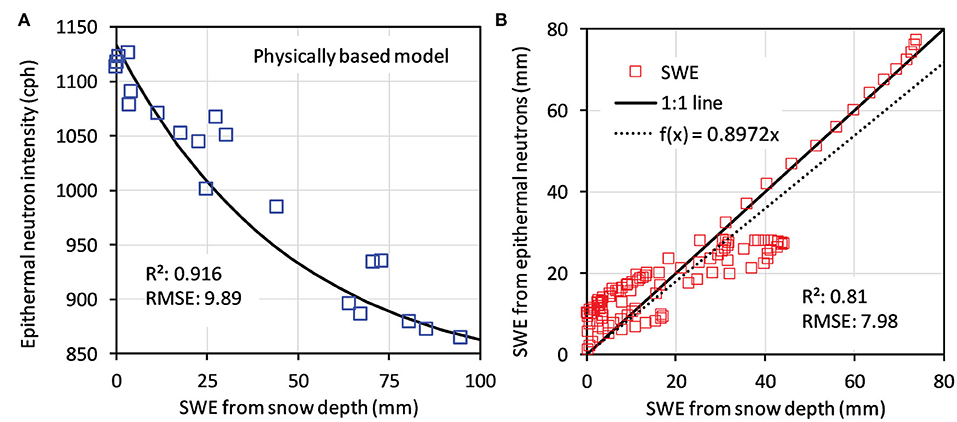
Figure 9. (A) Physically-based model of Desilets (2017) fitted to 20 selected SWE values obtained from snow level measurements using Equation (10); (B) validation of the physically-based model using all SWE values.
Using neutron transport simulations, Desilets (2017) suggested that the value for NSNOW should be 24% of the value of N0 calibrated using in-situ soil moisture reference data. The parameter NSNOW represents a condition in which the snow completely absorbs all epithermal neutrons generated in the soil below the snow cover. Thus, the detected epithermal neutrons above the snow cover are assumed to be generated within the snow cover only. In this study, we fitted the value of NSNOW and found that NSNOW was 43.6% of N0. This may indicate that other sources of epithermal neutrons exist at the CS3 test site. The most likely candidate producing epithermal neutrons is high Mediterranean scrubland vegetation. Furthermore, due to the mountainous location with steep slopes, part of the ground in the footprint of the CRNP was not covered with snow and may thus have increased the amount of epithermal neutrons.
Comparison of SWE Methods
In this section, we investigate how well the four SWE conversion methods compare with the SWE derived from snow level measurements during the single snow event presented in section Precipitation and Neutron Data (Figure 4). In addition, it was investigated how well the conversion methods are able to indicate the onset and ending of snow events. To this end, the SWE conversion methods are applied continuously (i.e., for periods with and without snow coverage) for the three considered winter periods (2017/18, 2018/19, and 2019/20).
Event Scale
In order to explore how the different methods to estimate SWE from CRNP measurements are able to reproduce the SWE dynamics during a snow cover event, we now investigate a single snow event that took place during winter 2018/19 in more detail (Figure 10, see also Figure 4). In addition, we consider an event-based calibration of the conversion methods that is solely based on SWE data of this snow event. For this, only the first 6 days of SWE data were used to exclude any possible influence of rainfall, snowmelt, density changes in the snowpack, or evaposublimation.
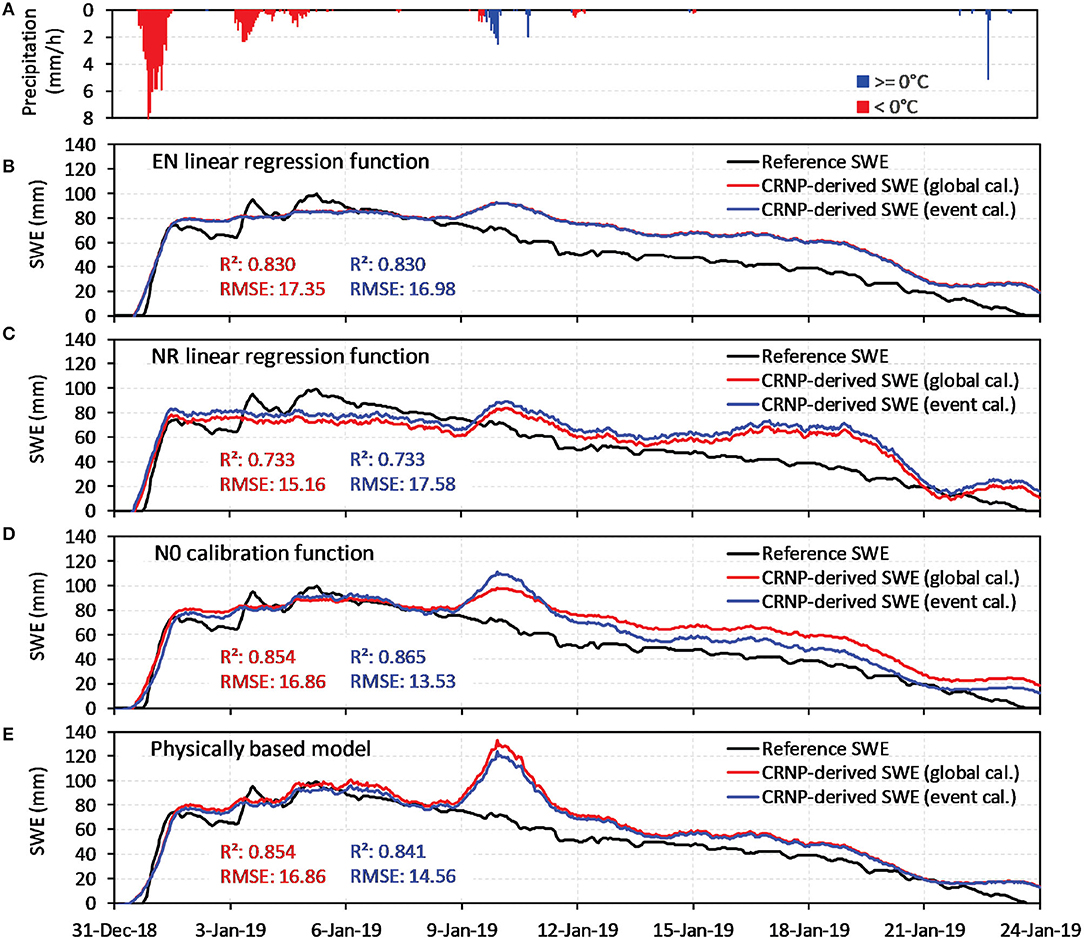
Figure 10. Comparison of two parameterizations of (B) the epithermal regression function, (C) the neutron ratio regression function, (D) the N0 function, and (E) the physically based model for a snow event in winter 2018/19. For the global calibration the 20 selected SWE reference values (Figure 6) were used and for the event calibration SWE data from the first 6 days of this snow event were used. Precipitation intensities for freezing and non-freezing conditions are also shown (A).
Figure 10 shows that the SWE dynamics derived from epithermal neutron intensity and the neutron ratio using the linear regression functions described above compared well with SWE derived from snow level measurements for the first 10 days prior to a strong rainfall event. The additional meteoric water increased the soil moisture content as indicated by the in-situ measurements (see also Figure 4), which may explain the SWE overestimation after the rainfall event (Figure 10B). The bias in the SWE estimates obtained from the neutron ratio regression function is more pronounced than the bias in the SWE estimates obtained from the epithermal neutron regression function. This indicates that the thermal and epithermal neutrons are differently affected by the thawing processes in the second half of the snow period. In addition, effects of the different footprint sizes of the epithermal and thermal neutron detectors have to be taken into consideration (see section Regression Analysis). A calibration of both regression functions using the SWE data of this specific snow event resulted in a marginally better RMSE in the case of the epithermal neutron regression and a slightly worse RMSE in the case of the neutron ratio regression function (Figures 10B,C). The event-scale SWE predictions for the N0-calibration function and the physically-based calibration function are presented in Figures 10D,E. Again, we also compared the global calibration with an event-based calibration. Both calibration functions were better able to reproduce the development of the snow pack than the linear regression functions with epithermal neutrons and the neutron ratio, as indicated by the calibration statistics. However, the SWE overestimation after the strong rainfall event on January 10, 2019 is more pronounced for these two approaches, especially in the case of the calibration function of Desilets (2017). This is related to the stronger non-linearity of these calibration functions. The event-based calibration reduced the SWE overestimation in case of the N0-calibration function (Figure 10D). In contrast, the event-based calibration of the physically-based model did not significantly improve the match with SWE obtained from snow depth (Figure 10E).
Seasonal Scale
Figure 11 shows a comparison of the four CRNP-based methods to estimate SWE with the SWE derived from snow level measurements for the three winter seasons. The corresponding RMSE values for different periods are presented in Table 1. In most cases, all CRNP-based SWE conversion methods were able to determine the SWE during the snow events reasonably well (average RMSE of all methods = 7.69 mm) with the N0-calibration function performing best and the NR regression function performing worst. The RMSE values obtained here are similar to those found in previous studies of Rasmussen et al. (2012) and Sigouin and Si (2016), who reported RMSE values between 5.1 and 8.8 mm between SWE estimated from snow depth and from CRNP measurements.
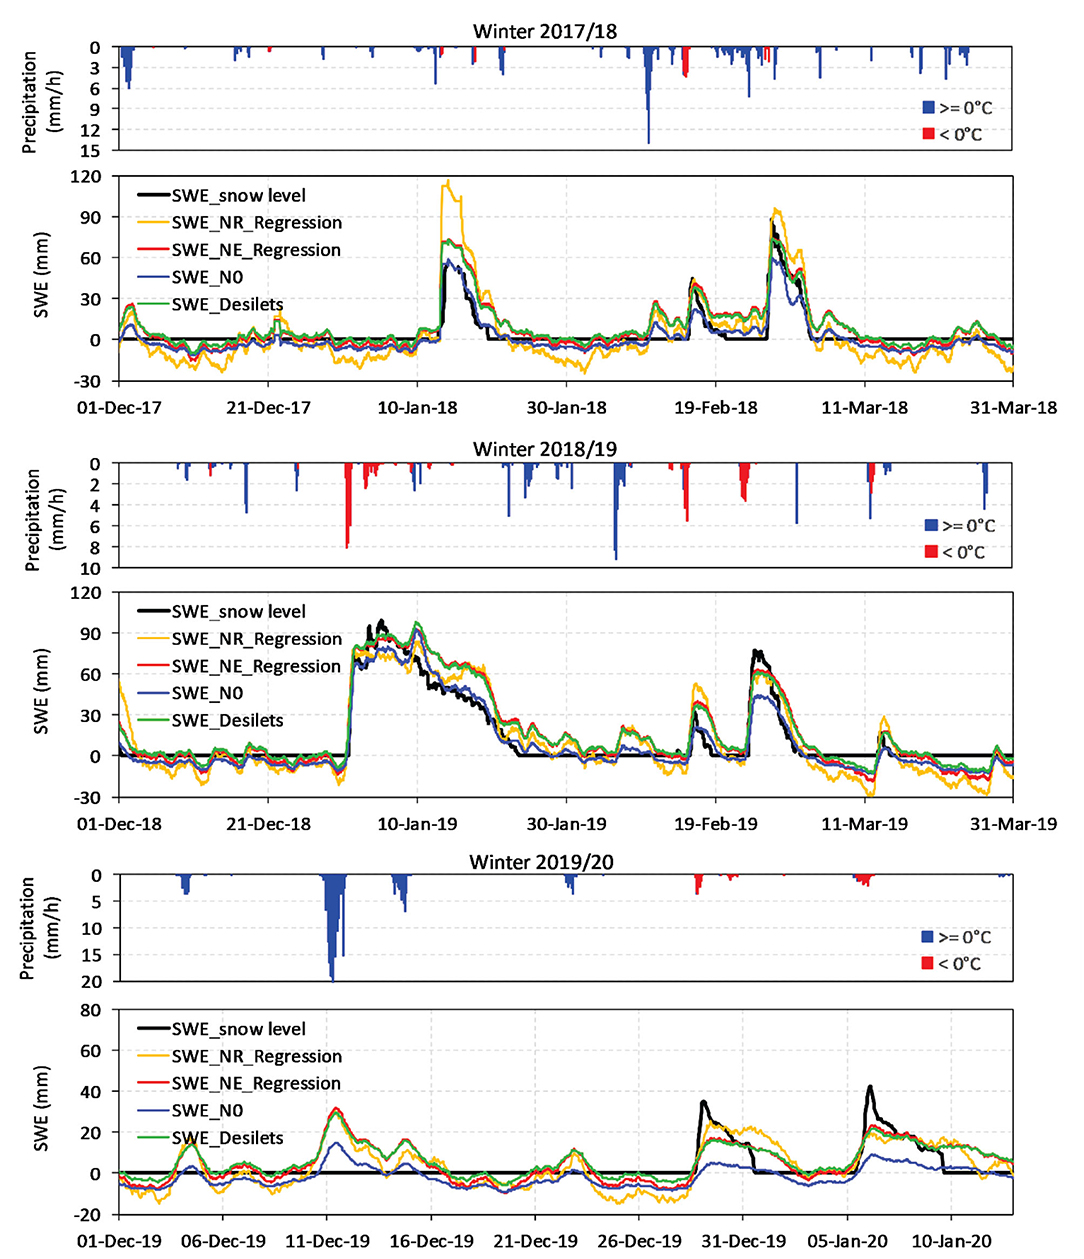
Figure 11. Comparison of the four CRNP-based methods to estimate SWE with the SWE derived from snow level measurements for the winter seasons 2017/18, 2018/19, and 2019/20. Precipitation intensities for freezing and non-freezing conditions are also shown.
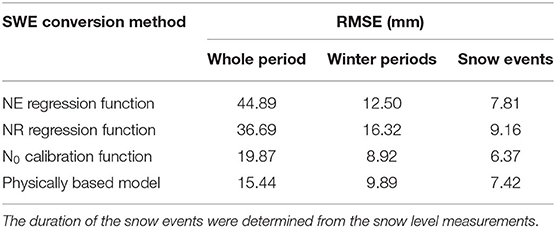
Table 1. RMSE calculated between snow depth-derived and CRNP-derived SWE for different periods indicating the quality of CRNP-based SWE estimation using different conversion methods.
When comparing snow depth-derived SWE with CRNP-derived SWE for the entire winter period (Figure 11, Table 1), the average RMSE of all methods increased to 12.36 mm. This indicates that the CRNP-based SWE determination is affected by other influences such as rainfall. This effect is particularly pronounced during a heavy rainfall event in mid-December 2019, when all CRNP-based conversion methods erroneously indicate a snow event, possibly due to partial occurrence of ponding water. The error in the SWE estimates obtained for the entire monitoring period (including summers) is even higher as indicated by the high RMSE in Table 1. Therefore, it is currently not recommended to use CRNP measurements as a stand-alone method for SWE determination. It is essential to use supporting information (e.g., air temperature, snow level measurements) to independently determine periods with snow. Time-lapse snow photography could also be beneficial (Parajka et al., 2012) for this purpose.
Another reason for the observed discrepancy between SWE estimates obtained from CRNP and snow depth measurements is the difference in measurement scale. While the CRNP measurements cover 12–18 ha, snow depth is only a point measurement. The impact of this scale difference becomes apparent for a snow event from late December to beginning of January 2019 (Figure 11), in which all CRNP-based conversion methods indicate a longer snow cover period than the snow depth-based SWE. It is likely that the snow under the snow depth sensor melted faster due to the influence of direct solar radiation, while the snow cover in the shadow of the shrubbery vegetation remained longer, which is detected by the CRNP-based conversion methods.
Conclusions
In our study, we found that the above-ground CRNP is well-suited for measurement of field scale SWE, which is in agreement with findings of other studies (e.g., Desilets et al., 2010; Rasmussen et al., 2012; Sigouin and Si, 2016; Schattan et al., 2017). We also demonstrated that all four methods to obtain SWE from CRNP measurements were able to determine snow pack dynamics reasonably well, with the N0-calibration function and the physically-based calibration function of Desilets (2017) performing best and the regression function using the neutron ratio performing worst. Furthermore, we showed that the above-ground CRNP can be used for continuous SWE determination. However, the CRNP-based SWE determination can be affected by other influences. Especially heavy rainfall can lead to erroneous indications of snow events due to the occurrence of ponding water. Nevertheless, CRNP-based SWE estimation is a potential alternative to established methods like snow depth-based SWE methods, as it provides SWE estimates for a much larger scale (12–18 ha). In view of the fact that the SWE methods based on snow depth measurement can also yield biased results (e.g., preferred snow cover melting due to the direct influence of solar radiation), we propose that the CRNP-based SWE estimation can lead to results that are more representative for larger areas and therefore better suited for regional studies.
According to Andreasen et al. (2017a), there are currently about 200 stationary CRNPs installed worldwide, often operated as regional networks in hydrological observatories (e.g., Bogena et al., 2018; Kiese et al., 2018; Liu et al., 2018) or in entire countries (Zreda et al., 2012; Hawdon et al., 2014; Evans et al., 2016). Some of the epithermal neutron time series of these CRNPs started already more than a decade ago. Therefore, we expect that the application of the presented SWE conversion methods to available CRNP data will be very useful for the investigation of changes in snow precipitation patterns as well as of increasingly severe snowmelt events caused by rising global temperatures. Future research should seek to further improve the accuracy of the CRNP-based SWE estimates as well as the characterization of onsets and endings of snow cover events e.g., with use of neutron transport modeling (e.g., Andreasen et al., 2017b; Schattan et al., 2019), as well as measurements of neutrons at different and multiple energy ranges.
Data Availability Statement
The datasets presented in this study can be found in online repositories. The names of the repository/repositories and accession number(s) can be found below: https://enoha.eu/ddp/.
Author Contributions
HB developed the idea for this research. FH, AP, AI, and VP developed the experimental design of the research station and accomplished the field measurements. HB, JJ, CB, and JH accomplished the data analysis. HB and FH conceived and wrote a first draft of the manuscript. CB, JH, AP, AI, and VP commented on the draft, which was afterwards revised and submitted by HB. All authors contributed to the article and approved the submitted version.
Funding
The Pinios Hydrologic Observatory was supported by TERENO (TERrestrial Environmental Observatories) funded by the Helmholtz-Gemeinschaft, and by the Hellenic Agricultural Organisation - Soil and Water Resources Institute under the internal R&D infrastructure funds.
Conflict of Interest
HB, FH, JJ, CB, and JH were employed by the company Forschungszentrum Jülich GmbH.
The remaining authors declare that the research was conducted in the absence of any commercial or financial relationships that could be construed as a potential conflict of interest.
Acknowledgments
This research was supported by the FOR 2694 project ‘Cosmic Sense’ funded by the Deutsche Forschungsgemeinschaft under the grant agreement no. 357874777 and the ATLAS project funded by the European Union's Horizon 2020 research and innovation programme under grant agreement no. 857125. We would like to thank the Municipality of Agia and especially Mr. Giannis Patsiavouras for facilitating our work in the Pinios Hydrologic Observatory. Bernd Schilling and Ansgar Weuthen are thanked for support with the installation and maintenance of measurement equipment. Incoming neutron data was obtained from the NMDB database (www.nmdb.eu). Most data presented in this study is freely available via the ENOHA (European Network of Hydrological Observatories) data portal (https://www.enoha.eu/).
References
Akyurek, Z., Surer, S., and Beser, Ö. (2011). Investigation of the snow-cover dynamics in the Upper euphrates basin of Turkey using remotely sensed snow-cover products and hydrometeorological data. Hydrol. Process. 25, 3637–3648. doi: 10.1002/hyp.8090
Andreasen, M., Jensen, K. H., Desilets, D., Franz, T., Zreda, M., Bogena, H., et al. (2017a). Status and perspectives of the cosmic-ray neutron method for soil moisture estimation and other environmental science applications. Vadose Zone J. 16, 1–11. doi: 10.2136/vzj2017.04.0086
Andreasen, M., Jensen, K. H., Desilets, D., Zreda, M., Bogena, H., and Looms, M. C. (2017b). Cosmic-ray neutron transport at a forest field site: the sensitivity to various environmental conditions with focus on biomass and canopy interception. Hydrol. Earth Syst. Sci. 21, 1875–1894. doi: 10.5194/hess-21-1875-2017
Andreasen, M., Jensen, K. H., Zreda, M., Desilets, D., Bogena, H., and Looms, M. C. (2016). Modeling cosmic ray neutron field measurements. Water Resour. Res. 52, 6451–6471. doi: 10.1002/2015WR018236
Baatz, R., Bogena, H. R., Hendricks Franssen, H.-J., Huisman, J. A., Montzka, C., and Vereecken, H. (2015). An empirical vegetation correction for soil moisture content quantification using cosmic ray probes. Water Resour. Res. 51, 2030–2046. doi: 10.1002/2014WR016443
Baatz, R., Bogena, H. R., Hendricks Franssen, H. J., Huisman, J. A., Qu, W., Montzka, C., et al. (2014). Calibration of a catchment scale cosmic-ray probe network: a comparison of three parameterization methods. J. Hydrol. 516, 231–244. doi: 10.1016/j.jhydrol.2014.02.026
Bogena, H., Huisman, J. A., Schilling, B., Weuthen, A., and Vereecken, H. (2017). Effective calibration of low-cost soil water content sensors. Sensors 17:208. doi: 10.3390/s17010208
Bogena, H. R., Herbst, M., Huisman, J. A., Rosenbaum, U., Weuthen, A, and Vereecken, H. (2010). Potential of wireless sensor networks for measuring soil water content variability. Vadose Zone J. 9, 1002–1013. doi: 10.2136/vzj2009.0173
Bogena, H. R., Huisman, J. A., Baatz, R., Hendricks Franssen, H.-J., and Vereecken, H. (2013). Accuracy of the cosmic-ray soil water content probe in humid forest ecosystems: the worst case scenario. Water Resour. Res. 49, 1–14. doi: 10.1002/wrcr.20463
Bogena, H. R., Huisman, J. A., Güntner, A., Hübner, C., Kusche, J., Jonard, F., et al. (2015). Emerging methods for noninvasive sensing of soil moisture dynamics from field to catchment scale: a review. Wiley Interdiscip. Rev. Water 2, 635–647. doi: 10.1002/wat2.1097
Bogena, H. R., Montzka, C., Huisman, J. A., Graf, A., Schmidt, M., Stockinger, M., et al. (2018). The rur hydrological observatory: a multiscale multi-compartment research platform for the advancement of hydrological science. Vadose Zone J. 17:180055. doi: 10.2136/vzj2018.03.0055
Boudala, F. S., Isaac, G. A., Rasmussen, R., Cober, S. G., and Scott, B. (2014). Comparisons of snowfall measurements in complex terrain made during the 2010 winter olympics in Vancouver. Pure Appl. Geophys. 171, 113–127. doi: 10.1007/s00024-012-0610-5
Choquette, Y., Ducharme, P., and Rogoza, J. (2013). “CS725, an accurate sensor for the snow water equivalent and soil moisture measurements,” in Proceedings of the International Snow Science Workshop (Grenoble), 931–936.
Deems, J. S., Painter, T. H., and Finnegan, D. C. (2013). Lidar measurement of snow depth: a review. J. Glaciol. 59, 467–479. doi: 10.3189/2013JoG12J154
Desilets, D. (2017). Calibrating a Non-invasive Cosmic Ray Soil Moisture Probe for Snow Water Equivalent. Hydroinnova Technical Document, 17–01.
Desilets, D., Zreda, M., and Ferré, T. P. A. (2010). Nature's neutron probe: land surface hydrology at an elusive scale with cosmic rays. Water Resour. Res. 46:W11505. doi: 10.1029/2009WR008726
Earman, S., Campbell, A. R., Phillips, F. M., and Newman, B. D. (2006). Isotopic exchange between snow and atmospheric water vapor: estimation of the snowmelt component of groundwater recharge in the southwestern United States. J. Geophys. Res. 111:D09302. doi: 10.1029/2005JD006470
Evans, J. G., Ward, H. C., Blake, J. R., Hewitt, E. J., Morrison, R., Fry, M., et al. (2016). Soil water content in southern England derived from a cosmic ray soil moisture observing system: COSMOS-UK. Hydrol. Process. 30, 4987–4999. doi: 10.1002/hyp.10929
Fontrodona Bach, A., van der Schrier, G., Melsen, L. A., Klein Tank, A. M. G., and Teuling, A. J. (2018). Widespread and accelerated decrease of observed mean and extreme snow depth over Europe. Geophys. Res. Lett. 45, 312–312. doi: 10.1029/2018GL079799
Franz, T. E., Zreda, M., Rosolem, R., and Ferre, T. P. A. (2012). Field validation of a cosmic-ray neutron sensor using a distributed sensor network. Vadose Zone J. 11:vzj2012.0046. doi: 10.2136/vzj2012.0046
Gugerli, R., Salzmann, N., Huss, M., and Desilets, D. (2019). Continuous and autonomous snow water equivalent measurements by a cosmic ray sensor on an alpine glacier. Cryosphere 13, 3413–3434. doi: 10.5194/tc-13-3413-2019
Hawdon, A., McJannet, D., and Wallace, J. (2014). Calibration and correction procedures for cosmic-ray neutron soil moisture probes located across Australia. Water Resour. Res. 50, 5029–5043. doi: 10.1002/2013WR015138
Heilig, A., Schneebeli, M., and Eisen, O. (2009). Upward looking ground-penetrating radar for monitoring snowpack stratigraphy. Cold Reg. Sci. Technol. 59, 152–162. doi: 10.1016/j.coldregions.2009.07.008
Herrero, J., and Polo, M. J. (2016). Evaposublimation from the snow in the mediterranean mountains of sierra nevada (Spain). Cryosphere 10, 2981–2998. doi: 10.5194/tc-10-2981-2016
Herrmann, F., Keller, L., Kunkel, R., Vereecken, H., and Wendland, F. (2015). Determination of spatially differentiated water balance components including groundwater recharge on the Federal State level – a case study using the mGROWA model in North Rhine-Westphalia (Germany). J. Hydrol. Reg. Stud. 4, 294–312. doi: 10.1016/j.ejrh.2015.06.018
Iwema, J., Rosolem, R., Baatz, R., Wagener, T., and Bogena, H. R. (2015). Investigating temporal field sampling strategies for site-specific calibration of three soil moisture-neutron intensity parameterization methods. Hydrol. Earth Syst. Sci. 19, 3203–3216. doi: 10.5194/hess-19-3203-2015
Jakobi, J., Huisman, J. A., Vereecken, H., Diekkrüger, B., and Bogena, H. R. (2018). Cosmic-ray neutron sensing for simultaneous soil water content and biomass quantification in drought conditions. Water Resour. Res. 54, 7383–7402. doi: 10.1029/2018WR022692
Kiese, R., Fersch, B., Baessler, C., Brosy, C., Butterbach-Bahl, K., Chwala, C., et al. (2018). The TERENO pre-alpine observatory: integrating meteorological, hydrological and biogeochemical measurements and modeling. Vadose Zone J. 17:180060. doi: 10.2136/vzj2018.03.0060
Kinar, N. J., and Pomeroy, J. W. (2015). Measurement of the physical properties of the snowpack. Rev. Geophys. 53, 481–544. doi: 10.1002/2015RG000481
Koch, F., Henkel, P., Appel, F., Schmid, L., Bach, H., Lamm, M., et al. (2019). Retrieval of snow water equivalent, liquid water content, and snow height of dry and wet snow by combining GPS signal attenuation and time delay. Water Resour. Res. 55, 4465–4487. doi: 10.1029/2018WR024431
Kodama, M. (1980). Continuous monitoring of snow water equivalent using cosmic-ray neutrons. Cold Reg. Sci. Technol. 3, 295–303. doi: 10.1016/0165-232X(80)90036-1
Kodama, M., Nakai, K., Kawasaki, S., and Wada, M. (1979). An application of cosmic-ray neutron measurements to the determination of the snow-water equivalent. J. Hydrol. 41, 85–92. doi: 10.1016/0022-1694(79)90107-0
Köhli, M., Schrön, M., Zreda, M., Schmidt, U., Dietrich, P., and Zacharias, S. (2015). Footprint characteristics revised for field-scale soil moisture monitoring with cosmic-ray neutrons. Water Resour. Res. 51, 5772–5790. doi: 10.1002/2015WR017169
Kripalani, R. H., and Kulkarni, A. (1999). Climatology and variability of historical soviet snow depth data: some new perspectives in snow–Indian monsoon teleconnections. Clim. Dyn. 15, 475–489. doi: 10.1007/s003820050294
Liu, S., Li, X., Xu, Z., Che, T., Xiao, Q., Ma, M., et al. (2018). The heihe integrated observatory network: a basin-scale land surface processes observatory in China. Vadose Zone J. 17:180072. doi: 10.2136/vzj2018.04.0072
Lundberg, A., Granlund, N., and Gustafsson, D. (2010). Towards automated “Ground truth” snow measurements - a review of operational and new measurement methods for Sweden, Norway, and Finland. Hydrol. Process. 24, 1955–1970. doi: 10.1002/hyp.7658
Panagopoulos, A., Arampatzis, G., Kuhr, P., Kunkel, R., Tziritis, E., and Wendland, F. (2015). Area-differentiated modeling of water balance in pinios basin, central Greece. Global NEST J. 17, 221–235. doi: 10.30955/gnj.001402
Panagopoulos, A., Arampatzis, G., Tziritis, E., Pisinaras, V., Herrmann, F., Kunkel, R., et al. (2016). Assessment of climate change impact in the hydrological regime of river Pinios Basin, central Greece. Desalin. Water Treat. 57, 2256–2267. doi: 10.1080/19443994.2014.984926
Panagopoulos, A., Herrmann, F., Pisinaras, V., and Wendland, F. (2018). Impact of climate change on irrigation need and groundwater resources in pinios basin. Proceedings 2:659. doi: 10.3390/proceedings2110659
Parajka, J., Haas, P., Kirnbauer, R., Jansa, J., and Blöschl, G. (2012). Potential of time-lapse photography of snow for hydrological purposes at the small catchment scale. Hydrol. Process. 26, 3327–3337. doi: 10.1002/hyp.8389
Peck, E. L., Bissell, V. C., Jones, E. B., and Burge, D. L. (1971). Evaluation of snow water equivalent by airborne measurement of passive terrestrial gamma radiation. Water Resour. Res. 7, 1151–1159. doi: 10.1029/WR007i005p01151
Pimentel, R., Herrero, J., Zeng, Y., Su, Z., and Polo, M. J. (2015). Study of snow dynamics at subgrid scale in semiarid environments combining terrestrial photography and data assimilation techniques. J. Hydrometeor. 16, 563–578. doi: 10.1175/JHM-D-14-0046.1
Pirazzini, R., Leppänen, L., Picard, G., Lopez-moreno, J. I., Marty, C., Macelloni, G., et al. (2018). European in-situ snow measurements: practices and purposes. Sensors 18:2016. doi: 10.3390/s18072016
Pisinaras, V., Panagopoulos, A., Herrmann, F., Bogena, H. R., Doulgeris, C., Ilias, A., et al. (2018). Hydrologic and geochemical research at pinios hydrologic observatory - initial results. Vadose Zone J. 17, 1–16. doi: 10.2136/vzj2018.05.0102
Rasmussen, R., Baker, B., Kochendorfer, J., Meyers, T., Landolt, S., Fischer, A. P., et al. (2012). How well are we measuring snow: the NOAA/FAA/NCAR winter precipitation test bed. Bull. Am. Meteorol. Soc. 93, 811–829. doi: 10.1175/BAMS-D-11-00052.1
Schattan, P., Baroni, G., Oswald, S. E., Schober, J., Fey, C., Kormann, C., et al. (2017). Continuous monitoring of snowpack dynamics in alpine terrain by aboveground neutron sensing. Water Resour. Res. 53, 3615–3634. doi: 10.1002/2016WR020234
Schattan, P., Köhli, M., Schrön, M., Baroni, G., and Oswald, S. E. (2019). Sensing area-average snow water equivalent with cosmic-ray neutrons: the influence of fractional snow cover. Water Resour. Res. 55, 10796–10812. doi: 10.1029/2019WR025647
Schmid, L., Heilig, A., Mitterer, C., Schweizer, J., Maurer, H., Okorn, R., et al. (2014). Continuous snowpack monitoring using upward-looking ground-penetrating radar technology. J. Glaciol. 60, 509–525. doi: 10.3189/2014JoG13J084
Schrön, M., Köhli, M., Scheiffele, L., Iwema, J., Bogena, H. R., Lv, L., et al. (2017). Spatial sensitivity of cosmic-ray neutron sensors applied to improve calibration and validation. Hydrol. Earth Syst. Sci. 21, 5009–5030. doi: 10.5194/hess-21-5009-2017
Shook, K., and Gray, D. M. (1994). “Determining the snow water equivalent of shallow prairie snowcovers,” in Proceedings of the 51st Eastern Snow Conference (Dearborn, MI), 89–95.
Sigouin, M. J. P., and Si, B. C. (2016). Calibration of a non-invasive cosmic-ray probe for wide area snow water equivalent measurement. Cryosphere 10, 1181–1190. doi: 10.5194/tc-10-1181-2016
Sun, C., Walker, J. P., and Houser, P. R. (2004). A methodology for snow data assimilation in a land surface model. J. Geophys. Res. 109:D08108. doi: 10.1029/2003JD003765
Tian, Z. C., Li, Z. Z., Liu, G., Li, B. G., and Ren, T. S. (2016). Soil water content determination with cosmic-ray neutron sensor: correcting aboveground hydrogen effects with thermal/fast neutron ratio. J. Hydrol. 540, 923–933. doi: 10.1016/j.jhydrol.2016.07.004
Zreda, M., Desilets, D., Ferre, T. P. A., and Scott, R. L. (2008). Measuring soil moisture content non-invasively at intermediate spatial scale using cosmic-ray neutrons. Geophys. Res. Lett. 35:L21402. doi: 10.1029/2008GL035655
Zreda, M., Shuttleworth, W. J., Zeng, X., Zweck, C., Desilets, D., Franz, T., and Rosolem, R. (2012). COSMOS: the cosmic-ray soil moisture observing system. Hydrol. Earth Syst. Sci. 16, 4079–4099. doi: 10.5194/hess-16-4079-2012
Keywords: cosmic-ray neutron probe, snow pack monitoring, snow water equivalent, snow depth, conversion methods, Pinios Hydrologic Observatory
Citation: Bogena HR, Herrmann F, Jakobi J, Brogi C, Ilias A, Huisman JA, Panagopoulos A and Pisinaras V (2020) Monitoring of Snowpack Dynamics With Cosmic-Ray Neutron Probes: A Comparison of Four Conversion Methods. Front. Water 2:19. doi: 10.3389/frwa.2020.00019
Received: 20 March 2020; Accepted: 25 June 2020;
Published: 04 August 2020.
Edited by:
Shaomin Liu, Beijing Normal University, ChinaReviewed by:
Trenton Franz, University of Nebraska-Lincoln, United StatesHongyi Li, Northwest Institute of Eco-Environment and Resources (CAS), China
Copyright © 2020 Bogena, Herrmann, Jakobi, Brogi, Ilias, Huisman, Panagopoulos and Pisinaras. This is an open-access article distributed under the terms of the Creative Commons Attribution License (CC BY). The use, distribution or reproduction in other forums is permitted, provided the original author(s) and the copyright owner(s) are credited and that the original publication in this journal is cited, in accordance with accepted academic practice. No use, distribution or reproduction is permitted which does not comply with these terms.
*Correspondence: Heye R. Bogena, aC5ib2dlbmFAZnotanVlbGljaC5kZQ==