 Erika L. Gallo1,2
 Thomas Meixner
 Kathleen A. Lohse
 Hillary Nicholas
- 1Department of Hydrology and Atmospheric Sciences, University of Arizona, Tucson, AZ, United States
- 2Department of Biological Sciences, Idaho State University, Pocatello, ID, United States
Streamflow in arid and semi-arid regions is predominantly temporary, an integral part of mountain block hydrology and of significant importance for groundwater recharge and biogeochemical processes. However, temporary streamflow regimes, especially ephemeral flow, remain poorly quantified. We use electrical resistance sensors and USGS stream gauge data in 15 southern Arizona streams spanning a climate gradient (mean annual precipitation from 160 to 750 mm) to quantify temporary streamflow as streamflow presence and water presence, which includes streamflow, ponding and soil moisture. We use stream channel sediment data to estimate saturated hydraulic conductivity and potential annual infiltration. Annual streamflow ranged 0.6–82.4% or 2–301 days; while water presence ranged from 2.6 to 82.4% or 10 to over 301 days, or 4–33 times longer than streamflow. We identified 5 statistically distinct flow regimes based on the annual percent streamflow and water presence: (1) dry-ephemeral, (2) wet-ephemeral, (3) dry-intermittent, (4) wet-intermittent, and (5) seasonally-intermittent. In contrast to our expectations, stream channel density was a better predictor of annual streamflow and water presence than annual rainfall alone. Whereas, the dry-ephemeral and wet-ephemeral flow regimes varied with seasonal precipitation, the dry-intermittent, wet intermittent and seasonally-intermittent flow regimes did not. These results coupled with the potential infiltration estimates indicate that streamflow at the driest sites occurs in response to rainfall and overland flow while groundwater discharge and vadose zone contributions enhance streamflow at the wetter sites. We suggest that on a short temporal scale, and with respect to water presence, wetter sites might be buffered better against shifts in the timing and distribution of precipitation in response to climate change. Flow regime classifications that include both stream flow and water presence, rather than on stream flow alone, may be important for predicting thresholds in ecological functions and refugia in these dryland systems.
Introduction
Streamflow is predominantly temporary in water limited regions (Newman et al., 2006; Larned et al., 2010; Datry et al., 2014) such as the Western United States (US), where ~89% of streams flow intermittently (US Geological Survey, 2008). These brief streamflow episodes have a profound effect on ecohydrological processes (Stromberg et al., 2008; Blasch et al., 2010; Jaeger and Olden, 2012) and groundwater recharge (Constantz, 1982; Goodrich et al., 2004; Coes and Pool, 2005; Blasch et al., 2006; Baillie et al., 2007; Callegary et al., 2007; Cataldo et al., 2010; Tillman et al., 2011). Despite the importance of temporary surface waters to biological processes and water resources, the frequency and temporal distribution of streamflow in water limited regions remains poorly quantified.
Streamflow in the arid and semi-arid Southwest US occurs in response to spatially heterogeneous convective summer precipitation (The North American Monsoon), protracted and widespread winter precipitation, snowmelt and groundwater discharge (Goodrich et al., 2004, 2018; Baillie et al., 2007). Stream channels in this region are areas of focused infiltration and subsequent recharge (Coes and Pool, 2005) resulting in significant streamflow losses (Goodrich et al., 2004). Meanwhile, evapotranspiration losses can alter water redistribution and subsequent streamflow dynamics (Leenhouts et al., 2006; Scott et al., 2008). As a result of the coupling among precipitation patterns, channel infiltration losses and high evapotranspiration fluxes, streamflow, and stream channel wetting can be temporally variable and have a high degree of intermittency in these water-limited regions.
Research shows that streamflow patterns arise from differences in partitioning of precipitation within catchment drainage networks (Leenhouts et al., 2006; Biederman et al., 2014), particularly in water limited systems (Kampf et al., 2016). Hydrologic conceptual models developed in the arid and semi-arid Southwest indicate that streamflow may transition from perennial in mountain headwater streams to intermittent in the mountain fronts and alluvial basins as stream channel infiltration losses and the distance downstream increase (Tillman et al., 2011). These hydrologic discontinuities result in more pronounced streamflow intermittency at lower elevations, a pattern observed by Jaeger and Olden (2012). In addition, geochemical studies show differential partitioning of winter and summer precipitation to infiltration and subsequent recharge (Eastoe et al., 2004; Baillie et al., 2007). For example, Wahi et al. (2008) noted that in the Huachuca Mountains of southern Arizona, high elevations springs are comprised of a greater fraction of winter precipitation than lower elevation shallow riparian waters, which are comprised of a greater fraction of summer rainfall. Despite the geochemical evidence, there is a paucity of knowledge about streamflow patterns across a range of arid and semi-arid streams.
Mountain-system recharge, or recharge that occurs due to percolation along rock fractures and faults (mountain block) and infiltration in the mountain front, is considered to be the main groundwater recharge mechanism in semi-arid systems (Wahi et al., 2008). In these systems, water losses to infiltration along intermittent stream reaches, exclusive of mountain-connected streams may account for 12–19% of recharge in some basins (Coes and Pool, 2005). At a localized scale, intermittent stream recharge can contribute as much 85% to shallow riparian groundwater during the summer rainfall season (Baillie et al., 2007). However, stream channel recharge estimates in intermittent systems can be poorly constrained due to the scarcity of streamflow and stream water presence measurements. Methodologies used to assess intermittent stream infiltration and recharge in arid and semi-arid systems include geochemical studies, water balance approaches, in-situ infiltrometers, and thermal monitoring and modeling approaches (Besbes et al., 1978; Sorman and Abdulrazzak, 1993; Constantz et al., 2003; Dowman et al., 2003; Goodrich et al., 2004; Coes and Pool, 2005; Blasch et al., 2006; Baillie et al., 2007; Callegary et al., 2007). However, the temporal dynamics of intermittent streamflow, a major control on potential infiltration, remain to be explicitly quantified.
The objective of this study is to quantify annual streamflow presence and identify temporal streamflow patterns in streams of the arid and semi-arid Southwest. An accompanying paper examines the consequences of these temporary streamflow patterns for organic and nutrient dynamics (Lohse et al., 2020a). Here we ask the following questions: (1) How frequent is streamflow in arid and semi-arid streams and how does it vary with climate and landscape characteristics?, (2) What are the temporal patterns of streamflow across sites?, and (3) What are the rates and potential annual infiltration in arid and semi-arid stream channels? To address these questions, we quantified streamflow and stream channel water presence in 15 stream reaches in southern Arizona spanning an aridity gradient; developed a classification system for streams in arid and semi-arid regions based on the degree of surface water intermittency and generated infiltration estimates for the study sites. We expected streamflow to vary along a climate gradient and increase with elevation and mean annual precipitation, and for streamflow permanence to vary with the timing of precipitation.
Materials and Methods
Study Area
We selected 13 temporarily wet stream channels, or washes, in southern Arizona located across three climatic zones (Figure 1, Table 1) as indicated by their aridity index (Thornthwaite, 1948; UNEP, 1992) and that spanned a range of geomorphic conditions. Precipitation across the region is bimodal. Summertime convective rainfall (the North American Monsoon) is intense, of short duration, spatially heterogeneous and lasts from mid-late June to mid-late September. A second precipitation period is observed primarily between December and March with rainfall of lower intensity and longer duration arising from widespread storm systems.
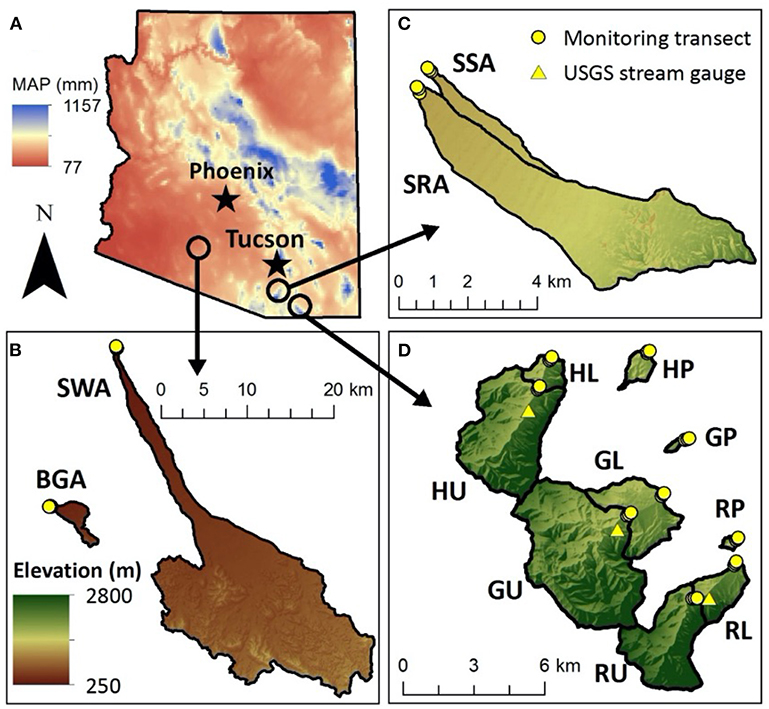
Figure 1. (A) Study sites in southern Arizona across an aridity range. Sites are located at (B) the Barry Goldwater Range (SWA, BGA); (C) the Santa Rita experimental range (SRA, SSA); and (D) in the Huachuca Mountains at Huachuca Canyon (HU, HL, HP) and Garden Canyon (GU, GL, GP), located within the Ft. Huachuca Army base and Ramsey Canyon (RU, RL and RP).
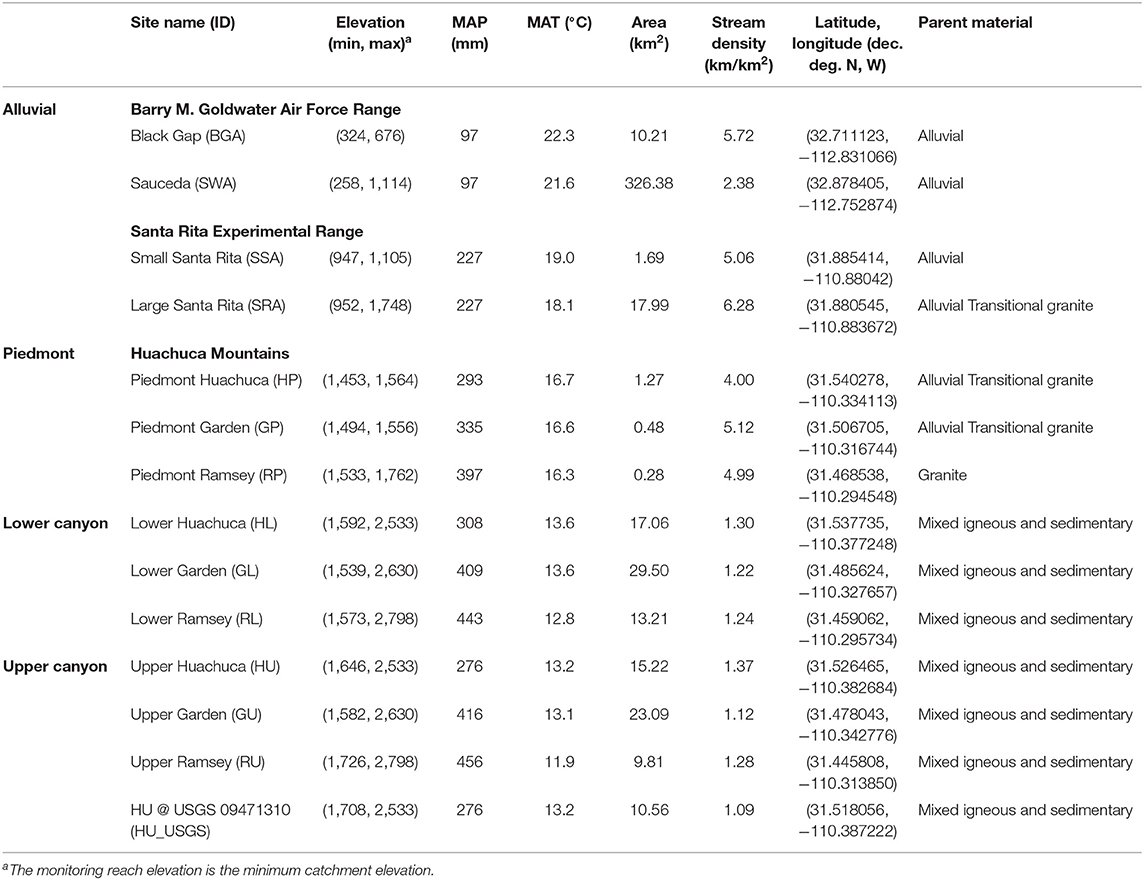
Table 1. Catchment characteristics including elevation, mean annual precipitation (MAP), and temperature (MAT) from PRISM Climate Group (2013), area, stream density, latitude and longitude in decimal degrees, and parent material.
The monitoring washes were located in largely undisturbed military facilities, long term ecological research areas and a nature preserve (Table 1). We used the National Hydrography Dataset (NHD) (version 2) (US Geological Survey, 2008) and associated watershed boundary dataset in ArcMap 10.2 (ESRI, Redlands, CA) to delineate catchments, and a 3 m USGS digital elevation model (DEM) to delineate and characterize the catchment upstream of each monitoring wash reach. The most arid study washes (AI = 0.14), Black Gap (BGA) and Sauceda Wash (SWA), are located within the Barry M. Goldwater Air Force Base near Gila Bend, Arizona in the Lower Gila River Basin on semi-consolidated alluvial basin fans at 324 and 258 m in elevation, respectively. Both study washes have catchments primarily composed of dacite and sand (Table 1). The catchment upstream of the BGA reach is 10.2 km2 and ranges in elevation from 324 to 676; while the catchment upstream of the SWA reach is the largest of our study sites, 326.4 km2, and ranges in elevation from 258 to 1,114 m (Table 1). The 30-year mean annual precipitation (MAP) at these sites ranges between 160 mm at the lower elevations and 250 mm at the higher elevations (PRISM Climate Group, 2013); while mean annual temperature (MAT) is 23°C and can range between 5° and 43°C (US Climate Data; http://www.ncdc.noaa.gov/). Two semi-arid (AI = 0.25) study washes are located on the Santa Rita Experimental Range near Sahuarita, Arizona in the Santa Cruz River Basin (SSA and SRA). These are center-of-basin braided unconsolidated sandy channels 947 and 952 m in elevation. The catchment upstream of SSA is 1.7 km2 and ranges in elevation from 947 to 1,105 m, while the catchment upstream of SRA is 18.0 km2 and ranges in elevation from 952 to 1,748 m. The MAP ranges between 350 mm at the lower elevations and 570 mm at the higher elevations (PRISM Climate Group, 2013); while MAT is 22°C and can range between 6° and 38°C (US Climate Data).
Nine study sites are located on the Huachuca Mountains near Sierra Vista, Arizona and form part of the San Pedro River Basin (AI ≤ 0.65). The study sites are located along 3 distinct elevations in 3 canyons: Huachuca Canyon and Garden Canyon which are located within the Fort Huachuca Army Post; and Ramsey Canyon, within the Nature Conservancy's Ramsey Canyon Preserve. These sites have MAP ranging from 430 mm at the lower elevations to 750 mm at the higher elevations, while temperatures range from 1° to 34°C, with MAT of 17°C. The lowest elevation monitoring reaches (HP, GP, and RP) are piedmont semi-consolidated alluvial channels at 1,453–1,533 m in elevation and have MAP ranging from 430 mm to 580 mm. The HP, GP and RP catchments are the smallest (1.3, 0.5, and 0.3 km2, respectively), and have stream channel densities similar to those of the alluvial sites that range between 2.4 and 6.3 km km−2. Three lower canyon monitoring reaches (HL, GL, and RL) range between 1,539 and 1,592 m in elevation and are incised streams with non-cohesive alluvial banks that have MAP− ranging between 520 and 650 mm.
Finally, three upper canyon monitoring reaches (HU, GU, and RU) are located at 1,582–1,726 m in elevation and are on cohesive bedrock with moderate alluvium present. These sites have MAP ranging from 590 to 750 mm. Both, the lower and upper canyon sites have the lowest stream channel densities of all the study sites and have the highest catchments elevations, from 2,533 to 2,798 m. To further complement our data set, we coupled our monitoring data to USGS data (http://waterdata.usgs.gov) from 3 from discharge (Q) gauges, #09471310, #09470800, and #09470750 located in the Upper Huachuca Canyon (HU_USGS) Upper Garden Canyon (GU_USGS) and Upper Ramsey Canyon (RU_USGS), respectively. In all cases, except Upper Ramsey Site that was coincident with our study reach, the other gauges are located in close proximity of the upper canyon reaches (HU and GU), within 2 km (Huachuca) and 5 km (Garden), and their catchments are similar in elevation, size, and stream channel density (Table 1, Figure 1).
Precipitation Data
We obtained monthly precipitation from the nearest tipping bucket gauge available to each monitoring reach. For sites BGA and SWA in the Barry M. Goldwater Air force range, we used precipitation data from the Maricopa Alert System Gauge #71000 at Sauceda Wash (http://alert.fcd.maricopa.gov/alert/Google/v3/gmap.html#), located at the outlet of the SWA. For sites SSA and SRA in the Santa Rita experimental Range, we used a dense network of precipitation data from long term research station monitoring tipping bucket rain gauges (24 total within and near the catchment) (http://ag.arizona.edu/SRER/data.html) and for the sites in the Huachuca Mountains, we used seven gauges located in or near Fort Huachuca. Fort Huachuca data were processed and provided by Lainie Levick and Russ Scott from the USDA-ARS-SWRC in Tucson, AZ (Levick et al., 2015). We estimated the total volume of precipitation to each catchment over a annual time by multiplying the precipitation depth over the annual period of time by the catchment area.
Streamflow and Surface Water Presence
At each of the study washes, we selected a monitoring stream reach of 200 m in length. At each reach, we established three cross-sectional transects 100 m apart and characterized the channel geometry, including channel slope using GPS and differential surveying. We installed electrical resistance sensors (TidbiT v2 UTBI-001 data logger, Onset Corporation, Bourne, MA) at the thalweg of each cross-sectional transect to identify surface water presence frequency and duration, with the exception of the high elevation Ramsey Canyon site (RU), which is classified as a sensitive area. The electrical resistance sensors were temperature sensors modified as outlined in Blasch et al. (2002), with 2 electrical leads exposed; and we followed the method outlined by Jaeger and Olden (2012) to identify the onset and cessation of runoff. In brief, the onset of runoff is marked by the sudden and rapid increase in the relative electrical conductivity (EC) signal to a less negative or a positive number, while the termination of streamflow is also marked by a similarly sudden shift in the EC signal back to a more negative signal (Figure 2). In this study, EC = −94 indicates dry conditions. The sensors logged an EC signal every 10 min. We quantified the percent of streamflow at each monitoring transect (streamflowtransect) as follows:
where nstreamflow is the number of “streamflow” signals, or instances of sudden and clear shift in EC to a more positive number indicative of streamflow as illustrated in Figure 2 over a period of time t, and ntotal is the total number of EC observations made during that same time period. The site % streamflow was estimated by averaging the % streamflowtransect for each stream reach.
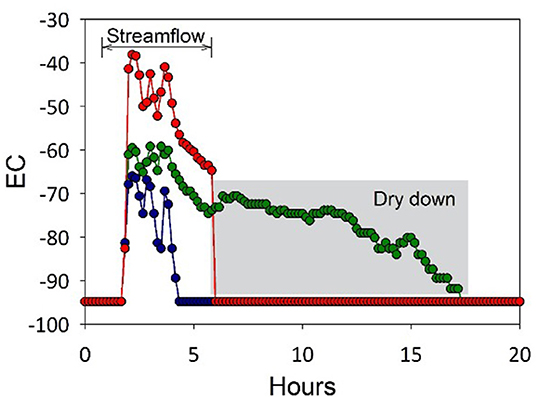
Figure 2. Typical electrical conductivity (EC) profile for a runoff event at a monitoring reach. Each data set (red, green, and blue) represents a different sensor at a single reach. The onset of runoff is marked by a rapid increase in EC (red and blue). The end of streamflow can be identified by either EC returning to −94, the baseline reading, or by an inflection in the rate of change in EC to a less steep slope, indicative of soil drying conditions (green).
We were able to quantify the duration of surface water presence as moist soil or ponded water because the EC signal for runoff is distinct from that of a moist soil and soil-drying conditions (Blasch et al., 2002; Jaeger and Olden, 2012). In contrast to the streamflow presence signal, the surface water presence signal has a distinct inflection point that marks a shift from a steep EC signal recession to a less steep EC signal recession (Figure 2). We quantified the % surface water presence at each transect (% water presencetransect) as:
where nwater_presence is the number of “surface water presence” signals, or instances of sudden and clear shift in EC from streamflow to a water ponding or soil drying signal as illustrated in Figure 2 over a period of time t. Because it is difficult to distinguish EC signals indicative of water ponding from soil moisture presence, here we define all EC signals indicative of water presence, including streamflow, as “water presence.” We were interested in identifying maximum length of time that water might be present in the stream either as ponded water, shallow soil water or streamflow available for biological activity, therefore we used the maximum % water presencetransect observed at each monitoring reach as the reach % water presence. We treated data from USGS gauges in a similar manner where if the instantaneous discharge (Q, liters per second) > threshold, then signal = “streamflow.” Because stream gauge data can be noisy at low Q, we used stage-discharge curves generated using the published USGS data (http://waterdata.usgs.gov) to determine “noise” threshold where Q < 0.3 liters per second = “no flow” where 0.3 liters per second is ~ 10 times below typical velocity rating limit of 2.8 liters per second (Turnipseed and Sauer, 2010). Here we assumed that surface water presence was at minimum the same as streamflow presence for all USGS gauges. Finally, we estimated the ratio of percent annual water presence to percent annual streamflow presence (AWP:ASFP).
Channel Sediment Physical Characteristics
We collected channel sediment samples from 0 to 10 cm depth to determine bulk density and substrate texture at each of the three cross-sectional transects. We used the pipette method for particle size analyses to determine % sand, % silt, % clay (Day, 1965) and soil texture of the channel sediments. We estimated bulk density in g cc−1 using a modified cavity method (Grossman and Reinsch, 2002) in which the soil mass of a 8 cm diameter circle was excavated to 10 cm with a trowel. We determined the volume by lining the void with a plastic bag and filling it with water. Soils collected from this void were then sieved (2 mm), dried for soil moisture, and weighed for mass to determine the fraction of fine earth <2 mm. Particle density was assumed to be 2.65 g/cm3. Soils for bulk density were not treated to remove organic carbon or carbonates. Data for channels are also reported in Lohse et al. (2020b) but also include other landscape positions; see design in Lohse et al. (2020a), and data are available in Lohse et al. (2020c).
Saturated Hydraulic Conductivity and Infiltration
We used bulk density and soil texture to estimate the saturated hydraulic conductivity (Ksat) of the bed sediment at each monitoring transect using Rosetta pedotransfer functions (Schaap and Leij, 2000). We estimated the infiltration depth, I, over time t as follows:
Where(1-rvf) is the volume of the soil sample, including the rock and void volume normalized to 1, minus the rock volume fraction; and tsf is the duration of streamflow estimated using the EC sensors over a period of time t. We estimated the total catchment potential infiltration (Imax−catchment) by multiplying the infiltration depth by the total catchment stream channel length and the channel width. We repeated this process for every monitoring transect so that for each catchment we had 3 distinct estimates of Imax−catchment. Our infiltration estimates assume that every streamflow event the entire stream channel contributed to infiltration and that the stream geometry remained constant during the study period. We estimated the fraction of the catchment that is comprised of stream channels (fCAstreams) by dividing the product of the total catchment stream channel length and channel width by the catchment area. We repeated this process for every monitoring transect so that for each catchment we had 3 distinct estimates of fCAstreams. Finally, we estimated the ratio of Imax−catchment to total precipitation over the observation period to evaluate the total channel infiltration in channels relative to total precipitation received. We acknowledge these are first-order estimates of infiltration as presence of cobbles and boulders (> 2 mm fraction) was variable and sometimes high at sites and likely led to uncertainties in infiltration estimates; more sophisticated modeling methods are available but these approaches were beyond the scope of this study.
Comparison of Observed Streamflow and Water Presence to Modeled Streamflow Permanence
To evaluate and possibly scale up our observed results to the landscape level for the Huachuca Mountains study area, we compared our observations on streamflow duration (as measured using ER sensors) to modeled data from Levick et al. (2015) and Levick et al. (2018). In brief, Levick et al. (2018) simulated stream flow permanence using the AGWA/SWAT (Automated Geospatial Watershed Assessment Tool/Soil and Water Assessment Tool) for mapped streams in Fort Huachuca as a whole. Validation sites used by Levick et al. (2018) were data from Gallo et al. (2020), also reported in final report by Stromberg et al. (2015), and these cluster validity data indicated that only five flow types existed on Fort Huachuca. However, Levick et al. (2018) further bifurcated the classification tree into eight flow types based on additional remote sensing observations such as vegetation and channel morphology. As described more below, we did not capture the hyper-arid stream types (8 type) and their 3 and 4 types were lumped into the wet-intermittent classes given the rarity of class 3 (2% total stream reaches) (7 classes displayed). We used linear regression to determine the similarity of our two approaches for estimating stream flow permanence.
Statistical Analyses
Statistical analyses were performed using JMP 10 (Cary, NC; SAS Institute Inc.). We used non-standardized Wards Clustering Analyses (Tan et al., 2006; Sall et al., 2012) on percent annual streamflow and percent annual water presence to identify statistically distinct (p < 0.05) groups of sites with similar streamflow and water presence responses or regimes. Clusters with a Euclidian vector length > 0.93 were retained for further analyses. Using Wilcoxon non-parametric comparison of means and linear regression models (Zar, 1999), we identified differences in surface water presence and infiltration rates and volumes of each stream channel class, and patterns in how percent streamflow and water presence vary with precipitation over the monitoring period and between seasons. For the purposes of our statistical analyses, and in response to our data structure we define seasons as follows: Spring from April 1 to June 30; Summer from July 1 to September 30; Fall from October 1 to December 31; and Winter from January 1 to March 31; Summer from July 1 to September 30 captures the Arizona monsoon that officially ends Sept 30th and Winter convective storms occur from January 1 through March 31.
Results and Discussion
Annual Precipitation, Streamflow and, Water Presence Patterns
The mean annual precipitation (mean PPT) observed over our 28-month study period ranged from 97 to 456 mm across sites, with the driest sites being the alluvial sites, where the observed mean annual precipitation was < 250 mm and significantly (p < 0.5) lower than at all other sites. Across all sites, at a regional scale, precipitation varied significantly and positively with elevation (r2 = 0.74); however, we did not observe a significant correlation between precipitation and elevation at the Huachuca Mountain sites (piedmont, upper, and lower canyon). At the Huachuca Canyon sites, HP, HL, and HU, we observed lower than expected precipitation given their elevation and mean annual temperature (Table 2). Comparison of our monitoring record with MAP (PRISM Climate Group, 2013) (Table 1) indicates that these sites consistently receive less rainfall than the adjacent southeastern canyon and piedmont sites. Literature reviews show that in the mountainous Western US, spatial heterogeneity and topography can largely control localized patterns precipitation while summertime monsoonal rainfall decreases in a northward direction at the regional scale (Mock, 1996; Adams and Comrie, 1997). Therefore, it is likely that the physical location of Huachuca Canyon coupled with storm rainout result in significantly lower observed mean PPT than at the Garden and Ramsey Canyon sites. Even when accounting for precipitation differences at the Huachuca site, no significant differences in precipitation between the piedmont, lower canyon and upper canyon sites were observed, where rainfall ranged from 276 to 457 mm.
Table 2. Annual precipitation (PPT), percent annual streamflow presence (ASFP), percent annual water presence (AWP), and stream substrate characteristics including bulk density (BD) and coarse fraction by volume (%) at each monitoring reach.
Observed streamflow and stream water presence were highly variable across sites but predictable based on climatic factors and stream channel density (Figure 3). Streamflow was observed on average 21.7% of the time or 79 days in 1 year, but ranged from 0.6 to 82.4% corresponding to 2 and 301 days per year. Similarly, surface water presence was observed 35.8% of the time, or 131 days of the year, but ranged from 2.6% to >82.4% or 10 to over 301 days (Table 2). Both streamflow and surface water presence increased significantly (p < 0.05) and exponentially with MAP (Figures 3A,B), and decreased significantly and exponentially with MAT (r2 = 0.38 and 0.53, respectively) and stream channel density (Figures 3C,D). These results are consistent with conceptual frameworks of arid and semi-arid streamflow that point to a coupling of decreased precipitation, increased evaporation and evapotranspiration fluxes and increased stream channel infiltration losses as mechanisms that result in intermittent streamflow (Goodrich et al., 1997; Izbicki et al., 2000).
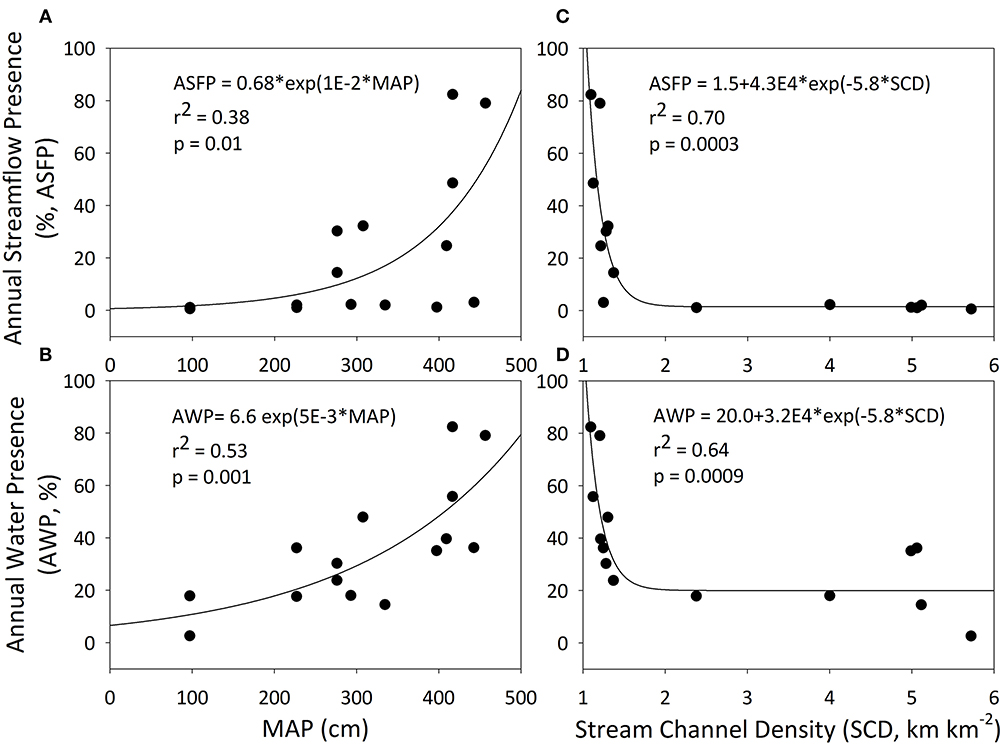
Figure 3. Regressions of percent annual streamflow presence and percent annual water presence vs. mean annual precipitation (MAP, A,B) for the observation period and stream channel density (C,D). All regressions were signficicant (p < 0.05).
Stream Flow and Water Presence Regimes
Five distinct flow and water presence regimes were identified with the clustering analyses: (1) dry-ephemeral, (2) wet-ephemeral, (3) dry intermittent, (4) wet intermittent, and (5) seasonally-intermittent (Figure 4). All alluvial and piedmont sites (Figure 1, Table 1) were classified as dry or wet ephemeral, and one lower canyon was classified as wet ephemeral. The remaining lower canyon, mid and upper canyon sites were classified as dry-, wet-, and seasonally-intermittent sites. These flow regimes align with previous work in the region that used a geomorphic classification scheme to classify ephemeral channels in alluvial and piedmont areas (Sutfin et al., 2014). The wet-ephemeral name was selected based on field surveys indicating the presence of phreatic vegetation at the sites clustering in this group (Stromberg et al., 2017). Annual streamflow in the dry-ephemeral and wet-ephemeral clusters ranged from 0.6 to 2.0% and 1.1 to 3.4%, respectively, and was significantly lower (p < 0.05) than the intermittent and seasonally-intermittent groups (Table 3, Figure 5A), where annual streamflow ranged from 16 to 82.4%. Annual water presence at the dry-ephemeral cluster ranged from 2.6 to 17.9% and was significantly lower than in all other clusters; whereas it was highest at the wet-intermittent and seasonally-intermittent clusters, where it ranged from 47.4 to > 82.4% (Table 3, Figure 5B).
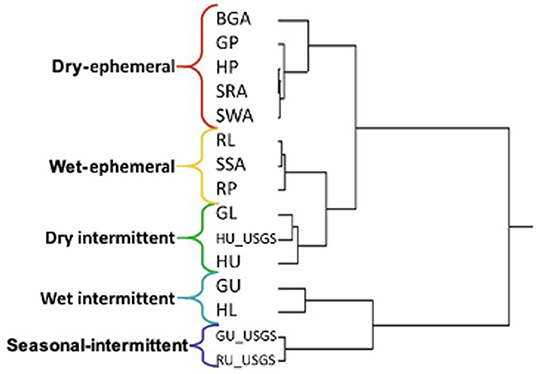
Figure 4. Clustering analysis dendrogram based on percent annual streamflow presence (ASFP) and percent annual water presence (AWP). We identified 5 statistically distinct streamflow categories.
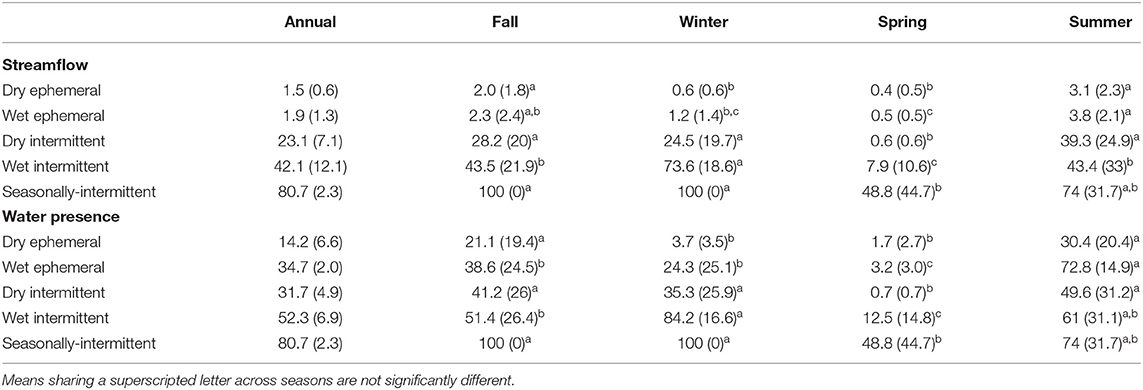
Table 3. Mean (SD) values of annual % streamflow and % water presence and monthly % streamflow and % water presence for each season.
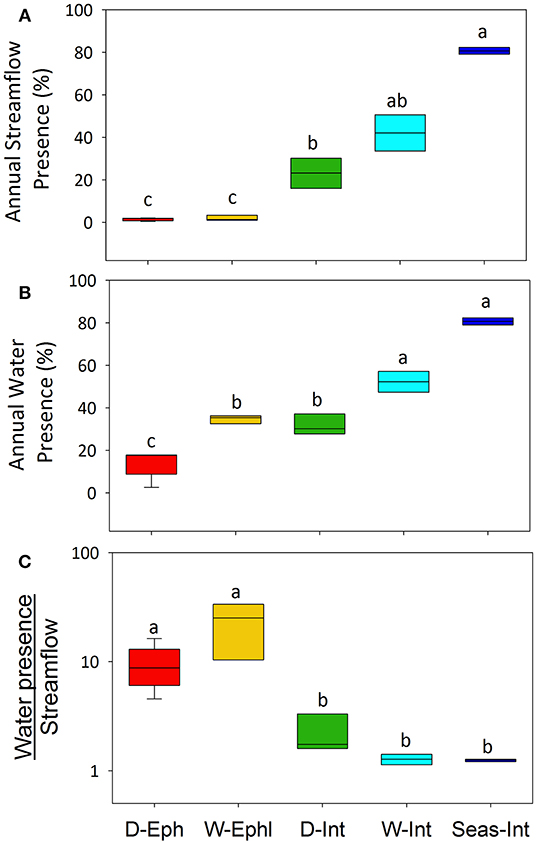
Figure 5. Box plots of (A) Percent annual streamflow; (B) Percent annual water presence and (C) ratio of water presence to streamflow across clusters. Box plots sharing a lowercase letter are not significantly different (p > 0.05).
Across sites, annual streamflow intermittency and water presence regimes varied in response to landscape characteristics and the magnitude of annual rainfall. The streamflow regime classification, the MAP and stream channel regressions (Figure 3) and the spatial MAP patterns observed suggest that landscape variables have a larger effect on streamflow and water presence regimes than annual precipitation magnitude. If the annual precipitation magnitude was the main driving mechanism controlling streamflow regimes, then all of the monitoring sites would classify according to a climate gradient, a pattern not supported by our data. For example, piedmont sites HP and GP received more rainfall during the monitoring period than the alluvial SWA and SRA, however, all classified in the “dry-ephemeral” cluster (Figure 4) due to similar annual streamflow and water presence (Table 2). Percent annual streamflow and water presence varied positively and significantly with precipitation at the dry-ephemeral, wet-ephemeral, and dry-intermittent reaches (Table 4). Annual precipitation explained the greatest fraction of the percent annual streamflow and water presence variance at the dry-ephemeral and ephemeral sites (up to 47%); 6 and 11%, respectively at the dry-intermittent sites and no correlations were observed at the wet-intermittent and seasonally-intermittent sites. These data indicate that there is a strong link between flow regime and annual precipitation magnitude, but only at the drier sites, which were the most responsive to rainfall magnitude. The absence of a correlation with annual precipitation at the wet-intermittent and seasonally-intermittent sites, which have a large fraction of annual streamflow and water presence, indicates that flow regimes are likely subsidized by subsurface water resources that discharge to the channel (Izbicki, 2007; Levick et al., 2008; Wahi et al., 2008).
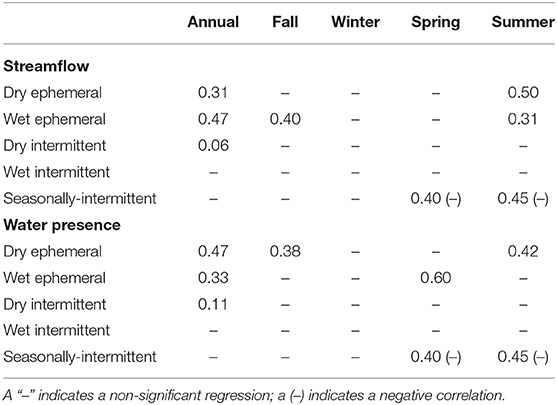
Table 4. Coefficient of determination (r2) values for significant (p < 0.05) regressions of percent streamflow and water presence vs. precipitation.
The annual water presence to streamflow presence ratio (AWP:ASFP), a measure of water availability as ponding or soil moisture, varied between 1.0 and 33.6 (Table 2), and was on average 8.5. The AWP:ASFP ratio at the dry-ephemeral and wet-ephemeral clusters ranged from 4.6 to 33.6 and was significantly higher than ratios at all other clusters where they ranged from 1.1 to 3.3 (Table 2, Figure 5C). The large ratios observed at the dry-ephemeral (mean = 9.3, SD = 4.3) and wet-ephemeral (mean = 23.0, SD = 11.8) sites indicate that water as soil moisture and/or ponds is present over 4 times longer than streamflow which has significant implications for biological processes at these dry sites (Lohse et al., 2020a). Indeed, Lohse et al. (2020a) showed that cumulative streamflow presence could explain slightly more variation in rates of litter decomposition in the washes than cumulative streamflow, especially on the dry end of the spectrum.
In arid and semi-arid systems, biological and biogeochemical processes are primarily water limited (Austin et al., 2004; Gallo et al., 2014). Water availability as soil moisture and ponds can therefore offset water demands during non-streamflow periods and extend the period of time during which biologically mediated processes can occur (McCluney and Sabo, 2009; Allen et al., 2014). Indeed, a number of studies show that biogeochemical processes such as respiration and organic matter mineralization can continue under low matric potentials (Carbone et al., 2008; Lohse et al., 2020a). Therefore, we expect biological activity to continue for an extended period of time following streamflow at the drier flow regimes, particularly the wet-ephemeral sites where vegetation can enhance water presence via hydraulic redistribution of water to shallow stream sediments (Naumburg et al., 2005).
Temporal Dynamics
Despite differences in precipitation across years and a large degree of variability in the magnitude of mean monthly streamflow and water presence throughout the monitoring period, generalized patterns of streamflow and water presence/absence were consistent between study years (Figure 6). Streamflow and water presence varied differently with the temporal distribution of precipitation within each flow regime group (Figure 7). While a clear bimodal distribution of rainfall was observed, this was not the case for streamflow and water presence across flow regimes (Figures 7A–C, Table 3). The spring months were the driest, with mean precipitation depths of up to 5 mm, accounting for the lowest gains in cumulative annual precipitation (Figure 7D). Similar to streamflow patterns described by Ajami et al. (2011) in Santa Catalina Mountains in semi-arid southern Arizona, this period also had the statistically lowest streamflow and water presence across sites and flow regimes (Table 3), and therefore had no significant increase in cumulative streamflow and water presence (Figures 7E,F).
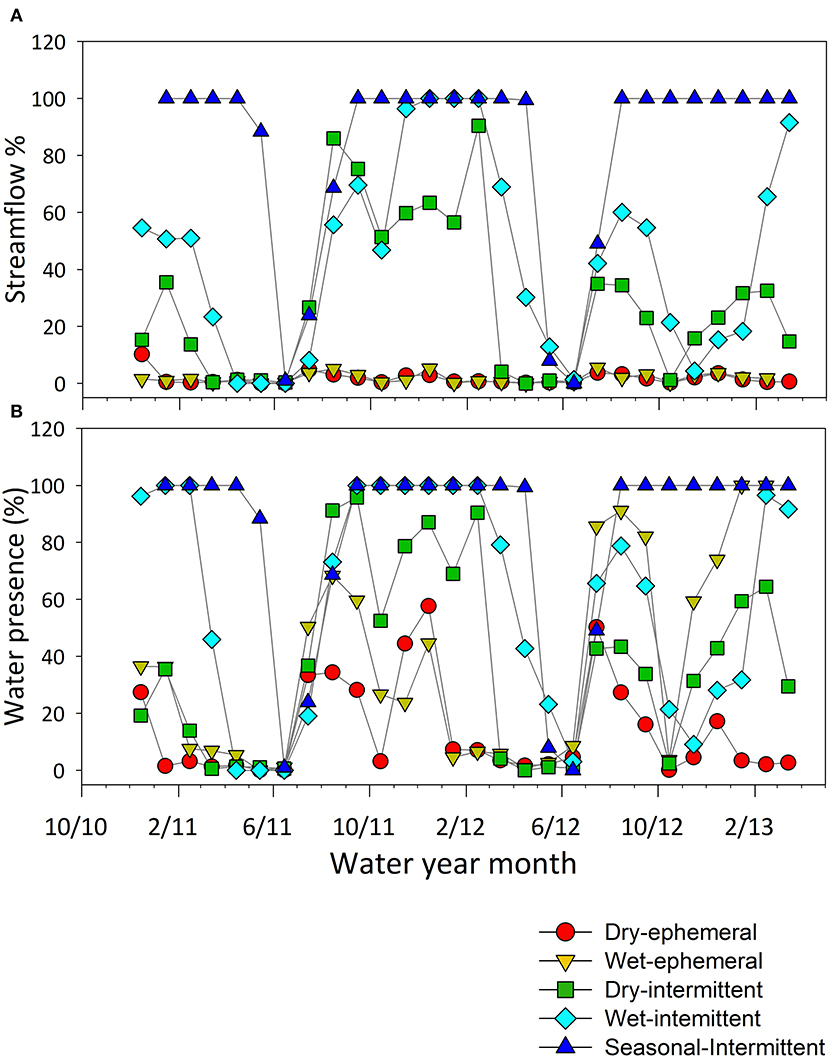
Figure 6. (A) Mean monthly percent streamflow and (B) mean monthly percent water presence across streamflow classes over the monitoring period. Calendar year 2011 had greater % streamflow and water presence than calendar year 2012, during which the fall drying period was more drastic.
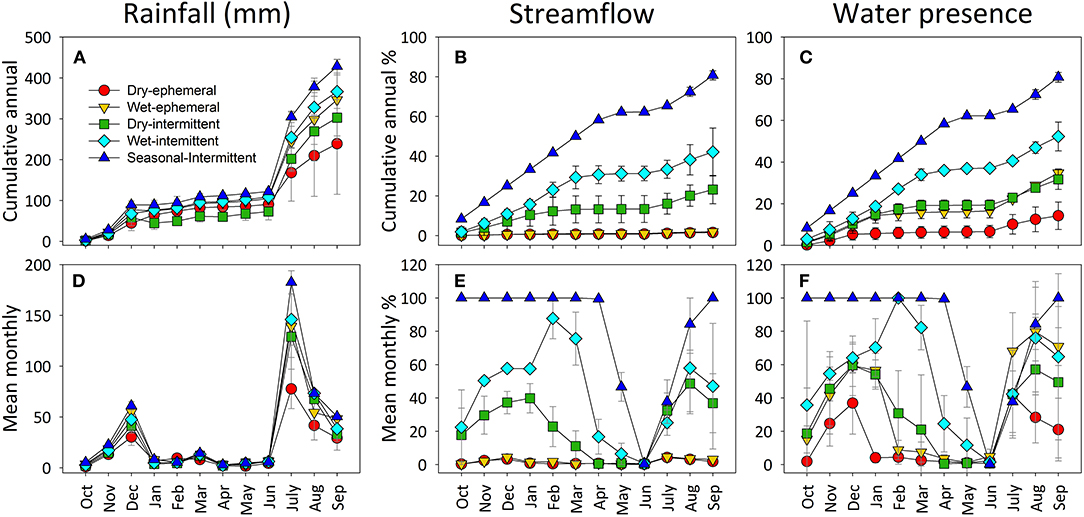
Figure 7. Cumulative (A) monthly rainfall (mm), (B) cumulative monthly percent streamflow presence, (C) cumulative monthly percent water presence, and (D) mean monthly rainfall (mm), (E) mean monthly percent streamflow presence and (F) mean monthly percent water presence for each stream flow cluster class. Bars are standard deviation.
We expected streamflow and water presence to be of longer duration during the summer (July, August and September) and fall (October, November and December), when precipitation was statistically highest, averaging 220 and 64 mm, respectively, and accounting for 68 and 21% of annual rainfall. Surprisingly, streamflow and water presence were statistically highest during these periods only at the dry-ephemeral and wet-ephemeral sites (Table 3). Percent monthly streamflow at the dry-ephemeral sites varied positively and significantly with precipitation during the summer only; and during the summer and fall at the wet-ephemeral sites (Table 4). Similarly, percent monthly water presence varied positively and significantly with precipitation at the dry-ephemeral sites during the fall and summer, and only during the spring at the wet-ephemeral sites (Table 4). While not explicitly addressed in this study, coupling among the characteristics of seasonal precipitation, streamflow generation mechanisms and channel infiltration losses likely results in these temporal flow regime patterns (Blasch et al., 2002, 2004). For example. summertime precipitation is of high intensity and short duration, resulting in infiltration excess overland flow and rapid streamflow generation following episodic rainfall (Goodrich et al., 1997; Levick et al., 2008), which might explain the positive responses to rainfall during the summer. In contrast, winter rainfall in the region is of low intensity and long duration allowing for significant infiltration and transmission losses, and streamflow occurs in response to saturation excess overall flow and local subsurface flows after rainfall (Levick et al., 2008; Ajami et al., 2011). Finally, a variable not addressed here that warrants further study is that of antecedent moisture conditions, which is not only of great importance for biological processes (Austin et al., 2004; Belnap et al., 2005) but can significantly alter streamflow responses in water limited regions (Blasch et al., 2004; Vivoni et al., 2009; Hawkins and Ellis, 2010).
The seasonal flow regime patterns observed at the canyon sites in the dry-intermittent, wet-intermittent and seasonally-intermittent flow regimes point toward geologic and subsurface connectivity controls on stream flow. Despite the larger magnitude of summer time rainfall, streamflow and water presence at the dry-intermittent sites did not significantly vary between the summer, fall and winter; while at the wet-intermittent sites the highest streamflow and water presence occurred during the winter (Table 3). We did not observe any seasonal responses to precipitation in the dry and wet-intermittent flow regimes. In contrast, streamflow and water presence at the seasonally-intermittent sites were greatest during the fall and winter and varied significantly and inversely with precipitation during the summer and spring (Table 4). Within the context of generalized mountain block hydrology conceptual models and geochemical evidence of studies in the region (Eastoe et al., 2004; Wilson and Guan, 2004; Wahi et al., 2008; Ajami et al., 2011), it is likely that the streamflow and water presence observed at these canyon sites is sourced from discharge and subsurface flow of water stored within the fractured bedrock matrix. Finally, the flow regimes patterns at these canyon sites appear to be buffered in the short term from varying climate, suggesting that biological riparian and stream channel processes relying on soil moisture might be more resilient to climate change and potential shifts in the regional timing of precipitation.
Saturated Hydraulic Conductivity and Potential Infiltration
The Ksat estimates were high and wide ranging, from a reach average of 235–961 cm day−1; while potential infiltration depths varied between < 1 and 941 m per year (Table 2). Our potential infiltration estimates also assumed that infiltration occurs every time streamflow occurs. Therefore, it is not surprising that annual potential infiltration depths were significantly higher at the wet-intermittent and seasonally-intermittent sites, which have the greatest streamflow, than at the dry-ephemeral and wet-ephemeral sites (Table 2, Figure 8A), which have the lowest streamflow. Surprisingly, the fraction of the catchment that can contribute to channel infiltration is statistically greatest at the dry-ephemeral sites, where it varied from 0.8 to 4.2% (Figure 8B). The potential annual infiltration to annual PPT ratio (I:PPT), assuming that only 50% of the stream substrate contributes to infiltration, ranged from 0.1 to 8.7; whereas the ratio varied from 0.2 to 14.8 assuming that the entire stream channel contributes to infiltration (Table 2, Figure 8C). The potential annual infiltration to precipitation ratio was significantly lower at the dry-ephemeral and ephemeral sites (0.1–2.9), and was highest at the wet-intermittent and seasonally-intermittent sites (3.6–17.3, Figure 8C). Our infiltration depth estimates assume only a vertical flux, no lower boundary condition and that whole channel contributes to infiltration; however, in reality it is difficult to know exactly the fraction of the channel substrate that contributes to infiltration. However, low potential infiltration to precipitation ratios, particularly if we assume that only 30–50% of channel contributes to infiltration so that I:P < 1.5, indicate that streamflow is primarily generated by rainfall at the driest sites. High ratios at the canyon sites provide further evidence of subsurface connectivity resulting in groundwater discharge and vadose zone water contribution consistent with mountain system recharge and streamflow generation mechanisms described in generalized conceptual models (Wilson and Guan, 2004; Wahi et al., 2008; Ajami et al., 2011).
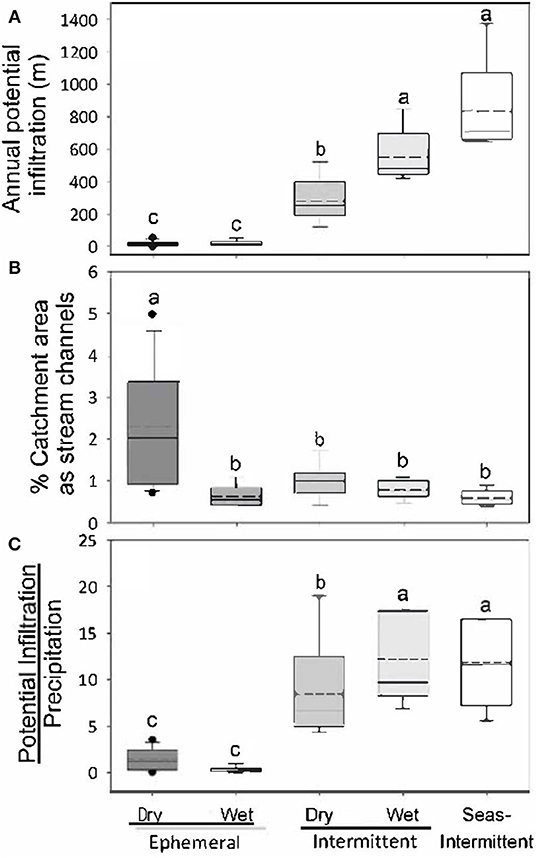
Figure 8. Box plots of (A) Annual infiltration depth for each flow cluster; (B) percent of catchment that is comprised of stream channels and (C) ratio of total annual potential infiltration to precipitation assuming that the entire stream channel bed contributes to infiltration. Box plots dashed lines denote means, solid lines denote medians. Boxplots with distinct lowercase letters have significantly (p < 0.05) different means.
Comparison of Observed Streamflow and Water Presence to Modeled Streamflow Permanence
Results of linear regression showed a high correspondence between our field-based approach for determining stream flow permanence and the modeling approach taken by Levick et al. (2018) for the Huachuca Mountains (r2 = 0.76–0.86, Figure 9). We acknowledge that the duration of the monitoring period was limited to 28 months, and further study is merited to evaluate these patterns. However, the agreement of two independently derived stream classifications, our study based on field stream flow presence data that represented two fairly typical seasonal rainy seasons across a diverse gradient of sites and Levick et al. (2018), who modeled stream flow based on 2005–2012 precipitation inputs, channel characteristics, and vegetation lend support that our classification is reasonable.
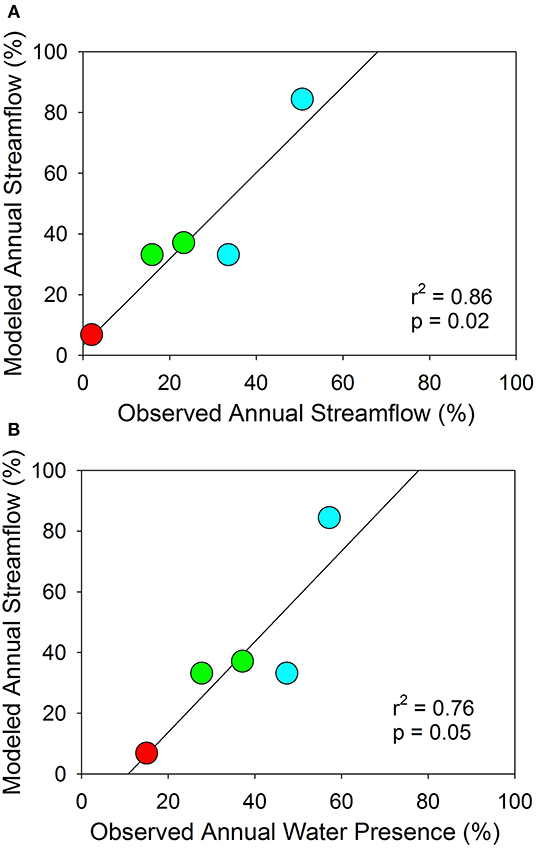
Figure 9. (A) Observed annual streamflow (this study) vs. modeled annual streamflow from Levick et al. (2018) and (B) Observed annual water presence (this study) vs. modeled annual streamflow from Levick et al. (2018).
Given the high correspondence between the two methods, we generated a landscape-scale map of the modeled stream flow using seven categories based on the number of days per year the stream is flowing. We then overlaid our study sites (Stromberg sites) on this map (Figure 10). This map indicates that our field sampling in the Huachuca Mountains captured most, but not all, of the hydrological stream types present at Fort Huachuca. Notably, our sampling did not capture the many hyper-ephemeral sites distal from the mountains. In addition, the dry-ephemeral channels on piedmont surfaces were too small to be captured by Levick et al. (2018) and thus could be overlooked by hydrological models. Collectively these findings indicate generalizable patterns in stream flow permanence that may be applied to other regions. Future research will need to fill in hyper-ephemeral sites as these were not captured in our observation efforts.
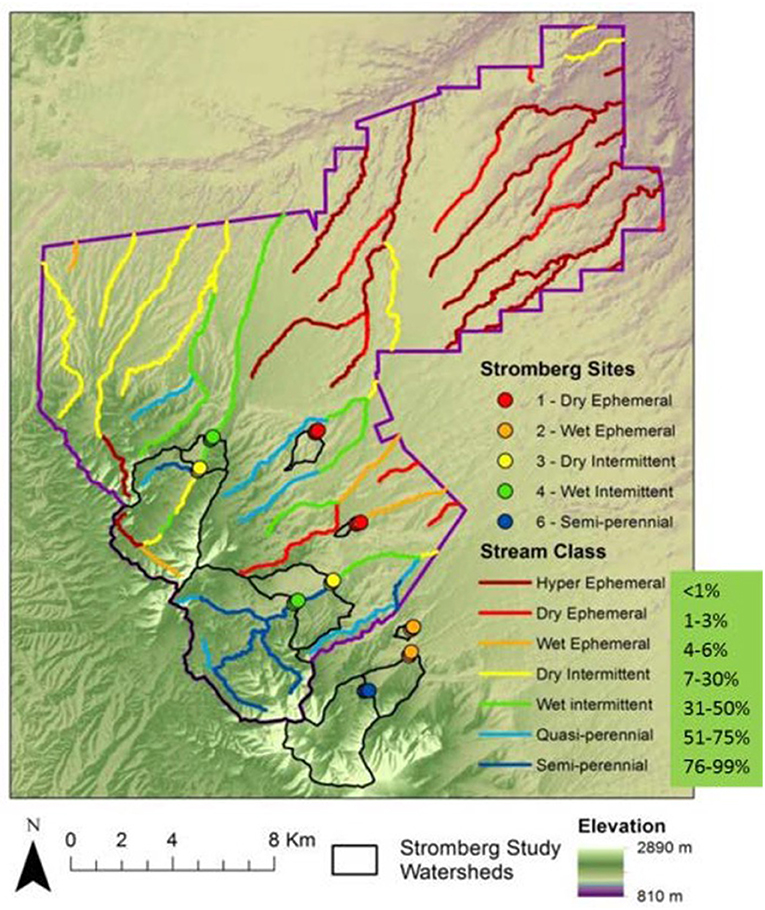
Figure 10. Mapping of observed stream classifications (this study -labeled Stromberg Sites) compared to Levick et al. (2018). We note that hyper ephemeral streams were not captured by our classification scheme and Levick et al. (2018) 3 and 4 types were lumped into the wet-intermittent classes given the rarity of class 3 (2% total stream reaches) such that only 7 classes are displayed.
Conclusions
We quantified streamflow and stream water presence in streams exhibiting temporary flow across a wide climate gradient and showed a coupling of landscape characteristics and the magnitude and timing of rainfall in controlling flow regimes. We found that at a regional scale, stream channel density is a better predictor of streamflow and water presence than rainfall alone. Based on the percent of time streamflow and water presence occurred at our sites we identified 5 statistically distinct flow regimes: (1) dry-ephemeral, (2) wet-ephemeral, (3) dry-intermittent, (4) wet-intermittent, and (5) seasonally-intermittent. We showed that water availability as soil moisture and/or surface ponds can be 4–33 times greater than the duration of streamflow at the driest sites, which has important implications for biogeochemical processes. With regards to responses to rainfall, we showed that each of the flow regime groups has a distinct response to the magnitude and temporal distribution of rainfall. All but one group, the seasonally-intermittent group, exhibit a bimodal streamflow and water presence distribution, similar to that of the regional rainfall. The most responsive sites to rainfall were the dry-ephemeral and wet-ephemeral sites, where rainfall could account for up to 50% of streamflow and 60% of water presence; while flow regimes in the intermittent sites did not vary with seasonal rainfall. The infiltration estimates, specifically, the ratio of infiltration to rainfall, indicate that streamflow at the driest sites likely occurs in response to rainfall and overland flow; whereas groundwater discharge and upwelling may also contribute to streamflow at the wetter. This study highlights the high degree of variability in streamflow regimes at the regional scale and across a climate gradient. Our data suggests that wetter sites might be overall better buffered against shifts in the timing and distribution of precipitation in response to climate change. However, we also suggest that additional studies identify the land cover characteristics that have the greatest impact in flow regimes, particularly in the drier sites, where streamflow is highly sensitive to rainfall.
Data Availability Statement
The datasets generated for this study can be found in online repositories. The names of the repository/repositories and accession number(s) can be found at: BSU ScholarWorks (doi: 10.18122/boisestate/reynoldscreek/17 and doi: 10.18122/reynoldscreek/19/boisestate).
Author Contributions
TM, HN, and EG conceived and designed the hydrologic study. HN, EG, and TM performed the data collection. EG and HN analyzed the data. EG and TM contributed new methods to the paper, and EG drafted the manuscript. EG, TM, and KL reviewed and revised the manuscript, and KL prepared and revised the manuscript for publication. All authors contributed to the article and approved the submitted version.
Funding
This study was funded by the Department of Defense Strategic Environmental Research and Development Program (SERDP) project number RC-1726. Partial support to EG for analysis and writing was supported by NSF EPSCOR IIA-1301792 and to KL by NSF EAR 1331872.
Conflict of Interest
The authors declare that the research was conducted in the absence of any commercial or financial relationships that could be construed as a potential conflict of interest.
Acknowledgments
We acknowledge the contributions of Julie Stromberg at Arizona State University who conceived the overall SERDP project, assisted with design of the study, and compiled the final report to SERDP (Stromberg et al., 2015). Model output was contributed from SERDP project number RC-1727 (Levick et al., 2015). We thank Jason Silvertooth, Allison Peterson, Curtis Miles, Shane Clark, and Chris Ferlin for assistance in the field and laboratory, and Barry M. Goldwater Air Force Base, Fort Huachuca Army Post, and Nature Conservancy Ramsey Canyon Preserve for access to sites.
References
Adams, D. K., and Comrie, A. C. (1997). The North American monsoon. Bull. Am. Meteorol. Soc. 78, 2197–2214. doi: 10.1175/1520-0477(1997)078<2197:TNAM>.0.CO;2
Ajami, H., Meixner, T., Maddock, T., Hogan, J. F., and Guertin, D. P. (2011). Impact of land-surface elevation and riparian evapotranspiration seasonality on groundwater budget in MODFLOW models. Hydrogeol. J. 19, 1181–1188. doi: 10.1007/s10040-011-0743-0
Allen, D. C., McCluney, K. E., Elser, S. R., and Sabo, J. L. (2014). Water as a trophic currency in dryland food webs. Front. Ecol. Environ. 12, 156–160. doi: 10.1890/130160
Austin, A. T., Yahdjian, L., Stark, J. M., Belnap, J., Porporato, A., Norton, U., et al. (2004). Water pulses and biogeochemical cycles in arid and semiarid ecosystems. Oecologia 141, 221–235. doi: 10.1007/s00442-004-1519-1
Baillie, M. N., Hogan, J. F., Ekwurzel, B., Wahi, A. K., and Eastoe, C. J. (2007). Quantifying water sources to a semiarid riparian ecosystem, San Pedro River, Arizona. J. Geophys. Res. Biogeosci. 112:G03S02. doi: 10.1029/2006JG000263
Belnap, J., Welter, J. R., Grimm, N. B., Barger, N., and Ludwig, J. A. (2005). Linkages between microbial and hydrologic processes in arid and semiarid watersheds. Ecology 86, 298–307. doi: 10.1890/03-0567
Besbes, M., Delhomme, J. P., and De Marsily, G. (1978). Estimating recharge from ephemeral streams in arid regions: a case study at Kairouan, Tunisia. Water Resour. Res. 14, 281–290. doi: 10.1029/WR014i002p00281
Biederman, J. A., Harpold, A. A., Gochis, D. J., Ewers, B. E., Reed, D. E., Papuga, S. A., et al. (2014). Increased evaporation following widespread tree mortality limits streamflow response. Water Resour. Res. 50, 5395–5409. doi: 10.1002/2013WR014994
Blasch, K., Ferré, T., and Vrugt, J. (2010). Environmental controls on drainage behavior of an ephemeral stream. Stochastic Environ. Res. Assess. 24, 1077–1087. doi: 10.1007/s00477-010-0398-8
Blasch, K. W., Ferré, T. P. A., Christensen, A. H., and Hoffmann, J. P. (2002). New Field method to determine streamflow timing using electrical resistance sensors. Vadose Zone J. 1, 289–299. doi: 10.2136/vzj2002.2890
Blasch, K. W., Ferré, T. P. A., and Hoffmann, J. P. (2004). A statistical technique for interpreting streamflow timing using streambed sediment thermographs. Vadose Zone J. 3, 936–946. doi: 10.2136/vzj2004.0936
Blasch, K. W., Ferre, T. P. A., Hoffmann, J. P., and Fleming, J. B. (2006). Relative contributions of transient and steady state infiltration during ephemeral streamflow. Water Resour. Res. 42:W08405. doi: 10.1029/2005WR004049
Callegary, J. B., Leenhouts, J. M., Paretti, N. V., and Jones, C. A. (2007). Rapid estimation of recharge potential in ephemeral stream channels using electromagnetic methods, and measurements of channel and vegetation characteristics J. Hydrol. 344, 17–31. doi: 10.1016/j.jhydrol.2007.06.028
Carbone, M. S., Winston, G. C., and Trumbore, S. E. (2008). Soil respiration in perennial grass and shrub ecosystems: linking environmental controls with plant and microbial sources on seasonal and diel timescales. J. Geophys. Res. Biogeosci. 113:G02022. doi: 10.1029/2007JG000611
Cataldo, J., Behr, C., Montalto, F., and Pierce, R. (2010). Prediction of transmission losses in ephemeral streams, western U.S.A. Open Hydrol. J. 4, 19–34. doi: 10.2174/1874378101004010019
Coes, A. L., and Pool, D. R. (2005). Ephemeral-Stream Channel and Basinfloor Infiltration and Recharge in the Sierra Vista Subwatershed of the Upper San Pedro Basin, Southeastern Arizona. US Geological Survey Open-File Report 2005–1023. doi: 10.3133/ofr20051023
Constantz, J. (1982). Temperature dependence of unsaturated hydraulic conductivity of two soils. Soil Sci. Soc. Am. J. 466–470. doi: 10.2136/sssaj1982.03615995004600030005x
Constantz, J., Tyler, S. W., and Kwicklis, E. (2003). Temperature-profile methods for estimating percolation rates in arid environments. Vadose Zone J. 2, 12–24. doi: 10.2136/vzj2003.1200
Datry, T., Larned, S. T., and Tockner, K. (2014). Intermittent rivers: a challenge for freshwater ecology. Bioscience 64, 229–235. doi: 10.1093/biosci/bit027
Day, P. R. (1965). “Particle fractionation and particle-size analysis,” in Methods of Soil Analysis, ed C. A. Black (Madison, Wisconsin: American Society of Agronomy, Inc.), 545–567. doi: 10.2134/agronmonogr9.1.c43
Dowman, V. C. E., Ferré, T. P. A., Hoffmann, J. P., Rucker, D. F., and Callegary, J. B. (2003). Quantifying ephemeral streambed infiltration from downhole temperature measurements collected before and after streamflow. Vadose Zone J. 2, 595–601. doi: 10.2136/vzj2003.5950
Eastoe, C., Gu, A., and Long, A. (eds.). (2004). The Origins, Ages and Flow Paths of Groundwater in Tucson Basin: Results of a Study of Multiple Isotope Systems. Washington, DC: American Geophysical Union. doi: 10.1029/009WSA12
Gallo, E. L., Lohse, K. A., Brooks, P. D., Ferlin, C., and Meixner, T. (2014). Physical and biological controls on trace gas fluxes in semi-arid urban ephemeral waterways. Biogeochemistry. 121:189–207. doi: 10.1007/s10533-013-9927-0
Gallo, E. L., Meixer, T., Lohse, K. A., and Nicholas, H. (2020). Dataset for Estimating Surface Water Presence and Streamflow of Ephemeral and Intermittent Streams in Southwest US. (Boise: Boise State University ScholarWorks). doi: 10.18122/reynoldscreek/19/boisestate
Goodrich, D. C., Kepner, W. G., Levick, L. R., and Wigington, P. J. Jr. (2018). Southwestern intermittent and ephemeral stream connectivity. J. Am. Water Resour. Assoc. 54, 400–422. doi: 10.1111/1752-1688.12636
Goodrich, D. C., Lane, L. J., Shillito, R. M., Miller, S. N., Syed, K. H., and Woolhiser, D. A. (1997). Linearity of basin response as a function of scale in a semiarid watershed. Water Resour. Res. 33, 2951–2965. doi: 10.1029/97WR01422
Goodrich, D. C., Williams, D. G., Unkrich, C. L., Hogan, J. F., Scott, R. L., Hultine, K. R., et al. (2004). “Comparison of methods to estimate ephemeral channel recharge, walnut gulch, San Pedro River Basin, Arizona,” in Groundwater Recharge in a Desert Environment: The Southwestern United States, eds H. J. Phillips and B. Scanlon (New York, NY: Water and Science Application 9, American Geophysical Union), 77–99. doi: 10.1029/009WSA06
Grossman, R. B., and Reinsch (2002). “Bulk density and linear extensibility,” in Methods of Soil Analysis. Part 4. Physical Methods, eds J. H. Dane and C. Topp (Madison, WI: Soil Science Society of America), 201–225.
Hawkins, T. W., and Ellis, A. W. (2010). The dependence of streamflow on antecedent subsurface moisture in an arid climate. J. Arid. Environ. 74, 75–86. doi: 10.1016/j.jaridenv.2009.07.003
Izbicki, J. A. (2007). Physical and temporal isolation of mountain headwater streams in the western mojave desert, southern california1. J. Am. Water Resources Association 43, 26–40. doi: 10.1111/j.1752-1688.2007.00004.x
Izbicki, J. A., Radyk, J., and Michel, R. L. (2000). Water movement through a thick unsaturated zone underlying an intermittent stream in the western Mojave Desert, southern California, USA. J. Hydrol. 238, 194–217. doi: 10.1016/S0022-1694(00)00331-0
Jaeger, K. L., and Olden, J. D. (2012). Electrical resistance sensor arrays as a means to quantify longitudinal connectivity of rivers. River Res. Appl. 28, 1843–1852. doi: 10.1002/rra.1554
Kampf, S. K., Faulconer, J., Shaw, J. R., Sutfin, N. A., and Cooper, D. J. (2016). Rain and channel flow supplements to subsurface water beneath hyper-arid ephemeral stream channels. J. Hydrol. 536, 524–533. doi: 10.1016/j.jhydrol.2016.03.016
Larned, S. T. T D, Arscott, D. B., and Tockner, K. (2010). Emerging concepts in temporary-river ecology. Freshw. Biol. 55, 717–738. doi: 10.1111/j.1365-2427.2009.02322.x
Leenhouts, J. M., Stromberg, J. C., and Scott, R. L. (Eds.) (2006). Hydrologic requirements of and consumptive groundwater use by riparian vegetation along the San Pedro River, Arizona. U.S. Geological Survey Scientific Investigations Report 2005-5163, 154.
Levick, L., Fonseca, J., Goodrich, D., Hernandez, M., Semmens, D., Stromberg, J., et al. (2008). The Ecological and Hydrological Significance of Ephemeral and Intermittent Streams in the Arid and Semi-arid American Southwest. Tucson, AZ: U.S. Environmental Protection Agency and USDA/ARS Southwest Watershed Research Center.
Levick, L., Hammer, S., Lyon, R., Murray, J., Birtwistle, A., Goodrich, D. C., et al. (2015). An Ecohydrological Approach to Managing Intermittent and Ephemeral Streams on Department of Defense Lands in the Southwestern United States in: SERDP Project RC-1727. Alexandria, VA: Department of Defense Strategic Environmental Research and Development Programme.
Levick, L., Hammer, S., Lyon, R., Murray, J., Birtwistle, A., Guertin, P., et al. (2018). An ecohydrological stream type classification of intermittent and ephemeral streams in the southwestern United States. J. Arid Environ. 155, 16–35. doi: 10.1016/j.jaridenv.2018.01.006
Lohse, K. A., Gallo, E. L., and Meixner, T. (2020a). Influence of Climate and Duration of Stream Water Presence on Rates of Litter Decomposition and Nutrient Dynamics in Temporary Streams and Surrounding Environments of Southwestern USA. Frontiers in Waters, 2. doi: 10.3389/frwa.2020.571044
Lohse, K. A., Gallo, E. L., and Meixner, T. (2020b). Dataset on Soil Physio-Chemical Properties and Seasonal Moisture and Nutrient Dynamics in Temporary Stream Channels and Contributing Uplands in Arizona, USA. Boise, ID: Boise State University ScholarWorks. doi: 10.18122/boisestate/reynoldscreek/17
Lohse, K. A., Gallo, E. L., and Meixner, T. (2020c). Dataset on Rates of In-Situ Litter Decomposition Across a Range of Ephemeral to Seasonally- Intermittent Stream Reaches and Landscape Positions in Arizona, USA. Boise, ID: Boise State State ScholarWorks. doi: 10.18122/boisestate/reynoldscreek/18
McCluney, K. E., and Sabo, J. L. (2009). Water availability directly determines per capita consumption at two trophic levels. Ecology 90, 1463–1469. doi: 10.1890/08-1626.1
Mock, C. J. (1996). Climatic Controls and Spatial Variations of Precipitation in the Western United States. J. Clim. 9, 1111–1125. doi: 10.1175/1520-0442(1996)009<1111:CCASVO>2.0.CO;2
Naumburg, E., Mata-gonzalez, R., Hunter, R. G., McLendon, T., and Martin, D. W. (2005). Phreatophytic vegetation and groundwater fluctuations: a review of current research and application of ecosystem response modeling with an emphasis on great basin vegetation. Environ. Manage 35, 726–740. doi: 10.1007/s00267-004-0194-7
Newman, B. D., Wilcox, B. P., Archer, S. R., Breshears, D. D., Dahm, C. N., Duffy, C. J., et al. (2006). Ecohydrology of water-limited environments: a scientific vision. Water Resour. Res. 42:W06302. doi: 10.1029/2005WR004141
PRISM Climate Group (2013). Oregon State University. Available online at: http://prism.oregonstate.edu (accessed 10, 2013).
Sall, J., Lehman, A., Stephens, M. L., and Creighton, L. (2012). JMP Start Statistics: A Guide to Statistics and Data Analysis Using JMP. Cary, NC: SAS Institute.
Schaap, M. G., and Leij, F. J. (2000). Improved prediction of unsaturated hydraulic conductivity with the mualem-van genuchten model. Soil Sci. Soc. Am. J. 64, 843–851. doi: 10.2136/sssaj2000.643843x
Scott, R. L., Cable, W. L., and Hultine, K. R. (2008). The ecohydrologic significance of hydraulic redistribution in a semiarid savanna. Water Resour. Res. 44:W02440. doi: 10.1029/2007WR006149
Sorman, A. U., and Abdulrazzak, M. J. (1993). Infiltration-recharge through wadi beds in arid regions. Hydrol. Sci. J. 38, 173–186. doi: 10.1080/02626669309492661
Stromberg, J., Gallo, E., Lohse, K., Meixner, T., Moody, E., Sabo, J., et al. (2015). Structure and Function of Ephemeral Streams in the Arid and Semiarid Southwest: Implications for Conservation and Management (Project RC-1726). Alexandria, VA: Department of Defense Strategic Environmental Research and Development Program).
Stromberg, J., Setaroa, D., Gallo, E., Lohse, K., and Meixner, T. (2017). Riparian vegetation of ephemeral streams. J. Arid. Environ. 138, 27–37. doi: 10.1016/j.jaridenv.2016.12.004
Stromberg, J. C., Hazelton, A. F., and White, M. S. (2008). Plant species richness in ephemeral and perennial reaches of a dryland river. Biodivers. Conserv. 18:663. doi: 10.1007/s10531-008-9532-z
Sutfin, N. A., Shaw, J. R., Wohl, E. E., and Cooper, D. J. (2014). A geomorphic classification of ephemeral channels in a mountainous, arid region, southwestern Arizona, USA. Geomorphology 221, 164–175. doi: 10.1016/j.geomorph.2014.06.005
Tan, P. N., Steinbach, M., and Kumar, V. (2006). “Cluster analysis: basic concepts and algorithms,” in Introduction to Data Mining, ed P. N. Tan (New York, NY: Pearson Addison-Wesley), 478–568.
Thornthwaite, C. (1948). An approach toward a rational classification of climate. Geogr. Rev. 38, 55–94. doi: 10.2307/210739
Tillman, F. D., Cordova, J. T., Leake, S. A., Thomas, B. E., and Callegary, J. B. (2011). “Water availability and use pilot; methods development for a regional assessment of groundwater availability, southwest alluvial basins, Arizona,” in U.S. Geological Survey Scientific Investigations Report 2011, Reston, VA. doi: 10.3133/sir20115071
Turnipseed, D. P., and Sauer, V. B. (2010). Discharge Measurements at Gaging Stations: U.S. Geological Survey Techniques and Methods Book 3, 87. doi: 10.3133/tm3A8
US Geological Survey (2008) National Hydrography Dataset (ver. 2 USGS National Hydrography Dataset (NHD). Available online at: https://www.usgs.gov/core-science-systems/ngp/national-hydrography/access-national-hydrography-products (accessed October 23 2019).
Vivoni, E. R., Tai, K., and Gochis, D. J. (2009). Effects of initial soil moisture on rainfall generation and subsequent hydrologic response during the North American Monsoon. J. Hydrometeorol. 10, 644–664. doi: 10.1175/2008JHM1069.1
Wahi, A. K., Hogan, J. F., Ekwurzel, B., Baillie, M. N., and Eastoe, C. J. (2008). Geochemical quantification of semiarid mountain recharge. Groundwater 46, 414–425. doi: 10.1111/j.1745-6584.2007.00413.x
Keywords: ephemeral streamflow, flow regime, arid, semi-arid, stream hydrology, surface water
Citation: Gallo EL, Meixner T, Lohse KA and Nicholas H (2020) Estimating Surface Water Presence and Infiltration in Ephemeral to Intermittent Streams in the Southwestern US. Front. Water 2:572950. doi: 10.3389/frwa.2020.572950
Received: 15 June 2020; Accepted: 12 October 2020;
Published: 27 November 2020.
Edited by:
Tim Scheibe, Pacific Northwest National Laboratory (DOE), United StatesReviewed by:
Stefan Julich, Technische Universität Dresden, GermanyMikolaj Piniewski, Warsaw University of Life Sciences, Poland
Copyright © 2020 Gallo, Meixner, Lohse and Nicholas. This is an open-access article distributed under the terms of the Creative Commons Attribution License (CC BY). The use, distribution or reproduction in other forums is permitted, provided the original author(s) and the copyright owner(s) are credited and that the original publication in this journal is cited, in accordance with accepted academic practice. No use, distribution or reproduction is permitted which does not comply with these terms.
*Correspondence: Kathleen A. Lohse, a2xvaHNlQGlzdS5lZHU=