 Jane D. Fudyma
 Rosalie K. Chu
 Nathalia Graf Grachet
 James C. Stegen
 Malak M. Tfaily
- 1Department of Environmental Science, The University of Arizona, Tucson, AZ, United States
- 2Pacific Northwest National Laboratory, Richland, WA, United States
A critical component of assessing the impacts of climate change on watershed ecosystems involves understanding the role that dissolved organic matter (DOM) plays in driving whole ecosystem metabolism. The hyporheic zone—a biogeochemical control point where ground water and river water mix—is characterized by high DOM turnover and microbial activity and is responsible for a large fraction of lotic respiration. Yet, the dynamic nature of this ecotone provides a challenging but important environment to parse out different DOM influences on watershed function and net carbon and nutrient fluxes. We used high-resolution Fourier-transform ion cyclotron resonance mass spectrometry to provide a detailed molecular characterization of DOM and its transformation pathways in the Columbia river watershed. Samples were collected from ground water (adjacent unconfined aquifer underlying the Hanford 300 Area), Columbia river water, and its hyporheic zone. The hyporheic zone was sampled at five locations to capture spatial heterogeneity within the hyporheic zone. Our results revealed that abiotic transformation pathways (e.g., carboxylation), potentially driven by abiotic factors such as sunlight, in both the ground water and river water are likely influencing DOM availability to the hyporheic zone, which could then be coupled with biotic processes for enhanced microbial activity. The ground water profile revealed high rates of N and S transformations via abiotic reactions. The river profile showed enhanced abiotic photodegradation of lignin-like molecules that subsequently entered the hyporheic zone as low molecular weight, more degraded compounds. While the compounds in river water were in part bio-unavailable, some were further shown to increase rates of microbial respiration. Together, river water and ground water enhance microbial activity within the hyporheic zone, regardless of river stage, as shown by elevated putative amino-acid transformations and the abundance of amino-sugar and protein-like compounds. This enhanced microbial activity is further dependent on the composition of ground water and river water inputs. Our results further suggest that abiotic controls on DOM should be incorporated into predictive modeling for understanding watershed dynamics, especially as climate variability and land use could affect light exposure and changes to ground water essential elements, both shown to impact the Columbia river hyporheic zone.
Introduction
Climate changes such as rising temperatures, more frequent extreme storms and changes in season precipitation rates are expected to have a profound impact on biogeochemical cycling within hydrological systems (i.e., rivers, lakes, and streams). Dissolved organic matter (DOM) plays an essential role in watershed ecosystem energy budgets as it can drive whole-ecosystem metabolic processes (Yamashita et al., 2011; Adrian et al., 2016). DOM quality and composition are influenced by new plant and soil inputs into water systems, biotic, and abiotic processing in these systems and overall hydrological transportation controls (Watts et al., 2001), the majority of which may be altered in the future by a changing climate (Ritson et al., 2014). Abiotic (e.g., light, temperature) and biotic (e.g., microbial, enzymatic) factors can transform DOM to either more or less bio-available forms (He et al., 2016; Lønborg et al., 2018; Bowen et al., 2019) with follow-on effects across river corridor food webs (Graham et al., 2019). Further, perturbations to the rates and types of DOM introduced into watersheds from climate variability and land use can impact the extent of abiotic and biotic degradation, subsequently influencing CO2 emissions to the atmosphere. For instance, prolonged exposure of DOM to sunlight can produce more bioavailable forms of DOM to microorganisms, thus influencing microbial respiration rates (Ward et al., 2017). At the same time, changes in the climate could induce changes in cloud cover and storm intensities. Recently, Young et al. (2019) showed that human-induced temperature changes were accompanied by an increase in cloudiness over northern Scandinavia, which in turn has reduced the impact of warming. Similarly, the increase in the frequency and intensity of extreme weather events induced by climate change can promote erosion and enhance turbidity in watersheds driven by increased distribution of suspended sediment along the river (Chen and Chang, 2019). The increase in cloud cover and turbidity could reduce abiotic degradation of DOM by sunlight. Similarly, land use can affect the rate in which inorganic compounds are introduced into watershed systems that can either hinder microbial interactions with DOM (Newbold et al., 2006) or enhance nutrient turnover (Johnson et al., 2009), resulting in the transport of more labile substrates across watersheds that can heighten microbial activity elsewhere. In terms of the hyporheic zone, the biogeochemically active zone in hydrological systems, the degree of DOM degradability and composition of ground and river water inputs can thus strongly influence microbial hyporheic communities and lotic respiration as a whole. Parsing DOM differences between these regions (ground water, river water, hyporheic zone) is critical to understanding biogeochemical cycling and net fluxes through integrated river systems.
The hyporheic zone is an important ecosystem control point (Bernhardt et al., 2017) where ground water and river water mix (Boulton et al., 1998; White et al., 2015; Wohl, 2015). DOM plays an especially important role in the hyporheic zone, and its origins and bioavailability have been extensively shown to drive microbial activity and organic matter turnover in these control points (i.e., hyporheic zones). (Wagner et al., 2014; Stegen et al., 2016, 2018; Stern et al., 2017). Due to the physical nature of how river and ground water interact, plant and soil organic matter and microorganisms from different ecosystems are introduced into the hyporheic zone at different rates, temperature, and flow gradients are connected, organic matter composition is diversified, and oxygenation is accelerated, which can provide terminal electron acceptors for microbial metabolic processes and stimulate microbial activity (Boano et al., 2014; Merill and Tonjes, 2014). As such, the hyporheic zone can contribute to over 90% of river system respiration (Naegeli and Uehlinger, 1997). Previous studies have provided exhaustive insight on many of the complex interactions between physical, chemical, and biological processes that impact hyporheic zone ecology and hydrology. Flow and transport processes (Sophocleous, 2002; Boano et al., 2014; Fasching et al., 2016), geologic factors (Naiman et al., 2000; Kasahara and Wondzell, 2003; Hester and Doyle, 2008; Banks et al., 2019), water and redox chemistry (Briggs et al., 2015; Kaufman et al., 2017), microbial population dynamics (Clinton et al., 2010; Nogaro et al., 2013; Wagner et al., 2014; Graham et al., 2016), and their overlapping interactions (Stegen et al., 2016, 2018; Hou et al., 2017) can all change the rates of substrate degradation and transformation within the hyporheic zone. Further, altered metabolism of hyporheic zone organisms and their transformed byproducts can consequently affect the productivity of both the river and ground water systems it interacts with, as well as downstream ecological processes (Boulton et al., 2010).
Earth System Models (ESMs) continue to evolve as field-based observations necessitate increasing conceptual complexity (Burd et al., 2016); for example, the acknowledgment that terrestrial-aquatic interfaces are highly active zones of DOM transformation has created a knowledge gap because the dynamic mechanisms by which DOM is transformed in these zones remain under constrained. Reaction transport models (RTMs) are a powerful tool for simulating DOM transformation mechanisms by integrating thermodynamics, kinetics, and multidimensional transport in a process-based framework. Incorporation of omics data including metabolomics into RTMs has been identified as a key new direction in the development of RTM capabilities for understanding critical zone processes (Li et al., 2017) as it can reveal new geochemical signatures that are currently undefined in watersheds. Recently, gene expression data coupled with metabolomics data, helped uncover new reactive components of DOM that represent a previously unidentified and likely sizable portion of marine organic carbon and sulfur cycling (Durham et al., 2015). Based on these and other examples, molecular datasets from across watersheds will likely uncover an intricate web of chemical–biological interactions that can be used to improve predictions of hydro-biogeochemical function in response to disturbance. While microbial and DOM cycling reactions have been to some extent incorporated into RTMs to provide a more realistic framework for simulating DOM turnover, the great complexity of possible organic reactions and microbial redox makes full parameterization difficult (Lawrence et al., 2014). Therefore, characterizing the most critical reactions for DOM turnover and mineralization will be highly useful to identify reactions for incorporation into RTM modeling frameworks.
Here, we used high resolution Fourier-transform ion cyclotron resonance mass spectrometry (FTICR-MS) to provide an in-depth characterization of DOM chemical composition and molecular signature of the Columbia River hyporheic zone and its ground water and river constituents. Previous research of this region (Stegen et al., 2016, 2018) found that mixing of ground water with river water stimulates respiration at the Columbia river hyporheic zone. The low dissolved organic carbon concentration in ground water protects thermodynamically favorable carbon (C) from decomposition and allows it to accumulate. At the same time, the recalcitrant nature of river water DOM protects it from microbial oxidation, allowing it to accumulate in river water. Mixing of ground water and river water removes these protection mechanisms in both systems and stimulates aerobic respiration [dissolved organic carbon (DOC) to CO2] at the hyporheic zone. Yet, information about DOM molecular signatures in both river water and ground water systems, their overlap within the hyporheic zone as well as the different chemical transformations by which DOM is being degraded and transformed in these systems is still a significant knowledge gap. Providing insight into these signatures and mechanisms will help clarify how microorganisms influence and are influenced by DOM composition in the hyporheic zone. Here, we build upon this research to further understand (1) DOM molecular signatures (i.e., DOM character) in both river water and ground water systems and their overlap within the hyporheic zone, (2) how do DOM compositional differences in river water and ground water further explain the current established understanding of biogeochemical cycling in the hyporheic zone, and (3) the different chemical transformations (biotic and abiotic) or reactions by which DOM is being degraded and transformed in these systems. This knowledge is crucial for disentangling the organic matter drivers in hydrologic ecosystems and how those relate to broader biogeochemical processes. High-resolution chemical composition data, and the detailed properties of organic matter and degradation pathways outlined in this research, can reveal patterns of conserved reaction-scale processes and provide information that can be used in numerical hydro-biogeochemical and reaction transport models to improve predictions of hydro-biogeochemical function in response to disturbance. Resulting enhancements to predictive capacity will be important for accurately forecasting the ecological consequences of ongoing global environmental change. Once these in-depth interactions are explained, a better understanding of biogeochemical cycling and dynamics in watershed systems can be established.
Materials and Methods
Field Sampling
Samples were collected as previously described in Stegen et al. (2016). Briefly, samples were collected from four ground water wells (GW) (adjacent unconfined aquifer underlying the Hanford 300 Area-sediment porosity of ~0.20 and hydraulic conductivity of ~7,000–8,000m per day), Columbia river water (RW), and its hyporheic zone (HZ) (sediment porosity of ~0.18 and hydraulic conductivity of ~1–4 m per day) (Figure 1; Supplementary Table 1). The hyporheic zone was sampled at five locations (named p2, p3, p4, p5, and p6, respectively where p stands for “piezometer”) at multiple depths (“1” represents shallow depths and “6” represents deeper sampling depths—Supplementary Table 1) to capture spatial heterogeneity within the hyporheic zone using a custom-built multi-level sampling device installed with stainless steel piezometers; 1.2 m screen length and 5.25 cm inside diameter (MAAS Midwest, Huntley, IL). The five sampled piezometers were not meant to be replicates but were assumed to capture different physical features of the hyporheic zone to provide access to a broader range of mixing conditions. Ground water contribution to hyporheic zone water increased with piezometer location number as shown by substantial variation in Cl− concentration within hyporheic zone samples (Supplementary Table 1, with p2 having lowest Cl−/least ground water and p5 having highest Cl− concentration/highest ground water); Cl− concentration was used as a conservative tracer.
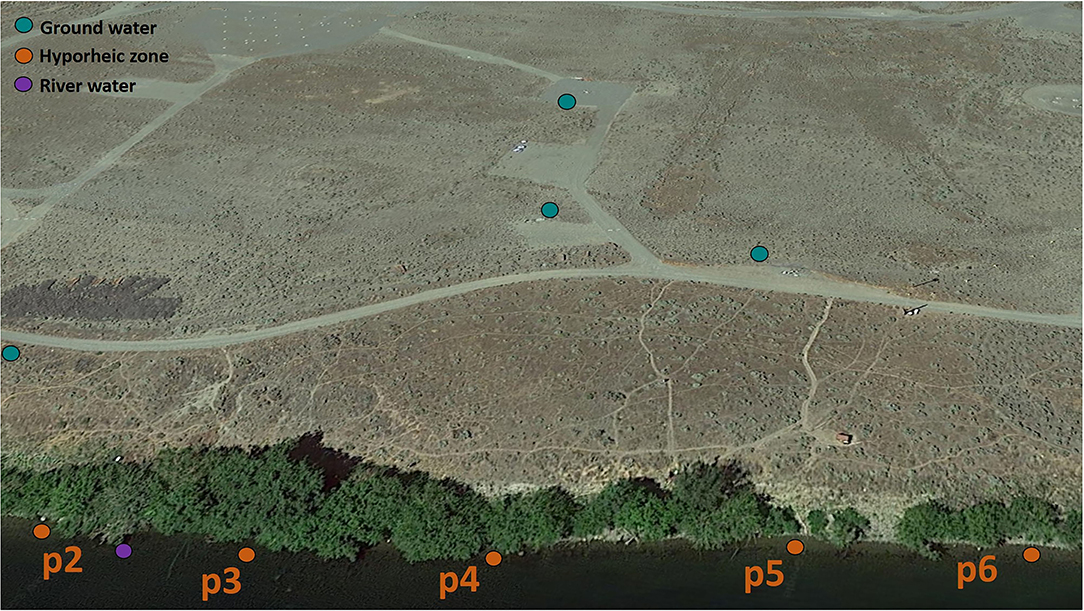
Figure 1. Sampling schematic within the Hanford field sampling site (Google Earth, earth.google.com/web/) of the Ground water, River water, and Hyporheic zone. Piezometer 6 was sampled within the depth intervals of ~1–11 and ~41–51 cm whereas piezometers 2–5 were sampled within the depth intervals of ~10–20 and 110–120 cm.
Ground water was sampled from four wells across the top of the subsurface aquifer and river water was sampled near the piezometers. Samples from all the listed locations (5 × hyporheic zone, 4 × ground water, and 1 × river) were collected at four-time intervals (A-D) in November 2013 across ~ 1 week, relating to different river level stages as outlined in Stegen et al. (2016). River stage was monitored ~300 m downstream of the field sampling locations using a pressure transducer coupled to a CR1000 data logger (Campbell Scientific Inc., for both). Within the week of 11/17/2013–11/25/2013, river elevation fluctuated between 104.6 and 105.8 m. The four time points that were chosen for sampling represented short-term fluctuations caused by up-river flow regulation at the Priest Rapids dam. Time intervals A and D were low river stage (river elevation was ~104.8 m and 104.6 m, respectively) and time intervals B and C were high river stage (river elevation was ~105.2 m and 105.4 m, respectively). As such the four time intervals described above will be referred to: stage A, stage B, stage C, and stage D. Temporal fluctuations in the river stage can cause variation in the degree of ground water–surface water mixing, which in turn changes the resource environment experienced by hyporheic zone microbial community. Water from the hyporheic zone and the river were sampled using a peristaltic pump and the subsurface aquifer was sampled using submersible pumps; all systems were purged—the equivalent of at least three volumes—before sample collection. At each location, pumped water passed through 0.22 μm polyethersulfone Sterivex filters (Millipore Co., Billerica, MA) for either ~30 min or until 10 L had passed through a filter, whichever came first; sampled volume ranged from 1.33 to 10 L. Samples for FTICR-MS analysis were filtered and collected into 40 ml borosilicate vials and frozen at – 20°C. Monthly climatological data summaries, as well as other information, are available at the following two links: https://www.hanford.gov/page.cfm/hms and https://www.hanford.gov/files.cfm/Nov20131.pdf. Briefly, for the month of November 2013, the average daily temperature within the Hanford 300 Area ranged between −5° and 12°C, with warmer temperatures the first 20 days of the month (average maximum of 12°C) followed by a significant drop toward the end of the month (average maximum of −5°C). The total water equivalence was around 9 mm with only 4 days of rain. Ten days in the month of November were cloudy with an average sky cover metric, defined as the average sky cover between sunrise and sunset in tenths of sky covered, of 10 (100%) meaning clouds covered the entire sky for that day. During the week when the samples were collected, the sky cover was very low with relatively high observed daily shortwave radiation (solrad) [~187.2 langleys per day (ly/d)]. For objectives 1 and 2, we combined the data for each system (GW, HZ, and RW) from all staging events and regardless of location. For objective 3, we are distinguishing between the five different locations within the hyporheic zone. More details are included below.
FTICR-MS Data Acquisition
A 12 Tesla Bruker SolariX FTICR spectrometer located at EMSL, a DOE-BER national user facility located in Richland, WA, was used to collect high resolution mass spectra of the DOM water samples by direct injection, as previously described in Tfaily et al. (2018). Approximately, 100 μl of water was mixed with methanol (1:2) before injection onto the mass spectrometer to enhance ionization. Briefly, a standard Bruker ESI source was used to generate negatively charged molecular ions and then samples were introduced directly to the ESI source. The instrument was externally calibrated weekly to a mass accuracy of <0.1 ppm using a tuning solution from Agilent, which contains the following compounds: C2F3O2, C6HF9N3O, C12HF21N3O, C20H18F27N3O8P3, and C26H18F39N3O8P3 with a mass-to-charge ratio (m/z) ranging between 112 and 1,333. The instrument settings were optimized by tuning on a Suwannee River Fulvic Acid (SRFA) standard. Blanks (HPLC grade MeOH) were ran at the beginning and the end of the day to monitor potential carry over from one sample to another and the instrument was flushed between samples using a mixture of water and methanol. The ion accumulation time (IAT) varied to account for differences in C concentration between samples. One hundred and forty-four individual scans were averaged for each sample and internally calibrated using OM homologous series separated by 14 Da (-CH2 groups). The mass measurement accuracy was <1 ppm for singly charged ions across a broad m/z range (i.e., 100 < m/z < 1100). The mass resolution was 350,000 at 339.112 Da. To further reduce cumulative errors, all sample peak lists for the entire dataset were aligned to each other prior to formula assignment to eliminate possible mass shifts that would impact formula assignment.
Formula and Biogeochemical Class Assignment
Putative chemical formulas were assigned using Formularity software (Tolić et al., 2017). Chemical formulas were assigned based on the following criteria: signal-to-noise (S/N) > 7, and mass measurement error <1 ppm, taking into consideration the presence of C, H, O, N, S, and P and excluding other elements. Peaks with large mass ratios (m/z values > 500 Da) often have multiple possible candidate formulas. These peaks were assigned formulas through propagation of CH2, O, and H2 homologous series. Additionally, to ensure consistent choice of molecular formula when multiple formula candidates are found the following rules were implemented: the formula with the lowest error with the lowest number of heteroatoms was consistently picked and the assignment of one phosphorus atom required the presence of at least four oxygen atoms.
Data was filtered to select for m/z with mass range of 200–900 where most peaks appeared. Compounds were then plotted on van Krevelen diagram based on their molar H:C ratios (y-axis) and molar O:C ratios (x-axis) (Kim et al., 2003). Van Krevelen diagrams provide a means to visualize and compare the average properties of organic compounds and assign compounds to the major biochemical classes (e.g., lipid-, protein-, lignin-, carbohydrate-, and condensed aromatic-like). Biochemical compound classes were reported as relative abundance values based on counts of C, H, and O for the following H:C and O:C ranges: lipids (0 < O:C ≤ 0.3 and 1.5 ≤ H:C ≤ 2.5), unsaturated hydrocarbons (0 ≤ O:C ≤ 0.125 and 0.8 ≤ H:C < 2.5), proteins (0.3 < O:C ≤ 0.55 and 1.5 ≤ H:C ≤ 2.3), amino sugars (0.55 < O:C ≤ 0.7 and 1.5 ≤ H:C ≤ 2.2), lignin (0.125 < O:C ≤ 0.65 and 0.8 ≤ H:C < 1.5), tannins (0.65 < O:C ≤ 1.1 and 0.8 ≤ H:C < 1.5), and condensed hydrocarbons (aromatics; 0 ≤ 200 O:C ≤ 0.95 and 0.2 ≤ H:C < 0.8) (Tfaily et al., 2017). Further, to disentangle essential elements and their relation to chemical class, each mass was then subsequently filtered with N>0, P>0 or S>0 and then plotted again on van Krevelen diagrams.
Compositional Data Normalization, Multivariate, and Statistical Analysis
Relative abundance of biochemical compound classes was normalized for multivariate statistical analysis by performing centered log ratio (CLR) on each sample. The CLR function of the R package compositions (van den Boogaart and Tolosana-Delgado, 2008) was used for CLR transformation. This approach allows for confident application of statistical analysis on each compositional dataset (e.g., each sample) (Aitchison, 1994; Pawlowsky-Glahn and Buccianti, 2011). Principal component analysis (PCA) was performed on all sample replicate CLR-transformed chemical class abundances. Hierarchal cluster analysis (dendogram-heatmap) of the CLR transformed abundances was used to map sample replication by class abundance as well as visualize class abundance differences as a function of each ecosystem (ground water, hyporheic zone, and river water). To determine the significance of these observed differences between organic compound class assignment abundances by location, relative abundances of ground water, hyporheic zone, and river organic compounds were subjected to Kruskal–Wallis rank sum tests. Following a significance observed by a p-value of <0.05, Dunn post-hoc tests were performed between ecosystem and chemical class composition, then coupled with box plots of compound class abundances to visualize the statistical significance between compound class groups within each system. These non-parametric tests were chosen in this study due to the low number of replicates per sample. All normalization and statistical analysis were executed in R (version 3.6.1).
Unique Mass Comparisons and Gibbs Free Energy
After checking the reproducibility of biological replicates using van Krevelen diagrams above, replicate m/z counts of each ecosystem (ground water, river water, and hyporheic zone) were combined regardless of stage or location in order to probe at the characteristics of each system rather than temporal differences. Unique peaks (i.e., peaks present in one ecosystem but not the other) were filtered as pairwise comparisons between the following groups: ground water vs. river water, ground water vs. hyporheic zone, hyporheic zone vs. river water. The unique peaks were plotted on van Krevelen diagrams, as described above, using R (version 3.6.1) to observe biochemical compound class differences. Further, Gibbs free energy (GFE) was calculated, as described previously in Boye et al. (2018), for all unique peaks assigned a molecular formula. Briefly, each assigned molecular formula was used to calculate the nominal oxidation state of C (NOSC) according to the following equation:
NOSC values were then used to calculate the GFE of each unique compound according to Equation 2. Low GFE values are an indication of compounds more thermodynamically favored to undergo metabolic and chemical reactions (i.e., available for microbial communities), whereas higher values reflect microbially degraded and transformed (i.e., recalcitrant) DOM. GFE of all unique peaks in each pairwise comparisons were then plotted using R (version 4.4.0) and a list is provided in Supplementary Table 2.
Network Analysis
To identify and contrast putative DOM transformation or decomposition pathways across different ecosystems, the mass differences between FTICR–MS peaks within each sample were compared with precise mass differences for commonly observed biochemical transformations adopted from Breitling et al. (2006). This approach is possible because of the ultra-high mass accuracy of FTICR–MS. For example, a mass of 2.0156 Da, e.g., represents a hydrogentation/dehydrogentation reaction, whereas a mass difference of 71.0371 indicates a reaction in which one alanine (C3H5NO) was lost. Within each sample, the number of times each putative transformation was observed was counted based on precise mass differences between FTICR–MS peaks. Values were then normalized based on percentage of transformation counts per sample. Transformation data were combined across ecosystem type and both multivariate (PCA) and univariate (Kruskal– Wallis, Tukey Post-Hoc) analysis were performed using MetaboAnalyst (version 4.0) to determine driving transformations of each ecosystem. A list of all significant transformations between paired groups are listed in Supplementary Table 3.
Transformation analysis data for all samples (stages A–D) were then plotted on a network analysis using MetaNetter (Burgess et al., 2017), a Cytoscape Version 3.8.0 (Shannon et al., 2003) plug-in, as described previously by Longnecker and Kujawinski (2016). Briefly, mass difference between the two m/z values resulting from a chemical transformation were demonstrated as an edge in the network, and the initial and final compounds (namely, reactant, and product) as nodes (Breitling et al., 2006; Burgess et al., 2017). For example, the gain or loss of CO2 (i.e., mass difference Δm/z = 43.9898) between two compounds would be represented as two “nodes” connected by an edge named “CO2..” For each putative transformation, there may be a series of connected m/z values, and one m/z value may be connected to other m/z values by more than one transformation. For a biochemical reaction to be considered valid by this method, both the reactant and the product should be present. Network analyzer was performed to calculate network heterogeneity of each sample. The network heterogeneity reflects the tendency of a network to contain hub nodes where a hub is a node with a number of transformations that greatly exceeds the average. Thus, higher network heterogeneity signifies a larger and more diverse rate of node connections, signifying a more transformed system (i.e., the same compound could be produced through a multitude of reactions and/or the same compound can be degraded in many different pathways). Statistical analysis (Tukey HSD) was performed on combined network heterogeneity between combined values for each ecosystem.
To further visualize differences in putative DOM transformation pathways between ground water, hyporheic zone, and river water samples, nodes were colored based on their compound class as assigned using van Krevelen diagrams. Edges were colored (1) yellow in the ground water network if they originated from H2S, , , S2, and diphosphate, (2) red in both the river water and hyporheic samples if they originated from putative abiotic transformations upregulated in the river (carboxylation, acetylation, hydroxylation, and glycoxylation), and (3) blue in the hyporheic zone samples if they originated from any of the 20 putative amino acids transformations. While this approach was applied to all samples from different stages, we only chose stage A to visually represent the differences between the HZ, river water and ground water since the differences observed in the chemical transformations between the HZ, river water and ground water in stage A were similar to those observed in stages B–D. We further distinguished between the five different locations within the hyporheic zone to see whether river stage and thus changes in ground water-river water mixing ratios can influence the quality and quantity of chemical transformations observed in the hyporheic zone.
To further confirm that the transformations observed in the hyporheic zone were not merely due to pure mixing of ground water and river water, we calculated the number of transformations that could be expected under pure transport and compared it to the transformation profile that was observed in the hyporheic zone. This approach was tested on samples collected from stage A sampling event. To do so, ground water mass spectral features from stage A were grouped together to generate one ground water peak list for stage A. Similarly, mass spectral features from all the hyporheic zone samples that were collected during stage A sampling event were grouped together to generate one hyporheic zone peak list. We eventually had three peak lists: one from river water (stage A), one for ground water (stage A), and one for the hyporheic zone (stage A). The peak lists from ground water and river water were considered pure end members. We then prepared three new peak lists using three different scenarios (i.e., three ground water-river water mixing ratios) (90%GW:10%RW, 50%GW: 50%RW, and 10%GW:90%RW) by randomly sampling from the pure end members peak list in proportion to the ground water-surface water mixing ratio. We then performed transformation analysis (as described above) on each of these three peak lists. The transformation results from these peak lists were then compared to the transformations observed at the hyporheic zone from stage A sampling event.
Kendrick Mass Defect Analysis
Samples from stage A were further analyzed independently by Kendrick mass defect analysis (Hughey et al., 2001), another useful approach for representing and comparing large molecular data sets. Kendrick mass analysis is based on rescaling each identified formula according to Equation 3. This rescaling is equivalent to assigning each mass of CH2 as 14.0000 amu instead of the International Union of Pure and Applied Chemistry (IUPAC) mass of 14.01565 amu.
Members of a homologous series (namely, compounds that contain the same heteroatom and number of rings plus double bonds, but different number of CH2 groups) have identical Kendrick mass defect (KMD). The KMD is calculated from difference between the Kendrick mass and the IUPAC nominal mass as shown in Equation 4:
Nominal Kendrick mass is determined by rounding the Kendrick mass up to the nearest whole number. A Kendrick plot is then plotted using all formulas reduced to their KMD plotted against Nominal Kendrick mass. The KMD value for any molecule increases as the oxygen content and the degree of unsaturation increase. Thus, high KMD values for any given nominal mass indicate extensive oxygenation and/or unsaturation. As a result, elemental compositions differing in the number of oxygen atoms and/or the number of double bonds (i.e., homologous species) are separated vertically due to their different KMD values.
Results
DOM Composition Is Driven by Ecosystem Type, Not River Stage
Principal component analysis (PCA) was performed on the center log ratio-transformed organic compound abundances of four sampling events from different stages in the ground water, hyporheic zone, and river ecosystems. The events were defined by different river stages, outlined Stegen et al. (2016). Three distinct groupings were observed and explained 55.7% of the organic compounds' variance (Figure 2A). Ecosystem type drove more of the variance within the data set rather than river stage during sampling event, which was shown by both the PCA clusters grouping by ecosystem not sampling time as well as the hierarchal clustering dendrogram grouping by ecosystem type (Supplementary Figure 1A). However, ground water sampled during stage C showed some similarities to the hyporheic zone composition (Figure 2A, Supplementary Figures 1A,B). This overlap could likely have to do with river stage, as it was the highest during sampling stage C, and could be due to the inland movement of hyporheic zone pore fluids. However, considering more of the variance was driven by ecosystem type, and because one of our goals was to define the overall signatures of the ecosystem rather than river stage fluctuations, we combined events (i.e., stages) for characterization of each ecosystem. However, we do recognize that river level fluctuations play an important role in hyporheic zone dynamics, thus further molecular characterization of river level influences on DOM changes should be explored in future work.
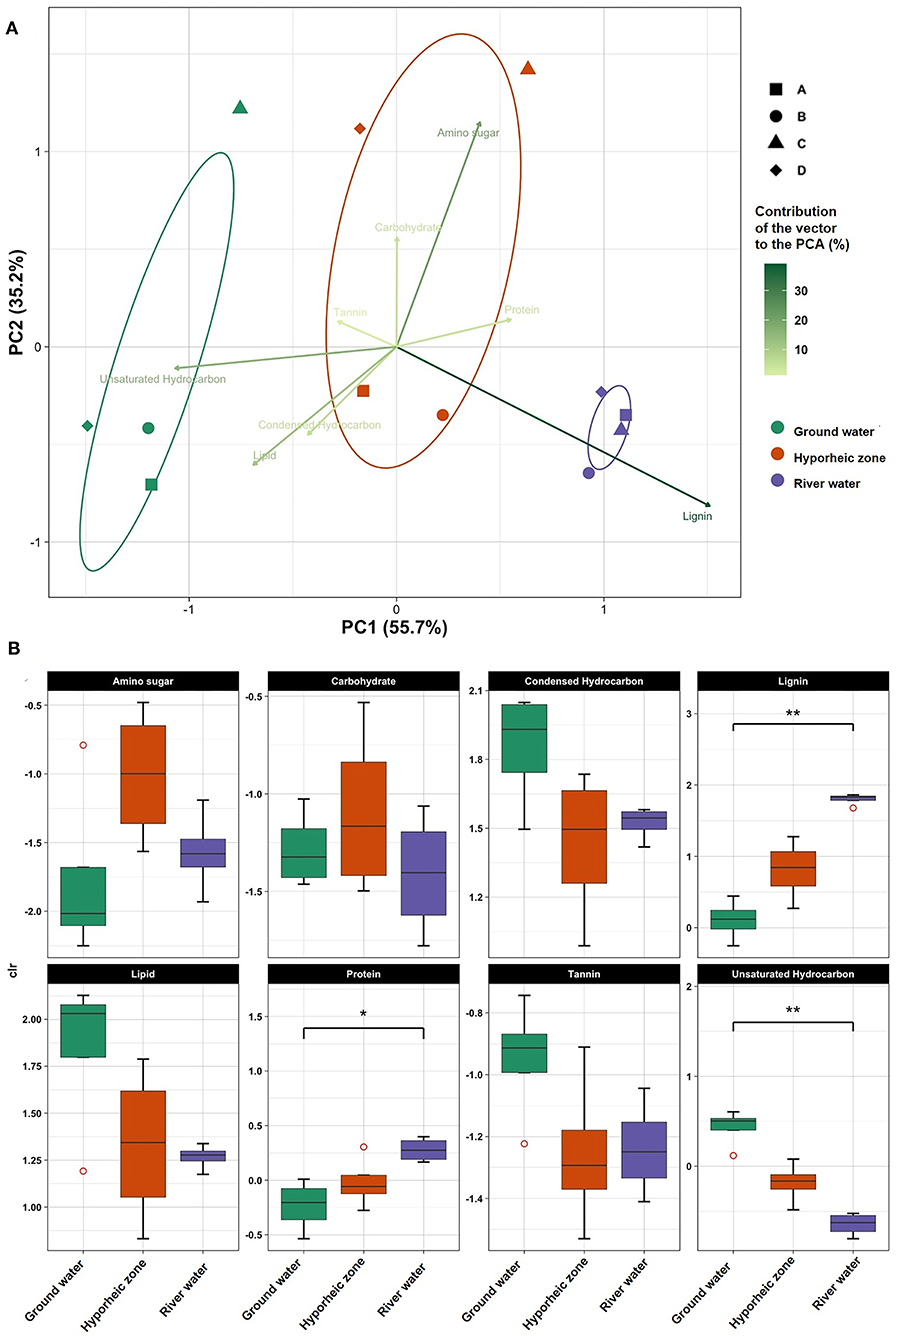
Figure 2. (A) Principle component analysis (PCA) on centered log ratio (CLR) transformed chemical class abundances in each system (ground water, hyporheic, and river water) at four-time intervals (A–D) (i.e., different river level stages) in November 2013; (B) Box plots of CLR transformed chemical class abundances in each system (ground water, hyporheic zone, and river water). Dunn post-hoc tests were performed between ecosystem and chemical class composition to visualize the statistical significance (represented by an *if p < 0.05 and **if p < 0.001).
Ground water was characterized by significantly larger abundances of unsaturated hydrocarbon- like compounds (p value = 0.0017, Supplementary Table 4), with elevated levels of lipid- and tannin- like compounds (Figure 2B). Further, a large diversity of N and S- containing compounds were observed as compared to the river, yet most were concentrated the lipid-like region (Figure 3). On the other hand, the river water contained a significantly higher abundance of both lignin- and protein-like compounds (p values = 0.0024 and 0.0107, respectively, Figure 2B, Supplementary Table 4). The river system had lower diversity of N and S containing compounds compared to the ground water, and compounds containing these elements were primarily localized to condensed hydrocarbons (Figures 3A,B). Unsurprisingly, the hyporheic zone reflected an overlap of both of its water inputs, shown by gradients in condensed hydrocarbon-, lignin-, lipid-, protein- and unsaturated hydrocarbon-like compounds (Figure 2B). However, the hyporheic zone was characterized by elevated levels of amino sugars and carbohydrates as well (Figure 2B) and an abundance of N-containing compounds in the protein- and amino sugar-like region (Figure 3A). The diversity of N, S, and P containing compounds in the hyporheic zone were overall greater than both of the ground and river water inputs (Figure 3). Both the hyporheic zone and ground water had elevated N and P compounds within the lipid-like region.
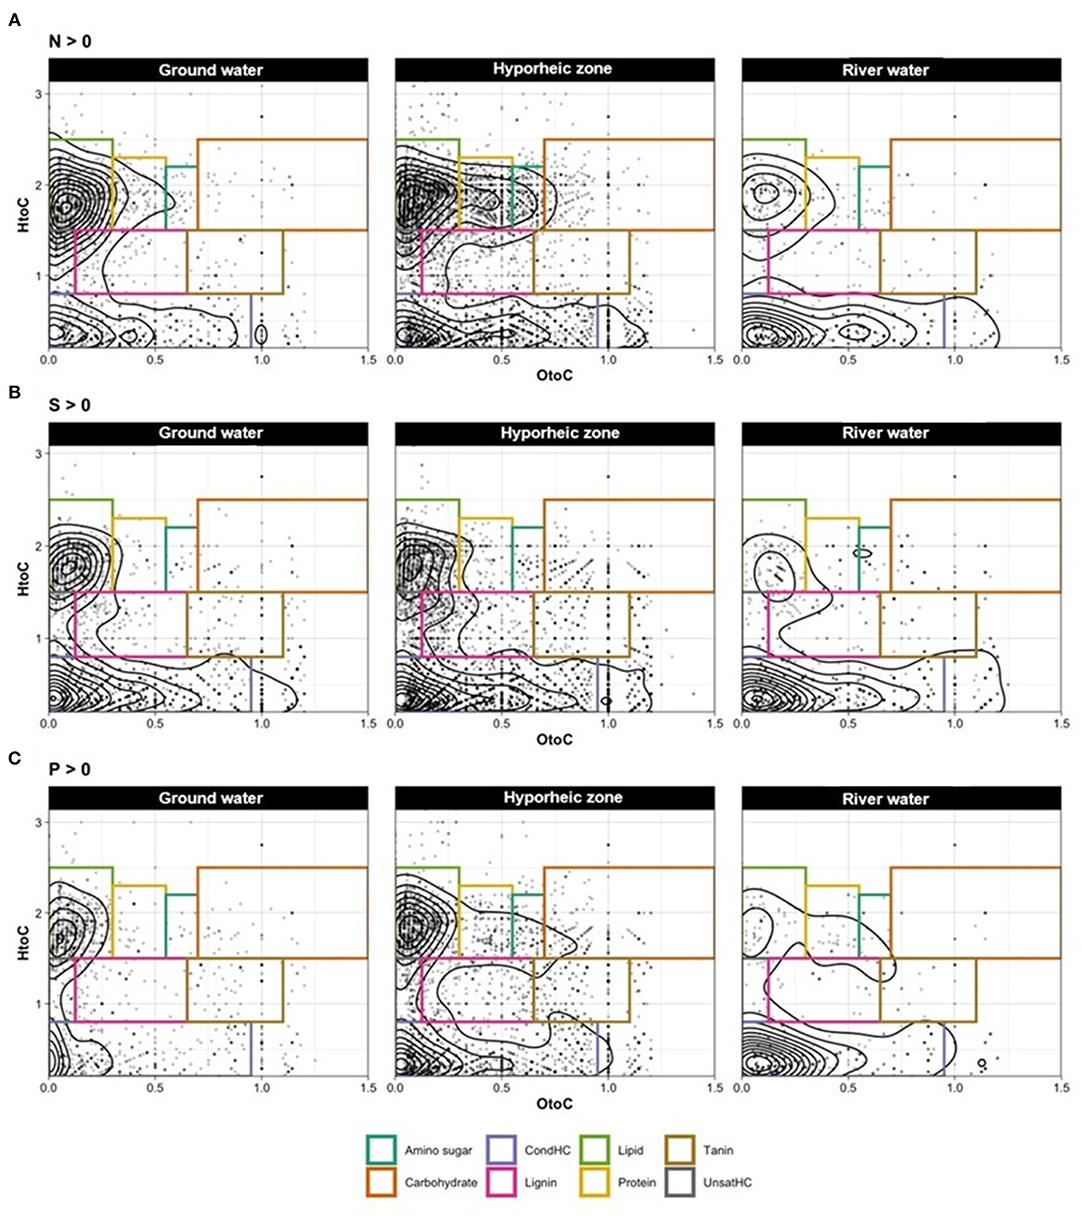
Figure 3. Van Krevelen (VK) diagrams (with contoured lines) for compounds containing only (A) nitrogen (N), (B) sulfur (S), and (C) phosphorus (P) in the samples ground water (left panel), hyporheic zone (middle panel), and river water (right panel).
Thermodynamic Driving Forces of the Ground Water, Hyporheic Zone, and River Corridor
Organic compounds distribution of each system revealed that the hyporheic zone, as expected, was influenced by organic compounds from both the river water and ground water (Figure 4A). However, we wanted to understand the molecular signature of DOM that is driving the underlying thermodynamics that could control microbial respiration in the hyporheic zone. Thus, unique compounds to each system were generated from pairwise comparisons (unique masses in ground water vs. river, hyporheic zone vs. ground water, and hyporheic zone vs. river—Figure 4B) and their thermodynamic favorability was calculated by Gibbs free energy (GFE—Figure 4C). Briefly, a higher GFE signifies more degraded organic matter that is less favorable for microbial oxidation, where conversely, a lower GFE denotes greater thermodynamic favorability. GFE is also dependent on other variables, such as oxygen, which can catalyze the degradation of DOM even if it is not bioavailable.
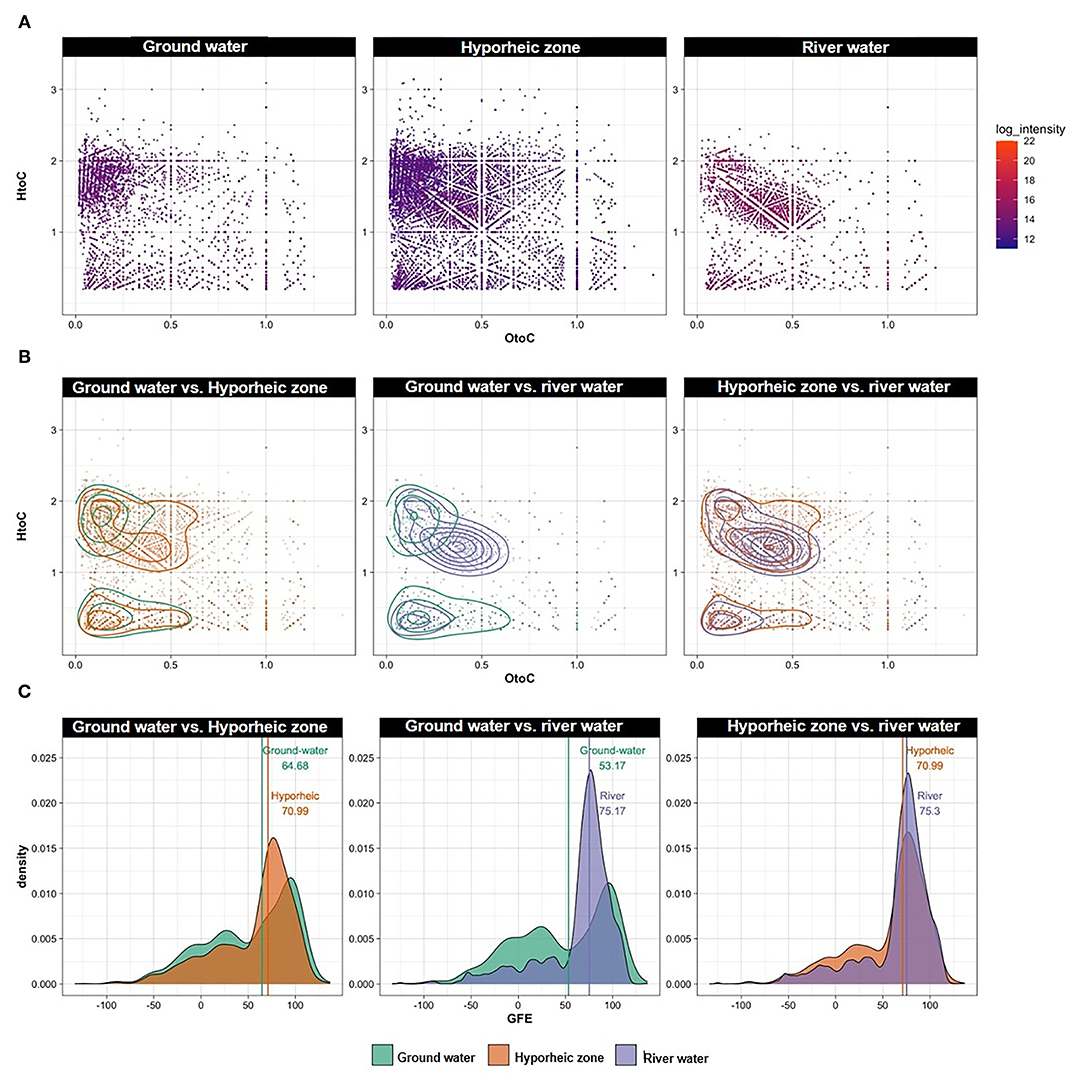
Figure 4. (A) Van Krevelen (VK) diagrams of all peaks observed in each system combined over different river stages, ground water wells and piezometers locations; (B) VK diagrams (with contoured lines) and (C) Gibbs free energy (GFE) ridge lines of unique peaks (i.e., peaks present in one ecosystem but not the other), filtered as pairwise comparisons between the following groups: ground water vs. river water, ground water vs. hyporheic zone, hyporheic zone vs. river water, regardless of river stage and piezometers location. Lines along with numbers in panel C represent the median of each distribution.
Ground water was characterized by an overall greater range of GFE, and a larger abundance of lower GFE compounds (GFE below 50) (Figure 4C). While both river water and hyporheic zone had less thermodynamically favorable DOM overall, the hyporheic zone was still comprised of slightly more labile DOM (Figure 4C). This could be indicative of microbial transformations of DOM inputs from both the river and ground water systems to different degrees of bioavailable compounds, both more degraded and more utilizable, with varying GFE. This phenomenon is further elucidated by a larger abundance and broader range of unique organic compounds that appear in the hyporheic zone but are not present in either of its inputs (i.e., ground and river water) (Figure 4B).
Chemical Transformations Are Driven by Abiotic, Biotic, or Essential Element Dynamics
Putative chemical transformation analysis (biotic and abiotic transformation abundance) can provide better insight on how DOM dynamics are varying and subsequently influencing DOM degradation and bioavailability within the hyporheic zone. Multivariate analysis indicated that transformations were still driven by their ecosystem groupings (25.3% of variance), yet more overlap was observed between the hyporheic zone and river systems (Figure 5A, Supplementary Figure 2). The hyporheic region was strongly driven by an abundance of putative amino acid transformations (i.e., an increase in the abundance of chemical transformations that involve a loss or a gain of an amino acid), which could suggest that the ability to degrade or synthesize proteins may be a key functional trait for microbial communities in the hyporheic zone (Figures 5B, 6A). While the ground water also showed fluctuating amounts of amino acid transformations, the river was practically void of these reactions (Figure 6A). The river water had a significantly higher rate of carboxylation (e.g., gain or loss of carboxylic acid group, mostly abiotic) and acetylation reactions, and was further driven by more putative abiotic and sugar transformations (Figures 6B,C). The ground water DOM was characterized by a diverse suite of N, P, and S containing transformations (Figures 6D–F), including H2S, , and (Figures 6D–F, respectively). This is concurrent with the larger observed abundance of organic compounds with N, S, and P in ground water compared to river as shown in Figure 3.
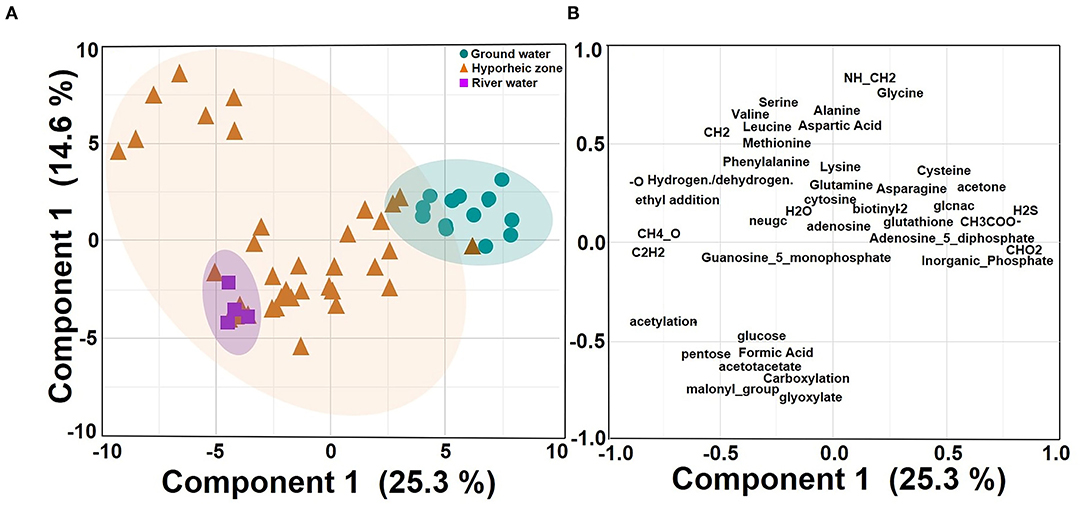
Figure 5. Principle component analysis (PCA) on centered log ratio (CLR) transformed putative chemical transformation abundances in each system (ground water, hyporheic zone, and river water) from the four-time intervals (A–D) (i.e., different river level stages) and piezometer locations in November 2013; (A) Score plot (B) Loading plot. Shaded circles represent 95% confidence regions.
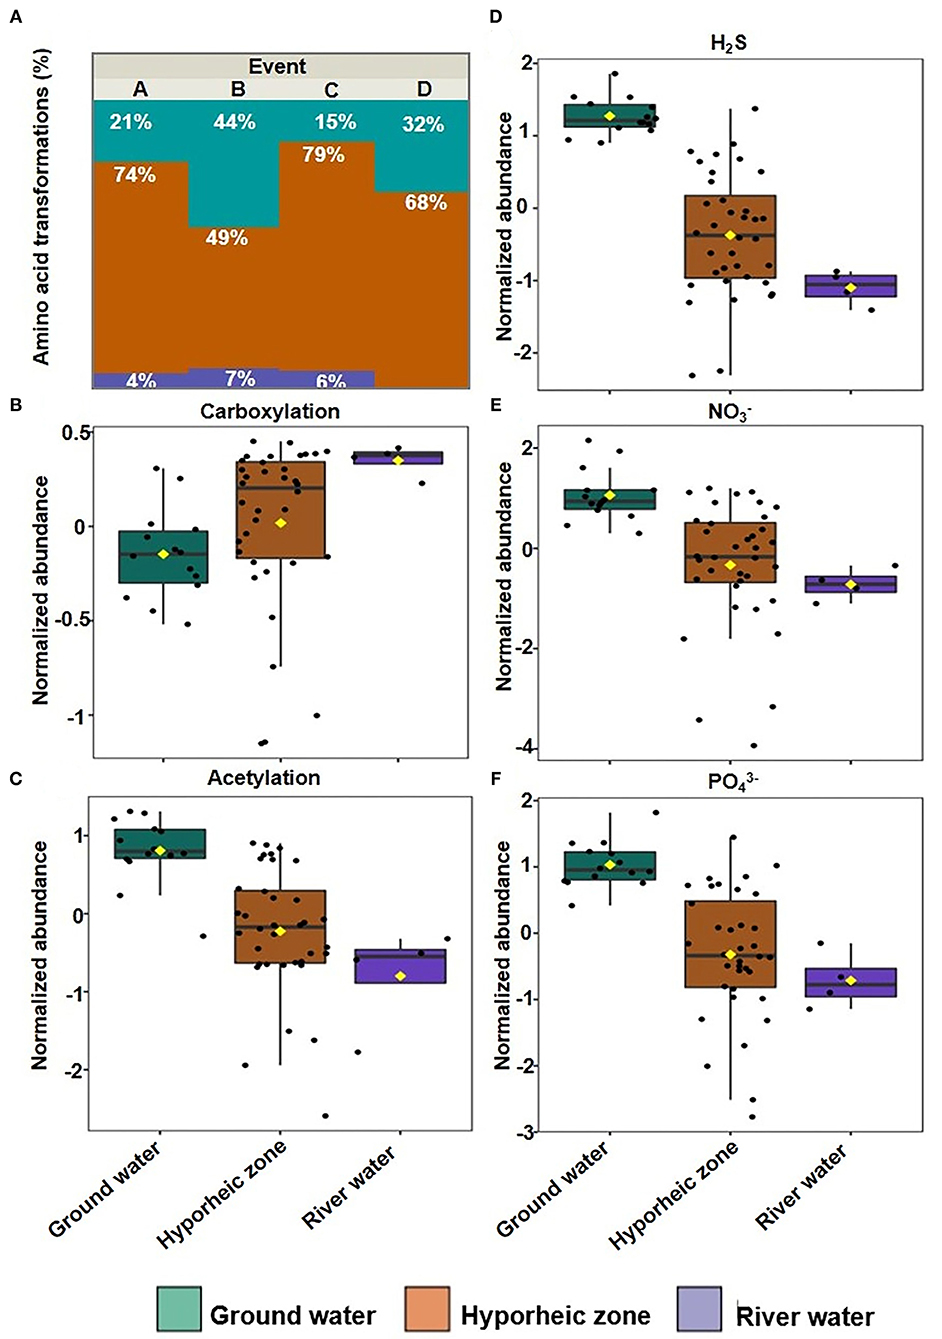
Figure 6. (A) Bar plot of the relative abundance of putative amino acid transformations in each system grouped over four stages (A–D); Box plot of normalized abundance of putative (B) carboxylation, (C) Acetylation, (D) H2S, (E) , and (F) transformations in each system grouped over four-time intervals.
End-member transformation data (i.e., transformations expected under pure transport) in proportion to the different ground water-surface water mixing ratio at sampling stage A revealed an increase in the number of transformations with the increase in river water contribution (Supplementary Figures 2A,B) regardless of transformation type. However, the number of transformations observed in the hyporheic zone at sampling stage A were significantly higher than those predicted under pure transport, regardless of mixing ratio and transformation type (Supplementary Figures 3A,B). Furthermore, when the number of transformations observed in the hyporheic zone were plotted as a function of those observed under pure mixing (Supplementary Figure 4), steeper slopes were observed under pure mixing conditions which indicate significantly higher transformation in hyporheic zone. The high number of transformations observed in the hyporheic zone was also independent of the total number of peaks observed in these sample, in contrast to those observed under pure transport (Supplementary Figure 5).
DOM Transformations in River System Are Driven by Abiotic Factors
Network analysis was utilized to reveal patterns of biochemical transformations by plotting all exact masses within a system connected by their related transformations. This allowed us to visualize how each mass was connected to others, providing a graphical illustration of all putative organic compounds' connections and transformations. Network heterogeneity was then calculated from these networks to gauge the extent to which molecules were transformed. Briefly, a higher network heterogeneity signifies more connections and greater variation of connection types between each mass, indicating more organic compounds transformations, turnover, and degradation to different types of species (i.e., a more transformed system). For visual simplicity, the networks provided here only relate to river stage “A” since similar trends were observed between GW, HZ, and RW from all stages. Network heterogeneity, however, is comprised of values from all river stages and replication to provide a holistic analysis. Across the ground water to river gradient, networks of the hyporheic zone visually looked like those closer to their source (i.e., piezometer 2 contained less ground water contribution as compared to piezometer 5, which contained the most). Interestingly, across a gradient of increasing river water contribution within the hyporheic and ultimately to river water itself, there was an increasing cluster of compounds removed from the main larger cluster (Figure 7A). This is herein called the small cluster or network. These two networks (large and small) were connected primarily through three transformation types: palmitoylation, lysine addition, and ethyl addition. To discern the origin of the small network organic compounds, we colored the transformations of the hyporheic zone and river system networks based on transformations that were significantly more common in the river (Supplementary Table 3) (colored red—carboxylation, acetylation, hydroxylation, glycoxylation, Figure 7A). These side clusters were composed primarily of transformations that were significantly more common in the river (i.e., >50% of the transformations observed in these small networks were attributed to carboxylation, acetylation, hydroxylation, and glycoxylation), of which carboxylation reactions were the dominant transformations. Network heterogeneity increased significantly across the ground water to river water gradient (p values = 0.0058, 0.0010, and 0.0072, Figures 7B,C, Supplementary Table 5). Additionally, when parsing out river stage variability, the hyporheic zone showed an increase in network heterogeneity in stages C and D compared to stages A and B; hence the contribution of river water to the HZ was higher.
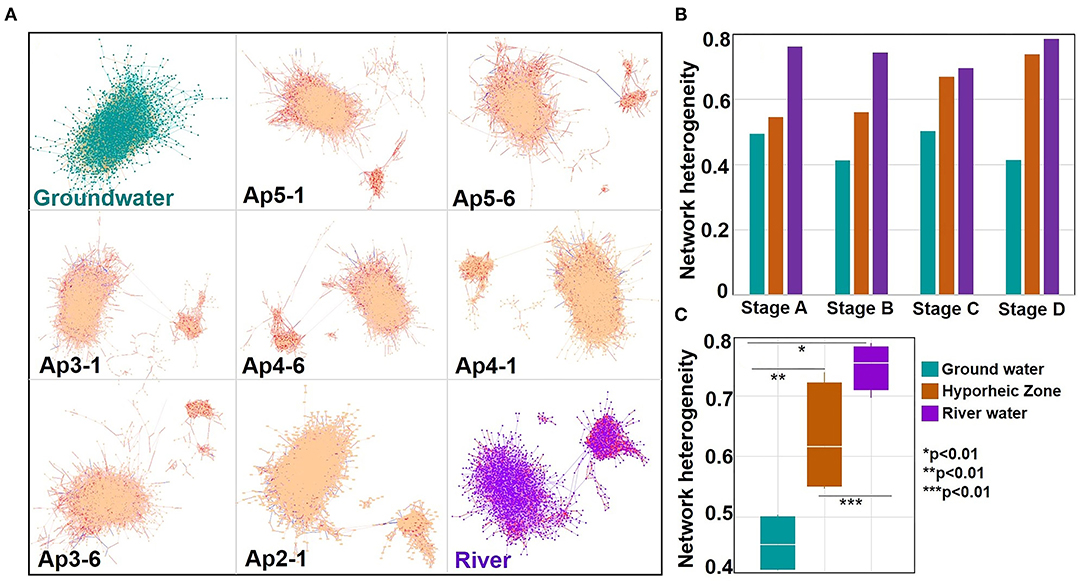
Figure 7. (A) Networks calculated during the network analysis using the full set of chemical transformations (88 transformations) for time interval (river stage) A for each system (ground water, hyporheic zone per piezometer location (where P stands for “piezometer” where as the number next to it refers to the P number. The number after the hyphen refers to the piezometer depth), and river with the system name indicated at the bottom left corner of each panel. Each dot within the figure is an m/z value found within a sample. The lines connecting the m/z values, defined as edges, are chemical transformations. Yellow edges within the ground water network represent the following ground water upregulated transformations (H2S, , and , inorganic phosphate, diphosphate, S2) intervals. Red edges within the river and hyporheic network represent the following river upregulated transformations (carboxylation, acetylation, malonyl group, glucose transformation, and glycoxylation). Blue edges within the hyporheic network represent the upregulated 20 amino-acids transformations from Figure 5A. Samples from the Hyporheic Zone are organized in descending order which relates to declining ground water input. Large to small networks in hyporheic and river samples are connected by three types of putative transformations: palmitoylation, lysine addition, and ethyl addition; Bar and box plots of changes in the network heterogeneity index (calculated from the network) (B) as function of four-time intervals for each system and (C) grouped over all river stages respectively (with ANOVA and Tuckey test significance represented as*).
We used Kendrick mass defect (KMD, normalized by -CH2) to further understand differences between each system's molecular composition (Figure 8). Homologous species (i.e., those with the same Kendrick mass) that have larger KMD values signify less degraded, more oxygen incorporated compounds. Compounds with lower KMD values in a homologous species are more degraded, less oxygenated, and H-enriched. Interestingly, the ground water only showed one grouping of masses with higher KMD, and a greater abundance of high molecular weight compounds (average m/z ratio ~375, Supplementary Figure 6). Two distinct groupings were revealed in both the hyporheic zone and river water, and when assessed further, the lower mass deficit compounds were associated with the distinct clusters observed in the network analysis and were of lower molecular weight. This suggests that the subnetwork clusters observed in the hyporheic zone and river network plots are associated with less oxygen-incorporated, more degraded low molecular weight (LMW) compounds. These LMW KMD compounds were also classified as lignin-like molecules in van Krevelen diagram. Overall, the hyporheic zone and river water compounds were composed of slightly less LMW compounds as compared to the ground water (average m/z ratio ~325–375 and ~325–350, respectively, Supplementary Figure 6).
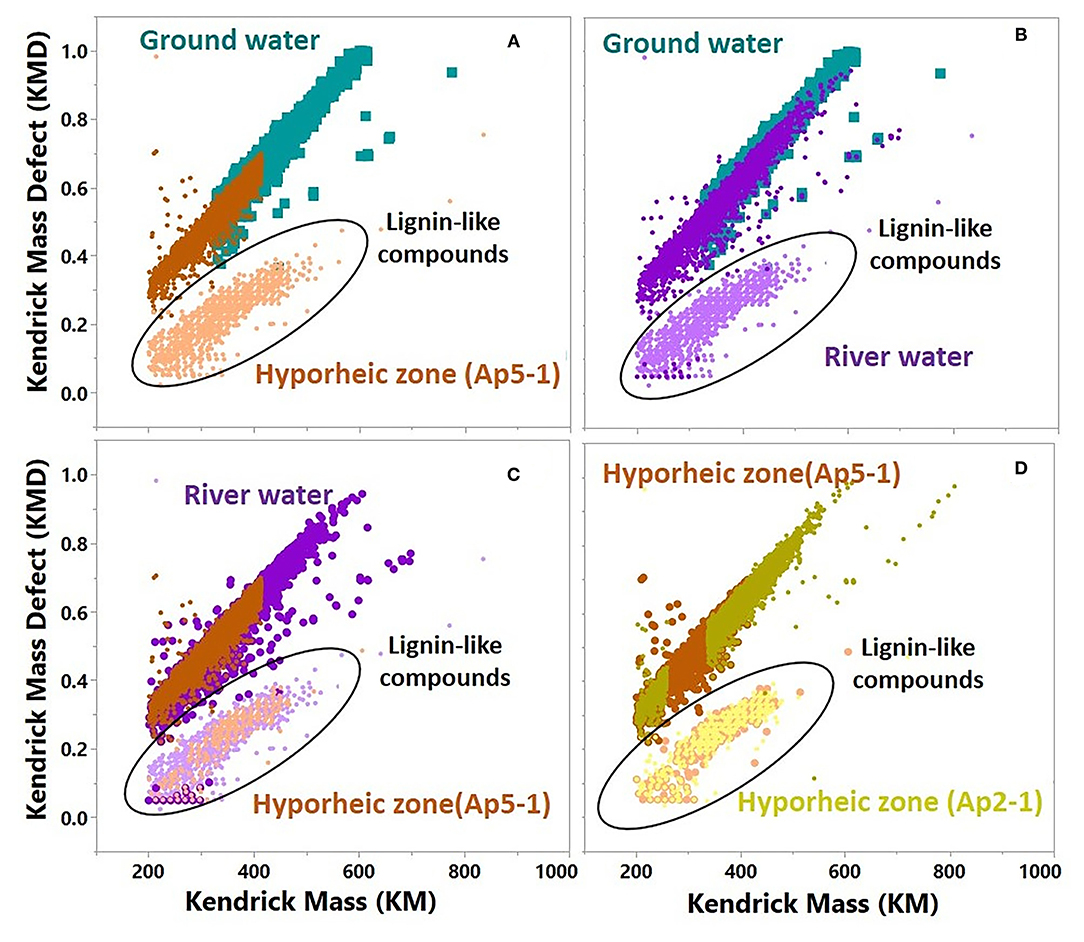
Figure 8. Kendrick plot comparison of molecular formulas that were used in network analysis for representative samples from time interval A. (A) Ground water vs. Hyporheic zone (AP5-1); (B) Ground water vs. River water; (C) River water vs. Hyporheic zone (AP5-1); (D) Hyporheic zone (AP5-1) vs. Hyporheic zone (AP2-1), For river water and Hyporheic zone samples, peaks that were part of the small network (represented by the black empty circle) from subpanel A were identified as lignin-like compounds and were colored with a lighter color than peaks that were part of the big network from subpanel A.
The dynamic nature of ground water and river water mixing within the hyporheic zone is illustrated by the variation in KMD composition between two different hyporheic zone samples (Figure 7D–Hyporheic zone AP5-1 vs. AP2-1). The hyporheic zone sample with greater river contribution (AP2-1) showed closer similarity to river water KMD distribution, as opposed to the hyporheic zone sample (AP5-1) with larger ground water contribution (Figures 1, 7A, 8D).
Discussion
We used high resolution, Fourier transform ion cyclotron resonance mass-spectrometry to provide an in-depth molecular characterization of the Columbia River hyporheic zone DOM, and its constituents (river water and ground water). These in depth profiles (1) provided a deeper understanding of DOM chemical composition of the Columbia River hyporheic zone, and ground and river water (Figures 2–4), (2) confirmed and extrapolated upon a previous hypothesized mechanism by which microbial activity is enhanced in the hyporheic zone (Figures 5–7), (3) revealed abiotic drivers in river systems are transforming DOM before it is introduced into the hyporheic zone (Figures 6, 8).
The ground water profile was characterized by a more diverse suite of N and S containing compounds than the river, P compounds localized within the lipid- and condensed hydrocarbon-region of the van Krevelen diagram (Figure 3), as well as transformations that cycle these nutrients (, H2S, and ) (Figures 5, 6). Further, more thermodynamically favorable DOM and lower network heterogeneity suggest that DOM in the ground water was not as actively transformed as the river water and hyporheic zone, even though microorganisms were present (Figure 4). While these data together could suggest anaerobic respiration, a slower and less energetically favorable reaction utilizing and as terminal electron acceptors (Kim et al., 2015; U.S. Geological Survey, 2016), the ground water aquifer is known to be highly oxygenated (Stegen et al., 2018), and thus, persistence of labile DOM would not be limited by anaerobic conditions. While the effective rates of such reactions were shown to be as fast as aerobic mineralization (Kolbe et al., 2019; Bochet et al., 2020), Oldham et al. 2013 showed that the exposure time (i.e., the proportion of residence time with requisite conditions) plays a major role in regulating reactions (Oldham et al., 2013). The low residence time of DOM in ground water, which is dependent on river water fluctuations, could play a role in decreased DOM processing. Stegen et al. (2018) further showed that DOM within the ground water aquifer was at low enough concentrations that this labile C was likely protected more so by the energetics of the system—that is, the odds a microbial cell comes across a DOM molecule is unlikely, and even if it does, it is not worth the microorganism's energy to consume it. Due to the limitation of electron donors in this system, we hypothesize the upregulation of putative -NO3 and -H2S transformations (Figures 5, 6) could be due to the abiotic incorporation of these elements into DOM (Sleighter et al., 2014; Pohlabeln et al., 2017). This hypothesis suggests that N and S “nutrients” could be supplied to the hyporheic zone as abiotically transformed DOM. Chemical reactions involving P such as loss of gain of a phosphate group are attributed to agricultural inputs in the area, likely due to phosphate leaching from surrounding sediments (Reddy and DeLaune, 2008). Predicted increase in the frequency of extreme events, induced by climate change, could alter DOM residence time in ground water and the input of phosphate from surrounding land, leading to changes in ground water DOM composition with direct impact on DOM composition and microbial metabolism in the hyporheic zone.
Considering a larger diversity of N and S containing compounds were observed in the ground water as compared to the river water (Figure 3) in this current study, it is likely that a more heterogeneous set of substrates with these incorporated essential elements could be provided to the hyporheic zone. This diversity could in turn be utilized in a larger suite of microbial processes. Our results also further enhance the hypothesis that labile DOM is protected within the ground water ecosystem (Figure 4C), since we observed an abundance of labile DOM even in the presence of microorganisms. This implies that labile DOM with abiotically incorporated essential elements could be energetically protected until these compounds enter the hyporheic zone, which would only further influence microbial activity and respiration. Abiotic-driven DOM sources of essential elements to the hyporheic zone is an important topic for further exploration as it is speculated that hyporheic zone microorganisms within the Columbia river are N-limited (Stegen et al., 2018). Future research should be performed to understand how various land inputs, residence time and temperature can affect abiotic transformations of these molecules, explore the different levels of bioavailability of these DOM essential elements to microorganisms, and confirm linkages between essential elements integrated into labile DOM and how these molecules affect hyporheic zone microbial activity.
DOM composition (Figures 2–4) and transformation data (Figures 5–7) results revealed that the hyporheic zone is metabolically active with an over-representation of N containing compounds, relative to river water and ground water. These results were consistent with the conceptual model that was developed by Stegen et al. (2016, 2018) that suggests a stimulation of respiration by mixing of ground water with river water. While we show that changes in stage can either increase or decrease hyporheic exchange depending on the substrate materials and driver of the change in flow with direct impact on DOM composition in the hyporheic zone (Figure 8) (Wroblicky et al., 1998; Sawyer et al., 2009; Mojarrad et al., 2019), our end-member transformation data results revealed that all chemical transformations were deviated from mixing expectations regardless of mixing ratios and thus river stage. A clear direction for future research is to use our chemical transformation approach to combine mixing models with biogeochemistry to better characterize how the hyporheic response to changes in river stage, driven by climate change (e.g., extreme events, sunlight, temperature, water turbidity, and land inputs) would influence biogeochemistry and microbial activity at the watershed scale.
DOM of river systems is a mixture of autochthonous and allochthonous DOM (Creed et al., 2015; Bertuzzo et al., 2017; Abbott et al., 2018; Shogren et al., 2019) with the latter been widely understood to be composed of plant-inputs, generally in the form of recalcitrant lignin phenols (Raymond and Spencer, 2015). Previous research on DOM processing within the river suggested complicated interactions between autochthonous and allochthonous DOM (Creed et al., 2015; Bertuzzo et al., 2017; Abbott et al., 2018; Shogren et al., 2019). Lignin-like compounds can undergo continuous degradation and mineralization within the river corridor, which can either be completely mineralized or only partially degraded for microbial utilization in the hyporheic zone (Hedges et al., 1997; Koehler et al., 2012; Raymond and Spencer, 2015; Stegen et al., 2016, 2018). At first look, our results revealed that the river profile was composed of less thermodynamically favorable (high GFE) and lignin-like organic matter, which would suggest less bioavailable compounds to microorganisms (Figure 4). However, this does not fully illustrate the dynamics of how these lignin-like compounds are being degraded and how degradation influences microbial activity in the hyporheic zone. That is, are larger lignin-like compounds themselves being introduced into the hyporheic zone, which then undergo degradation under heightened biogeochemical activity (e.g., the priming effect)? Or, are lignin-like compounds from the river entering the hyporheic zone as lignin degradation biproducts, changing their bioavailability to microorganisms in the hyporheic zone? And if the latter is true, do river water transformations of lignin molecules enhance or decrease the bioavailability of these biproducts to hyporheic microbial communities?
The answer to “where” lignin degradation reactions occur can be partially unveiled by network analysis. A distinct small network of organic compounds was observed only in the river and hyporheic zone systems and was composed of lignin-like molecules (Figure 7). By coloring the transformations in these clusters by significant transformations to each system, the transformations inherent to these small networks were those observed to be significantly more common in the river system. Further, network heterogeneity values were highest in the river (p value = 0.0072, Supplementary Table 5). This suggests that the total DOM of the river system is more transformed and degraded, which in part is related to this lignin-like compound small network. Taken together, it is likely that a component of DOM lignin degradation is occurring predominantly within the river, and the byproducts of these reactions subsequently enter the hyporheic zone.
Interestingly, around half of the transformations within the small networks were characterized by carboxylation reactions, and further, carboxylation transformations were significantly more common in the river compared to both the hyporheic zone and ground water (Figures 7, 8). Carboxylation has been widely thought to be a byproduct of DOM photo-chemical oxidation (Ward and Cory, 2016), and photodegradation of lignin in river systems has been well established (Opsahl and and, 1998; Spencer et al., 2009; Raymond and Spencer, 2015). Additionally, the sky cover was very low throughout the sampling period in November 2013 with relatively high observed daily shortwave radiation. Thus, our results may suggest that photo-chemical oxidation is partially oxidizing lignin-like compounds within the river system to lower molecular weight compounds. The Kendrick mass defect analysis of these subset of compounds confirms this observation—the organic compounds were (1) lower in molecular weight compared to other compounds in the system (i.e., more degraded), and (2) lower in Kendrick mass deficit values (i.e., loss of oxygen), likely a product of carboxylic acid group removal via photo-chemical oxidation. This finding has important implications to the extent that the relative change in photo-oxidative control on bioavailability can either amplify or hamper microbial respiration within the hyporheic zone. It has been shown that byproducts of photo-chemical oxidation of DOM in water systems can largely stimulate microbial respiration (Judd et al., 2007; Ward et al., 2017). However, these pathways are complex, since utilization of partially photo-oxidized biproducts depends on microbial community composition as well as the extent of DOM degradation from sun exposure. A recent study by Soares et al. (2019) illustrated that DOM bioavailability in streams actually increased as water residence time and photo exposure increased, suggesting longer exposure of water to sun can enhance the transformation of DOM to usable substrates. While the abundance of LMW compounds in our system from abiotic degradation pathways such as photodegradation, as revealed by transformation analysis revealed, could potentially be used by microorganisms, the relatively large separation of these compounds from others in the hyporheic zone network analysis suggests that lignin photo-oxidized biproducts are not significantly being used by microorganisms. Future research should focus on how changes in environmental conditions such sky cover, temperature and observed daily shortwave radiation could impact abiotic degradation of DOM in river water and how the increase in the intensity of extreme events could impact water turbidity and water residence time.
The two network clusters observed in Figure 7, however, were still connected rather than completely separate (Figure 7). Across all hyporheic zone networks, three types of putative transformations made up the majority of all connections between large and small networks in the hyporheic zone: palmitoylation, lysine addition, and ethyl addition. Palmitic acid plays an important role in cell membrane organization, signal transduction and energy storage. In palmitoylation reactions, proteins are modified by the addition of palmitoyl chains, which are subsequently used in protein localization for biotic cellular membrane interactions and processes (Linder and Deschenes, 2003). This process typically occurs with cysteine amino acid-containing peptides, although it can also occur with lysine (Smotrys and Linder, 2004). While putative, these transformation data suggest it is possible that photo degraded organic compounds from the river system are then partially utilized for biotic palmitoylation processes in the hyporheic zone, even if only to a minimal extent. Ethyl-addition is also generally indicative of abiotic DOM degradation, which could further suggest coupled abiotic-biotic DOM degradation influences on hyporheic zone DOM turnover.
It is also interesting to note that network heterogeneity (indicative of larger transformations and degradation) was always greater in the river than the hyporheic zone, regardless of river stage (Figure 7). These results directly oppose the current dogma of watershed organic matter degradation, where much of DOM turnover is thought to occur due to enhanced microbial activity in the hyporheic zone but agrees with recent work by Lee-Cullin et al. (2018), which suggested that hyporheic exchange homogenizes DOM diversity in surface water. Our results suggest abiotic degradation may be playing a significant role in DOM degradation within watershed systems. Therefore, we believe it is important to consider the abiotic controls on Columbia River DOM and its influence on hyporheic zone respiration. It remains unclear, however, how representative this site is of the whole Columbia River system, and more generally to other river systems in different ecological contexts. This is an open research question that can only be evaluated through future work that involves distributed sampling/experimental campaigns across river corridors.
Currently models such as CLM4.5 classify OM lability broadly using operationally defined categories derived from mineral soils (Campbell and Paustian, 2015) by defining three categories of OM stabilization mechanisms: (1) mineral-associations (chemical protection); (2) physical protection through aggregate compartmentalization; and (3) protection through inherent recalcitrance of OM (biochemical protection), with the remaining OM in the unprotected pool (Six and Paustian, 2014). These categories, however, fail to capture the full complexity of DOM, and are not necessarily representative of the chemical classes observed in watersheds. The high-resolution analytical techniques that were employed in this study can address these critiques and improve the efficiency of models like CLM4.5 by providing a quantitative assessment of OM quality, quantity, complexity, and heterogeneity (GFE and network heterogeneity). Further, the relationship is mathematically simple to describe, applicable to both terrestrial and aquatic systems, and could replace the operationally defined, often ambiguous, compound classes currently being used. DOM complexity and heterogeneity may also affect DOM resident time with implication on GHG emissions, which is thought to enhance the stability and productivity of an ecosystem.
While the importance of rivers in watershed functioning, particularly with regard to DOM chemistry, transport and production of CO2 is becoming widely recognized, these processes remain underrepresented in current Earth System Models (Regnier et al., 2014) leading to overestimation of the terrestrial C sink (Lauerwald et al., 2017). In response, Bisht et al. (2017) recently described CP v1.0 a coupled Community Land Model (CLM4.5) and reactive transport model (PFLOTRAN) which they implemented at the Hanford Reach Columbia River site and optimized using ground water monitoring wells, river gaging, vegetation surveys, and topographic surveys of the site. Their simulations suggested that riparian zone inundation and enhanced moisture in the vadose zone could increase coupling among terrestrial-aquatic-subsurface processes (Bisht et al., 2017), both of which could influence DOM transformation through expansion of the anaerobic zone and may alter the relative contribution of abiotic processes to mineralization rates. However, it remains unclear how expansion of the anaerobic zone will alter the relative contribution of abiotic DOM transformations to CO2 production. Hence, more observation-level data is needed to parameterize both microbial and abiotic DOM transformation rates and interactions with the physiochemical conditions of the system. In PFLOTRAN, microbial redox reactions are modeled via a microbial biomass term. However, reaction rates are not necessarily correlated with biomass or even abundances of the specific microorganism performing the reaction of interest. Proteomic and transcriptomic data provide more direct measures of microbial activity useful for informing rates. While incorporation of all microbial activities for each reaction will likely remain computationally impractical, identifying the critical reactions for the process of interest, and the activities of the microorganisms responsible for those is within the reach of current omics approaches. We believe that our study can narrow this gap by providing information regarding specific DOM transformations leading to mineralization/CO2 production. Future work should focus on how these reactions interact with environmental parameters such as pH and temperature thereby informing future transcriptomic and proteomics studies that could be used to parameterizing RTMs.
Conclusions
Here, we show that in-depth molecular characterization of DOM in watershed ecosystems can be used to understand the potential mechanisms by which ground and river water influence microbial turnover of DOM in the Columbia River hyporheic zone. The results of DOM composition and chemical transformation revealed that the hyporheic zone is metabolically active with an over-representation of N containing compounds relative to river and ground water, regardless of river stage. Abiotic degradation, potentially driven by sunlight due to low sky cover and high observed daily shortwave radiation, in both the ground water and river water can influence DOM availability to the hyporheic zone, which could then be coupled with biotic processes for enhanced microbial activity. These results can be used to identify chemical transformations that are most important for CO2 production in this system, informing further studies to determine equilibrium and rate constants, and other key parameters that will facilitate the inclusion of these critical reactions into RTMs. In ground water systems, future work should be performed to understand the mechanisms behind nutrient (N, P, and S) incorporation into labile DOM in ground water aquifers with special consideration to land use. Changes in land use could affect ground water DOM lability and subsequently impact hyporheic zone respiration. Additionally, research that aims to understand coupled hydrologic, biogeochemical, and microbial function within river corridors experiencing recurring, episodic, or chronic hydrologic perturbations will be highly valuable to ultimately provide the scientific basis for improved management of dynamic river corridors throughout the world. Similarly, as climate effects could contribute to changes in upstream DOM river inputs, such as pronounced abiotic photodegradation of lignin to more bioavailable substrates for hyporheic respiration, incorporating abiotic controls on DOM chemistry into predictive models should be further established. Using molecular characterization to unravel watershed biogeochemical cycling can thus provide important insights into the hydrologic ecosystems and how these influence essential Critical Zone processes.
Data Availability Statement
The datasets presented in this study can be found in online repositories. The names of the repository/repositories and accession number(s) can be found below: https://doi.org/10.17605/OSF.IO/82QYV, NA/.
Author Contributions
JS and MT conceptualized the study and secured funding to support the research. MT, JF, RC, JS, and NG participated in the data analysis and writing of the study. NG conducted the statistical analyses. All authors contributed to the article and approved the submitted version.
Funding
This research is part of the Scientific Focus Area (SFA) project at PNNL, sponsored by the U.S. Department of Energy, Office of Science, Environmental System Science (ESS) Program. This contribution originates from the ESS Scientific Focus Area (SFA) at the Pacific Northwest National Laboratory (PNNL) and by the startup program at the University of Arizona. PNNL is operated for DOE by Battelle under contract DE-AC06-76RLO 1830. A portion of the research was performed using EMSL, a national scientific user facility sponsored by the U.S. Department of Energy's Office of Biological and Environmental Research and located at Pacific Northwest National Laboratory. We thank the field team members of the PNNL-SFA for sample collection.
Conflict of Interest
The authors declare that the research was conducted in the absence of any commercial or financial relationships that could be construed as a potential conflict of interest.
Acknowledgments
The authors acknowledge this would not have been possible without support from their home institutions and the sampling team of the PNNL SFA. Any use of trade, firm, or product names is for descriptive purposes only and does not imply endorsement by the U.S. Government nor the authors' institutions.
Supplementary Material
The Supplementary Material for this article can be found online at: https://www.frontiersin.org/articles/10.3389/frwa.2020.574692/full#supplementary-material
References
Abbott, B. W., Gruau, G., Zarnetske, J. P., Moatar, F., Barbe, L., Thomas, Z., et al. (2018). Unexpected spatial stability of water chemistry in headwater stream networks. Ecol. Lett. 21, 296–308. doi: 10.1111/ele.12897
Adrian, R., Hessen, D. O., Blenckner, T., Hillebrand, H., Hilt, S., Jeppesen, E., et al. (2016). “Environmental impacts—lake ecosystems,” in North Sea Region Climate Change Assessment, eds M. Quante and F. Colijn (Cham: Springer International Publishing), 315–340. doi: 10.1007/978-3-319-39745-0_10
Aitchison, J. (1994). “Principles of compositional data analysis,” in Multivariate Analysis and Its Applications, eds T. W. Anderson, K. T. Fang, and I. Olkin (Hayward, CA: Institute of Mathematical Statistics), 73–81. IMS Lecture Notes-Monograph Series 24. doi: 10.1214/lnms/1215463786
Banks, V., Palumbo-Roe, B., and Russell, C. (2019). “The hyporheic zone,” in Hydrology—The Science of Water, ed M. S. Javaid. doi: 10.5772/intechopen.85218
Bernhardt, E. S., Blaszczak, J. R., Ficken, C. D., Fork, M. L., Kaiser, K. E., and Seybold, E. C. (2017). Control points in ecosystems: moving beyond the hot spot hot moment concept. Ecosystems 20, 665–682. doi: 10.1007/s10021-016-0103-y
Bertuzzo, E., Helton, A. M., Hall, R. O., and Battin, T. J. (2017). Scaling of dissolved organic carbon removal in river networks. Adv. Water Resour. 110, 136–146. doi: 10.1016/j.advwatres.2017.10.009
Bisht, G., Huang, M., Zhou, T., Chen, X., Dai, H., Hammond, G. E., et al. (2017). Coupling a three-dimensional subsurface flow and transport model with a land surface model to simulate stream–aquifer–land interactions (CP v1. 0). Geosci. Model Dev. 10,4539–4562. doi: 10.5194/gmd-10-4539-2017
Boano, F., Harvey, J. W., Marion, A., Packman, A. I., Revelli, R., Ridolfi, L., et al. (2014). Hyporheic flow and transport processes: mechanisms, models, and biogeochemical implications. Rev. Geophys. 52, 603–679. doi: 10.1002/2012RG000417
Bochet, O., Bethencourt, L., Dufresne, A., Farasin, J., Pédrot, M., Labasque, T., et al. (2020). Iron-oxidizer hotspots formed by intermittent oxic–anoxic fluid mixing in fractured rocks. Nat. Geosci. 13, 149–155. doi: 10.1038/s41561-019-0509-1
Boulton, A. J., Datry, T., Kasahara, T., Mutz, M., and Stanford, J. A. (2010). Ecology and management of the hyporheic zone: stream-ground water interactions of running waters and their floodplains. J. North Am. Benthol. Soc. 29, 26–40. doi: 10.1899/08-017.1
Boulton, A. J., Findlay, S., Marmonier, P., Stanley, E. H., and Maurice Valett, H. (1998). The functional significance of the hyporheic zone in streams and rivers. Annu. Rev. Ecol. Syst. 29, 59–81. doi: 10.1146/annurev.ecolsys.29.1.59
Bowen, J. C., Kaplan, L. A., and Cory, R. M. (2019). Photodegradation disproportionately impacts biodegradation of semi-labile DOM in streams. Limnol. Oceanogr. 66, 13–26. doi: 10.1002/lno.11244
Boye, K., Herrmann, A. M., Schaefer, M. V., Tfaily, M. M., and Fendorf, S. (2018). Discerning microbially mediated processes during redox transitions in flooded soils using carbon and energy balances. Front. Environ. Sci. 6:15. doi: 10.3389/fenvs.2018.00015
Breitling, R., Ritchie, S., Goodenowe, D., Stewart, M. L., and Barrett, M. P. (2006). Ab initio prediction of metabolic networks using Fourier transform mass spectrometry data. Metabolomics 2, 155–164. doi: 10.1007/s11306-006-0029-z
Briggs, M. A., Day-Lewis, F. D., Zarnetske, J. P., and Harvey, J. W. (2015). A physical explanation for the development of redox microzones in hyporheic flow. Geophys. Res. Lett. 42, 4402–4410. doi: 10.1002/2015GL064200
Brunner, P., Therrien, R., Renard, P., Simmons, C. T., and Franssen, H. J. H. (2017). Advances in understanding river-ground water interactions. Rev. Geophys. 55, 818–854. doi: 10.1002/2017RG000556AQ not cited
Burd, A. B., Frey, S., Cabre, A., Ito, T., Levine, N. M., Lønborg, C., et al. (2016). Terrestrial and marine perspectives on modeling organic matter degradation pathways. Glob. Change Biol. 22, 121–136. doi: 10.1111/gcb.12987
Burgess, K. E. V., Borutzki, Y., Rankin, N., Daly, R., and Jourdan, F. (2017). MetaNetter 2: a cytoscape plugin for ab initio network analysis and metabolite feature classification. J. Chromatogr. B Anal. Technol. Biomed. Life Sci. 1071, 68–74. doi: 10.1016/j.jchromb.2017.08.015
Campbell, E. E., and Paustian, K. (2015). Current developments in soil organic matter modeling and the expansion of model applications: a review. Environ. Res. Lett. 10:123004. doi: 10.1088/1748-9326/10/12/123004
Chen, J., and Chang, H. (2019). Dynamics of wet-season turbidity in relation to precipitation, discharge, and land cover in three urbanizing watersheds, Oregon. River Res. Appl. 35, 892–904. doi: 10.1002/rra.3487
Clinton, S. M., Edwards, R. T., and Findlay, S. E. G. (2010). Exoenzyme activities as indicators of dissolved organic matter composition in the hyporheic zone of a floodplain river. Freshw. Biol. 55, 1603–1615. doi: 10.1111/j.1365-2427.2009.02383.x
Creed, I. F., McKnight, D. M., Pellerin, B. A., Green, M. B., Bergamaschi, B. A., Aiken, G. R., et al. (2015). The river as a chemostat: fresh perspectives on dissolved organic matter flowing down the river continuum. Can. J. Fish. Aquat. 72, 1272–1285. doi: 10.1139/cjfas-2014-0400
Durham, B. P., Sharma, S., Luo, H., Smith, C. B., Amin, S. A., Bender, S. J., et al. (2015). Cryptic carbon and sulfur cycling between surface ocean plankton. Proc. Natl. Acad. Sci. U.S.A. 112, 453–457. doi: 10.1073/pnas.1413137112
Fasching, C., Ulseth, A. J., Schelker, J., Steniczka, G., and Battin, T. J. (2016). Hydrology controls dissolved organic matter export and composition in an Alpine stream and its hyporheic zone. Limnol. Oceanogr. 61, 558–571. doi: 10.1002/lno.10232
Graham, E. B., Crump, A. R., Resch, C. T., Fansler, S., Arntzen, E., Kennedy, D. W., et al. (2016). Coupling spatiotemporal community assembly processes to changes in microbial metabolism. Front. Microbiol. 7:1949. doi: 10.3389/fmicb.2016.01949
Graham, E. B., Stegen, J. C., Huang, M., Chen, X., and Scheibe, T. D. (2019). Subsurface biogeochemistry is a missing link between ecology and hydrology in dam-impacted river corridors. Sci. Total Environ. 657, 435–445. doi: 10.1016/j.scitotenv.2018.11.414
He, W., Choi, I., Lee, J. J., and Hur, J. (2016). Coupling effects of abiotic and biotic factors on molecular composition of dissolved organic matter in a freshwater wetland. Sci. Total Environ. 544, 525–534. doi: 10.1016/j.scitotenv.2015.12.008
Hedges, J. I., Keil, R. G., and Benner, R. (1997). What happens to terrestrial organic matter in the ocean? Org. Geochem. 27, 195–212. doi: 10.1016/S0146-6380(97)00066-1
Hester, E. T., and Doyle, M. W. (2008). In-stream geomorphic structures as drivers of hyporheic exchange. Water Resour. Res. 44:W03417. doi: 10.1029/2006WR005810
Hou, Z., Nelson, W. C., Stegen, J. C., Murray, C. J., Arntzen, E., Crump, A. R., et al. (2017). Geochemical and microbial community attributes in relation to hyporheic zone geological facies. Sci. Rep. 7:12006. doi: 10.1038/s41598-017-12275-w
Hughey, C. A., Hendrickson, C. L., Rodgers, R. P., Marshall, A. G., and Qian, K. (2001). Kendrick mass defect spectrum: a compact visual analysis for ultrahigh-resolution broadband mass spectra. Anal. Chem. 73, 4676–4681. doi: 10.1021/ac010560w
Johnson, L. T., Tank, J. L., and Arango, C. P. (2009). The effect of land use on dissolved organic carbon and nitrogen uptake in streams. Freshw. Biol. 54, 2355–2350. doi: 10.1111/j.1365-2427.2009.02261.x
Judd, K. E., Crump, B. C., and Kling, G. W. (2007). Bacterial responses in activity and community composition to photo-oxidation of dissolved organic matter from soil and surface waters. Aquat. Sci. 69, 96–107. doi: 10.1007/s00027-006-0908-4
Kasahara, T., and Wondzell, S. M. (2003). Geomorphic controls on hyporheic exchange flow in mountain streams. Water Resour. Res. 39, SBH 3-1-SBH 3-14. doi: 10.1029/2002WR001386
Kaufman, M. H., Cardenas, M. B., Buttles, J., Kessler, A. J., and Cook, P. L. M. (2017). Hyporheic hot moments: dissolved oxygen dynamics in the hyporheic zone in response to surface flow perturbations. Water Resour. Res. 53, 6642–6662. doi: 10.1002/2016WR020296
Kim, H., Kaown, D., Mayer, B., Lee, J. Y., Hyun, Y., and Lee, K. K. (2015). Identifying the sources of nitrate contamination of ground water in an agricultural area (Haean basin, Korea) using isotope and microbial community analyses. Sci. Total Environ. 533, 566–575. doi: 10.1016/j.scitotenv.2015.06.080
Kim, S., Kramer, R. W., and Hatcher, P. G. (2003). Graphical method for analysis of ultrahigh-resolution broadband mass spectra of natural organic matter, the Van Krevelen Diagram. Anal. Chem. 75, 5336–5344. doi: 10.1021/ac034415p
Koehler, B., Von Wachenfeldt, E., Kothawala, D., and Tranvik, L. J. (2012). Reactivity continuum of dissolved organic carbon decomposition in lake water. J. Geophys. Res. 117:G01024. doi: 10.1029/2011JG001793
Kolbe, T., Dreuzy, J.-R., Abbott, B. W., Aquilina, L., Babey, T., Green, C. T., et al. (2019). Stratification of reactivity determines nitrate removal in ground water. Proc. Natl. Acad. Sci. U. S. A. 201816892. doi: 10.1073/pnas.1816892116
Lauerwald, R., Regnier, P., Camino-Serrano, M., Guenet, B., Guimberteau, M., Ducharne, A., et al. (2017). ORCHILEAK (revision 3875): a new model branch to simulate carbon transfers along the terrestrial–aquatic continuum of the Amazon basin. Geosci. Model Dev. 10, 3821–3859. doi: 10.5194/gmd-10-3821-2017
Lawrence, C., Harden, J., and Maher, K. (2014). Modeling the influence of organic acids on soil weathering. Geochim. Cosmochim. Acta 139, 487–507. doi: 10.1016/j.gca.2014.05.003
Lee-Cullin, J. A., Zarnetske, J. P., Ruhala, S. S., and Plont, S. (2018). Toward measuring biogeochemistry within the stream-ground water interface at the network scale: an initial assessment of two spatial sampling strategies. Limnol. Oceanogr. Methods 16, 722–733. doi: 10.1002/lom3.10277
Li, L., Maher, K., Navarre-Sitchler, A., Druhan, J., Meile, C., Lawrence, C., et al. (2017). Expanding the role of reactive transport models in critical zone processes. Earth-Sci. Rev. 165, 280–301. doi: 10.1016/j.earscirev.2016.09.001
Linder, M. E., and Deschenes, R. J. (2003). New insights into the mechanisms of protein palmitoylation. Biochemistry 42, 4311–4320. doi: 10.1021/bi034159a
Lønborg, C., Álvarez-Salgado, X. A., Letscher, R. T., and Hansell, D. A. (2018). Large stimulation of recalcitrant dissolved organic carbon degradation by increasing ocean temperatures. Front. Mar. Sci. 4:436. doi: 10.3389/fmars.2017.00436
Longnecker, K., and Kujawinski, E. B. (2016). Using network analysis to discern compositional patterns in ultrahigh-resolution mass spectrometry data of dissolved organic matter. Rapid Commun. Mass Spectrom. 30, 2388–2394. doi: 10.1002/rcm.7719
Merill, L., and Tonjes, D. J. (2014). A review of the hyporheic zone, stream restoration, and means to enhance denitrification. Crit. Rev. Environ. Sci. Technol. 44, 2337–2379. doi: 10.1080/10643389.2013.829769
Mojarrad, B. B., Betterle, A., Singh, T., Olid, C., and Wörman, A. (2019). The effect of stream discharge on hyporheic exchange. Water 11:1436. doi: 10.3390/w11071436
Naegeli, M. W., and Uehlinger, U. (1997). Contribution of the hyporheic zone to ecosystem metabolism in a prealpine gravel-bed river. J. North Am. Benthol. Soc. 16, 794–804. doi: 10.2307/1468172
Naiman, R. J., Bilby, R. E., and Bisson, P. A. (2000). Riparian ecology and management in the pacific coastal rain forest. Bioscience 60, 996–1011. doi: 10.1641/0006-3568(2000)050[0996:REAMIT]2.0.CO;2
Newbold, J. D., Bott, T. L., Kaplan, L. A., Dow, C. L., Jackson, J. K., Aufdenkampe, A. K., et al. (2006). Uptake of nutrients and organic C in streams in New York City drinking-water-supply watersheds. J. North Am. Benthol. Soc. 25, 998–1017. doi: 10.1899/0887-3593(2006)025[0998:UONAOC]2.0.CO;2
Nogaro, G., Datry, T., Mermillod-Blondin, F., Foulquier, A., and Montuelle, B. (2013). Influence of hyporheic zone characteristics on the structure and activity of microbial assemblages. Freshw. Biol. 58, 2567–2583. doi: 10.1111/fwb.12233
Oldham, C. E., Farrow, D. E., and Peiffer, S. (2013). A generalized Damköhler number for classifying material processing in hydrological systems. Hydrol. Earth Syst. Sci. 17, 1133–1148. doi: 10.5194/hess-17-1133-2013
Opsahl S. and Benner, R. (1998). Photochemical reactivity of dissolved lignin in river and ocean waters. Limnol. Oceanogr. 43, 1297–1304. doi: 10.4319/lo.1998.43.6.1297
Pawlowsky-Glahn, V., and Buccianti, A. (2011). Compositional Data Analysis: Theory and Applications. Hoboken, NJ: Wiley. doi: 10.1002/9781119976462
Pohlabeln A. M. Gomez-Saez G. V. Noriega-Ortega B. E. and Dittmar, T. (2017). Experimental evidence for abiotic sulfurization of marine dissolved organic matter. Front. Mar. Sci. 4:364. doi: 10.3389/fmars.2017.00364
Raymond, P. A., and Spencer, R. G. M. (2015). “Chapter 11 - Riverine DOM,” in Biogeochemistry of Marine Dissolved Organic Matter, 2nd Edn, eds D. A. Hansell and C. A. Carlson (Boston: Academic Press) 509–533. doi: 10.1016/B978-0-12-405940-5.00011-X
Reddy, K. R., and DeLaune, R. D. (2008). “Organic Phosphorous,” in Biogeochemistry of Wetlands: Science and Applications. doi: 10.1201/9780203491454
Regnier, P., Lauerwald, R., and Ciais, P. (2014). Carbon leakage through the terrestrial-aquatic interface: Implications for the anthropogenic CO2 budget. Proc. Earth Planet Sci. 10, 319–324. doi: 10.1016/j.proeps.2014.08.025
Ritson, J. P., Graham, N. J. D., Templeton, M. R., Clark, J. M., Gough, R., and Freeman, C. (2014). The impact of climate change on the treatability of dissolved organic matter (DOM) in upland water supplies: a UK perspective. Sci. Total Environ. 473–474, 714–730. doi: 10.1016/j.scitotenv.2013.12.095
Sawyer, A. H., Cardenas, M. B., Bomar, A., and Mackey, M. (2009). Impact of dam operations on hyporheic exchange in the riparian zone of a regulated river. Hydrol. Process. 23, 2129–2137. doi: 10.1002/hyp.7324
Shannon, P., Markiel, A., Ozier, O., Baliga, N. S., Wang, J. T., Ramage, D., et al. (2003). Cytoscape: a software environment for integrated models of biomolecular interaction networks. Genome Res. 13, 2498–2504. doi: 10.1101/gr.1239303
Shogren, A. J., Zarnetske, J. P., Abbott, B. W., Iannucci, F., Frei, R. J., Griffin, N. A., and Bowden, W. B. (2019). Revealing biogeochemical signatures of Arctic landscapes with river chemistry. Sci. Rep. 9, 1–11. doi: 10.1038/s41598-019-49296-6
Six, J., and Paustian, K. (2014). Aggregate-associated soil organic matter as an ecosystem property and a measurement tool Soil Biol. Biochem. 68, A4–9. doi: 10.1016/j.soilbio.2013.06.014
Sleighter, R. L., Chin, Y.-P., Arnold, W. A., Hatcher, P. G., McCabe, A. J., McAdams, B. C., et al. (2014). Evidence of incorporation of abiotic S and N into Prairie Wetland dissolved organic matter. Environ. Sci. Lett. 1, 345–350. doi: 10.1021/ez500229b
Smotrys, J. E., and Linder, M. E. (2004). Palmitoylation of intracellular signaling proteins: regulation and function. Annu. Rev. Biochem. 73, 559–587. doi: 10.1146/annurev.biochem.73.011303.073954
Soares, A. R. A., Lapierre, J. F., Selvam, B. P., Lindström, G., and Berggren, M. (2019). Controls on dissolved organic carbon bioreactivity in river systems. Sci. Rep. 9:14897. doi: 10.1038/s41598-019-50552-y
Sophocleous, M. (2002). Interactions between ground water and surface water: The state of the science. Hydrogeol. J. 10, 52–67. doi: 10.1007/s10040-001-0170-8
Spencer, R. G. M., Stubbins, A., Hernes, P. J., Baker, A., Mopper, K., Aufdenkampe, A. K., et al. (2009). Photochemical degradation of dissolved organic matter and dissolved lignin phenols from the Congo River. J. Geophys. Res. 114:G03010. doi: 10.1029/2009JG000968
Stegen, J. C., Fredrickson, J. K., Wilkins, M. J., Konopka, A. E., Nelson, W. C., Arntzen, E. V., et al. (2016). Ground water-surface water mixing shifts ecological assembly processes and stimulates organic carbon turnover. Nat. Commun. 7:11237. doi: 10.1038/ncomms11237
Stegen, J. C., Johnson, T., Fredrickson, J. K., Wilkins, M. J., Konopka, A. E., Nelson, W. C., et al. (2018). Influences of organic carbon speciation on hyporheic corridor biogeochemistry and microbial ecology. Nat. Commun. 9:585. doi: 10.1038/s41467-018-02922-9
Stern, N., Ginder-Vogel, M., Stegen, J. C., Arntzen, E., Kennedy, D. W., Larget, B. R., et al. (2017). Colonization habitat controls biomass, composition, and metabolic activity of attached microbial communities in the Columbia River hyporheic corridor. Appl. Environ. Microbiol. 83, e00260–17. doi: 10.1128/AEM.00260-17
Tfaily, M. M., Chu, R. K., Toyoda, J., Tolić, N., Robinson, E. W., Paša-Tolić, L., et al. (2017). Sequential extraction protocol for organic matter from soils and sediments using high resolution mass spectrometry. Anal. Chim. Acta. 972, 54–61. doi: 10.1016/j.aca.2017.03.031
Tfaily, M. M., Hess, N. J., Koyama, A., and Evans, R. D. (2018). Elevated [CO2] changes soil organic matter composition and substrate diversity in an arid ecosystem. Geoderma 330, 1–8. doi: 10.1016/j.geoderma.2018.05.025
Tolić, N., Liu, Y., Liyu, A., Shen, Y., Tfaily, M. M., Kujawinski, E. B., et al. (2017). Formularity: software for automated formula assignment of natural and other organic matter from ultrahigh-resolution mass spectra. Anal. Chem. 89, 12659–12665. doi: 10.1021/acs.analchem.7b.03318
U.S. Geological Survey (2016). Redox Conditions in Contaminated Ground Water. Available at: https://pubs.water.usgs.gov/sir20065056 (accessed December 5, 2020).
van den Boogaart, K. G., and Tolosana-Delgado, R. (2008). “compositions”: a unified R package to analyze compositional data. Comput. Geosci. 34, 320–338. doi: 10.1016/j.cageo.2006.11.017
Wagner, K., Bengtsson, M. M., Besemer, K., Sieczko, A., Burns, N. R., Herberg, E. R., et al. (2014). Functional and structural responses of hyporheic biofilms to varying sources of dissolved organic matter. Appl. Environ. Microbiol. 80, 6004–6012. doi: 10.1128/AEM.01128-14
Wang, Q., and Zhan, H. (2015). “Characteristic and role of ground water in the critical zone,” in Developments in Earth Surface Processes (Elsevier), 295–318. doi: 10.1016/B978-0-444-63369-9.00010-0AQ
Ward, C. P., and Cory, R. M. (2016). Complete and partial photo-oxidation of dissolved organic matter draining permafrost soils. Environ. Sci. 50, 3545–3553. doi: 10.1021/acs.est.5b05354
Ward, C. P., Nalven, S. G., Crump, B. C., Kling, G. W., and Cory, R. M. (2017). Photochemical alteration of organic carbon draining permafrost soils shifts microbial metabolic pathways and stimulates respiration. Nat. Commun. 8:772. doi: 10.1038/s41467-017-00759-2
Watts, P. S., Naden, J., and Machell, J. (2001). Banks Long term variation in water colour from Yorkshire catchments. Sci. Total Environ. 278, 57–72. doi: 10.1016/S0048-9697(00)00888-3
White, T., Brantley, S., Banwart, S., Chorover, J., Dietrich, W., Derry, L., et al. (2015). “Chapter 2 - The role of critical zone observatories in critical zone science,” in Developments in Earth Surface Processes, eds J. R. Giardino and C. Houser (Elsevier) 19, 15–78. doi: 10.1016/B978-0-444-63369-9.00002-10
Wohl, E. (2015). “Chapter 9 - Rivers in the critical zone,” in Developments in Earth Surface Processes, eds J. R. Giardino and C. Houser (Elsevier), 19, 267–294. doi: 10.1016/B978-0-444-63369-9.00009-4
Wroblicky, G. J., Campana, M. E., Valett, H. M., and Dahm, C. N. (1998). Seasonal variation in surface-subsurface water exchange and lateral hyporheic area of two stream-aquifer systems. Water Resour. Res. 34, 317–328. doi: 10.1029/97WR03285
Yamashita, Y., Kloeppel, B. D., Knoepp, J., Zausen, G. L., and Jaffé, R. (2011). Effects of watershed history on dissolved Organic matter characteristics in headwater streams. Ecosystems 14, 1110–1122. doi: 10.1007/s10021-011-9469-z
Keywords: FTICR-MS, hyporheic zone, biogeochemical cycling, dissolved organic matter, river water, ground water
Citation: Fudyma JD, Chu RK, Graf Grachet N, Stegen JC and Tfaily MM (2021) Coupled Biotic-Abiotic Processes Control Biogeochemical Cycling of Dissolved Organic Matter in the Columbia River Hyporheic Zone. Front. Water 2:574692. doi: 10.3389/frwa.2020.574692
Received: 20 June 2020; Accepted: 18 December 2020;
Published: 18 January 2021.
Edited by:
Sarah E. Godsey, Idaho State University, United StatesReviewed by:
Eve-Lyn S. Hinckley, University of Colorado Boulder, United StatesBenjamin W. Abbott, Brigham Young University, United States
Copyright © 2021 Fudyma, Chu, Graf Grachet, Stegen and Tfaily. This is an open-access article distributed under the terms of the Creative Commons Attribution License (CC BY). The use, distribution or reproduction in other forums is permitted, provided the original author(s) and the copyright owner(s) are credited and that the original publication in this journal is cited, in accordance with accepted academic practice. No use, distribution or reproduction is permitted which does not comply with these terms.
*Correspondence: Malak M. Tfaily, dGZhaWx5QGVtYWlsLmFyaXpvbmEuZWR1