 Sandra Garcia1
 Pascale Louvat
 Jerome Gaillardet
 Lin Ma
- 1Department of Geological Sciences, University of Texas at El Paso, El Paso, TX, United States
- 2Institut de Physique du Globe de Paris, Paris, France
In semi-arid to arid regions, both anthropogenic sources (urban and agriculture) and deeper Critical Zone (groundwater with long flow paths and water residence times) may play an important role in controlling chemical exports to rivers. Here, we combined two anthropogenic isotope tracers: uranium isotope ratios (234U/238U) and boron isotope ratios (δ11B), with the 87Sr/86Sr ratios to identify and quantify multiple solute (salinity) sources in the Rio Grande river in southern New Mexico and western Texas. The Rio Grande river is a major source of freshwater for irrigation and municipal uses in southwestern United States. There has been a large disagreement about the dominant salinity sources to the Rio Grande and particularly significant sources are of anthropogenic (agriculture practices and shallow groundwater flows, groundwater pumping, and urban developments) and/or geological (natural groundwater upwelling) origins. Between 2014 and 2016, we collected monthly river samples at 15 locations along a 200-km stretch of the Rio Grande river from Elephant Butte Reservoir, New Mexico to El Paso, Texas, as well as water samples from agricultural canals and drains, urban effluents and drains, and groundwater wells. Our study shows that due to the presence of localized and multiple salinity inputs, total dissolved solids (TDS) and isotope ratios of U, B, and Sr in the Rio Grande river show high spatial and temporal variability. Several agricultural, urban, and geological sources of salinity in the Rio Grande watershed have characteristic and distinguishable U, Sr, and B isotope signatures. However, due to the common issue of overlapping signatures as identified by previous tracer studies (such as δ18O, δD, δ34S), no single isotope tracer of U, Sr, or B isotopes was powerful enough to distinguish multiple salinity sources. Here, combining the multiple U, Sr, and B isotope and elemental signatures, we applied a multi-tracer mass balance approach to quantify the relative contributions of water mass from the identified various salinity end members along the 200-km stretch of the Rio Grande during different river flow seasons. Our results show that during irrigation (high river flow) seasons, the Rio Grande had uniform chemical and isotopic compositions, similar to the Elephant Butte reservoir where water is stored and well-mixed, reflecting the dominant contribution from shallow Critical Zone in headwater regions in temperate southern Colorado and northern New Mexico. In non-irrigation (low flow) seasons when the river water is stored at Elephant Butte reservoir, the Rio Grande river at many downstream locations showed heterogeneous chemical and isotopic compositions, reflecting variable inputs from upwelling of groundwater (deeper CZ), displacement of shallow groundwater, agricultural return flows, and urban effluents. Our study highlights the needs of using multi-tracer approach to investigate multiple solutes and salinity sources in rivers with complex geology and human impacts.
Introduction
The Critical Zone, extending from surface vegetation and shallow soils to deeper permeable bedrock, provides chemical constituents to rivers and controls water quality (Brantley et al., 2006). Chemical fluxes to river systems may originate in soils via physical and biogeochemical processes as well as water-bedrock (saprolite) interactions in the shallow Critical Zone. However, these processes may have a limited role in exporting solutes to rivers in semi-arid to arid regions due to low amounts of rainfall and soil moisture. The deeper Critical Zone with long ground water flow paths and travel times may serve as an important solute contributor to river systems in these regions. Natural processes from the deeper Critical Zone such as upwelling of saline groundwater and dissolution of evaporites can significantly increase the salinity of arid rivers (e.g., Allison et al., 1990; Meybeck, 2003; Phillips et al., 2003; Hogan et al., 2007; Szynkiewicz et al., 2015a). Furthermore, human activities, such as dam construction, agricultural practices (e.g., irrigation, fertilizer/pesticide applications), groundwater pumping, and urbanization, have significantly modified the hydrologic cycle with respect to both water quantity and quality (e.g., Chetelat and Gaillardet, 2005; Lyons et al., 2012; National Research Council, 2012; Chen et al., 2014). Elevated salinity of rivers is an increasing concern for sustainable water management, especially for semi-arid to arid regions (Ghassemi et al., 1995; Postel, 1999; Johnson et al., 2001; Farber et al., 2004). While identifying sources of salinity in arid rivers is essential for the development of effective remediation strategies, it still remains a challenging task due to the lack of effective geochemical tools to distinguish multiple salinity sources of natural and human origins. Previous salinity tracers (e.g., major elemental concentrations and ratios, light stable isotope ratios such as δ34S, δ18O, and δD) have shown overlapping signatures for multiple salinity end members (e.g., Szynkiewicz et al., 2011, 2015b).
In this study, we explored the potential of combining uranium, boron and strontium isotopic tracers (234U/238U, δ11B, 87Sr/86Sr) to distinguish and quantify contributions from anthropogenic and natural processes that lead to salt loads in a semi-arid portion of the Rio Grande as well as in shallow groundwater aquifers. In particular, uranium isotope ratios (234U/238U) can be a potentially effective tracer in identifying salinity inputs from agricultural activities due to the high contents of natural U in phosphorous fertilizers and their distinctive secular equilibrium activity ratio (1.0) in fertilizers (e.g., Zielinski et al., 1995, 1997, 2000). Boron isotope ratios (δ11B) are useful in distinguishing urban salinity sources due to its high concentration in municipal wastewater and characteristic isotope ratios (e.g., Chetelat and Gaillardet, 2005). Strontium isotope ratios (87Sr/86Sr) have been shown to be effective in distinguishing water-rock interaction from various types of sedimentary and crystalline rocks (e.g., Brown et al., 2010). Despite that there may be overlapping signatures of single isotope tracer of U, B, and Sr for different salinity sources, our study aims at demonstrating that a multiple-isotope (U, B, and Sr) approach is a powerful tool in tracing and quantifying salinity inputs in arid rivers such as groundwater upwelling/pumping, agriculture, and urban activities. This study also highlights the effective use of (234U/238U) ratios to trace salinity related to agricultural practices.
Furthermore, our study focused on the Rio Grande river in the Southwestern United States (U.S.), a major river system experiencing high salt loads due to its semi-arid climate, complex in geological settings, and impacts from agriculture and population centers. In this study area, over two million of residents of southern New Mexico and western Texas rely on the Rio Grande for irrigation of cropland and municipal uses. In this region, average total dissolved solids (TDS) of the Rio Grande vary seasonally, remaining at relatively low values (~500 to 700 mg/L) during the spring-summer irrigation season and often reaching > ~2,000 mg/L during the fall-winter months when river flow is significantly reduced due to regulation by Elephant Butte Reservoir. The use of water with elevated salinity for irrigation has caused reduction of crop productivity and significant salt loading of soils (Ghassemi et al., 1995; Postel, 1999). Therefore, it has been a pressing issue to understand the origins of the elevated salinity in the semi-arid portions of the Rio Grande. This study improves our understanding of how human activity effects water quality and elemental cycles in a semi-arid river. As the studied region of the Rio Grande watershed faces many of the same water pressures as in other arid regions around the world, our multi-tracer approach has a potential to develop effective environmental tracers for similar river and aquifer systems elsewhere.
Rio Grande Watershed
General Settings
The Rio Grande is the fifth longest river in the U.S. and among the top twenty of the world. The Rio Grande originates in south-central Colorado and its main water source is from snowmelt in the Rocky Mountains (Figure 1; Ellis et al., 1993; Moore et al., 2008). The Rio Grande river water is currently distributed to three states (Colorado, New Mexico, Texas) and two countries (U.S. and Mexico; Water 2025: Preventing Crisis and Conflict in the West, 2005; Alley, 2013). Rapid population growth in this region has led to increasing demand for freshwater (Wong et al., 2012; Sheng, 2013). The Rio Grande river may soon reach tipping points with respect to both freshwater quality and availability under current scenarios of climate changes and population growth (Swetnam and Betancourt, 1998; Phillips et al., 2003, 2011; Seager et al., 2007; Gutzler and Robbins, 2010). Consequently, the U.S. Department of Interior has identified the Rio Grande region as having the highest potential for conflict and crisis among any U.S. river systems.
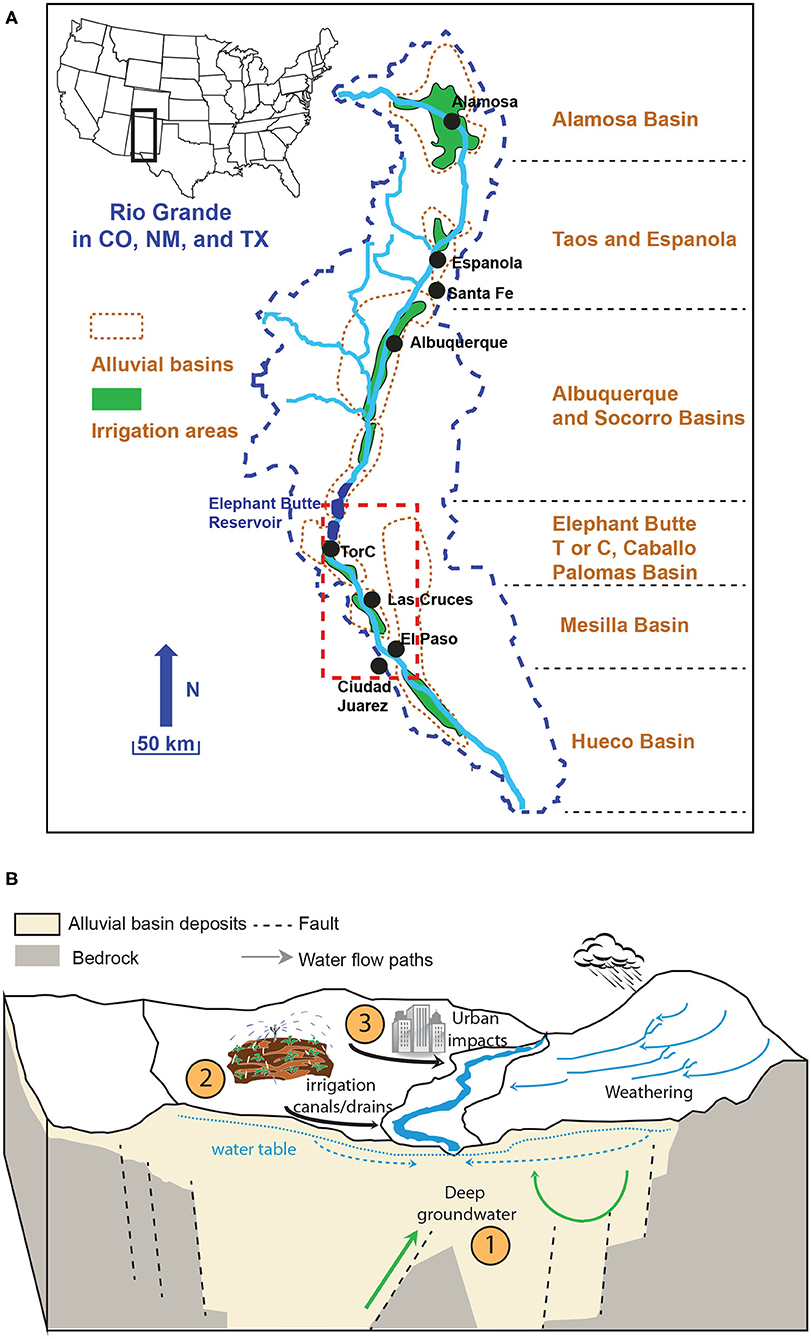
Figure 1. (A) The Rio Grande Watershed in Colorado, New Mexico and Texas (after Phillips et al., 2003; Hogan et al., 2007; Szynkiewicz et al., 2011). Major alluvial basins, cities, and irrigation areas along the river are indicated. Red dashed box indicates the detailed study area shown in Figure 2; (B) A simplified block model of multiple salinity sources in the Rio Grande Watershed. Natural and anthropogenic processes (numbers highlighted in closed circles) are included: (1) upwelling of deep groundwater and geothermal water; (2) agriculture water; and (3) urban activities. Chemical weathering is also an important process to control solute and salinity input but plays a limited role in semi-arid and arid regions.
The studied stretch of the Rio Grande is located in southern New Mexico and western Texas, flowing through the Rio Grande Valley along a series of rift basins filled with alluvial, fluvial, playa and lacustrine sediments (Figure 1; Phillips et al., 2003; Szynkiewicz et al., 2011). The climate in the study area is semi-arid to arid, with hot summers (mean air temperature in June ~28°C) and mild winters (mean air temperature in January ~8°C). For Elephant Butte reservoir, New Mexico and El Paso, Texas (Figure 2), the annual rainfall averages ~250 and 300 mm, respectively, with most of the rainfall occurring during the late summer months as monsoons (Miyamoto et al., 1995).
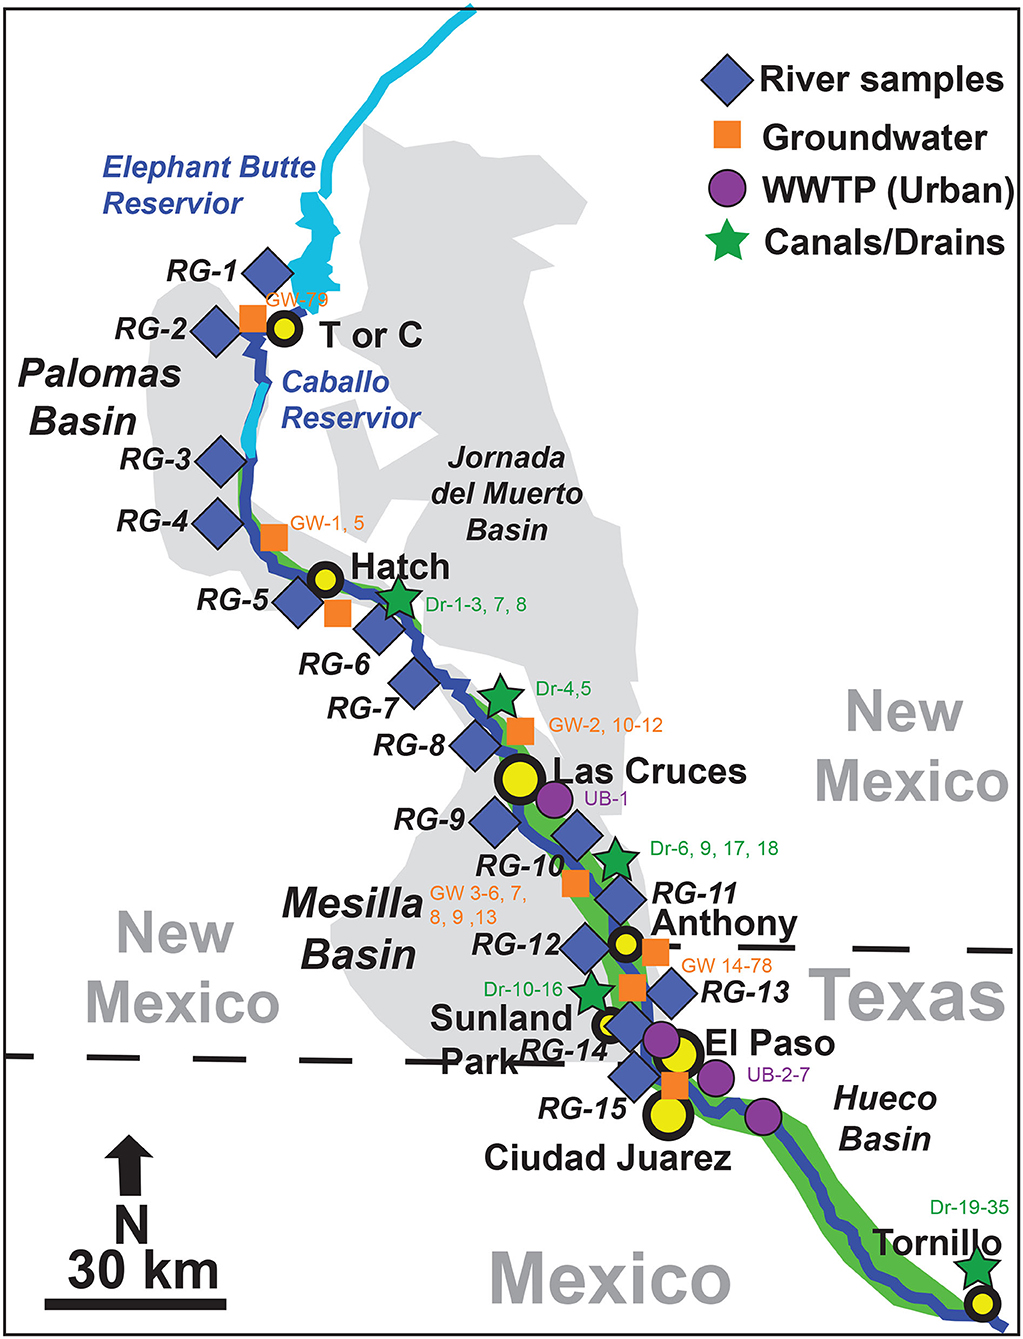
Figure 2. The ~200 km stretch of the Rio Grande from Elephant Butte reservoir in NM to El Paso, TX. Sample locations for river water, groundwater wells, agricultural canals and drains, and urban water (wastewater treatment plants: WWTP) are indicated. Details of sample location information is in Appendix Table 1.
Rio Grande Water Uses
In the study area, water from the Rio Grande is mainly used to irrigate ~193,000 acres of agricultural land (~800 km2) within the Hatch and Mesilla Valley irrigation districts (Garfin et al., 2013) (Figure 1A). Downstream from El Paso, TX, Rio Grande water is used to irrigate additional agricultural land in the Hueco Basin in Texas and Mexico. Water for irrigation is delivered through an interconnected system of dams, reservoirs, canals, and drains (commonly known as the Rio Grande project). In the study area, the Rio Grande river flows are regulated by Elephant Butte and Caballo Reservoirs, which generally store river water during fall and winter months (November through February, or non-irrigation seasons) and release water to downstream users during spring and summer (March through October, or irrigation seasons). Consequently, Rio Grande river flows vary significantly between irrigation and non-irrigation seasons as a result of considerable human impacts on the local hydrological cycle (Moyer et al., 2013). The river flows at downstream locations are high in spring and summer months but significantly reduced in fall and winter months. At some locations the riverbed can be completely dry for several months. Most of the low flows during non-irrigation seasons have been attributed to seepage from reservoirs, groundwater base flows, irrigation return flows, and effluents from wastewater treatment plants near large cities and population centers (Moore et al., 2008).
Multiple Sources of Solute and Salinity in Rio Grande Watershed
Previous investigations have identified multiple salinity sources to the Rio Grande but there is a general disagreement about which source is dominant. Upwelling of deep groundwater has been suggested as important salinity source at distal ends of alluvial basins where groundwater is inferred to flow upward due to uplifted basement blocks (Figure 1B; Moore and Anderholm, 2002; Phillips et al., 2003; Hogan et al., 2007; Moore et al., 2008; Williams et al., 2013). However, in the semi-arid region, the Rio Grande is a losing stream in most of southern New Mexico and western Texas (Driscoll and Sherson, 2016), and in dry years the Rio Grande channel completely dries out for several months during non-irrigation seasons. In addition, intense pumping of the groundwater has led to significant decreases of the groundwater table. These observations raise the question of the importance of the natural upwelling of saline groundwater in these alluvial basins as a dominant mechanism of direct input into the Rio Grande.
Other studies have suggested possible sources of salinity related to agricultural activities (e.g., evapotranspiration from agricultural field and return flows, displacement of shallow groundwater, irrigation use of groundwater, and application of fertilizers), urban/industrial inputs (e.g., point sources of treated or non-treated waste effluents), and shallow geological sources (e.g., dissolution of secondary evaporites in soil zones, and shallow brackish groundwater) (Figure 1B; Lippincott, 1939; Haney and Bendixen, 1953; Wilcox, 1957; Ellis et al., 1993; Moore and Anderholm, 2002; Phillips et al., 2003; Witcher et al., 2004; Hogan et al., 2007; Szynkiewicz et al., 2011; Moyer et al., 2013; Driscoll and Sherson, 2016).
Groundwater is another important source of irrigation water in this region particularly in drought years to supplement shortages of Rio Grande surface water. While elevated salinity values in some local groundwater is usually due to long residence time in sedimentary and crystalline bedrock in this region, evapotranspiration associated with agricultural fields has been suggested to increase salinity in irrigation return flows that in turn recharge to shallow groundwater underneath agricultural areas (Walton et al., 1999). It is unclear, however, whether there are additional important salinity inputs to shallow groundwater from other sources such as application of fertilizers on agricultural fields, and urban effluents discharging directly to the Rio Grande or infiltrating to shallow aquifers (Figure 1B).
Methods
Description of Sample Locations
We selected fifteen locations (RG-1 to RG-15) along a ~200 km-stretch of Rio Grande, from Elephant Butte Reservoir in southern New Mexico to State Highway 273 in the city of El Paso, Texas for river sample collection (Figure 2; Appendix Table 1). The water in the Elephant Butte reservoir (RG-1) is the source of river water in this region and represents a “baseline” for salinity investigations. Locations RG-2 (Williamsburg) and RG-3 (Percha Dam) have some agricultural activities but less than further downstream locations. RG-2 and 3 are located in an area with many reported natural occurrences of hot springs and geothermal activity (e.g., Williams et al., 2013; Pepin et al., 2015). However, local spa resorts near Location RG-2 may also lead to human-induced discharge of highly saline, geothermal groundwater sourced from artesian wells (Szynkiewicz et al., 2015b) and there is also effluent inflow into the Rio Grande at RG-2 from a nearby wastewater treatment plant. Locations RG-4 through RG-7 are along the Hatch and Mesilla Valley irrigation districts in the southern Palomas Basin and Mesilla Basin. Locations RG-8 through RG-11 are in close proximity to the city of Las Cruces, a relatively large urban area in southern New Mexico (population ~100,000) with one WWTP (UB-1) located below RG-8. Locations RG-12 through RG-15 are located between Anthony, New Mexico and El Paso, Texas (population ~800,000) near the distal end of the Mesilla Basin where plausible upwelling of highly saline groundwater to the Rio Grande has been previously suggested (e.g., Phillips et al., 2003; Hogan et al., 2007). However, there may be also inflow of saline water originating from shallow groundwater of the salt flat intersected by Montoya Drain near El Paso, which conveys return flows to the Rio Grande from nearby irrigation districts (Szynkiewicz et al., 2015b). At these 15 sampling sites, a total of ~200 river samples were collected monthly between 2014 and 2016 for elemental and isotopic analyses.
In this study, we also sampled 79 groundwater wells (GW-1–GW-79), 7 waste effluents from the cities of Las Cruces (UB-1), Sunland Park (UB-4), and El Paso (UB-2, 3, 5, 6, 7), and 35 irrigation canals/drains (DR-1–DR-35) along the studied stretch of the Rio Grande (Figure 2; Appendix Table 1). It is noted that due to the nature of population distribution in this region, many of the groundwater, urban, and agricultural samples were from the Messila Basin in the south while samples from the north study area were limited. Available archived samples from Szynkiewicz et al. (2015b) were also included to determine signatures of an agricultural drain near Tornillo, Texas which combines return flows from downstream irrigation districts located below the city of El Paso (Figure 2). Two archived samples (Szynkiewicz et al., 2011, 2015b) of shallow saline groundwater from monitoring piezometers near Fabens, Texas, one archived sample from an artesian well with geothermal groundwater near Truth or Consequences, New Mexico, and two shallow groundwater samples from private wells near Anthony, New Mexico were also included for isotope analysis. Finally, several archived samples of commonly used fertilizers in the region were also analyzed for U, B, and Sr isotope composition (Szynkiewicz et al., 2015b).
Water Sample Collection
Water samples were collected into 1L acid washed HDPE Nalgene bottles. Field measurements of pH, temperature, and electric conductivity were taken in situ during sample collection using a YSI Professional Plus multimeter, which was calibrated prior to sampling. The samples were stored in a cooler for ~5–6 h before arrival to the laboratory. In the laboratory, ~400 mL of each water sample was filtered using a 0.45 μm cellulose acetate filter to remove suspended sediment and particulates, and the filtered water was placed in two 250 mL acid washed HDPE Nalgene bottles. One bottle was acidified with 3 drops of ultrapure concentrated nitric acid for cation and isotope analysis, and the second bottle was archived without acidification for immediate anion analysis. The samples were stored at 4°C in the refrigerator before analysis.
Major and Trace Element Analysis
For major cation concentrations (Na, Ca, Si, K, and Mg), the acidified water sample was analyzed on a Perkin Elmer 5300DV Optical Emission Spectrometer (OES) at University of Texas at El Paso (UTEP). Two water standards (USGS M-210 and NIST 1640a) were analyzed at least 3–5 times during each analytical session to assess analytical precision of cations. The analytical precision was estimated to be better than 10% for major cations.
For major anion concentrations (Cl, SO4, and NO3), the non-acidified filtered sample was analyzed using a Dionex ICS-2100 at UTEP. An in-house water standard was measured at least twice during each analytical session to ensure accuracy. In general, the analytical precision of anions for the standards used was better than 12%. A selected number of samples were measured for alkalinity by the titration method. For the rest of samples, their alkalinity values were calculated based on the mass charge balance of the analyzed major chemical species.
A subset of samples was analyzed for trace element concentrations (U, B, and Sr) with a Thermo Fisher Scientific X Series 2 ICP-MS at the Pennsylvania State University Laboratory for Isotopes and Metals in the Environment (LIME). The NIST water standard (NIST 1640a) was used to assess accuracy. Analytical error was between 1 and 11%. In this study, only U, B, and Sr concentrations are reported and discussed. More details of the analytical methods for major and trace elements are reported in Nyachoti (2016) and Garcia (2017).
Uranium Isotope Analysis
Uranium isotopic ratios, 234U/238U, were measured for a subset of 116 river and other types of water samples at UTEP. A minimum of 50 ng of U was used to carry out U isotope analysis. The volume needed to obtain 50 ng of U was calculated using U concentrations [U] with trace elements analysis carried out at LIME. Samples were evaporated overnight at 90°C in a class-100 clean room. U column chemistry followed a procedure similar to Chabaux et al. (1995).
Purified U samples were analyzed on a Nu Plasma HR MC-ICP-MS at UTEP to determine 234U/238U isotopic ratios with the uranium standard (NBL145B) for standard-sample-standard bracketing. The estimated errors (2SE) of the isotope ratios were better than 0.5%. From the measured isotope ratios of 234U/238U, we calculated (234U/238U) activity ratios (here the parenthesis specifies the activity ratio) using decay half-lives of 234U and 238U (Cheng et al., 2000). The USGS rock standard BCR-2 was processed along with column chemistry and measured multiple times to ensure accuracy of measurements: average measured (234U/238U) activity ratio is 1.004 ± 0.002 (2SE, n = 10), consistent with the expected (234U/238U) activity ratio at equilibrium (1.0). The procedure blank for U was ~30 pg and negligible.
Boron Isotope Analysis
A total of 45 representative water samples (river and other types of water samples) were selected for B isotope analysis at the Institut de Physique du Globe de Paris (IPGP) in France. The measurements were made with the procedure described in Louvat et al. (2010, 2014). The procedure required ~300 ng of boron and the final solution to be at 200 ng/mL of B for isotope analysis. For samples with high salinity, the sample was diluted with 5 mL of 18 MΩ water to prevent clogging of the column.
The purified B samples were analyzed on a Neptune MC-ICP-MS at IPGP using a direct injection high efficiency nebulization (d-DIHEN) method developed by Louvat et al. (2014) to measure boron isotopic ratios. Each sample was measured three times. The standard reference material SRM 951 was used at the sample concentration for standard-sample bracketing. The boric acid reference material AE121 was measured 8 times to assess accuracy and precision (19.44 ± 0.07%, 2 SD). The North Atlantic Surface Seawater (NASS-5) standard was also processed along with the samples (39.55 ± 0.15%, N = 2; in agreement with Louvat et al., 2014).
Strontium Isotope Analysis
A total of 106 river and other types of water samples were selected for 87Sr/86Sr isotope analysis at UTEP. Around 25 ml of water samples were evaporated to dryness, the dried samples were re-dissolved in 3.5 N HNO3 then separated and purified through Sr-Spec resin. The purified samples were measured for 87Sr /86Sr ratios on MC-ICP-MS using the standard-sample bracketing method with NIST SRM 987 as the standard bracketing solution (Konter and Storm, 2014). About 200 mg of rock standard BCR2 was acid-digested in HNO3-HF and HCl-H3BO3 then separated through Sr-Spec resin. 87Sr/86Sr ratios in BCR2 reported an average value of 0.70502 ± 0.00001 (2σ; N = 5) consistent with values reported in the literature (0.70502; Raczek et al., 2003). Blanks for Sr analysis (~82 pg) are negligible.
Results
Our study focuses on the salinity (TDS) and chemical and isotopic compositions of U, Sr, and B observed in Rio Grande river samples for both irrigation and non-irrigation seasons as well as in different possible salinity end members (groundwater, agricultural water, and urban water). Salinity (TDS values converted from field measurements of electric conductivity) and major elemental concentrations (Na, Ca, Mg, K, Si, Cl, SO4, and NO3) from this study are archived at the EarthChem Library (http://dx.doi.org/10.1594/IEDA/111231). Concentrations and isotopic compositions of U, Sr, and B obtained in this study are presented in Appendix Table 2.
Water Salinity and Major Chemistry
In general, salinity values in the Rio Grande river in our study area vary both spatially and temporally. Between May 2014 and May 2016, the measured TDS values of the Elephant Butte Reservoir water (EBR: RG-1) showed a narrow range of 450 to 630 mg/L (average: 550 ± 60 mg/L; n = 15; Figure 3). In contrast, TDS values of the Rio Grande at downstream locations showed much greater variability. More specifically, under high flow conditions from April to July, Rio Grande water (RG-2 to RG-15) had TDS values ranging from ~450 to 840 mg/L (Figure 3). Higher TDS values (e.g., 840 mg/L) were generally observed in close proximity to agricultural areas and large urban centers (e.g., between RG-4 and RG-15). Under low flow conditions from August to March, Rio Grande water below EBR showed a large variability of TDS values from ~370 to 5000 mg/L (Figure 3). The highest TDS values (up to ~5,000 mg/L) was observed in close proximity to both Truth or Consequences (RG-2) and west El Paso (RG-15). The lowest TDS values (e.g., 370 mg/L) were observed near urban areas (RG-5 and RG-11).
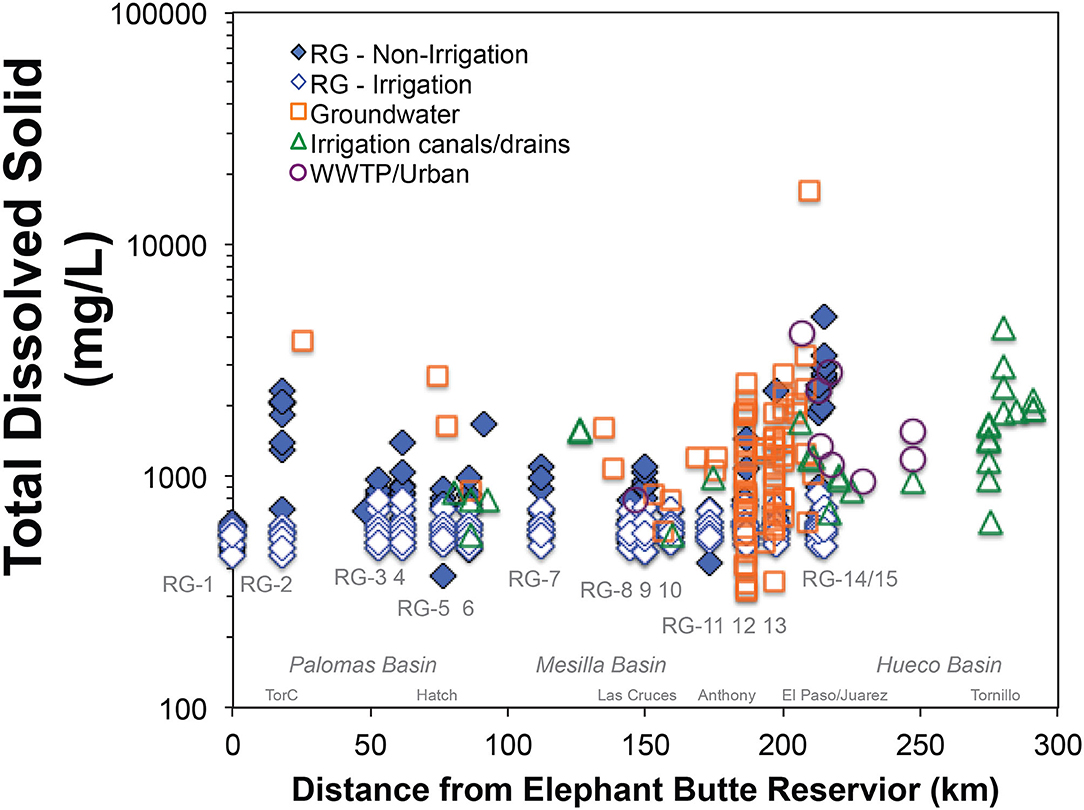
Figure 3. Total dissolved solids (mg/L) in Rio Grande river water, groundwater, agricultural canals and drains, and urban water (wastewater treatment plants: WWTP). The Rio Grande river water is classified into non-irrigation and irrigation seasons. The sample locations are placed with distance (km) from Elephant Butte Reservoir along the Rio Grande. Major cities and alluvial basins are indicated.
Major elemental concentrations for the Rio Grande river samples between May 2014 and May 2016 (http://dx.doi.org/10.1594/IEDA/111231) were used to calculate water chemistry types and saturation indices (SI) by Nyachoti (2016) and Garcia (2017). The main results are summarized here. The EBR (RG-1) water was largely the Ca-Na-HCO3-SO4 type during both irrigation and non-irrigation seasons. The downstream Rio Grande sites during the irrigation seasons were also dominated by the Ca-Na-HCO3-SO4 type. During the non-irrigation seasons, the water types at the downstream locations were more variable, including Ca-Na-HCO3-SO4 (RG-3, 4, 6), Na-Ca-SO4-HCO3 (RG-5, 7, 8), Na-Cl-SO4 (RG-9, 14, 15), and Na-Cl types (RG-2). These variable water types at downstream locations are mostly related to the contributions of additional Na, Ca, Cl, and SO4 sources that lead to changes of the Ca-Na-HCO3-SO4 type from upstream. According to the calculated SI values (Nyachoti, 2016; Garcia, 2017), all river water samples between May 2014 and May 2016 were saturated with respect to calcite and dolomite and under-saturated with respect to gypsum, halite, and thenardite. The degree of saturation (SI values) for calcite and dolomite increases from RG-1 to RG-15 while the SI values for gypsum and halite show higher values for selected locations (RG-2, 6, 7, and 15).
The salinity of Rio Grande river at downstream locations to RG-1 is impacted by possible salinity end members from geological, agricultural, and urban sources. The groundwater, agricultural canal/drain water, and treated wastewater samples from this study showed highly variable TDS values: 320–16,900, 550–4,300 mg/L, 780–1,554 mg/L, respectively (Figure 3). The water types of these end-member samples were also highly variable, mostly overlapping with the water types of the Rio Grande. The groundwater and agricultural canal/ drains had mainly Ca-HCO3-SO4, Ca-Na-HCO3-SO4, Na-SO4, and Na-Cl water types, and the dominant water type in the urban wastewater was Ca-Na-Cl-SO4 (Nyachoti, 2016; Garcia, 2017). It is noted that as a limitation of the study's approach to assess the end member salinity sources, the sample locations for the groundwater, agricultural canal/drain, and wastewater treatment plants are largely restricted to the nature of the distribution of population and agricultural centers that is centered along the river in the southern study area and only with a limited number of sample locations from the northern study area.
Uranium Concentrations and (234U/238U) Ratios
Generally, the measured U concentrations in the Rio Grande water samples (~0.6 to 10 μg/L) are considered to be higher than U concentrations of other major rivers (Chabaux et al., 2003) and the average U concentration of ocean water (~3 μg/L; Drever, 1997). Similar to the observations of the TDS values, the Rio Grande river water had less variable U concentrations during the irrigation seasons (~2 to 4 μg/L) and large variability during the non-irrigation seasons (~0.6 to 10 μg/L) (Appendix Table 2). There is a positive correlation between U and HCO3 concentrations in Rio Grande river samples (Figure 4). Noticeably, elevated U concentrations were observed during non-irrigation seasons mostly near agricultural areas and urban areas in Palomas and Hueco Basin (RG-3, 4, 15; Figure 5A). The lowest U concentrations in the Rio Grande were observed during non-irrigation season below the inflows of urban effluents (RG-9 and RG-14) as well as in several agricultural areas in Mesilla Basin (RG-7) (Figure 5). This observation is consistent with lower U concentrations measured in the urban effluents in this study (<0.1 to 2 μg/L; Figure 5A). By contrast, agricultural drains in this study generally have elevated U concentrations (~2 to 12 μg/L). The groundwater samples showed the most variations in U concentrations among the end-member samples, between <0.1 to 95 μg/L.
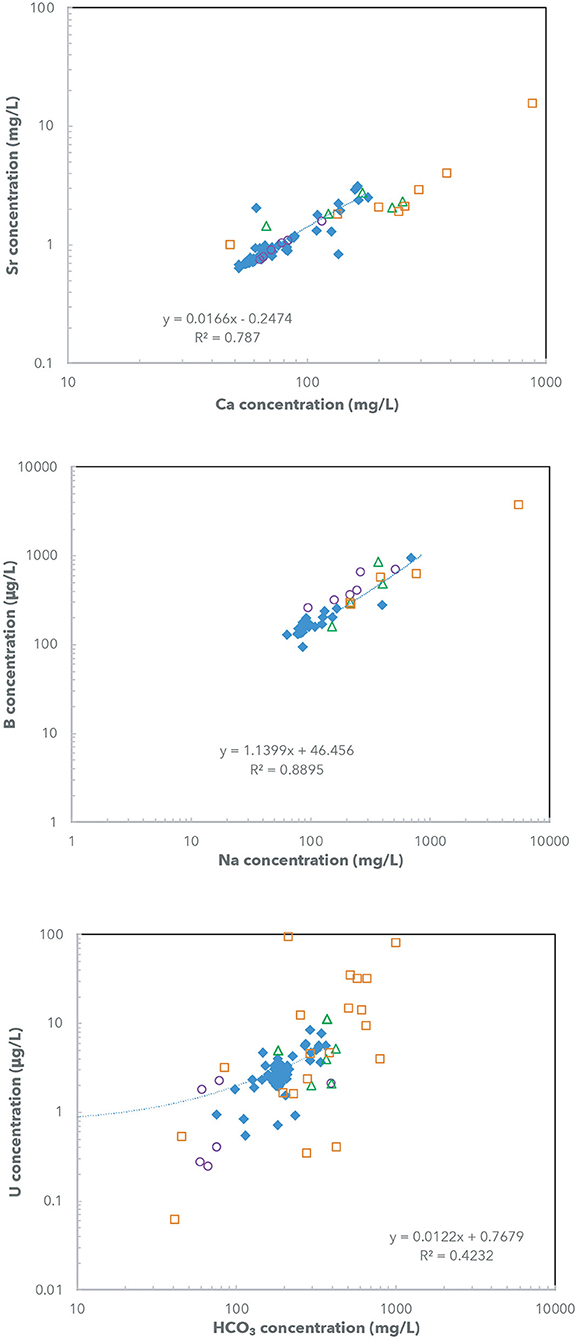
Figure 4. (A) Sr vs. Ca concentrations (mg/L), (B) B vs. Na concentrations (μg/L), and (C) U vs. HCO3 concentrations (μg/L), in Rio Grande river water, groundwater, agricultural canals and drains, and urban water (wastewater treatment plants: WWTP). Positive correlations for the Rio Grande river samples are indicated by linear fit lines.
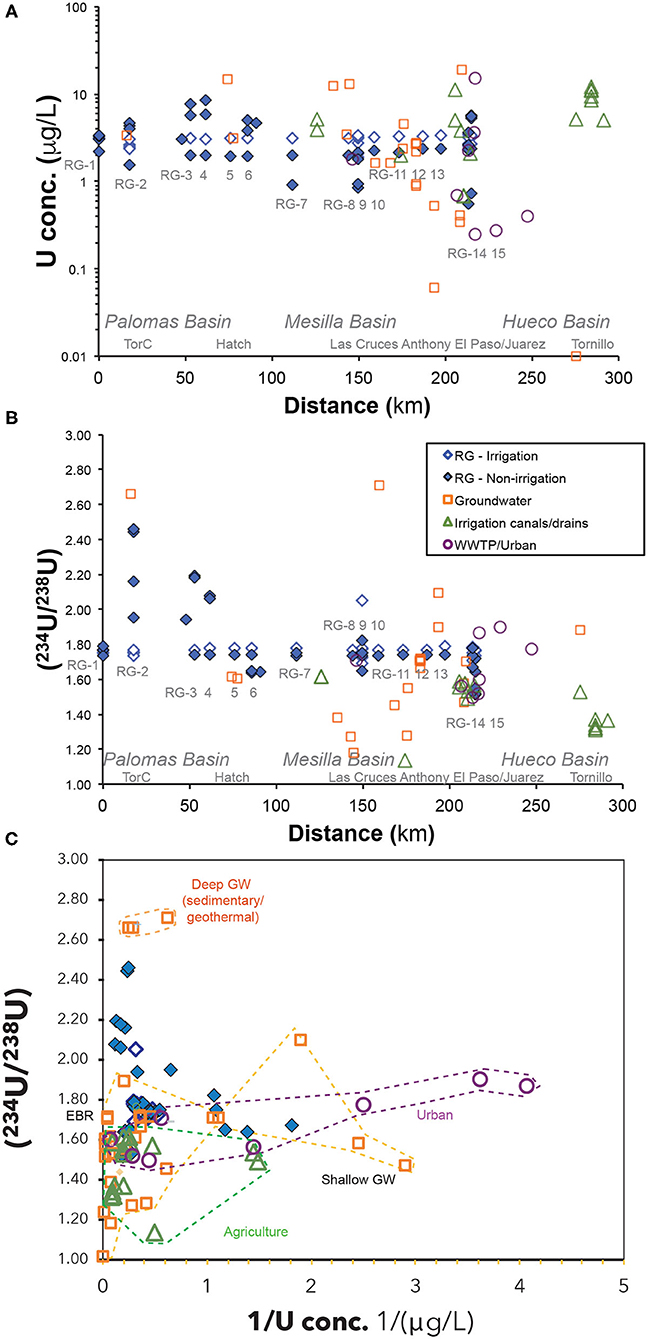
Figure 5. (A) U concentrations and (B) activity ratios in the Rio Grande river water, groundwater, agricultural canals and drains, and urban water (waste water treatment plants). The Rio Grande water is classified into non-irrigation and irrigation seasons. The sample locations are placed with distance (km) from Elephant Butte Reservoir along the Rio Grande. (C) U activity ratios vs. 1/U concentrations. End members for Elephant Butte Reservoir, shallow groundwater, deep groundwater, agricultural water, and urban water are indicated and outlined.
During irrigation seasons, the measured (234U/238U) ratios of the Rio Grande river water showed a narrow range between 1.7 and 1.8, similar to the Elephant Butte reservoir water (Figure 5B). During non-irrigation season the (234U/238U) ratios of Rio Grande showed much greater variations, with higher ratios (2.0 to 2.5) in locations RG-2, RG-3 and RG-4, in proximity to Truth or Consequences and Caballo Reservoir, and lower ratios (1.5 to 1.6) in locations RG-6, RG-9, RG-14, and RG-15, mostly observed near large agricultural and urban areas (Figure 5B). Noticeably, agricultural canals and drains showed characteristically lower (234U/238U) ratios (~1.1 to 1.6) compared to the Rio Grande. The urban wastewater had slightly higher (234U/238U) ratios (1.5 to 1.9) and mostly similar to the Rio Grande river water. The studied groundwater samples showed a large range of (234U/238U) ratios (~1.2 to 2.7). Significantly higher (234U/238U) ratios in groundwater were observed from areas with hot spring and hydrothermal activities such as from Truth or Consequences, NM or Fabens, TX, compared to relatively low ratios generally observed in shallow irrigation wells near agricultural areas along the Rio Grande (Appendix Table 2).
Boron Concentrations and δ11B
Both temporal and spatial variability of B concentrations in Rio Grande water samples follows similar trends as observed in U concentrations. There is also a positive correlation between B and Na concentrations (Figure 4). More specifically, the Rio Grande river water had limited variation of B concentration during the irrigation seasons (~90 to 200 μg/L) compared to much larger variations (~180 μg/L to 1,000 μg/L) during the non-irrigation season (Figure 6A). The groundwater, drain and urban water samples all had higher B concentrations (up to ~3,700 μg/L) compared to the Rio Grande river samples (Figure 6A).
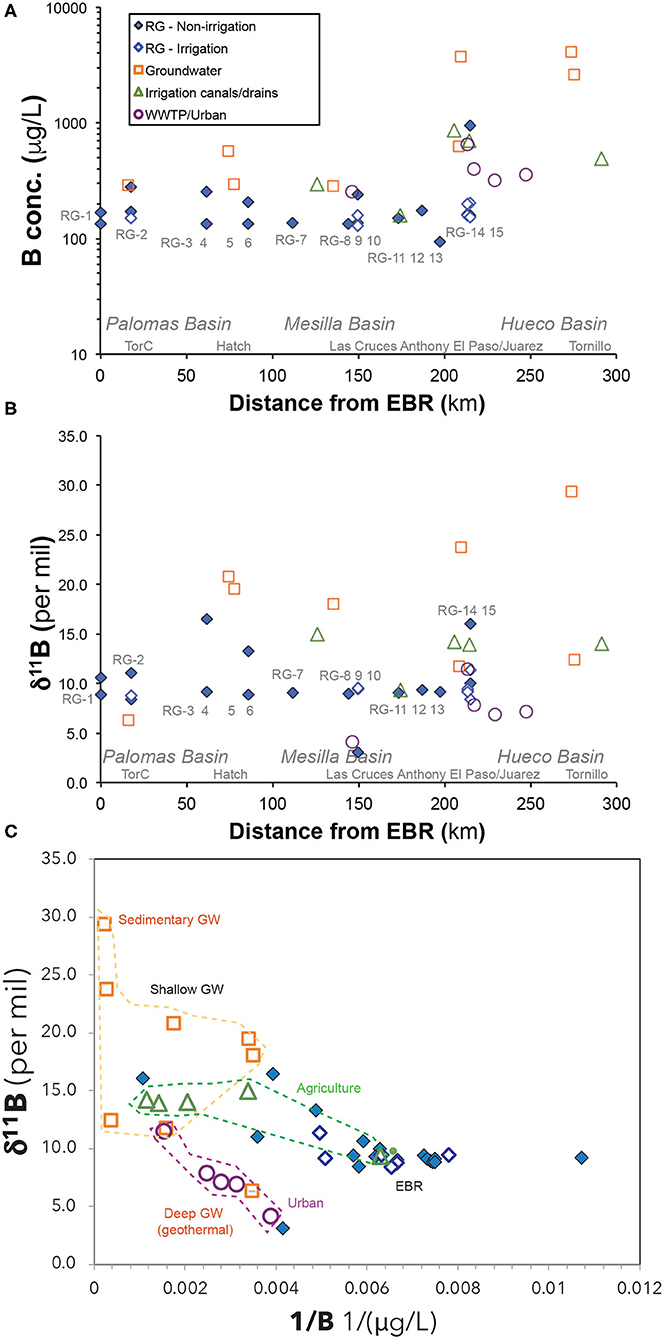
Figure 6. (A) Boron concentrations and (B) B isotope ratios in the Rio Grande river water, groundwater, agricultural canals and drains, and urban water (waste water treatment plants). The Rio Grande water is divided into non-irrigation and irrigation seasons. The sample locations are placed with distance (km) from Elephant Butte Reservoir along the Rio Grande. (C) B isotope ratios vs. 1/B concentrations. End members for Elephant Butte Reservoir, shallow groundwater, deep groundwater, agricultural water, and urban water are indicated and outlined.
The Rio Grande river samples also showed similar spatial and temporal trends of δ11B values to the measured (234U/238U) ratios, with smaller variation during irrigation seasons (+8% to +11%) and larger variation during non-irrigation seasons (+3% to +16%; Figure 6B). Urban wastewater had uniquely lower δ11B values (+4% to +11%) compared to higher values in drains (+9% to +15%). The highest δ11B values were measured in groundwater (+11% to +30%), with one exception for the geothermal groundwater sample in Truth or Consequences with a significantly lower δ11B of +6% (Figure 6B).
Strontium Concentrations and 87Sr/86Sr Ratios
The Rio Grande river samples showed low Sr concentrations during the irrigation seasons (~0.5 to 1.2 mg/L) and higher concentrations during the non-irrigation seasons (~1 to 3 mg/L) (Figure 7A). There is a positive correlation between Sr and Ca concentrations in these samples as well (Figure 4). The highest Sr concentrations in the Rio Grande water (~2 to 3 mg/L) were observed during non-irrigation season in Locations RG-2, 6, 14, and 15. Noticeably higher Sr concentrations were observed in agricultural drains (~2 to 4 mg/L). The groundwater samples showed the largest variation of Sr concentration, from ~1 to 16 mg/L. The urban effluent samples had Sr concentrations similar to the Rio Grande water (~1 mg/L).
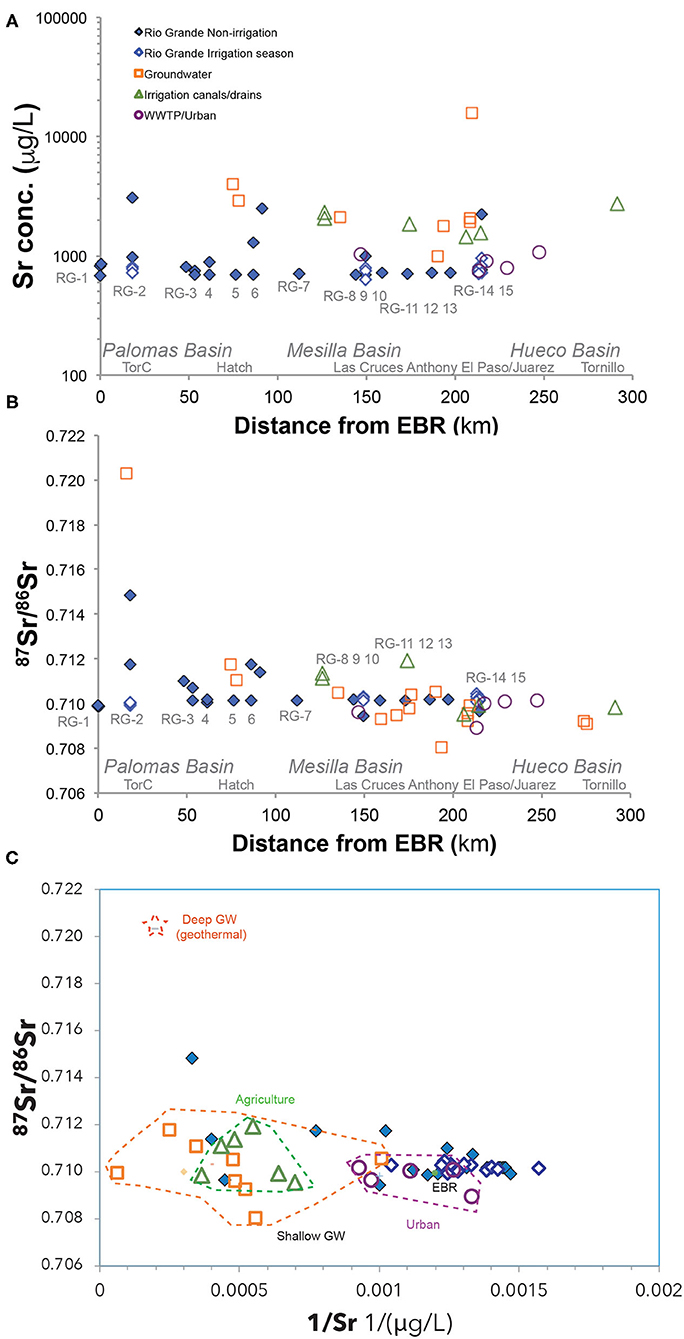
Figure 7. (A) Sr concentrations and (B) 87Sr/86Sr isotope ratios in the Rio Grande river water, groundwater, agricultural canals and drains, and urban water (waste water treatment plants). The Rio Grande water is divided into non-irrigation and irrigation seasons. The sample locations are placed with distance (km) from Elephant Butte Reservoir along the Rio Grande. (C) 87Sr/86Sr isotope ratios vs. 1/Sr concentrations. End members for Elephant Butte Reservoir, shallow groundwater, deep groundwater, agricultural water, and urban water are indicated and outlined.
During irrigation seasons, the measured 87Sr/86Sr ratios of the Rio Grande showed a narrow range of values (0.710 to 0.711), similar to Elephant Butte reservoir water (Figure 7B). In contrast, the 87Sr/86Sr ratios of Rio Grande during non-irrigation seasons showed much greater variation, with lower ratios in locations RG-9 and RG-15 (0.709 to 0.711) and higher ratios in locations RG-2 and RG-6 (0.712 to 0.715). Slightly high 87Sr/86Sr ratios (0.711–0.712) were observed in agricultural drains in Mesilla Basin, while lower ratios (~0.710) were observed in drains from the Hueco Basin (Figure 7B). The urban effluent had similar or slightly lower (87Sr/86Sr) ratios (~0.709 to 0.710). The studied groundwater samples showed the most diverse groups of values: much higher (87Sr/86Sr) ratios in Palomas Basin (~0.720) compared to low ratios in downstream locations in Mesilla and Hueco Basin (~0.708 to 0.710).
Discussion
Rio Grande Salinity End-Members and U, Sr, and B Isotope Tracers
Previous studies have identified multiple salinity sources of geological, agricultural, and urban origins in the semi-arid Rio Grande watershed of southern New Mexico and western Texas (Figure 1B; e.g., Ellis et al., 1993; Phillips et al., 2003; Moyer et al., 2013). Total dissolved solid contents, major element chemistry, and several light stable isotope ratios (δ18O, δH, and δ34S) have been used to attempt to identify and quantify contributions from each possible salinity end-members in the Rio Grande watershed. Several specific processes that have been previously identified, including: (1) natural upwelling of deep saline groundwater at the distal ends of alluvial basins, (2) mixing with saline groundwater in shallow aquifers via faults, (3) agricultural return flows from irrigation canals and drains, and (4) urban streams and discharges of treated or untreated wastewater from urban areas. Indeed, the groundwater, agricultural canals/drains, and urban wastewater samples in this study all show variable but elevated TDS (Figure 3) and are justified as potential salinity sources to the Rio Grande. However, accurate identification and quantification for contributions of these salinity end members are difficult due to the general overlapping values of TDS, major element concentrations and elemental ratios, as well as light stable isotope ratios (δ18O, δD, and δ34S) (e.g., Szynkiewicz et al., 2015b). In addition, several major elements (Ca, K, SO4 or NO3) or stable isotope ratios (δ18O, δD, and δ34S) may not behave conservatively in the Rio Grande watershed (e.g., Phillips et al., 2003; Szynkiewicz et al., 2015b), undermining their use as salinity tracers to identify the original sources. It is expected that U and Sr isotope ratios may behave conservatively in rivers under oxic conditions, while B isotope ratios may experience modification due to its intrinsic nature as a light stable isotope system. To apply these isotope ratios of trace elements to identify major salinity sources, it is generally expected that these trace elements (U, Sr, and B) mimic the changes of major elements (TDS, or Ca, Mg, K, Na, Cl, SO4, NO3) in water. Such an assumption is not easily to validate due to the different geochemical and physical behavior of these different elements. However, the Sr, B, and U concentrations of Rio Grande water samples in this study show a positive trend with respect to the changes of Ca, Na, and HCO3 concentrations, respectively (especially for Sr and B, Figure 4), strongly suggesting that the salinity changes were accompanied by the changes of Sr, B, and U concentrations. Such positive correlations of Sr, B, and U with TDS values support the use of their isotope tracers to identify sources of major elements and salinity in this study.
Characteristics of U, Sr, and B Isotope Ratios in Rio Grande Salinity End Members
Here, we first assess using the U, Sr, and B isotope ratios of groundwater, agricultural, and urban samples to characterize possible salinity end members in the Rio Grande watershed in this study area.
Agricultural Salinity Sources to Rio Grande
Palomas Basin, Mesilla Basin, and Hueco Basin host several populated areas in southern New Mexico and western Texas in cities of Hatch, Las Cruces, NM and El Paso, TX with a combined population of more than 1 million, or 2.3 million if the neighboring city of Ciudad Juarez, Mexico is included. The hydrologic cycle (river flow, groundwater flow, surface-ground water interactions) in the Rio Grande region has been extensively impacted by agricultural activities such as irrigation with river and groundwater. Rio Grande water is diverted to an extensive irrigation network of canals to irrigate a large area of agricultural land (193,000 acres in Palomas and Mesilla Basin; Figure 2) that is generally parallel to Rio Grande. Agricultural drains return excess irrigation water from the agricultural fields back to Rio Grande. The total length of the canals and drains is >1,700 km for the ~200 km-stretch of Rio Grande (Figure 2). Most of the canals and drains are not covered nor lined and significant water loss has been documented as evaporation, transpiration, and leakages to underlying aquifers (Moyer et al., 2013). In addition, during drought periods or low flow seasons of the Rio Grande, groundwater is generally pumped from numerous privately-owned irrigation wells from the alluvial aquifers as a supplement to irrigation water. The exact amount of groundwater pumping is difficult to monitor due to different regulations in New Mexico and Texas. However, the extensive groundwater pumping has led to well-documented declines in groundwater table and cone of depressions in this region.
The agricultural water samples from canals and drains in this study show highly variable salinity of ~700 to 2,800 mg/L (Figure 3), with noticeable increases in areas near major irrigation districts in New Mexico. Evaporation and transpiration on agricultural fields has been suggested to account for the increased TDS values (Phillips et al., 2003). The use of brackish to saline groundwater (TDS > 1,000 mg/L) for irrigation is another possible salinity source related to agricultural activities. Agricultural canals and drains in this study show high U concentrations (>10 μg/L) and distinctively low (234U/238U) ratios (~1.1 to 1.6) (Figure 5). Similarly, agricultural return flows and shallow groundwater beneath agricultural areas in other geographic regions such as California and Ohio have shown elevated U concentrations (e.g., Mangini et al., 1979; Nolan and Weber, 2015; Lyons et al., 2020). The elevated U concentrations in water from agricultural areas have been suggest as a result of the wide application of phosphorus fertilizers, which are generally enriched in U due to the co-presence of uranium and phosphorus in many phosphorous minerals. If such U in phosphorous minerals is geologically old (>1.25 Ma), then the U released from the phosphorus fertilizers can be inferred at secular equilibrium with a characteristic (234U/238U) ratio = 1 (Zielinski et al., 2000; Szynkiewicz et al., 2015b). Indeed, the agricultural canals and drains in the Rio Grande region show lower (234U/238U) ratios (~1.1 to 1.6) that is consistent with their interactions with fertilizer sourced U with the water flow path from agricultural fields. Consequently, this agricultural water end member could develop the high TDS values from a combination of processes such as evaporation and transpiration during water transport and irrigation on agricultural fields, leaching of soluble salts from agricultural fields, and displacement of shallow saline groundwater beneath the agricultural fields (e.g., Ellis et al., 1993).
The role of an agricultural salinity source to the Rio Grande river has been previously suggested by a series of sulfur isotope studies in this region in which the unusually low δ34S isotope signatures of Rio Grande water were attributed to the fertilizer sourced sulfur isotope end-member (Szynkiewicz et al., 2011, 2015a,b). However, despite its high potential to trace agricultural sourced salinity, an extensive use of sulfur isotopes are limited by two complicating factors: (1) significant overlapping δ34S values among fertilizers, sulfates, and sulfide sources; and (2) non-conservative nature of sulfates at surface or near surface environments (Szynkiewicz et al., 2011; 2015a,b). As highlighted in this study, U isotope systematics could be used as a particularly effective tracer for the agricultural salinity source as the fertilizer (234U/238U) ratio (e.g., ~1.0) is distinctively low compared to other natural (234U/238U) signatures (e.g., groundwater U) and U remains as a conservative tracer in most oxic environments at Earth's surface (Chabaux et al., 2003).
Furthermore, agricultural waters in this study show a characteristic narrow range of δ11B values (~+13.1 ± 2.5%, n = 4) (Figure 6). Previous studies have characterized the δ11B values in common types of fertilizers due to their high B contents (Barth, 2000; Chetelat and Gaillardet, 2005). However, previous studies show that fertilizers could have a large range of δ11B values (e.g., −2 to +17%) due to different geological sources of B in fertilizers, consistent with our measurements of fertilizer samples showing even larger δ11B variation (0 to +26%; Appendix Table 2). Hence the narrow range of δ11B values observed in the agricultural waters in this study highlights the possibility of several other processes that could modify δ11B values of the fertilizers along the water flow paths from the agricultural fields, such as extensive interactions with clay minerals and/or bio-uptake by crops. Indeed, it is well-known that δ11B values in water can be modified by water-clay interactions since adsorption-desorption processes could impact the coordination of dissolved boron ions and change their isotope signatures (Palmer et al., 1987). Bio-uptake of B also can modify B isotope signatures. These processes in the agricultural fields could be responsible for the observed narrow range of δ11B values in the agricultural water end-members and such a characteristic B isotope signature may be used to identify salinity from agricultural sources. However, additional studies that focus on understanding various processes in agricultural fields could help to develop the uses of B isotope ratios to trace agricultural activities.
87Sr/86Sr ratios of the agricultural water samples show a large range of values (0.709–0.712) that are overlapping with other end member values (Figure 7). Several fertilizer samples were analyzed for 87Sr/86Sr ratios in this study and show a large range of Sr ratios (0.709–0.730) that extend beyond the range of the agriculture water values (Appendix Table 2). The contribution of Sr from fertilizer sources to the agricultural water samples is thus limited and the overlapping of the agricultural water and river 87Sr/86Sr ratios suggests that the Sr source in the agricultural water is largely contributed by Sr in river water or groundwater that were used for irrigation. Hence, 87Sr/86Sr ratios have a limited resolving agricultural sourced salinity. By contrast, the combination of U and B isotope tracers show high potential to trace the agricultural salinity sources in the Rio Grande watershed.
Urban Salinity Sources to Rio Grande
Urban effluents (urban streams or treated or untreated wastewater discharge) are likely the source of elevated TDS, NO3, SO4, Cl, and Na for rivers flowing through large cities (e.g., Chen et al., 2014). Indeed, high concentrations of TDS, NO3, and SO4 are observed in urban samples such as the WWTP samples collected from Las Cruces, Sunland Park, and El Paso areas (Figure 3; http://dx.doi.org/10.1594/IEDA/111231), consistent with previous observations (Szynkiewicz et al., 2011, 2015a,b). In this study, these urban samples show characteristic high B concentrations (>200 μg/L) and low δ11B values (−4 to +11%) (Figure 6). The low δ11B signatures reflect addition of isotopically light B present in soaps and detergents from urban sources. Indeed, previous studies have documented that most of industrial B products are mined from two main sources in Turkey and California, USA that have relatively uniform and low δ11B values of −4 to +4% (e.g., Barth, 2000; Chetelat and Gaillardet, 2005). Consequently, large rivers near highly populated areas (e.g., the Seine river near Paris, France) tend to have low δ11B (e.g., ~+5%; Chetelat and Gaillardet, 2005), as a result of urban effluents. Nevertheless, some urban effluent samples from El Paso had higher δ11B values (e.g., up to 11%, Figure 6C), most likely impacted by the high B concentrations from local groundwater used as municipal water sources. The local groundwater may develop high δ11B signatures due to interactions with sedimentary bedrock of marine origins (also see next section Deep and Shallow Groundwater Components in Rio Grande Watershed).
In contrast to the B isotope signatures, both (234U/238U) ratios and 87Sr/86Sr ratios of the urban samples show large overlaps with agricultural and groundwater samples (Figures 5C, 7C), suggesting that the U and Sr sources in the urban samples are dominated by river water and local groundwater and have limited resolution to distinguish urban salinity sources. However, it is noted that the U concentrations in these urban end-member samples are unusually low as compared to other types of water samples in this study (Figure 5C). Such low U concentrations may indicate that certain artificial processes could remove U from the urban water, such as during the treatment steps of the city wastewater. For example, it is a common approach to purge air into the wastewater to oxidize dissolved Fe phases and to promote precipitation of Fe oxides during the wastewater treatment. It is known that U has high affinity onto amorphous Fe oxides (e.g., Duff et al., 2002) and hence, the removal of Fe-oxides from wastewater could also remove U from the wastewater. If the U removal process is originated from the wastewater treatment step, the unusually low U concentrations could be an additional detectable signature for urban water inputs to the environments.
Deep and Shallow Groundwater Components in Rio Grande Watershed
Unlike the agricultural and urban salinity sources that have several unique and characteristic U or B isotope signatures, the geological salinity sources, as represented by a limited number of groundwater samples in this study, have variable U, Sr, and B isotope signatures due to the presence of multiple groundwater components with different evolution history (Figures 5–7). More specifically, the combination of U, B, and Sr isotope tracers shows the presence of three possible groundwater components in the Rio Grande region: (1) deep groundwater with a sedimentary salinity source, (2) deep groundwater with a geothermal salinity source, and (3) shallow groundwater with multiple salinity sources. Below, we discuss the possible U, Sr, and B isotope signatures to identify these groundwater components.
A deep origin of several groundwater samples from Palomas Basin and Mesilla Basin can be inferred from their elevated (234U/238U) ratios (up to ~2.7) (Figure 5C). It has been suggested that deep groundwater tend to carry higher (234U/238U) ratios than surface water, soil water, and shallow groundwater (Chabaux et al., 2003; Durand et al., 2005). For example, when groundwater flows through a redox front in the aquifer, generally at deeper part of the aquifer, U solubility decreases significantly under reducing conditions (e.g., Langmuir, 1978; Drever, 1997). Due to the enhanced alpha recoil effect from the U-enriched aquifer matrix and long groundwater residence time, groundwater could develop abnormally high (234U/238U) ratios, such as up to ~10 in deep carbonate aquifers of Texas and South Africa (Osmond and Cowart, 1992; Kronfeld et al., 1994). This is in contrast with the moderate degrees of alpha recoil effects in surface water, soil water, and shallow groundwater as U-series disequilibrium are largely controlled by climatic, geological and hydrologic conditions (e.g., Maher et al., 2004, 2006; Robinson et al., 2004; DePaolo et al., 2006; Chabaux et al., 2008; Andersen et al., 2009; Pogge von Strandmann et al., 2010).
The sedimentary origin of these groundwater samples is supported by their δ11B values. For example, two of these samples (GW-18 and Faben well#1) show characteristic high δ11B ratios (+24 to +29%; Figure 6C) that represent typical values observed in deep sedimentary brines with ancient marine evaporites (e.g., +35 to +40%) (e.g., Spivack and Edmond, 1987; Louvat et al., 2011). These groundwater samples are most likely linked to deeper sedimentary aquifers that are commonly present in the study area. One other deep groundwater sample (GW-79), however, show much lower δ11B value (+6%) despite of the high (234U/238U) ratio, and is most likely linked with a geothermal signature. Indeed, geothermal water is often characterized by lower δ11B ratios of such as from 0 to +10%, due to the enhanced water-rock interactions in high temperatures that preferentially release light 10B isotopes from aquifer rocks to groundwater (Spivack and Edmond, 1987; Louvat et al., 2011).
The presence of two different origins of deep groundwater (geothermal and sedimentary) is also supported by the 87Sr/86Sr ratios in groundwater, which are mainly controlled by types and ages of the source rocks along its flow paths (Blum et al., 1998; Capo et al., 1998; Shand et al., 2009). Two contrasting groups of 87Sr/86Sr ratios are observed in the groundwater samples in the study area (Figure 7B): 1) a possible geothermal source with links to more radiogenic crystalline basement blocks (e.g., up to 0.720, GW-79), and 2) a sedimentary source with carbonates or sandstone aquifers (e.g., 0.710). Consistent with the discussion of U, B, and Sr isotope tracers, the δ34S ratios in SO4 of groundwater waters from this region also suggested the presence of (1) geothermal/hydrothermal groundwater that has a signature from oxidation of hydrothermal sulfide-rich mineralization, and (2) groundwater water with a sedimentary marine signature (Szynkiewicz et al., 2015a,b).
In addition to the presence of two different deep groundwater components (geothermal and sedimentary), a large number of groundwater samples in this study show overlapping U, B, and Sr signatures with Rio Grande water, agricultural water, or urban water (Figures 5–7). Many of these groundwater samples were collected from irrigation wells close to Rio Grande in the agricultural fields with no well log information for well depth or screening depth. However, the identification of Rio Grande water U, B, and Sr signatures in these groundwater samples could point them to a shallow groundwater component. Indeed, Rio Grande water is the main recharge water source for shallow aquifers in Mesilla Basin, as a part of a complex surface-groundwater interaction in this region under both natural and human impact conditions (Witcher et al., 2004). Such recharge mainly occurs as leakage from the main river channel, leakage from canals and drains, as well as infiltration from irrigated agricultural fields (Walton et al., 1999; Witcher et al., 2004). Consistent with this inference of shallow groundwater recharge process, many groundwater samples in this study have similar U isotope signatures to Rio Grande water and agricultural water samples. In addition, urban water could also contribute to shallow groundwater through leakages of runoff or infiltration from urban areas, as evidenced by one groundwater sample (GW-19) that has a urban B signature.
Importantly, the shallow groundwater in the Rio Grande region clearly shows signatures of human impacts with agricultural or urban activities. Indeed, recent studies with 3H and 14C tracers have indicated that most of the shallow groundwater systems around the world has shown significant components of young or modern recharge water, suggesting an extensive connection and interaction of surface and groundwater systems (Gleeson et al., 2016; Jasechko, 2016). Our study highlights that such a connection also exists in the semi-arid Rio Grande region: although natural groundwater recharge rate is low due to the semi-arid or arid climate in this region, groundwater recharge could occur as a result of irrigation or urban runoff in Palomas Basin and Mesilla Basin (e.g., Eastoe et al., 2007; Ahadi et al., 2013). Human impacts to the groundwater aquifers in this region hence are not only limited to groundwater extraction, but also may increase groundwater recharge and surface-groundwater interactions.
Characterization of U, Sr, and B Isotope Ratios in Rio Grande Salinity Sources
For each salinity source, the average and standard deviation values for U, Sr, and B isotope ratios and concentrations from the sample group calculated and summarized in Table 1. It is clear that the above salinity end members identified with the agricultural, urban, and groundwater samples have overlapping isotopes signatures and no single isotope tracer of U, Sr, or B would be able to distinguish multiple salinity sources. The issues of overlapping signatures in Rio Grande salinity sources are common and have been identified with tracers such as δ18O, δD, δ34S. The overlapping signatures of Rio Grande salinity sources are intrinsically related to the complex nature of surface-groundwater interaction under both natural and managed conditions in Rio Grande watershed.

Table 1. End member values inferred for salinity sources in the Rio Grande Watershed in this study.
More specifically, despite that natural groundwater recharge rate is low due to the semi-arid or arid climate in this region, Rio Grande river water is the dominant source of groundwater recharge in alluvial aquifers (shallow groundwater). Both Rio Grande river and shallow groundwater are also the dominant sources of agricultural and urban water uses. The agricultural and urban water uses may also lead to recharge to shallow groundwater aquifers through irrigation or urban runoff. These complex natural and managed hydrological settings generate similar signatures for salinity sources such as shallow groundwater with Rio Grande water, agricultural, and urban water, as evidenced by the large overlaps of 87Sr/86Sr isotope ratios (Figure 7). However, deep groundwater can be distinguished by their characteristic high 87Sr/86Sr ratio. In addition, urban water samples tend to have lower Sr concentrations than groundwater and agricultural water samples. Furthermore (234U/238U), ratios and concentrations highlight the characteristics of agricultural and deep groundwater salinity end members (low vs. high 234U/238U ratios) and urban water samples (low U concentrations). The B isotope systematics also highlight the resolving power of separating urban water signatures from agricultural and groundwater signatures. Hence, instead of relying on one single tracer, we combine both isotope ratios and elemental concentrations of U, Sr, and B in a multi-tracer approach to systematically identify the characteristic signatures of the complex nature of the salinity sources.
Spatial and Temporal Variability of Rio Grande River Salinity and Contributing End Members
We aim to assessing the spatial and temporal variability of the Rio Grande river salinity for the study period with the above identified U, B, and Sr isotope and elemental signatures of the agricultural, urban, and geological sources. However, during the irrigation (high flow) seasons, the concentrations and isotopic compositions of U, B and Sr in the Rio Grande were very similar to the Elephant Butte reservoir water (Figures 5–7). This is in agreement with that during high river flows, the river chemistry mainly reflects the chemistry of upstream reservoirs. In contrast, the Rio Grande showed highly variable U, B and Sr concentrations and isotope ratios during the non-irrigation (low flow) seasons and we hence focus on the Rio Grande during non-irrigation (low flow) seasons from Elephant Butte reservoir to El Paso, TX.
Natural Upwelling of Deep Groundwater in Palomas and Mesilla Basin to Rio Grande
In the Truth or Consequence region, ~0 to 50 km downstream to the EBR, the Rio Grande river water is characterized by unusually high (234U/238U) ratios (up to ~2.5) as well as moderately low δ11B ratios (~+7 per mil) during the non-irrigation seasons. In addition, the 87Sr/86Sr ratios in the same river samples during non-irrigation seasons show high radiogenic signatures (up to 0.715), in contrast to the Rio Grande water during irrigation season (0.709 to 0.710). The Truth or Consequence region marks the northern portion of the Palomas Basin with limited human impacts due to the low population and the lack of large agricultural areas (Figure 2). In this region, the young alluvial sediments are in generally thin and the uplifted and highly fractured old (Paleozoic to Pre-Cambrian) crystalline basement is close to the surface (Pepin et al., 2015). The impacts of deep groundwater to shallow aquifers and surface environments have been well-documented by the presence of numerous hot springs and geothermal wells in this region (Williams et al., 2013; Pepin et al., 2015). Indeed, U, Sr, and B isotopic systematics all point to the presence of deep groundwater signatures in the Rio Grande river as a result of groundwater upwelling, including high (234U/238U) and 87Sr/86Sr ratios as well as low δ11B values of typical geothermal water (Figures 5–7).
Impacts of Agricultural Salinity in Palomas Basin and Mesilla Basin
Both U and B isotope ratios of the Rio Grande at ~50 to 250 km downstream to EBR show very different signatures from those of the northern Palomas Basin, suggesting a change of dominant salinity source as inferred from the non-irrigation river samples (Figures 5, 6). For example, U isotope ratios of Rio Grande river samples decrease rapidly from high to low ratios (from ~2.5 to ~1.6), except for locations near Las Cruces and El Paso where several high (234U/238U) ratios (~2.1) are observed (Figure 5). Such a decrease of (234U/238U) ratios might be related to a reduced geothermal/deep groundwater input as the thickness of the alluvial basin increases when the Rio Grande flows into the center of Palomas Basin. The inferred decrease of natural upwelling of highly saline groundwater in this region should lead to a significant decrease of river salinity if the upwelling of groundwater is the dominant salinity source to the Rio Grande. However, the river salinity in this region only decrease moderately from ~3,000 mg/L in the northern Palomas Basin to ~2,500 mg/L in the southern Palomas and Mesilla Basin during the non-irrigation seasons (Figure 3). Such an observation suggests that in addition to the groundwater salinity source, other salinity sources are present and responsible the elevated salinity in the Palomas Basin and Mesilla Basin region. The most likely salinity source could be from the agricultural source. Indeed (234U/238U), ratios of Rio Grande in this region show values (~1.6) lower than the dominant irrigation season river samples (~1.7), consistent with the presence of the fertilizer related salinity source with the characteristic low U isotope signatures (Figure 5B). As suggested by other hydrogeological studies in this region (e.g., Ellis et al., 1993; Walton et al., 1999), the inputs of agricultural salinity are due to direct agricultural return flows or displacement of shallow groundwater underneath agricultural fields to drains.
The δ11B ratios of Rio Grande water in this region first increase to ~+16 per mil in Palomas Basin and then decrease to ~+9 per mil in Mesilla Basin (Figure 6B). It is noted that the intermediate range of δ11B values in Rio Grande is mostly similar to the agricultural water end-member, also consistent with the presence of the agricultural sourced salinity in this region.
Several locations along the Rio Grande such as near Lac Cruces, NM or El Paso, TX show relatively higher δ11B values as well as higher (234U/238U) ratios (Figures 5, 6), which could indicate that the salinity sources in the Rio Grande in this region may not be solely from agricultural activities. The addition of salinity from a groundwater source via deep seated faults in the alluvial basin is possible (Witcher et al., 2004; Hiebing et al., 2018). However, many fault zones are not located near the main channel of Rio Grande and these groundwater likely sourced salinity could be the result of artificial groundwater pumping for irrigation and municipal uses, not due to natural upwelling of groundwater similar to the northern Palomas Basin. To summarize, the combination of U and B isotope tracers points to the presence of a large agricultural source of salinity to Rio Grande in Palomas Basin and Mesilla Basin.
Addition of Urban Salinity Sources Near Large Populated Areas
The presence of large urban centers in this region such as cities of El Paso, TX, Las Cruces, NM, and Juarez, Mexico is an important factor when considering processes to modify both water quality and quantity for the Rio Grande. In this region, the common municipal water sources are generally a combination of surface water from the Rio Grande and groundwater withdraw from alluvial aquifers (such as Mesilla and Hueco aquifers; Sheng, 2013). Urban centers are known as important point sources of effluents for rivers. The released urban water (e.g., treated city wastewater or untreated urban runoff) could have certain distinctive chemical compositions and isotopic signatures, as urban water uses generally lead to high concentrations of Cl (product of chlorination), Na and K (exchange ions in water softeners), NO3 (city waste water), F (fluoridation for public health), and B, Ca, SO4 (soaps and detergents). High concentrations of major elements such as Cl, Na, K, NO3, and SO4 have been observed in urban water samples in this study (http://dx.doi.org/10.1594/IEDA/111231). Here, we focus on using B isotope systematics to identify urban salinity contribution to Rio Grande river. Indeed, Rio Grande river in this study show anomalously low δ11B values with high B concentrations: ~+4 per mil near Las Cruces, NM (~150 km) and ~+15 per mil near El Paso, TX (~220 km) (Figure 7), consistent with the presence of urban B source in Rio Grande at these locations.
In contrast to the distinctive lower B isotope ratios (234U/238U), ratios of the urban water samples show overlapping values (~1.6 to 2.0) with Rio Grande river water and groundwater samples (Figure 5). This observation is consistent with the fact that the municipal water is a combination of river and groundwater and it is inferred that the urban water uses do not modify (234U/238U) ratios. Hence (234U/238U), ratios are not a resolvable signature for tracing urban source salinity. However, the Rio Grande near the Las Cruces, NM and El Paso, TX areas shows lower U concentrations for certain sampling months (Figure 5), most likely reflecting the addition and dilution of U by treated urban wastewater, as we previously identified that the low U concentrations could be an indicative character of urban water end member.
In addition to the urban water end member, the combined U and B isotope systematics also shown that the Rio Grande river near large urban areas such as El Paso, TX is impacted by multiple salinity sources from agricultural and geological sources (Figures 5–7). The contribution of geological source has been suggested as upwelling of groundwater as the area is located at the distal end of the Mesilla Basin and groundwater is forced to flow upward due to the thinning of the alluvial deposition on top of the basement rocks (Phillips et al., 2003; Hogan et al., 2007). Geological factor has been identified as a key factor in this area for understanding the contribution of salinity in Rio Grande watershed (Phillips et al., 2003; Hogan et al., 2007). However, it is also possible that the shallow groundwater flows could bring agricultural source of salinity as part of the upwelling process. Indeed (234U/238U), ratios in Rio Grande in this area show low values that suggest the contribution of agricultural sources of salinity, instead of high (234U/238U) ratios such as observed at the northern Palomas Basin. Hence, the multi-tracer dataset of U, B, and Sr isotope ratios clearly show evidence of multiple salinity sources (geological, agricultural and urban) to the Rio Grande river at the end of the Mesilla Basin.
Quantification of Contributions of Salinity Sources to Rio Grande: A Multi-Isotope (U, B, and Sr) Mass Balance Approach
The multi-tracer dataset of U, B, and Sr isotope ratios highlights the presence of multiple salinity sources in the Rio Grande watershed and that their contributions to Rio Grande river var both spatially and temporally (Figure 8). As discussed in previous sections, despite that no single isotope tracers of U, B, and Sr can effectively distinguish the multiple salinity sources, the combination of the isotope tracers and elemental concentrations of U, B, and Sr shows potentials in a multi-tracer approach. Here, we use a mass balance model to quantify the contributions of individual salinity source, as summarized below.
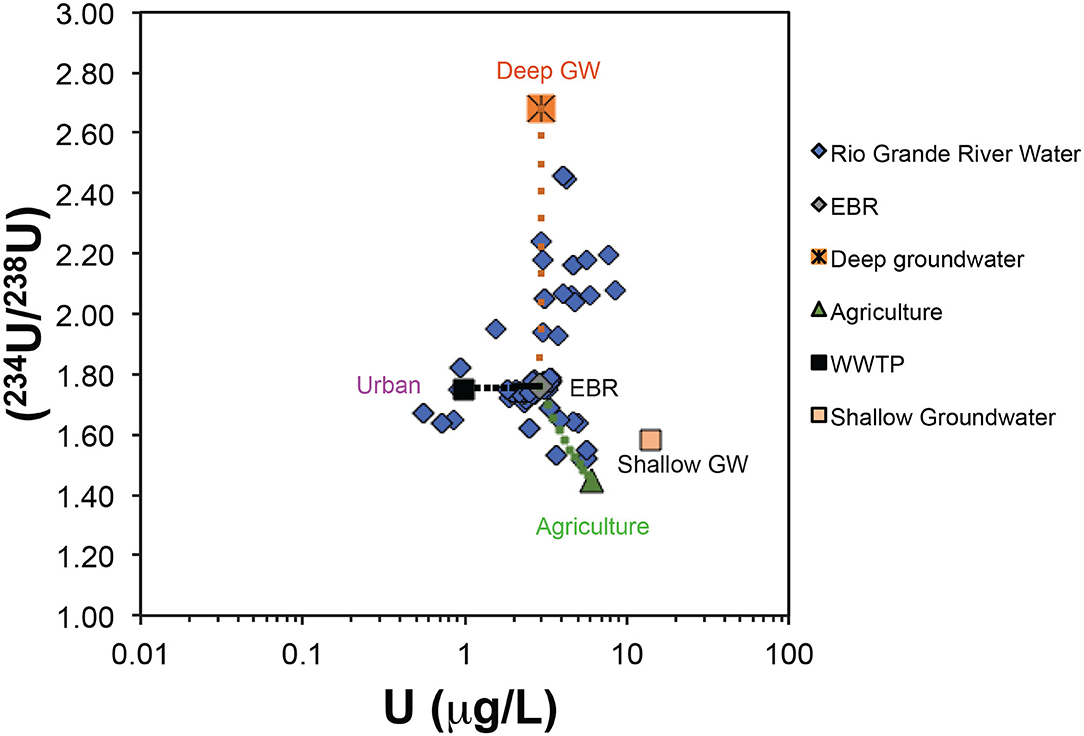
Figure 8. U activity ratios vs. U concentrations in the Rio Grande river during non-irrigation seasons. End member values (Table 1) for Elephant Butte Reservoir, shallow groundwater, deep groundwater, agricultural water, and urban water are indicated. Dashed lines indicate the conceptual model of multiple salinity contribution to the Rio Grande water.
For a given sampling location, the isotopic composition of Rio Grande water (RRioGrande) and elemental concentration (CRioGrande) for an element (U, Sr, or B) can be calculated as:
Here, the f values in the above equations are the relative water mass contribution of salinity sources: Elephant Butte reservoir water (EBR), deep groundwater, shallow groundwater, agricultural water, and urban water. For each salinity source, the characteristic values for U, Sr, and B isotope ratios and concentrations have been discussed and are summarized in Table 1. The f values from each salinity source can be constrained by using U, Sr, and B isotope ratios and concentrations in the measured river water sample with a mathematical inverse procedure (e.g., Roy et al., 1999; Chetelat and Gaillardet, 2005; and Engel et al., 2016). Briefly, the above set of equations is over determined for a given water sample because of the number of constraining equations (7 in this case: 3 from U, Sr, B concentrations, 3 from isotope ratios, and 1 from Equation 3) is greater than the number of the unknowns (5: f values for EBR, deep_GW, shallow_GW, agricultural, and urban). In the inversion technique, we can solve the 5 unknowns (f values) by using a Monte Carlo procedure to minimize the difference between the observed and the calculated values in the 7 equations by iteration, considering the uncertainties of measurements R and C (Engel et al., 2016). If the algorithm converges to the preset difference level (e.g., 5%), a solution is found. For this study, the above mass balance approach is applied at 5 selected locations downstream to EBR to El Paso, TX for both irrigation and non-irrigation seasons (Table 2). The 5 selected locations are characterized by various geological, agricultural, and urban settings, respectively. The above algorithm was solved 100 times and the average f values from the 100 solutions are presented in Table 2 and Figure 9. It is noted that although the f values represent the contribution calculated from U, Sr, and B mass balance, the positive correlation between U, Sr, and B concentrations and the TDS values in these samples supports that the f values also represent the salinity contribution from each end member.
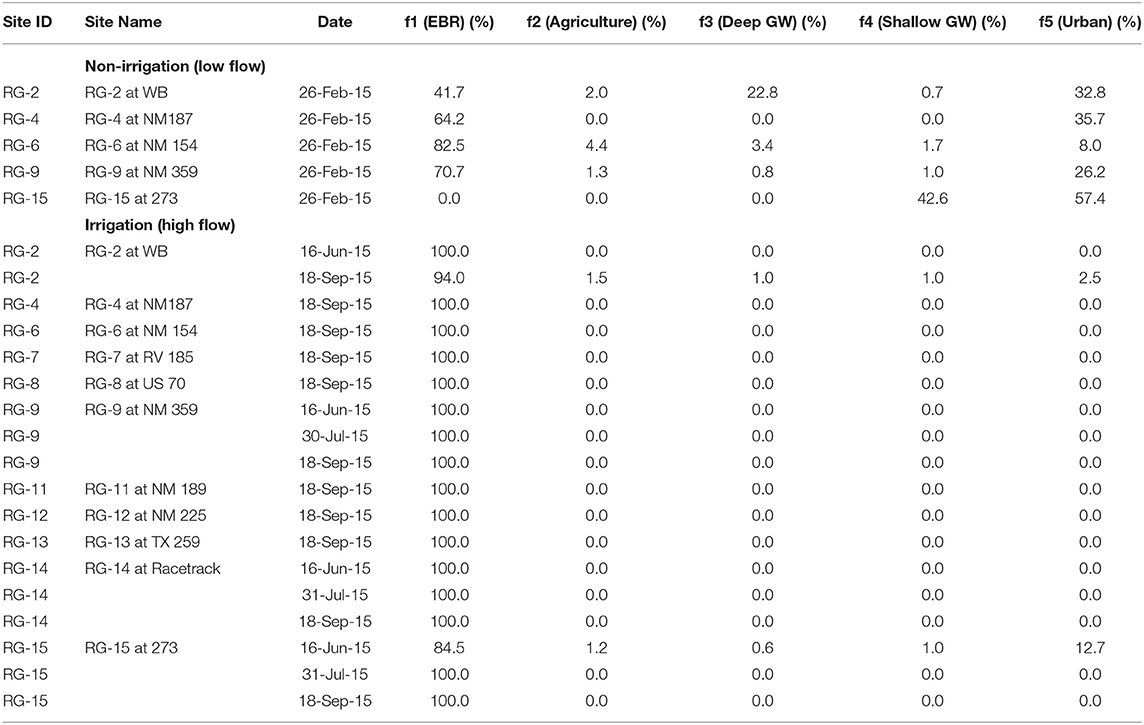
Table 2. Relative water mass contributions (%) to Rio Grande for selected locations for non-irrigation and irrigation seasons.
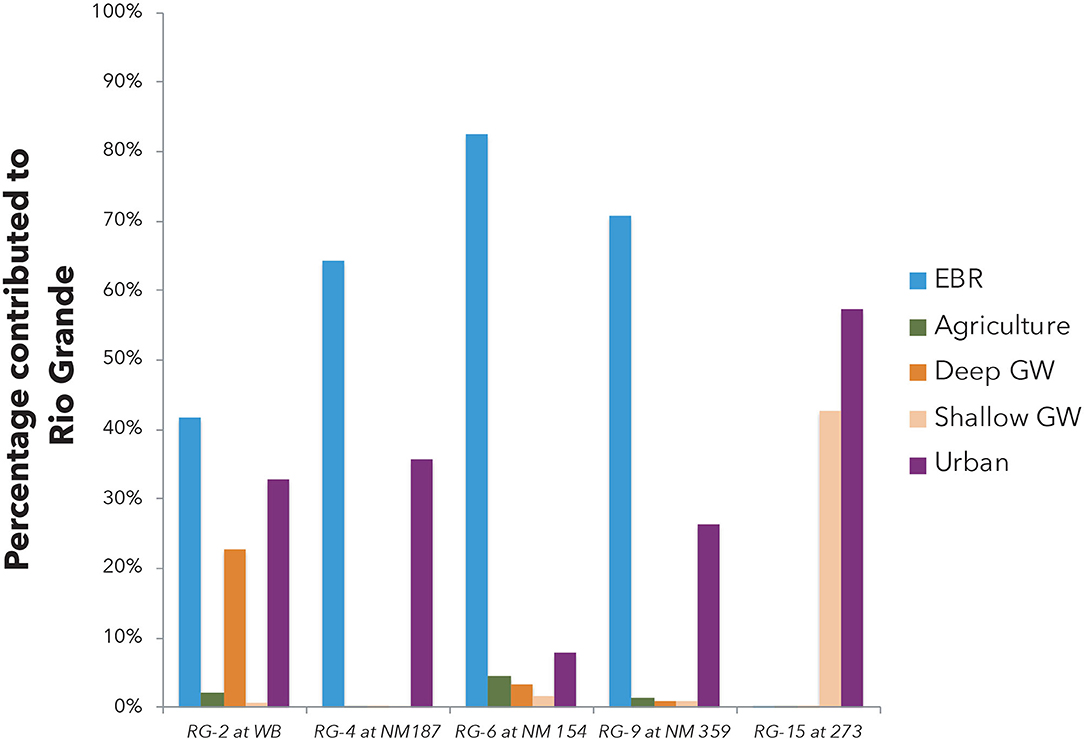
Figure 9. Relative water mass contributions (%) of salinity end members to the Rio Grande river during non-irrigation seasons at the five selected locations downstream to EBR as constrained by the multi-tracer mass balance model.
The mass balance quantification shows that during the irrigation (high flow) seasons, salinity at the 5 sampling locations downstream to Elephant Butte reservoir is dominated (>85%) by EBR release water. Only a small fraction of urban signature (~13%) is observed at RG-15 location next to the city of El Paso (Table 2). Small amounts of agricultural, groundwater, and urban (<2%) can be observed at the RB-2 site, which is at the Truth or Consequences area with known upwelling of deep groundwater, small agricultural and urban activities. The Elephant Butte reservoir stores the water coming from the headwater region of the Rio Grande watershed in southern Colorado and Northern New Mexico where climate is temperate and with more precipitation than the southern New Mexico and West Texas. The chemical solutes in EBR are mainly from chemical weathering processes within the Critical Zone in the headwater regions (e.g., Szynkiewicz et al., 2015a).
During the non-irrigation (low flow) seasons, salinity in the Rio Grande is still largely contributed by an EBR type of water (~40–80%), most likely as the residual EBR flows of the previous irrigation seasons. However, due to the decreased river flow, other salinity signatures can be readily observed at many locations (Figure 9), with a significant component of urban signature (8–58%) and a large contribution from shallow groundwater (up to 43%). Agricultural water contribution is low (~2–4%) and deep groundwater contribution is also low except at the RB-2 location where upwelling of groundwater is documented (~23%).
Indeed, the above salinity quantification is consistent with the previous notation that upwelling of deep saline groundwater and mixing with groundwater in shallow aquifers may be responsible for salinity increases in certain locations such as at the distal end of the Mesilla Basin, between Locations RG-12 and 15 (Phillips et al., 2003; Witcher et al., 2004; Hogan et al., 2007; Hiebing et al., 2018). Upwelling of geothermal groundwater to shallow aquifers has been also suggested in areas with uplifted basin basements such as in the hot spring district of Truth or Consequences, near Location RG-2 and 3 (Williams et al., 2013).
However, there is no clear evidence for direct connection between the Rio Grande and the deep groundwater via natural upwelling in the most part of the Mesilla Basin. Below Elephant Butte and Caballo Reservoir, the Rio Grande is a losing stream with significant infiltration of surface water to the alluvial aquifers (e.g., Szynkiewicz et al., 2015a,b; Driscoll and Sherson, 2016). During the irrigation season, the Rio Grande surface water is diverted to the large network of irrigation canals. The end points of main agricultural drains are directly connected to the Rio Grande and return the excess irrigation water from the agricultural fields. Therefore, several studies have proposed that agricultural return flows may contribute to river salinity either through use of groundwater with elevated salinity for irrigation, flushing of secondary salts precipitating in soil during dry seasons, and/or high evapotranspiration rates in the agricultural fields (e.g., Ellis et al., 1993; Szynkiewicz et al., 2015b). Our mass balance quantification suggests that the agricultural contribution is present but not significant (at 2–4%). However, a large contribution from shallow groundwater (up to 43%) is documented in this region that may represent the indirect contribution of agricultural water to Rio Grande via infiltration underneath agricultural fields and shallow groundwater flows back to Rio Grande (Walton et al., 1999).
In addition, urban effluents from the cities could be additional sources of salinity since they significantly increase stream flows during the non-irrigation seasons when there is no water release from Elephant Butte and Caballo reservoirs. Indeed, high urban contributions are observed at locations near large cities and towns in the study area (RG-15 is near El Paso, TX as discussed above; RG-2 is near T or C, NM). Note that one WWTP (not sampled in this study) is located ~3 km upstream from RG-2 and highest NO3 was mainly observed during non-irrigation season (up to 15 mg/L) when there was no water releases from upstream Elephant Butte reservoir. Additional sources of salinity might be spa resorts from Truth or Consequences that discharge geothermal water directly to the Rio Grande. Indeed, both local groundwater used for municipal supplies and artesian geothermal groundwater from spa resorts have elevated TDS (~800–4,000 mg/L) due to high concentrations of Na and Cl (~200–1,200 mg/L).
It is also noted that during non-irrigation seasons, the percentage contribution of EBR is expected to decrease with increasing distance from EBR at downstream locations, due to the addition of other non-EBR types of water sources. However, the calculated EBR contribution in this study increases from RG-2 (~40%), to RG-4 (~65%), and RG-6 (~80%; Figure 9). Such an observation may point to the presence of an additional source (or sources) that has similar isotopic composition to the EBR type water but such a source was included in the EBR contribution by the Monte Carlo mass balance model. For example, the seepage of EBR and Caballo reservoirs to shallow aquifers may lead to increased contribution of a shallow groundwater end-member that has “EBR”-like isotope signatures to the Rio Grande at downstream locations (such as at RG-4 and RG-6). The shallow groundwater contribution calculated by the Monte Carlo mass balance model is in fact unusually low at these locations (Figure 9), especially at RG-6, which is located at the distal end of the Palomas Basin and expected to receive high groundwater contribution (e.g., at RG-15 location; Figure 2). Such inconsistencies of the calculated EBR and shallow groundwater contributions at RG-4 and RG-6 locations point to several limits of the current Monte Carlo mass balance model: (1) the current model cannot solve effectively the end-members with similar or overlapping signatures; (2) the current model does not take into account of river flow discharge that may provide additional constraints on the mass balance model; (3) the current model does not offer sensibility and uncertainty analysis that may help to assess the model results with uncertainties. Future model calculations that may include river discharges, more accurate characterization of salinity end-member and uncertainties will be more useful to address the salinity issues for the complex surface-shallow-deep groundwater system in the Rio Grande watershed.
Summary and Conclusions
Our multi-isotope tracer approach (U, Sr, and B) helps to better characterize geologic, agricultural, and urban salinity end members in the semi-arid Rio Grande watershed, thus improves the ability to identify salinity contributions to the Rio Grande river. Generally, the combination of U, Sr, and B isotopes is useful in characterizing multiple groundwater components that carry salts from dissolution of varied bedrock types at different temperatures. In particular, we were able to distinguish two main deep groundwater end members: geothermal and deep brackish to saline groundwater for which chemistry and isotope compositions are controlled by dissolution of sedimentary and hydrothermal deposits, respectively. The U isotopes are useful tracers in distinguishing deep vs. shallow water flow paths, and direct inputs from fertilizers related salinity sources from agricultural fields.
During the irrigation seasons, the chemical and isotope compositions of the Rio Grande appear to be mainly controlled by the water releases from Elephant Butte Reservoir. This is consistent with high stream flows and accompanying dilution effect. The chemical solutes in EBR are mainly from chemical weathering processes within the Critical Zone in the headwater regions.
In contrast, during the non-irrigation season the variable TDS and isotope compositions of U, Sr, and B are consistent with the heterogeneous compositions of multiple end members in shallow groundwater, urban effluents and irrigation return flows. During these low flow seasons, the inputs of salt from these sources appear to be localized due to lack of constant Rio Grande river flows. The Rio Grande surface water is the source of prevailing infiltration into underlying alluvial aquifers. This contradicts previous suggestions that linked the salinity increases in the majority of the Rio Grande river channel with natural upwelling of deep brines. However, we acknowledge that some mixing with deep upwelling water may take place in the Rio Grande shallow alluvial aquifers (Hiebing et al., 2018).
Furthermore, recent studies with 3H and 14C signatures have shown that most of the shallow groundwater systems around the world have significant components of young (modern) recharge, suggesting an interconnectivity between surface and groundwater systems (Gleeson et al., 2016; Jasechko, 2016). In our study, a large number of groundwater samples showed U, Sr, and B signatures that overlap with the Rio Grande surface water, agricultural drains, and urban effluents. Given that these samples were collected from groundwater wells in a close proximity to the Rio Grande and agricultural fields, they likely represent recharge of surface water to shallow groundwater. This recharge most likely occurs through leakage from the main Rio Grande channel and canals/drains, and infiltration of irrigation water (Walton et al., 1999; Witcher et al., 2004). Therefore, human impact in the Rio Grande region is not only limited to groundwater extraction and salt loads from shallow sources, but also increases groundwater recharge with elevated salinity and surface contaminants (e.g., U from fertilizers, NO3 from urban and agricultural sources).
Data Availability Statement
The datasets presented in this study can be found in online repositories. The names of the repository/repositories and accession number(s) can be found in the article/Supplementary Material.
Author Contributions
LM and JG directed and initiated the study. SG and SN contributed to conduct U and Sr isotope measurements. SG and PL contributed to B isotope study. All authors contributed to the manuscript writing and data interpretation.
Funding
This research was supported by NSF grant EAR-1349091 to LM. SG received NSF international travel support to conduct B isotope analysis at IPGP, France.
Conflict of Interest
The authors declare that the research was conducted in the absence of any commercial or financial relationships that could be construed as a potential conflict of interest.
Acknowledgments
We thank Anna Szynkiewicz for insightful comments and discussion on a previous draft. Students who assisted in the field work and data processing/analysis included: M. Hiebing, V. Garcia, C. Reyes, L. Alvarez, E. Sosa, and H. Hernandez. The manuscript benefited significantly from insightful and thoughtful comments and suggestions from three reviewers and effective editorial handling by Dr. Carl Steefel.
Supplementary Material
The Supplementary Material for this article can be found online at: https://www.frontiersin.org/articles/10.3389/frwa.2020.575216/full#supplementary-material
References
Ahadi, R., Samani, Z., and Skaggs, R. (2013). Evaluating on-farm irrigation efficiency across the watershed: a case study of New Mexico's Lower Rio Grande Basin. Agric. Water Manage. 124, 52–57. doi: 10.1016/j.agwat.2013.03.010
Alley, W. M., (Ed.). (2013). Five-Year Interim Report of the United States – Mexico Transboundary Aquifer Assessment Program: 2007 – 2012. U.S. Geological Survey Open-File Report 2013–1059.
Allison, G. B., Cook, P. G., Barnett, S. R., Walk, G. R., Jolly, I. D., and Hughes, M. W. (1990). Land clearance and river salinisation in the western Murray Basin, Australia. J. Hydrol. 119, 1–20. doi: 10.1016/0022-1694(90)90030-2
Andersen, M. B., Erel, Y., and Bourdon, B. (2009). Experimental evidence for 234U−238U fractionation during granite weathering with implications for 234U/238U in natural waters. Geochim. Cosmochim. Acta 73, 4124–4141. doi: 10.1016/j.gca.2009.04.020
Barth, S. R. (2000). Boron isotopic compositions of near-surface fluids: a tracer for identification of natural and anthropogenic contaminant sources. Water Air Soil Pollut. 124, 49–60. doi: 10.1023/A:1005210226830
Blum, J. D., Gazis, C. A., Jacobson, A. D., and Chamberlain, C. P. (1998). Carbonate versus silicate weathering in the Raikhot watershed within the High Himalayan Crystalline Series. Geology 26, 411–414.
Brantley, S. L., White, T. S., White, A. F., Sparks, D., Richter, D., Pregizer, K., et al. (2006). Frontiers in Exploration of the Critical Zone. Report of a Workshop Sponsored by the National Science Foundation (NSF), October 24-26, 2005, Newark, DE.
Brown, K. B., McIntosh, J. C., Baker, V., and Gosch, D. (2010). Isotopically-depleted Late Pleistocene groundwater in Columbia River Basalts: evidence for recharge of Glacial Lake Missoula floodwaters? Geophys. Res. Lett. 37:L21402. doi: 10.1029/2010GL044992
Capo, R. C., Stewart, B. W., and Chadwick, O. A. (1998). Strontium isotopes as tracers of ecosystem processes: theory and methods. Geoderma 82, 197–225. doi: 10.1016/S0016-7061(97)00102-X
Chabaux, F., Bourdon, B., and Riotte, J. (2008). U-series geochemistry in weathering profiles, river waters and lakes. Radioact. Environ. 13, 49–104. doi: 10.1016/S1569-4860(07)00003-4
Chabaux, F., Cohen, A. S., O'Nions et, R. K., and Hein, J. R. (1995). 238U-234U-230Th chronometry of Fe-Mn crusts : growth processes and recovery of thorium isotopic ratios of seawater. Geochim. Cosmoch. Acta 59, 633–638. doi: 10.1016/0016-7037(94)00379-Z
Chabaux, F., Riotte, J., and Dequincey, O. (2003). U–Th–Ra fractionation during weathering and river transport. Rev. Mineral. Geochem. 52, 533–576. doi: 10.2113/0520533
Chen, J.-B., Gaillardet, J., Bouchez, J., Louvat, P., and Wang, Y.-N. (2014). Anthropophile elements in river sediments: overview from the Seine River, France. Geochem. Geophys. Geosyst. 15, 4526–4546. doi: 10.1002/2014GC005516
Cheng, H., Edwards, R. L., Hoff, J., Gallup, C. D., Richards, D. A., Asmerom, Y. (2000). The half-lives of U-234 and Th-230. Chem. Geol. 169, 17–33.
Chetelat, B., and Gaillardet, J. (2005). Boron isotopes in the Seine River, France: a probe of anthropogenic contamination. Environ. Sci. Technol. 39, 2486–2493. doi: 10.1021/es048387j
DePaolo, D. J., Maher, K., Christensen, J. N., and McManus, J. (2006). Sediment transport time measured with U-series isotopes: results from ODP North Atlantic drift site 984. Earth Planet. Sci. Lett. 248, 394–410. doi: 10.1016/j.epsl.2006.06.004
Drever, J. I. (1997). The Geochemistry of Natural Waters: Surface and Groundwater Environments. |ISBN-10:0132727900. New York, NY: Pearson.
Driscoll, J. M., and Sherson, L. R. (2016). Variability of Surface-Water Quantity and Quality and Shallow Groundwater Levels and Quality Within the Rio Grande Project Area, New Mexico and Texas, 2009–13. US Geological Survey.
Duff, M. C., Coughlin, J. U., and Hunter, D. B. (2002). Uranium coprecipitation with iron oxide minerals. Geochim. Cosmochim. Acta 66, 3533–3547. doi: 10.1016/S0016-7037(02)00953-5
Durand, S., Chabaux, F., Rihs, S., Duringer, P., and Elsass, P. (2005). U isotope ratios as tracers of groundwater inputs into surface waters: example of the Upper Rhine hydrosystem. Chem. Geol. 220, 1–19. doi: 10.1016/j.chemgeo.2005.02.016
Eastoe, C. J., Hibbs, B. J., Olivas, A. G., Hogan, J. F., Hawley, J., and Hutchinson, W. R. (2007). Isotopes in the Hueco Bolson aquifer, Texas (USA) and Chihuahua (Mexico)— local and general implications for recharge sources in alluvial basins. Hydrogeol. J. 16:11. doi: 10.1007/s10040-007-0247-0
Ellis, S. R., Levings, G. W., Carter, L. F., Richey, S. F., and Radell, M. J. (1993). Rio Grande Valley, Colorado, New Mexico, and Texas. Water Resour. Bull. 29, 617–646. doi: 10.1111/j.1752-1688.1993.tb03230.x
Engel, J., Ma, L., Sak, P., Gaillardet, J., Ren, M., Engle, M., et al. (2016). Quantifying chemical weathering rates along a precipitation gradient on Basse-Terre Island, French Guadeloupe: new insights from U-series isotopes in weathering rinds. Geochim. Cosmochim. Acta 195, 29–67. doi: 10.1016/j.gca.2016.08.040
Farber, E., Vengosh, A., Gavrieli, I., Marie, A., Bullen, T., Mayer, B., et al. (2004). The origin and mechanisms of salinization of the Lower Jordan River. Geochim. Cosmochim. Acta 68, 1989–2006. doi: 10.1016/j.gca.2003.09.021
Garcia, S. (2017). Tracing anthropogenic salinity inputs to the semi-arid rio grande river: a multi-isotope tracer (U, S, B, AND SR) approach [MS thesis] The University of Texas at El Paso, El Paso, TX, United States.
Garfin, G. A., Jardine, R., Merideth Black, M., and LeRoy, S. (Eds.). (2013). Assessment of Climate Change in the Southwest United States: A Report Prepared for the National Climate Assessment. A Report by the Southwest Climate Alliance. Washington, DC: Island Press.
Ghassemi, F., Jakeman, A. J., and Nix, H. A. (1995). Salinisation of Land and Water Resources: Human Causes, Extent, Management and Case Studies. Wallingford: CAB International.
Gleeson, T., Befus, K. M., Jasechko, S., Luijendijk, E., and Cardenas, M. B. (2016). The global volume and distribution of modern groundwater. Nat. Geosci. 9, 161–167. doi: 10.1038/ngeo2590
Gutzler, D. S., and Robbins, T. O. (2010). Climate variability and projected change in the western United States: regional downscaling and drought statistics. Climate Dyn. 37, 835–849. doi: 10.1007/s00382-010-0838-7
Haney, P. D., and Bendixen, T. W. (1953). Effect of irrigation runoff on surface water supplies. Am. Water Works Assoc. J. 45, 1160–1171. doi: 10.1002/j.1551-8833.1953.tb20193.x
Hiebing, M., Doser, D., Avila, V. M., and Ma, L. (2018). Geophysical studies of fault and bedrock control on groundwater geochemistry within the southern Mesilla Basin, western Texas and southern New Mexico. Geosphere 14, 1912–1934. doi: 10.1130/GES01567.1
Hogan, J., Phillips, F. M., Mills, S. K., Hendrickx, J. M. H., Ruiz, J., Chesley, J. T., et al. (2007). Geologic origins of salinization in semi-arid river: the role of sedimentary basin brines. Geology 35, 1063–1066. doi: 10.1130/G23976A.1
Jasechko, S. (2016). Partitioning young and old groundwater with geochemical tracers. Chem. Geol. 427, 35–42. doi: 10.1016/j.chemgeo.2016.02.012
Johnson, N., Revenga, C., and Echeverria, J. (2001). Managing water for people and nature. Science 292, 1071–1072, doi: 10.1126/science.1058821
Konter, J. G., and Storm, L. P. (2014). High precision 87Sr/86Sr measurements by MC-ICP-MS, simultaneously solving for Kr interferences and mass-based fractionation. Chem. Geol. 385, 26–34. doi: 10.1016/j.chemgeo.2014.07.009
Kronfeld, J., Vogel, J. C., and Talma, A. S. (1994). A new explanation for extreme 234U/238U disequilibria in a dolomitic aquifer. Earth Planet Sci. Lett. 123, 81–93. doi: 10.1016/0012-821X(94)90259-3
Langmuir, D. (1978). Uranium solution–mineral equilibria at low temperatures with applications to sedimentary ore deposits. Geochim. Cosmochim. Acta 42, 547–569. doi: 10.1016/0016-7037(78)90001-7
Lippincott, J. B. (1939). Southwestern border water problems. Am. Water Works Assoc J. 31, 1–29. doi: 10.1002/j.1551-8833.1939.tb12350.x
Louvat, P., Bouchez, J., and Paris, G. (2010). MC-ICP-MS isotope measurements with direct injection nebulisation (d-DIHEN): optimisation and application to boron in seawater and carbonate samples. Geostandards Geoanal. Res. 35, 75–88. doi: 10.1111/j.1751-908X.2010.00057.x
Louvat, P., Gaillardet, J., Paris, G., and Dessert, C. (2011). Boron isotope ratios of surface waters in Guadeloupe, Lesser Antilles. Appl. Geochem. 26, S76–S79. doi: 10.1016/j.apgeochem.2011.03.035
Louvat, P., Moureau, J., Paris, G., Bouchez, J., Noireaux, J., and Gaillardet, J. (2014). A fully automated direct injection nebulizer (d-DIHEN) for MC-ICP-MS isotope analysis: application to boron isotope ratio measurements. J. Anal. At. Spectrom. 29, 1698–1707. doi: 10.1039/C4JA00098F
Lyons, W., Berry, R., and Harmon, S. (2012). Why urban geochemistry? Elements 8, 417–422. doi: 10.2113/gselements.8.6.417
Lyons, W., Gardner, C., Welch, S., and Israel, S. (2020). Uranium in Ohio, USA surface waters: implications for a fertilizer source in waters draining agricultural lands. Sci. Rep. 10:5151. doi: 10.1038/s41598-020-61922-2
Maher, K., DePaolo, D. J., and Lin, J. C. F. (2004). Rates of silicate dissolution in deep-sea sediment: in situmeasurement using U-234/U-238 of pore fluids. Geochim. Cosmochim. Acta 68, 4629–4648. doi: 10.1016/j.gca.2004.04.024
Maher, K., Steefel, C. I., DePaolo, D. J., and Viani, B. E. (2006). The mineral dissolution rate conundrum: insights from reactive transport modelling of U isotopes and pore fluid chemistry in marine sediments. Geochim. Cosmochim. Acta 70, 337–363. doi: 10.1016/j.gca.2005.09.001
Mangini, A., Sonntag, C., Bertsch, G., and Muller, E. (1979). Evidence for a higher natural uranium content in world rivers. Nature 278, 337–339. doi: 10.1038/278337a0
Meybeck, M. (2003). “Global occurrence of major elements in rivers,” in Treatise on Geochemistry, Vol. 5, ed J. I. Drever (Amsterdam: Elsevier), 207–225.
Miyamoto, S. L., Fenn, B., and Swietlik, D. (1995). Flow, Salts, and Trace Elements in the Rio Grande: A Review. College Station, TX: Miscellaneous Publication (1764).
Moore, S. J., and Anderholm, S. K. (2002). Spatial and Temporal Variations in Streamfl ow, Dissolved Solids, Nutrients, and Suspended Sediment in the Rio Grande Valley Study Unit, Colorado, New Mexico, and Texas, 1993–1995. U.S. Geological Survey Water-Resources Investigations Report 02–4224.
Moore, S. J., Bassett, R. L., Liu, B., Wolf, C. P., and Doremus, D. (2008). Geochemical tracers to evaluate hydrogeologic controls on river salinization. Ground Water 46, 489–501. doi: 10.1111/j.1745-6584.2007.00420.x
Moyer, D., Anderholm, S. K., Hogan, J. F., Phillips, F. M., Hibbs, B. J., Witcher, J. C., et al. (2013). Knowledge and Understanding of Dissolved Solids in the Rio Grande–San Acacia, New Mexico, to Fort Quitman, Texas, and Plan for Future Studies and Monitoring. US Geological Survey.
National Research Council (2012). New Research Opportunities in the Earth Sciences. Washington, DC: The National Academies Press.
Nolan, J., and Weber, K. A. (2015). Natural uranium contamination in Major US aquifers linked to nitrate. Environ. Sci. Tech. Lett. 2, 215–220. doi: 10.1021/acs.estlett.5b00174
Nyachoti, S. (2016). Application of U and Sr isotopes as salinity and paleo-environmental tracers: insight from the Rio Grande River and pedogenic carbonates in the drylands of the southwest USA. (Chapter 3: Tracing salinity sources in the Lower Rio Grande River using U and Sr isotopes) [Ph.D. dissertation], The University of Texas at El Paso, El Paso, TX, United States.
Osmond, J. K., and Cowart, J. B. (1992). “Ground water,” in Uranium-Series Disequilibrium, eds M. Ivanovich and R. S. Harmon. (Oxford: Clarendon Press), 290–334.
Palmer, M. R., Spivack, A. J., and Edmond, J. M. (1987). Temperature and pH controls over isotopic fractionation during adsorption of boron on marine clay. Geochim. Cosmochim. Acta 51, 2319–2323. doi: 10.1016/0016-7037(87)90285-7
Pepin, J., Person, M., Phillips, F. M., Kelley, S., Timmons, S., Owens, L., et al. (2015). Deep fluid circulation within crystalline basement rocks and the role of hydrologic windows in the formation of Truth or Consequences, New Mexico low temperature geothermal system. Geofluids 15, 139–160. doi: 10.1111/gfl.12111
Phillips, F. M., Emlen Hall, G., and Black, M. (2011). Reining in the Rio Grande: People, Land, and Water. Albuquerque, NM: University of New Mexico Press.
Phillips, F. M., Hogan, J., Mills, S., and Hendricks, J. M. H. (2003). “Environmental tracers applied to quantifying causes of salinity in arid-region rivers: Preliminary results from the Rio Grande, southwestern USA,” in Water Resources Perspectives: Evaluation Management, and Policy: Developments in Water Science, eds A. S. Alsharhan and W. W. Wood (Amsterdam, Elsevier Science), 327–334.
Pogge von Strandmann, P. A. E., Burton, K. W., James, R. H., van Calsteren, P., and Gislason, S. R. (2010). Assessing the role of climate on uranium and lithium isotope behavior in rivers draining a basaltic terrain. Chem. Geol. 270, 227–239. doi: 10.1016/j.chemgeo.2009.12.002
Raczek, I., Jochum, K. P., and Hofmann, A. W. (2003). Neodymium and strontium isotope data for USGS reference materials BCR-1, BCR-2, BHVO-1, BHVO-2, AGV-1, AGV-2, GSP-1, GSP-2 and eight MPI-DING reference glasses. Geostand. Newslett. 27, 173–179. doi: 10.1111/j.1751-908X.2003.tb00644.x
Robinson, L. F., Henderson, G. M., Hall, L., and Matthews, I. (2004). Climatic control of riverine and seawater uranium isotope ratios. Science 305, 851–854. doi: 10.1126/science.1099673
Roy, S., Gaillardet, J., and Allegre, C. J. (1999). Geochemistry of dissolved and suspended loads of the Seine River, France: anthropogenic impact, carbonate, and silicate weathering. Geochim. Cosmochim. Acta 63, 1277–1292. doi: 10.1016/S0016-7037(99)00099-X
Seager, R., Ting, M. F., Held, I. M., Kushnir, Y., Lu, J., Vecchi, G., et al. (2007). Model projections of an imminent transition to a more arid climate in southwestern North America. Science 316, 1181–1184. doi: 10.1126/science.1139601
Shand, P., Darbyshire, D. P. F., Love, A. J., and Edmunds, W. M. (2009). Sr isotopes in natural waters: applications to source characterisation and water–rock interaction in contrasting landscapes. Appl. Geochem. 24, 574–586. doi: 10.1016/j.apgeochem.2008.12.011
Sheng, Z. (2013). Impacts of groundwater pumping and climate variability on groundwater availability in the Rio Grande Basin. Ecosphere 4, 1–25. doi: 10.1890/ES12-00270.1
Spivack, A. J., and Edmond, J. M. (1987). Boron isotope exchange between seawater and the oceanic crust. Geochim. Cosmochim. Acta 51, 1033–1043. doi: 10.1016/0016-7037(87)90198-0
Swetnam, T. W., and Betancourt, J. L. (1998). Mesoscale disturbance and ecological response to decadal climatic variability in the American Southwest. J. Clim. 11, 3128–3147.
Szynkiewicz, A., Borrok, D., Ganjegunte, G., Skrzypek, G., Ma, L., Rearick, M., et al. (2015b). Isotopic studies of the Upper and Middle Rio Grande. Part 2 – salt loads and human impacts in south New Mexico and west Texas. Chem. Geol. 411, 336–350. doi: 10.1016/j.chemgeo.2015.05.023
Szynkiewicz, A., Borrok, D. M., Skrzypek, G., and Rearick, M. S. (2015a). Isotopic studies of the Upper and Middle Rio Grande. Part 1- Importance of sulfide weathering in the riverine sulfate budget. Chem. Geol. 411, 323–335. doi: 10.1016/j.chemgeo.2015.05.022
Szynkiewicz, A., Witcher, J., Modelska, M., Borrok, D. B., and Pratt, L. M. (2011). Anthropogenic sulfate loads in the Rio Grande, New Mexico. Chem. Geol. 283, 194–209. doi: 10.1016/j.chemgeo.2011.01.017
Walton, J., Ohlmacher, G., Utz, D., and Kuitanawala, M. (1999). Response of the Rio Grande and shallow groundwater in the Mesilla Bolson to irrigation, climate stress, and pumping. Environ. Eng. Geosci. 1, 41–50. doi: 10.2113/gseegeosci.V.1.41
Water 2025: Preventing Crisis and Conflict in the West (2005) U.S. Department of the Interior. Available online at: http://www.usbr.gov/library/ (accessed October 06, 2011).
Wilcox, L. V. (1957). “Analysis of salt balance and salt-burden data on the Rio Grande,” in Problems of the Upper Rio Grande: An Arid Zone River, ed P. C. Duisberg (Socorro, NM: U.S. Commission for Arid Resource Improvement and Development, Publication no. 1), 39–44.
Williams, A. J., Crossey, L. J., Karlstrom, K. E., Newell, D., Person, M., and Woolsey, E. (2013). Hydrogeochemistry of the Middle Rio Grande aquifer system - fluid mixing and salinization of the Rio Grande due to fault inputs. Chem. Geol. 351, 281–298. doi: 10.1016/j.chemgeo.2013.05.029
Witcher, J. C., King, J. P., Hawley, J. W., Kennedy, J. F., Williams, J., Cleary, M., et al. (2004). Sources of Salinity in the Rio Grande and Mesilla Basin Groundwater. New Mexico Water Resources Research Institute WRRI Technical Completion Report No. 330.
Wong, C. I., Sharp, J. M., Hauwert, N., Landrum, J., and White, K. M. (2012). Impact of urban development on physical and chemical htdrogeology. Elements 8, 429–434. doi: 10.2113/gselements.8.6.429
Zielinski, R. A., Asher-Bolinder, S., and Meier, A. L. (1995). Uraniferous waters of the Arkansas River valley, Colorado, U.S.A.: a fuction of geology and land use. Appl. Goechem. 10, 133–144. doi: 10.1016/0883-2927(95)00002-2
Zielinski, R. A., Asher-Bolinder, S., Meier, A. L., Johnson, C. A., and Szabo, B. J. (1997). Natural or fertilizer-derived uranium in irrigation drainage: a case study in southeastern Colorado, U.S.A. Appl. Geochem. 12, 9–21. doi: 10.1016/S0883-2927(96)00050-9
Keywords: uranium isotopes, boron isotopes, strontium isotopes, Rio Grande watershed, river salinity, mass balance, salinity contribution
Citation: Garcia S, Louvat P, Gaillardet J, Nyachoti S and Ma L (2021) Combining Uranium, Boron, and Strontium Isotope Ratios (234U/238U, δ11B, 87Sr/86Sr) to Trace and Quantify Salinity Contributions to Rio Grande River in Southwestern United States. Front. Water 2:575216. doi: 10.3389/frwa.2020.575216
Received: 22 June 2020; Accepted: 31 December 2020;
Published: 01 February 2021.
Edited by:
Carl I. Steefel, Lawrence Berkeley National Laboratory, United StatesReviewed by:
John Neil Christensen, Lawrence Berkeley National Laboratory, United StatesThai Phan, University of Waterloo, Canada
Nathaniel R. Warner, Pennsylvania State University (PSU), United States
Copyright © 2021 Garcia, Louvat, Gaillardet, Nyachoti and Ma. This is an open-access article distributed under the terms of the Creative Commons Attribution License (CC BY). The use, distribution or reproduction in other forums is permitted, provided the original author(s) and the copyright owner(s) are credited and that the original publication in this journal is cited, in accordance with accepted academic practice. No use, distribution or reproduction is permitted which does not comply with these terms.
*Correspondence: Lin Ma, bG1hQHV0ZXAuZWR1