 Jieun Kim
 Neal E. Blair
 Adam S. Ward
 Katie Goff
- 1Department of Civil and Environmental Engineering, Northwestern University, Evanston, IL, United States
- 2Department of Earth and Planetary Sciences, Northwestern University, Evanston, IL, United States
- 3O'Neill School of Public and Environmental Affairs, Indiana University, Bloomington, IN, United States
- 4Department of Earth and Environmental Sciences, University of Iowa, Iowa City, IA, United States
Rivers integrate and transport particulate organic carbon (POC) from multiple sources with varied diagenetic histories. A significant amount of POC is delivered to rivers during storm events, but the sources and fates of the mobilized material are often unclear. To gauge the variability of input sources, this study uses a biomarker approach that broadly characterizes organic matter at the molecular level. Suspended sediment was collected during a storm in October 2015 at three nested sampling locations along Clear Creek in Iowa, U.S.A. Supplemented with bulk elemental and C-isotopic measurements, biomarker analyses were obtained to identify changes in sources and the diagenetic state of the POC. Fatty acid-rich organic matter was attributed to the mobilization of algal mats in the stream channel at the early stage of the storm as precipitation initiated and water velocities began to increase. A significant contribution of lignin-rich material occurred at peak precipitation and elevated discharge signifying soil sources. Tracers for partially oxidized lignin and soil organic matter suggested that this was a partially time-resolved mixture of fresh and degraded material. Storm-induced variations of biomarkers were observed at the three sampling stations located throughout the watershed. The mixing patterns became more complex as the storm pulse moved downstream due to the additive contributions of multiple tributaries and the hypothesized increasing importance of alluvial bank erosion. This erosional increase is attributed to a systematic transition in basin geomorphology from a V-shape in the upper reach to a wider box-shaped valley in the lower reach. Even though biomarker concentration measurements revealed a diversity of sources over time, the complex mixture of POC associated with peak discharge dominated the flux of material downstream. This study highlights the complexity of storm-initiated C-transport and the need for high spaciotemporal resolution broad spectrum tracer studies in the future.
Introduction
Streams and rivers integrate, transport, and transform organic carbon (OC) derived from multiple sources. Longitudinal transport flushes OC downstream while lateral transport exchanges OC with adjacent riparian zones (Wohl et al., 2015). In-channel spiraling of C facilitated by primary and secondary production contribute to the OC pool (Newbold et al., 1982; Griffiths et al., 2012). As a result, the OC in streams and rivers is complex in biogeochemical composition and diagenetic history. Understanding the spatiotemporal dynamics of the OC mixture is critical to identifying the role of streams and rivers in ecosystem processes and the C-cycle in general.
Storm events have a disproportionate impact on carbon mobilization and significantly influence the sources and fluxes of OC that are transported fluvially. Storm flows export >80% of particulate organic carbon (POC) and >70% of dissolved organic carbon (DOC) over time periods that constitute only 10–20% of the total year (Oeurng et al., 2011; Dhillon and Inamdar, 2014). Both dissolved and particulate forms of OC make comparable contributions to the total aquatic C pool (Meybeck, 1982; Cole et al., 2007) though their behaviors differ because of being either in suspension or dissolved (Alvarez-Cobelas et al., 2012; Jeong et al., 2012). Within storm events, the OC composition is expected to change due to the selective mobilization and transport of individual sources including terrestrial plant litter, in-channel production (algal biomass and invertebrates), and eroded soil organic matter (Blair and Leithold, 2013; Raymond et al., 2016). However, evidence for such changes is sparse, particularly for POC because of the challenge of performing detailed organic geochemical analyses with sufficient temporal resolution.
Investigations of storm event POC have typically suffered from two limitations. First, most studies have relied on carbon isotopes and elemental (C/N) ratios to resolve source inputs (Blair and Leithold, 2013; Blair et al., 2018). While valuable, interpretation of these measurements is limited due to non-unique signatures, which prevent specific source identification. In this study, a broad spectrum, compound-specific approach was used to complement stable isotope and elemental ratio information. The broad-spectrum biomarker scope enables observation of a wide range of compounds that can be source-specific, while at the same time providing a perspective that approaches that of the bulk sample because of the compound diversity (Le Meur et al., 2017).
Next, studies conducted at single stations within a river network do not reveal the systematic variation expected as POC moves from headwaters to downstream reaches (Blair et al., 2004; Aufdenkampe et al., 2007). The evolution of POC as it is transported downstream as a result of accumulated inputs, exchange with the riparian corridor and in-channel cycling is well-appreciated in large river systems and is thought to be highly dependent on watershed size (Aufdenkampe et al., 2007; Blair and Leithold, 2013; Leithold et al., 2016). The scale or nature of change in small tributaries is undocumented, however.
The transport of OC from agricultural landscapes, a global scale issue (Doetterl et al., 2016), is the specific focus of this study. Our objectives in this study were to, (1) identify temporal and spatial variations of POC sources by investigating the POC compositional changes, and (2) assess the quantity and composition of POC exported downstream within the watershed. To address these objectives, we collected samples at three stations within the small agricultural stream network of Clear Creek, Iowa with a multi-hour resolution sampling through a storm event. Such fine-resolution data has rarely been reported in previous studies, despite its importance to capture the rapid changes of POC export flux and composition during storm events. Moderate to high-frequency data improves POC flux estimates by allowing them to be parsed in terms of source and/or composition. The Clear Creek Watershed was part of NSF-supported Intensively Managed Landscape Critical Zone Observatory (IML-CZO) where the focus was to develop predictive capabilities of Critical Zone responses to future environmental change and land use.
Materials and Methods
Study Site and Sample Collection
Clear Creek is a tributary of the Iowa River that drains a 270 km2 watershed in east-central Iowa, USA (Figure 1A). It is an extensively studied field site that is part of the National Science Foundation's Intensively Managed Landscapes Critical Zone Observatory (IML-CZO) (Kumar et al., 2018; Wilson et al., 2018). Clear Creek dissects a pre-Illinoian glacial landscape (~0.5–2.4 Ma), the Southern Iowa Drift Plain, that is mantled by loess and till (Prior, 1991). Till and paleosols are covered by a ~15 m thick loess blanket that is moderate to highly erodible (Bettis et al., 2003). The rolling landscape is hydrologically well-integrated by numerous small streams, such as Clear Creek (Ruhe, 1969).
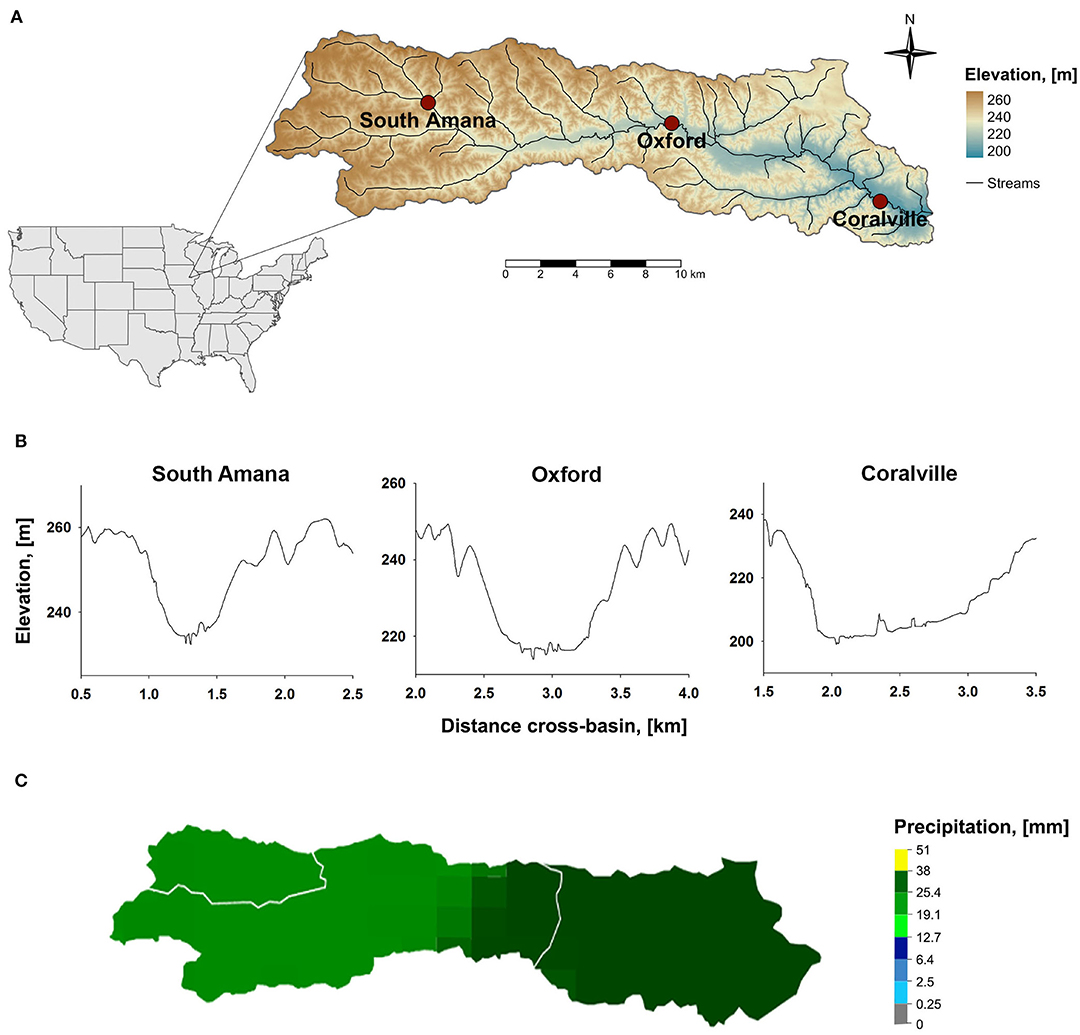
Figure 1. (A) Map of Clear Creek watershed and locations of sampling stations; (B) Valley cross-sections at the sampling stations. Cross-section elevations were obtained from DEMs of the watershed using ArcGIS Pro.; (C) Precipitation estimates in Clear Creek for Oct 27 local time when ~90% of the rain fell. Data were retrieved from The National Weather Service Advanced Hydrologic Prediction Service.
The warming climate following the last glaciation led to a succession of vegetation that culminated with a mosaic of prairie grasslands, wetlands and forested riparian corridors (Wilson et al., 2018). At the time of Euro-American settlement (~1840), grasslands dominated whereas forests represented ~10 % of the land cover. Deciduous angiosperms, primarily oaks (Quercus sp.), were the forest species (Rayburn and Schulte, 2009a). Agricultural land use induced a further change in cover that is currently characterized by ~56% row crop agriculture, 18% pasture, 10% woodland and 7% urban/suburban (Table 1, Rayburn and Schulte, 2009b). Forest species have shifted to the angiosperms Acer saccharinum L. (silver maple), Salix nigra Marsh (black willow), Ulmus americana L. (American elm), and A. negundo L. (box elder) (Rayburn and Schulte, 2009a). Row crops, while distributed through the watershed, are more concentrated in the headwater regions. Urban zones are localized in the lower reach (Table 1).
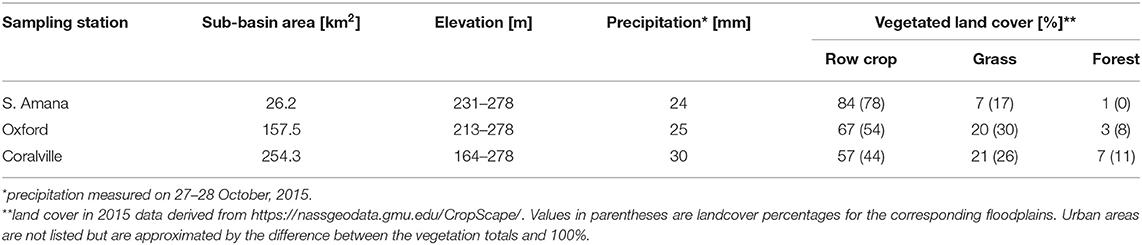
Table 1. Subbasin characteristics.
The soils in the region are legacies of the pre-settlement climate-ecosystem pairings. Prairie-derived Mollisols have thick, dark-colored and organic-rich top soils. Forest-derived Alfisols have thin, clay-leached, acidic top soils (Wilson et al., 2018). The advent of Euro-American agriculture on a loess-derived surface resulted in rapid loss of top soils and soil organic carbon (Papanicolaou et al., 2015; Yan et al., 2019). Periodic intense precipitation, about 75% of the annual precipitation (~900 mm) occurs between April-June, contributes to high erosion rates (Wilson et al., 2012, 2018). Erosion has been attenuated by the adoption of soil conservation practices in the 1990's (Abaci and Papanicolaou, 2009; Papanicolaou et al., 2015). These include rotations of corn (Zea mays L.)—soybean (Glycine max L.) crops and no-till, spring shallow-till, fall deep-till practices. Contour tilling is commonly but not exclusively used. Grassed and forested riparian buffers between row crop fields and the stream channel are common but highly variable in width, ranging from almost non-existent to 10's of meters. Rills either terminate in the buffers or extend to the channel. In short, soil conservation practices are extensively, but not universally, practiced. The higher grass and forest cover of floodplains reflects the presence of the riparian buffers (Table 1).
Planting typically occurs in early May, weather permitting, thus rain during May-June creates the highest erosion rates due to the nearly bare ground and small plants (Wilson et al., 2012). Harvest occurs early October and fall tillage is performed in November. The storm event sampled in this study falls in the window when the surface was heavily littered with post-harvest crop debris before being tilled to the subsurface.
Tile drains are a substantial part of the agricultural landscape in the Clear Creek watershed. The tile drain contribution of water to nearby Iowa streams is substantial, with estimates ranging from 15% to over 50% (Schilling et al., 2012; Amado et al., 2017). Tile drain water inputs appear to be especially important at baseflow (Schilling and Helmers, 2008), however particulate fluxes are not a major source of POC to the channel (Blair et al., submitted).
Samples were collected at three sampling stations in the watershed (Figure 1A), near South Amana (upper subbasin), Oxford (middle subbasin), and Coralville (lower subbasin). The three locations provide a telescoping perspective in terms of the watershed area and topography integrated by Clear Creek. South Amana captures a predominantly headwater signature. The valley cross-section at that point is V-shaped (Figure 1B). Oxford represents an approximate mid-point and Coralville integrates almost the entire watershed (Davis et al., 2014). The valley cross-sections for these reaches are more U- or box-shaped (Yan et al., 2018). The field location at South Amana was maintained by the University of Iowa prior to becoming an IML-CZO site (Wilson et al., 2018). Discharge at South Amana was determined using a previously determined stage-discharge relationship (Abaci and Papanicolaou, 2009). The sampling stations in Oxford and Coralville were co-located with the USGS gaging stations (Station # 05454200 in Oxford and 05454300 in Coralville).
The stream water was collected at 3-hr intervals using ISCO autosamplers with 1-liter bottles throughout the storm event that occurred in late October 2015. The sampling interval was chosen to allow definition of the storm peak at three locations simultaneously while maintaining a feasible analytical workflow. Sampling was begun at the beginning of precipitation and ended as the hydrograph approached baseflow. The samples were transferred to the lab and kept frozen until analyzed.
Sediment, Bulk C, N Concentration, and Stable Isotope Analyses
Thawed samples were filtered on pre-combusted (at 500°C) and pre-weighed 47 mm o.d. glass fiber filters (0.7-micron nominal pore size, Millipore). The filter samples were lyophilized and weighed to determine sediment concentrations.
Samples for POC analyses were acidified with gaseous HCl for 1–4 days to eliminate the inorganic carbon (Harris et al., 2001), and the absence of carbonate in the samples were verified by monitoring a peak at 2513 cm−1 using a Bruker Tensor 37 FTIR (Vaculikova and Plevova, 2005). The sediment samples were analyzed for OC and total N contents along with δ13C and δ15N values using a Costech Elemental Analyzer-Conflo IV interface-Thermo Delta V plus isotope ratio mass spectrometer (IRMS). Isotope ratios are referenced to VPDB for C and air-N2 for N (Coplen, 1995; Skrzypek, 2013) via the use of a calibrated acetanilide standard (Schimmelmann et al., 2009). The instrument precision was ~0.2‰.
Broad Spectrum Biomarker Analyses
Thermochemolysis with tetramethyl ammonium hydroxide (Clifford et al., 1995; McKinney et al., 1995; Frazier et al., 2003) was employed to obtain a multi-biochemical class perspective of POC molecular composition on sediment samples from the filters. Approximately 50–100 mg of sediment was placed in a screw-top glass culture tube with 1 μg of methyl-D3-pentadecanoic acid (CAS 352431-40-4, Cambridge Isotope Laboratories, Inc.) and 150 μL of TMAH (25% in methanol, CAS 75-59-2, Sigma-Aldrich). Methyl-D3-pentadecanoic acid was added to monitor the reaction yield and the recovery of sample preparation. The amount of sample was varied to target a quantity of ~0.5 mg of organic carbon. The methanol was removed via a vacuum concentrator. The tubes were sealed under N2 with the Teflon-lined caps. The sample tubes were heated at 200°C for 3 h on a heating module (Reacti-Therm™ heating module, Thermo Scientific). After the reaction, the products were extracted with 3 mL of hexane and transferred in a 4 mL glass vial. Hexane was evaporated by purging with nitrogen gas. The residue was taken up with 100 μL of hexane. All glassware was pre-baked at 500°C for 8 h to remove any trace organic matter.
The prepared samples were analyzed using a Thermo Scientific Trace GC Ultra coupled with a DSQ II MS equipped with a Triplus auto-sampler and a TR-5MS column (L 30 m, I.D. 0.25 mm, film thickness 0.25 μm). Eluting peaks were identified by comparing their mass spectra with the NIST library and an in-house library. In order to resolve coeluting peaks and enhance the signal to noise, peak areas of compounds were measured after filtering the selective m/z for each compound. For compound quantification, authentic standards were analyzed using TMAH thermochemolysis under the identical experimental setup. Methyl-D3-pentadecanoic acid was used as the internal standard to calculate the Relative Response Factors (RRF) for each compound. For compounds without authentic standards, the RRFs of nearby compounds in retention time and with similar compound structures were used for quantification. The calculated mass was then normalized to the quantity of organic carbon (in mg) in the sample. Quantified biomarkers and their main sources are listed in Table 2.
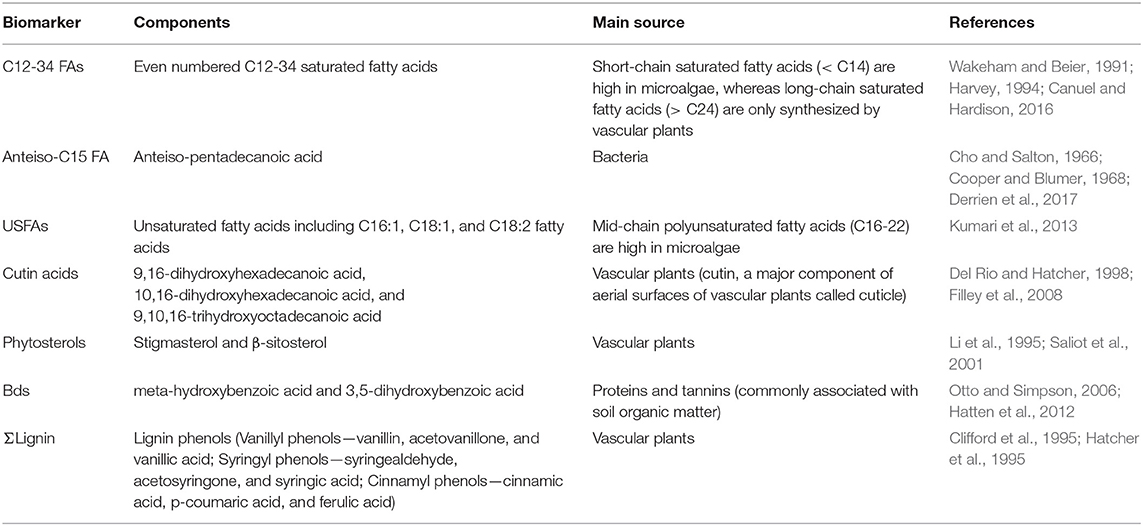
Table 2. Biomarkers quantified in this study.
Analyses using the TMAH thermochemolysis method were performed on reference materials that represent major plant groups and provide a broad range of lignin phenol results. Plant samples include gymnosperms (Red Spruce, Eastern White Pine, Red Cedar), woody angiosperms (Oregon White Oak wood), and non-woody angiosperms (Oregon White Oak leaf, Red Alder, Smooth Cordgrass, Saltmarsh Hay, and Eel grass).
Precipitation Estimates
Hourly precipitation totals for the study period were obtained from the Iowa State University Environmental Mesonet (https://mesonet.agron.iastate.edu/request/download.phtml?network=IA_ASOS). The Iowa City (IOW) station was used. Data for the daily estimates in each of the Clear Creek subbasins were retrieved from The National Weather Service Advanced Hydrologic Prediction Service (https://water.weather.gov/precip/) (Figure 1C). The precipitation data were derived from radar and rain gauge estimates. The precipitation map products for each day were imported into ArcPro GIS software where the subbasin coverage was clipped and quantified.
Statistics
Correlation analysis was conducted between discharge (Q), hourly precipitation (P), and POC concentration to evaluate the strength of the C-Q or C-P relationships. The data matrix was computed using the “cor” function in R software for Pearson correlation analysis. The statistical significance of the correlation analysis was assessed with a 95% confidence interval.
Results
Characteristics of the Storm
Samples analyzed in this study were collected between October 27–30, 2015 (ordinal days 300–303). Precipitation occurred primarily during October 27–28 (Figure 2). Weather radar estimates indicate that the storm passed over the entire watershed (Figure 1C, Table 1). Discharge measured in South Amana during the event peaked at ~1,000 L/s. Clear Creek discharge measured at the USGS gaging stations in Oxford, IA (USGS gage no. 05454220) and Coralville, IA (USGS gage no. 05454300) during the event peaked at ~6,000 L/s and ~7,000 L/s, respectively. The peak discharge was ~2.5 times greater than the mean discharge during the year (Oxford: 2,300 L/s and Coralville: 3,200 L/s, data available from March 8 to the end of the year), but smaller than the bankfull discharge estimated for Coralville (~56,000 L/s) (Eash, 1993). This was a small discharge event with an approximate month return frequency. It followed another event 7 days prior of comparable duration and intensity. That storm followed a 2-month-long low-discharge period where discharge rarely exceeded half of the mean discharge of the year.
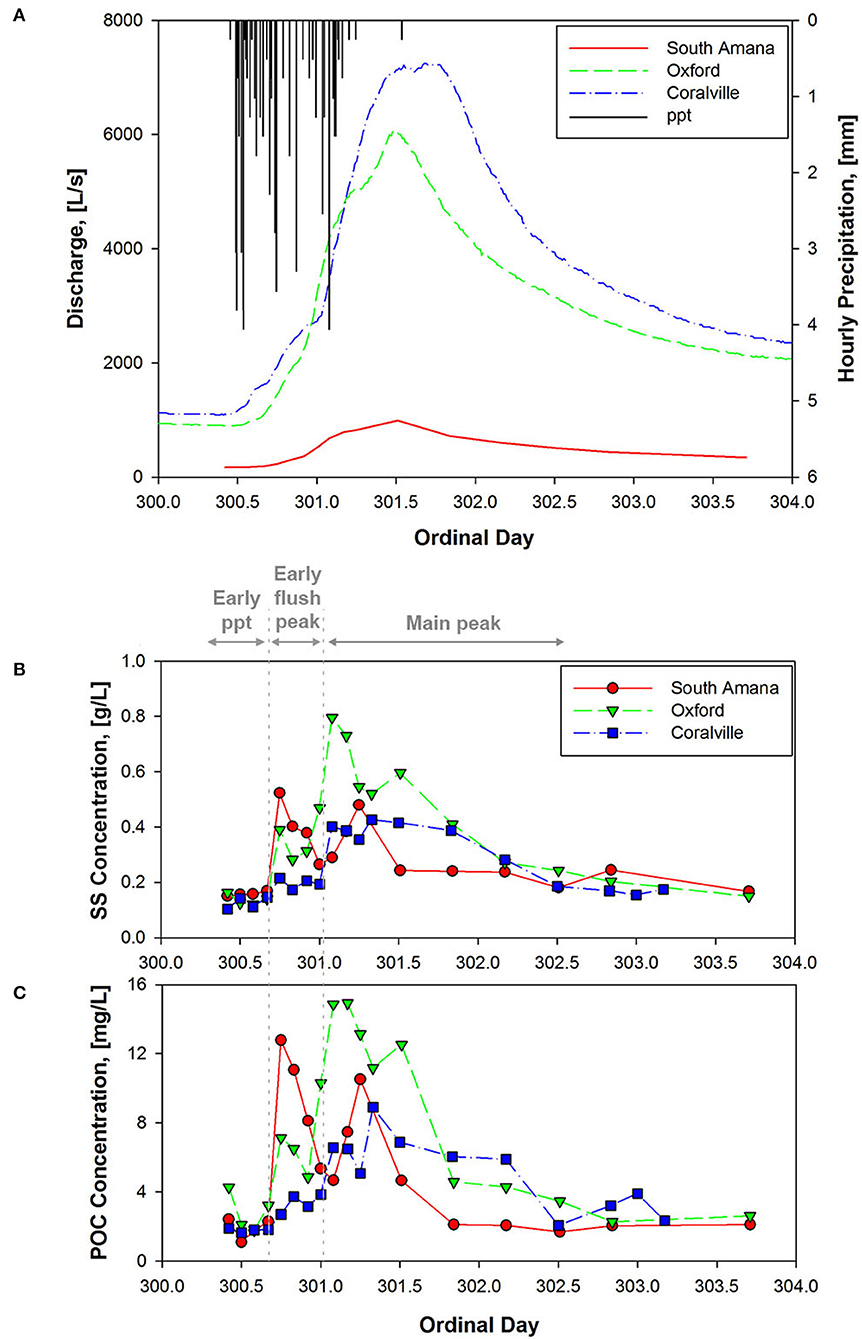
Figure 2. (A) Hourly precipitation measured at near Iowa City and discharge at three sampling stations during 27–30 October 2015 storm; Temporal variation in the concentrations of (B) suspended sediment and (C) POC at three sampling stations. The early ppt phase refers to the period during the precipitation event before discharge rises rapidly. The early flush peak occurs on the rising limb of the hydrograph. The main peak correlates closely with discharge.
Bulk Composition of POC
Suspended sediment concentrations increased and then decreased in response to the passing storm event and change in discharge (Figure 2, Table 3). In response to changes in sediment load, POC concentrations (calculated as sediment concentration × %OC/100) ranged from 1.09 to 14.93 mg C/L. Percent POC and total N (%OC, %N) concentrations (both on a dry sediment weight basis) varied over the course of the storm with a range of 0.7–2.75 for %OC and 0.07 to 0.26 for %N (Table 3). A strong correlation (r = 0.95, p < 0.05) was observed between %OC and %N. We found %OC (or %N) and sediment concentrations were positively correlated at South Amana (r = 0.91 and 0.94 with %OC and %N, respectively), but not at the other stations. This conclusively demonstrates that changing OC mixtures moved downstream along the river network. C:N ratios varied in the range from 8.27 to 13.03 throughout the event. δ13C values of POC ranged from −29.3 to −17.6‰, with one exceptionally negative value at South Amana (−36.9‰) that occurred during the early precipitation period (Figure 3). POC concentrations and δ13C values are positively correlated (r = 0.59, p < 0.05), such that the source(s) contributing to the increase in POC was also relatively 13C-enriched.
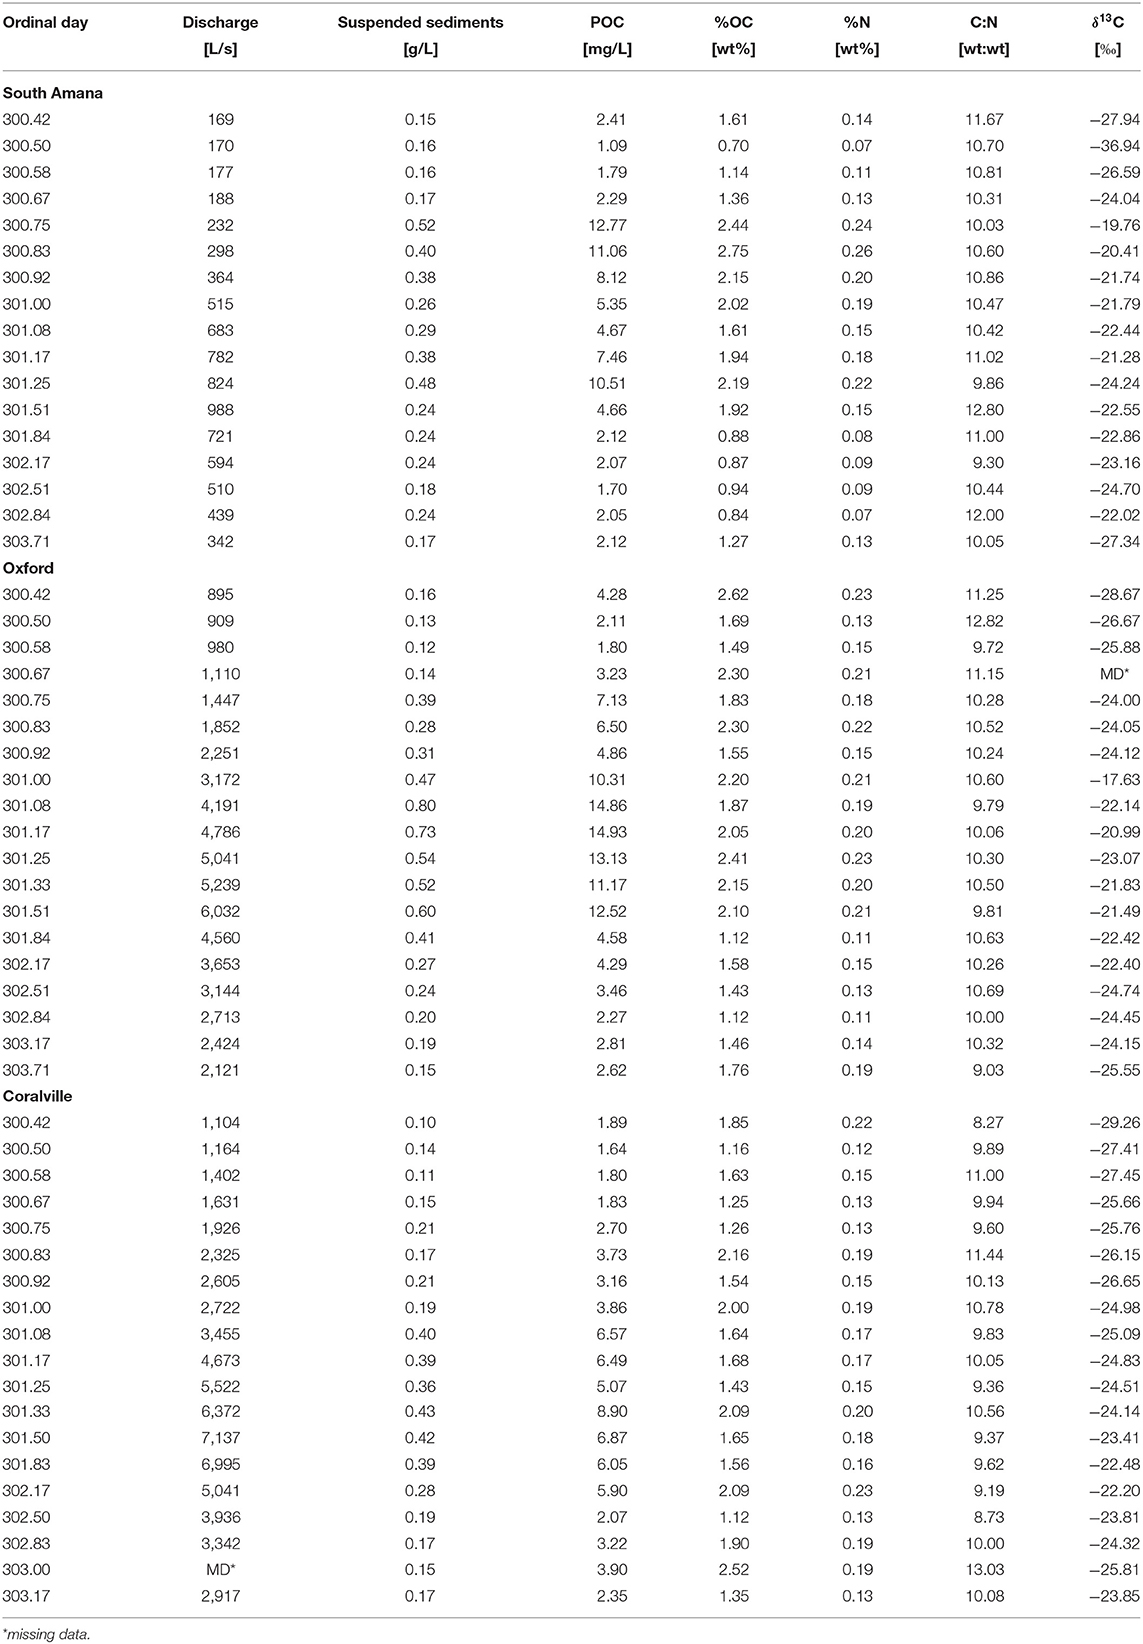
Table 3. Storm characteristics, concentrations of sediment and POC, and bulk properties.
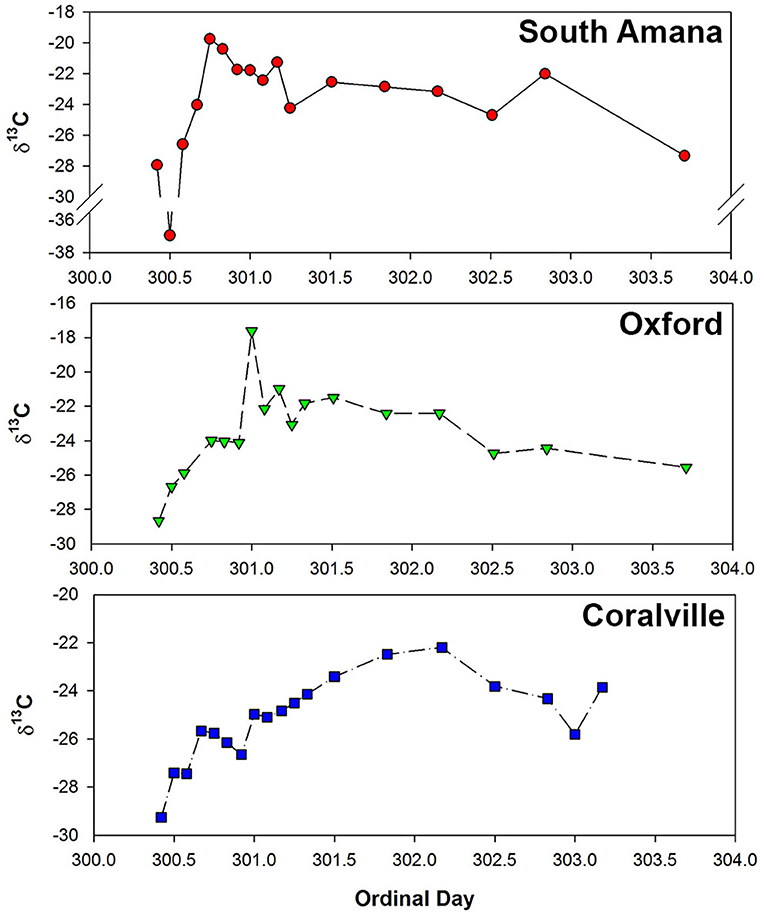
Figure 3. Temporal variations in δ13C of POC samples during the October, 2015 storm. From the upper panel on down, South Amana, Oxford, and Coralville.
Broad Spectrum Biomarker Analyses
POC compositional changes were further investigated on the molecular level with TMAH-derived biomarker analyses (Figure 4, Table 4). The compounds identified included methylated derivatives of phenols derived from lignin (Clifford et al., 1995; Hatcher et al., 1995; McKinney et al., 1995), non-lignin hydroxy benzoic acids, alkyl (fatty) monocarboxylic acids, and sterols. The putative sources of these diagnostic compounds are listed in Table 2. The relative abundances of these compounds are dependent not only on their actual concentrations in samples but also the relative reactivities of the source materials toward the TMAH reagent, and the stabilities of the products. Thus, fatty acids often appear to be more abundant in samples than they are in the environment (e.g., relative to carbohydrates and proteins) because of the ease of formation and stability of the corresponding fatty acid methyl esters. Even so, changes in relative concentrations of detected compounds can be used as indicators of changes in sources (del Rio et al., 1998). Compound ratios within a biochemical class (e.g., lignin phenols, fatty acids) can also provide diagnostic information as to source (Bianchi et al., 2007).
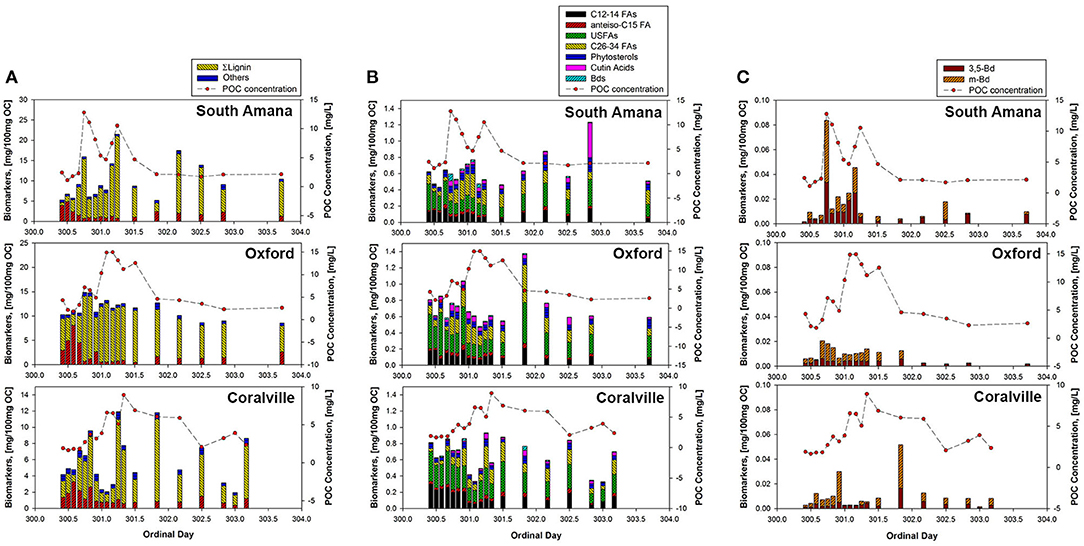
Figure 4. Concentrations of biomarkers normalized to OC (mg/100 mg OC). (A) All biomarkers measured using TMAH thermochemolysis; (B) Biomarkers excluding C16-18 fatty acids and lignin phenols; (C) Concentrations of Bds. ΣLignin, Total lignin phenols; anteiso-C15 FA, anteiso-pentadecanoic acid; USFAs, unsaturated fatty acids (C16:1 FAs, C18:1 FAs, and C18:2 FA); Cutin acids, 9,16-dihydroxyhexadecanoic acid, 10,16-dihydroxyhexadecanoic acid, and 9,10,16-trihydroxyoctadecanoic acid; Bds, m-hydroxybenzoic acid and 3,5-dihydroxybenzoic acid; PSs, phytosterols (stigmasterol and β-sitosterol).
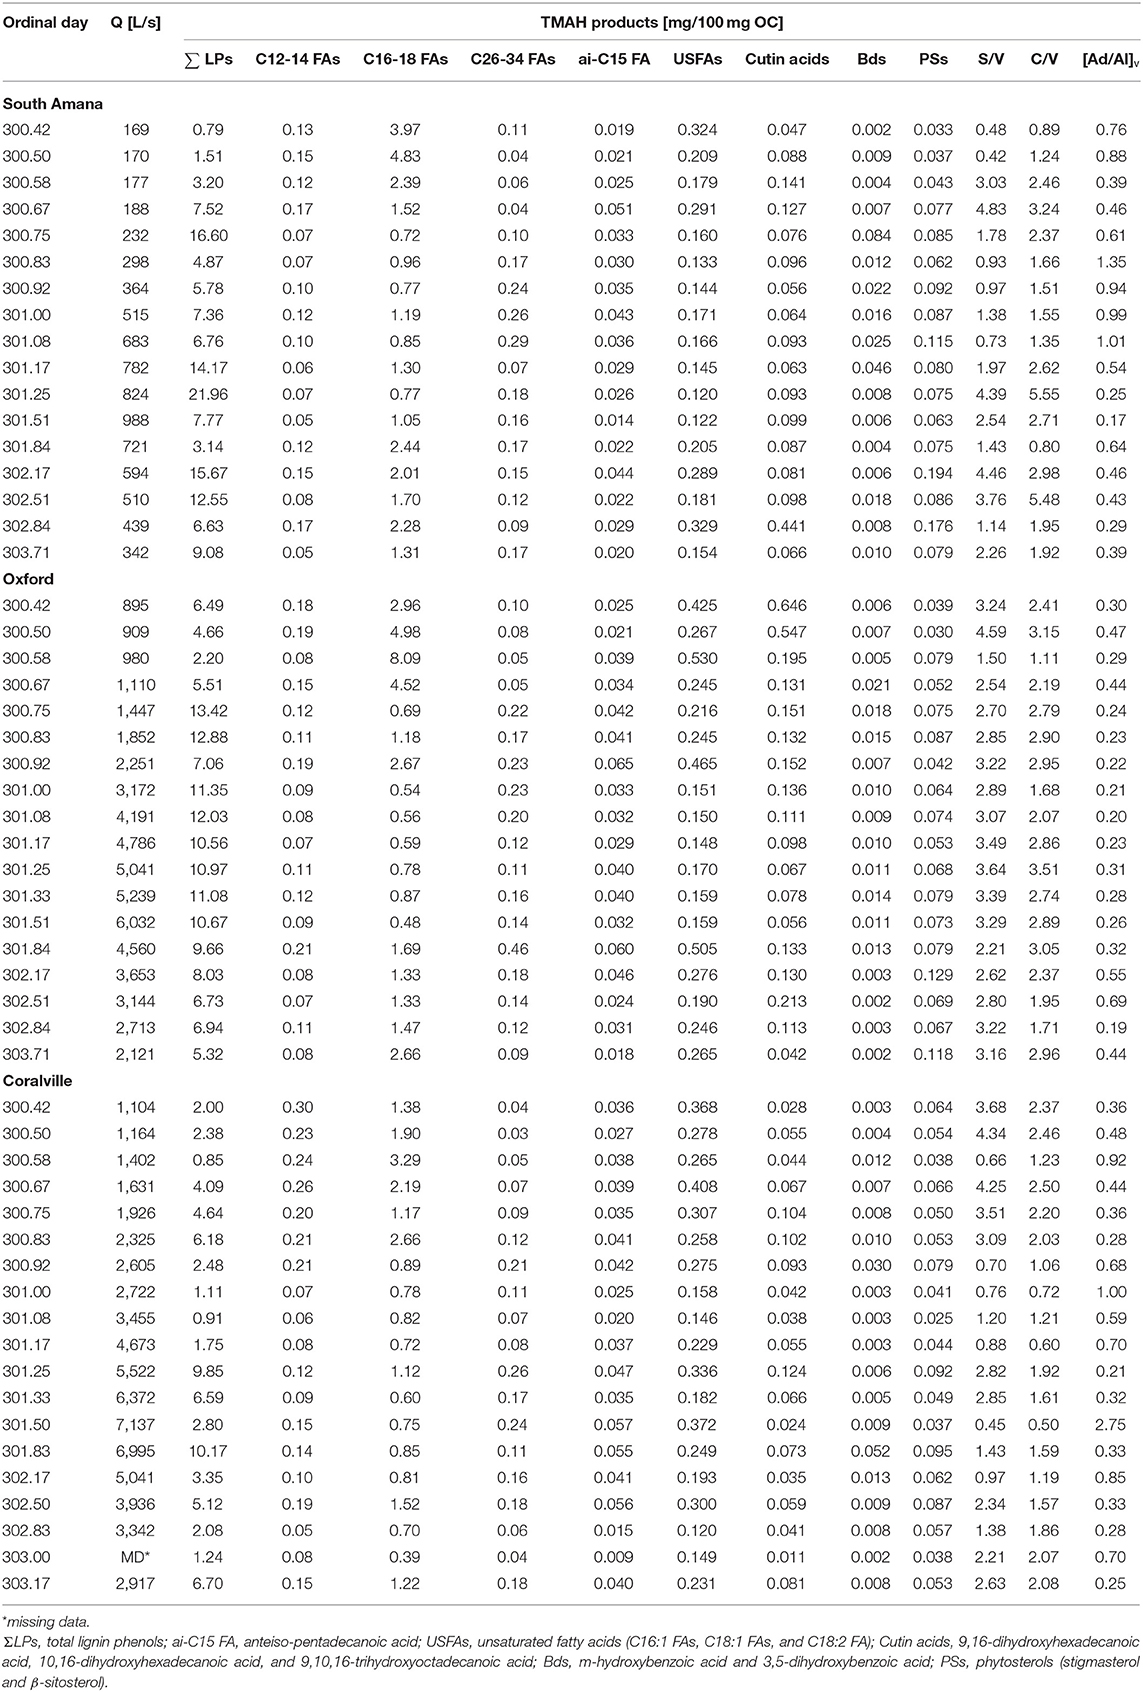
Table 4. OC-normalized concentrations of TMAH products.
The most abundant compounds from the TMAH thermochemolysis were lignin phenols, with totals ranging from 0.79 to 21.96 mg/100 mg OC. Insofar as lignin is the second or third most abundant biochemical on the planet and is an indicator of vascular plant OC (Hedges and Parker, 1976; Gordon and Goñi, 2003; Thevenot et al., 2010; Canuel and Hardison, 2016), this is not surprising in this setting. The phenols were followed in abundance by total saturated fatty acids (chain lengths 12–34 C's, or C12-C34) and unsaturated fatty acids (C16-C18), which ranged in concentration from 0.59 to 8.87 mg/100 mg OC and from 0.12 to 0.53 mg/100 mg OC, respectively. Among the saturated fatty acids, n-C16 and n-C18 fatty acids were the most dominant compounds reflecting their natural ubiquity in most organisms (Kvenvolden, 1967; Matsuda and Koyama, 1977; Behrens and Kyle, 1996). The yields of the other products while much less, exhibited varied responses to time (Figure 4B). Relatively short-chained (C12-14) saturated fatty acids and unsaturated fatty acids were more abundant during the early ppt period, whereas vascular plant-related biomarkers such as long-chain fatty acids (C26-34), cutin acids, and phytosterols were more abundant as precipitation and discharge increased. The hydroxy benzoic acids (Bds), which are thought to be soil indicators, spiked in concentration prior to the main peak in POC concentration (Figure 4C). In South Amana and Coralville, the Bd compounds spike a second time during the primary POC peak. In contrast, anteiso-C15 fatty acid, a bacterial lipid, is insensitive to the variations in discharge and time.
Discussion
Hydrologic Controls on POC Dynamics
Storm events are “hot moments” in time when disproportionately high concentrations of POC in streams are observed during elevated discharge (McClain et al., 2003; Hatten et al., 2012; Caverly et al., 2013; Dhillon and Inamdar, 2013). However, there are only a few studies with high temporal resolution sampling and none with multiple sampling stations to permit observations of the evolving storm pulse (Jung et al., 2012, 2015; Dhillon and Inamdar, 2014). In this study, the sampling was carried out with a short time interval (3 h) in three sampling stations throughout the watershed, allowing us to capture the rapid changes in POC concentrations with the hydrograph and observe the POC storm peak development downstream.
The POC concentrations varied as functions of precipitation, discharge and location (Figure 2), driven by what appears to be a sequence of processes. At the beginning of the storm—when the stream was still near baseflow—sediment and POC concentrations were low at all stations (Figure 2). Prominent early peaks in sediment and POC appeared at South Amana during the precipitation event. Similar but attenuated peaks were evident at the downstream locations. Peak discharge lagged precipitation as a result of hydrologic flow paths and the travel time of water to the channel (Howcroft and Willis, 1987; Haga et al., 2005). A later peak in sediment and POC correlated with the rise and fall of the discharge at all locations. The sequence marks the transition from a system that appears to be influenced initially by the precipitation itself, or is at least coeval with it, to one where discharge is the dominant control of POC transport.
Viewing the POC behavior as a function of discharge rather than time provides another perspective. Concentration-discharge (C-Q) relationships have been a useful tool to evaluate the overall processes and function of catchments (Williams, 1989; Picouet et al., 2001; Bieroza et al., 2018; Khanchoul et al., 2018), although less has been studied for particulate chemical species such as POC. The POC-Q relationship for the October 2015 storm displayed a clockwise hysteresis pattern for all three sampling stations (Figure 5). This is the most commonly observed C-Q relationship for sediment, where higher concentrations occur on the rising limb of the hydrograph and lower concentrations on the falling limb (Gellis, 2013; Cerro et al., 2014; Rose et al., 2018). This response has been attributed to inputs of easily mobilized sediment (or in this case POC) via the surface runoff from hillslopes and possibly resuspension of channel sediments (Wilson et al., 2012; Gellis, 2013). A similar observation for POC has been seen in agricultural watersheds (Oeurng et al., 2011; Caverly et al., 2013; Cerro et al., 2014), small forested watersheds (Dhillon and Inamdar, 2014; Johnson et al., 2018), and steep-sloped forested watersheds (Hatten et al., 2012; Jung et al., 2012). As the rainfall ceased and the sediment sources were exhausted, the POC concentrations were reduced on the falling limb of the hydrograph. The increasing contribution of subsurface flow to the stream further diluted the POC concentrations on the falling limb.
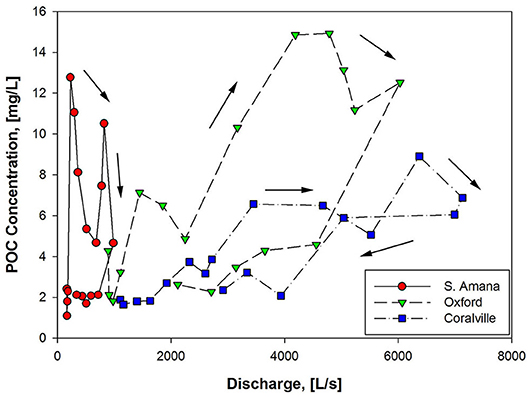
Figure 5. POC concentrations as a function of discharge.
Apart from the consistent clockwise direction of the hysteresis patterns, POC-Q relationships were station-dependent. While the POC concentrations for the two downstream stations strongly correlated with discharge (r = 0.74 for Oxford and 0.84 for Coralville, p < 0.05), a poor correlation existed (p > 0.05) for South Amana (Table 5). The slope of the rising limb of the POC-Q relationship also decreased in the downstream direction (Figure 5). The contrasting POC-Q relationships between South Amana and the two downstream stations are largely driven by the POC peaks that occurred in coincidence with the precipitation and the early rise in the hydrograph. These early flush peaks were most prominent at South Amana. Similar early flush peaks of sediment have been observed previously at South Amana and have been attributed to precipitation-driven erosion of surface soils based on 7Be measurements (Wilson et al., 2012). The early flush peaks were responsible for 21–67% of the sediment load from the South Amana subbasin, the range being dependent on the availability of easily eroded soil (Wilson et al., 2012).
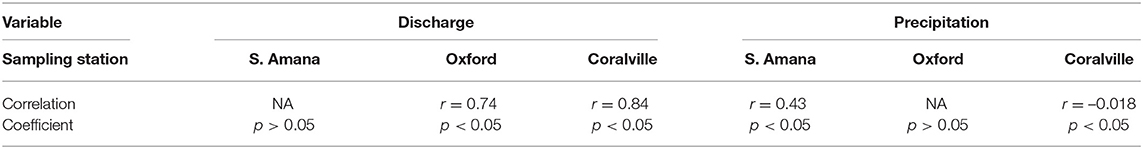
Table 5. Correlation coefficients between hydrologic variables and POC concentrations.
The differences in the responses at the three stations correlate with the local geomorphology and land use patterns within the basin. Storm trajectory is not thought to be a major factor in this case based on the modest increase in precipitation in the downstream direction from South Amana. The POC response to precipitation in South Amana is likely more dependent on the V-shaped morphology of the stream valley in the headwaters. The sediment delivery ratio (i.e., the fraction of mobilized soil delivered to the channel) approaches 0.9 for small areas (~3 ha) of the South Amana subbasin and are close to 0.2 for the entire subbasin based on soil erosion model extrapolations (Abaci and Papanicolaou, 2009). Soil erodibility and delivery is enhanced further by agricultural activity (Abaci and Papanicolaou, 2009; Rose et al., 2018). During our study, the row crop fields were bare of vegetation after the autumn harvest with a substantial amount of organic matter in the form of crop residue left in the fields. In these conditions, surface soils are susceptible to erosion and runoff during a precipitation event (Abaci and Papanicolaou, 2009; Hou et al., 2018; Xu et al., 2019).
As the watershed widens to a U- or box-shape downstream of South Amana, the fraction of eroded surface soils intercepted by the lower gradient portion of the landscape before reaching the channel increases (Ferro and Minacapilli, 1995; Abaci and Papanicolaou, 2009). Sediment delivery ratios extrapolated from soil erosion model results based on basin area are ~0.1, approximately half of what is estimated for South Amana (Abaci and Papanicolaou, 2009). The attenuation of local surface soil inputs is evident by the much smaller early flush peaks at Oxford and Coralville (Figure 2C, Table 6). Row crop cultivation also decreases from the upper to lower reach. Collectively these factors contribute to the decrease in importance of local surface soil inputs relative to bank erosion and material exported from upstream at Oxford and Coralville (Sutarto et al., 2014; Papanicolaou et al., 2017). As a consequence, the precipitation dependence of POC concentration disappears and discharge assumes dominance as one moves from the upper to lower reach.
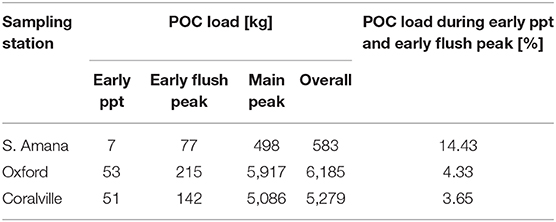
Table 6. POC loads per peak and event.
POC Compositional Changes
We observed temporal variations in the composition of the transported POC, consistent with selective mobilization of different sediment and POC sources observed in other catchments (Gellis, 2013; Koch et al., 2013; Smith et al., 2013). This was evident using both 13C/12C ratios and biomarker distributions (Figures 3, 4). The C-isotopes are especially sensitive to source variations in an agricultural watershed where corn, a C4 plant, is a dominant row crop. The distinct 13C-enrichment of corn (δ13C ~ −10 to −14‰) relative to more common terrestrial C3 plants (−25 to −29‰) and phytoplankton (−24 to −40‰) (Fry and Sherr, 1989; Thornton and McManus, 1994; Bianchi et al., 2007; Liu et al., 2018) allowed us to identify the input of corn-derived POC (Hou et al., 2018). Studies performed in the Clear Creek watershed indicate that surface soils and rain-drop liberated particulates from row crop fields have δ13C values ranging from −16.6 ± 0.5 to −19.6 ± 1.3‰, which reflect varying corn OC inputs (Hou et al., 2018). In contrast, restored prairie soils and their rain-drop liberated particles have values of −27 ± 0.6‰ that record the predominantly C3 grass source (Hou et al., 2018). Whereas the bulk of the corn POC signal in the stream is anticipated to be associated with surface soil runoff, bank erosion may liberate 13C-rich subsurface horizons as well. Rapid hillslope erosion and downslope deposition during the pre-conservation period buried and partially preserved agricultural top soils on the toes of hillslopes and the floodplain in at least one area within the South Amana subbasin (Yan et al., 2019). Floodplain deposition in general must be expected to contain 13C-enriched C because the alluvia will be partially derived from eroded surface soils. Biomarker measurements complement those of the stable isotopes by providing additional dimensions to the source profiling. Specific to this project, lignin-derived phenols provide information concerning vascular plant inputs, and fatty acid distributions can provide clues concerning non-vascular plant sources (Hedges et al., 1986; Goñi and Thomas, 2000; Gordon and Goñi, 2003; Jung et al., 2015; Canuel and Hardison, 2016).
The time series of POC compositional changes during the storm were similar across all sampling stations. During the early ppt period, when both the POC concentrations and discharge were low, the most negative δ13C values were observed. The most plausible explanation for the 13C-depleted material given the timing is that it signals the contribution of in-channel algal production (Hatten et al., 2012). Algal productivity as a result of eutrophication under low flow conditions in summer and early fall is a major source of POC in agricultural streams (Griffiths et al., 2012; Dolph et al., 2017; Moatar et al., 2017). This has been verified by visual observations at Clear Creek and of filtered material from Clear Creek. This material should be the first to be mobilized as water velocities increase (Goñi et al., 1998; Ford and Fox, 2014). The biomarker composition of the POC samples is an additional indicator of algal source. The early ppt POC samples had a greater abundance of short to medium-length (C12-18) saturated and medium-length (C16-18) monounsaturated fatty acids coupled with a lack of lignin phenols as would be expected for a non-vascular plant source. Although the C16 and C18 fatty acids are prevalent in most biogenic materials (Meyers et al., 1984), the extremely high concentrations of C16 and C18 fatty acids accompanied with short-chain fatty acids (C12-14) and C16-18 unsaturated fatty acids suggests a substantial contribution of algal or microbial biomass (Brooks et al., 1976; Kumari et al., 2013; Canuel and Hardison, 2016). Lower concentrations of vascular plant biomarkers (lignin, long-chain fatty acids (C26-34), phytosterols, and cutin acids) also support that in-stream production is the dominant source of POC. The anteiso-C15 fatty acid was examined to assess the contribution of bacteria-specific OC, but its profile did not show a consistent pattern with the hydrograph, possibly due to the ubiquity of bacteria and low concentration of bacteria-derived biomass in the stream (Goñi et al., 1998; Frazier et al., 2003; Cronan and Thomas, 2009; Canuel and Hardison, 2016).
The early flush peak and main storm peak in POC concentration exhibited major changes in δ13C and the vascular plant biomarker concentrations (Figures 3, 4). Lignin, in particular, increased in its concentration. The observed 13C-enrichment reflects the input of corn-derived plant material. The dominance of vascular plant biomarkers, the diminished concentrations of algae-derived biomarkers, and the 13C-enrichment supports our hypothesis that an important portion of POC introduced into the stream originated from eroded row crop soils. Non-lignin derived benzoic acids (3,5-dihydroxybenzoic acid and m-hydroxybenzoic acid), thought to be derived from proteins and tannins, are commonly associated with soil organic matter (Gordon and Goñi, 2003; Otto and Simpson, 2006; Hatten et al., 2012). These compounds paralleled the behavior of the vascular plant biomarkers (Figure 4C), showing a relatively high abundance during the early flush and main storm peaks.
The ratios of specific lignin phenols can provide more specificity in terms of plant type and plant tissue. Among major lignin monomers obtained from TMAH thermochemolysis, syringyl phenols (S) are uniquely synthesized by angiosperms, while vanillyl phenols (V) are found in all vascular plants. Cinnamyl phenols (C) are preferentially enriched in the non-woody tissues of vascular plants (Hedges and Mann, 1979). Therefore, higher S/V ratios can be a proxy for a higher contribution of angiosperms relative to gymnosperms and increased C/V ratios indicate a greater composition of non-woody derived OC (Figure 6A). The Clear Creek POC samples appear to lie along a mixing line between gymnosperms (woody and non-woody tissues are not well-resolved by the TMAH method) and non-woody angiosperms (Figure 6A). This is unexpected because the dominant vegetation in the watershed are non-woody angiosperms from the row crops and pastures, and woody angiosperms from forests (Nelson et al., 2016). Based on our GIS analysis of land cover in the watershed, gymnosperms appear to be < <1% of the vegetation. Some of the variation in lignin phenol ratios can be attributed to the large variability commonly seen within the non-woody angiosperm group (Goñi et al., 1998). Soils from corn-soybean cultivations differ from those of a restored prairie along a similar mixing line in the Clear Creek watershed where the prairie source is more gymnosperm-like (Hou et al., 2018).
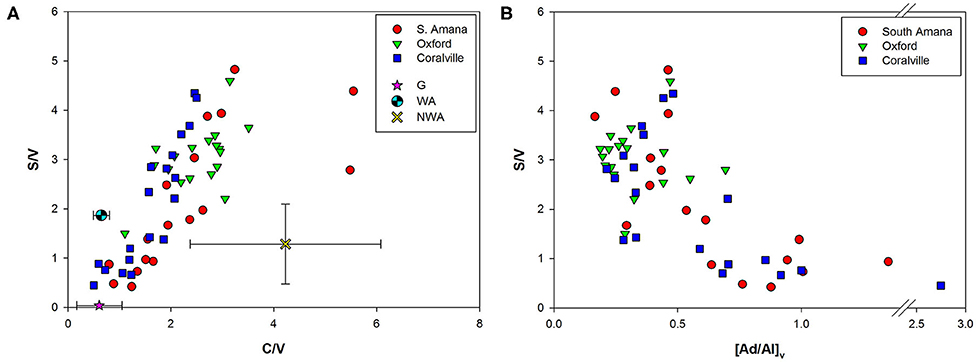
Figure 6. (A) Lignin source identification biplot. Plant reference materials used include gymnosperms (G) (Red Spruce, Eastern White Pine, Red Cedar), woody angiosperms (WA) (Oregon White Oak wood), and non-woody angiosperms (NWA) (Oregon White Oak leaf, Red Alder, Smooth Cordgrass, Saltmarsh Hay, and Eel grass). (B) S/V and [Ad/Al]v biplot. Increases in [Ad/Al]v indicate oxidative degradation of lignin.
There is also another potential explanation for the “gymnosperm” endmember signature that should not be discounted. Selective degradation of S and C phenols by fungi during diagenesis in soils can alter the S/V and C/V ratios to generate a more gymnosperm appearance (Hedges and Mann, 1979; Hedges et al., 1988; Goñi et al., 1993). The ratios of acids to aldehydes of V phenols and S phenols (e.g., [Ad/Al]v and [Ad/Al]s) have been used as proxies of oxidative degradation of lignin (Vane et al., 2001; Klotzbücher et al., 2011). Increases in the ratios have been reported in laboratory experiments of fungal degradation of woods (Hedges et al., 1988; Goñi et al., 1993) and with sediment samples (Ertel and Hedges, 1985; Pautler et al., 2010). Our POC samples with lower S/V ratios showed higher [Ad/Al]v, suggesting the preferential loss of S phenols is linked with the degradation state of lignin (Figure 6B). The same trend was observed for C/V ratios and ΣLignin with [Ad/Al]v further supporting the hypothesis that degradative processes are influencing lignin phenol ratios.
Both [Ad/Al]v and the hydroxy-benzoic acids (Bds) have been previously attributed to soil inputs to sediments. In Clear Creek, their appearances, while close in time, are not perfectly coincident (Figure 7). We hypothesize this reflects different soil inputs, further indicating the complexity of the POC mixtures and the underlying mechanisms of delivery to the channel. The resolution of the sources also illustrates the importance of temporally frequent measurements through a storm event.
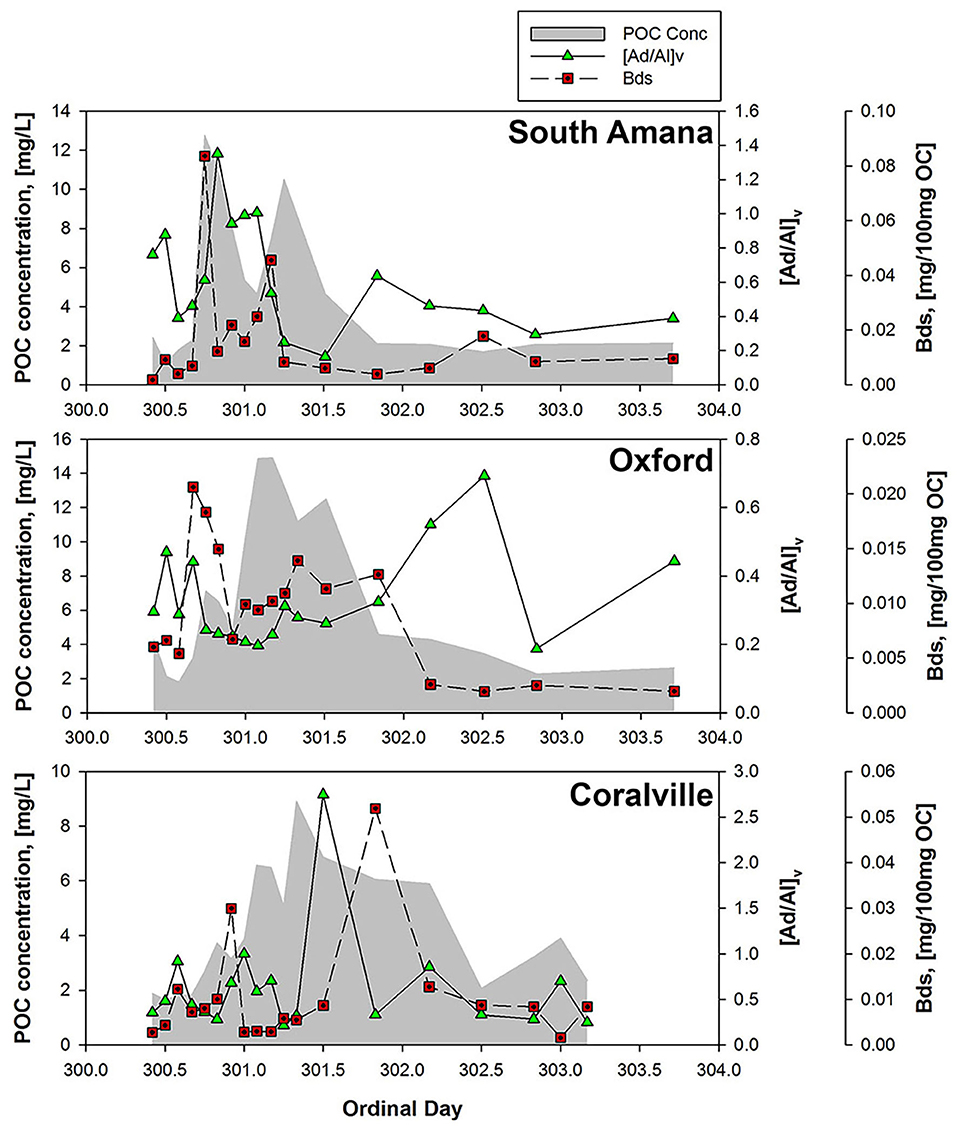
Figure 7. POC concentrations and degradation tracers ([Ad/Al]v ratios and Bds concentrations). Increases in [Ad/Al]v or Bds indicate degradation of lignin or soil organic matter.
Landscape-Stream Connectivity and POC Export
Thus far, we have considered the concentrations and composition of POC from a static, or standing crop, perspective. This has provided information concerning the timing of inputs and the availability of OC for reaction and/or transport. Flux estimates on the other hand reveal the relative contributions of the different parcels of POC to downstream transport (Figure 8). The quantity of POC exported downstream for the sampling period was ~580 kg C from South Amana, 6,200 kg C from Oxford, and 5,300 kg C from Coralville (Table 6). The ~10-fold increase in POC loads between South Amana and Oxford reflects the integration of material from the multiple tributaries and the mainstem as the storm pulse travels downstream. The decrease in flux between Oxford and Coralville is less intuitive. While we must consider the possibility that the change is due to a bias in our single point sampling, it may also signal a loss of C via deposition as a result of lower water velocity in the flatter and wider channel. The POC fluxes due to the combined early ppt and early flush peaks represented 14.4, 4.3, and 3.7% of the total flux at South Amana, Oxford and Coralville, respectively. The bulk of the POC transport thus was accomplished via the peak that is most closely correlated with changes in discharge.
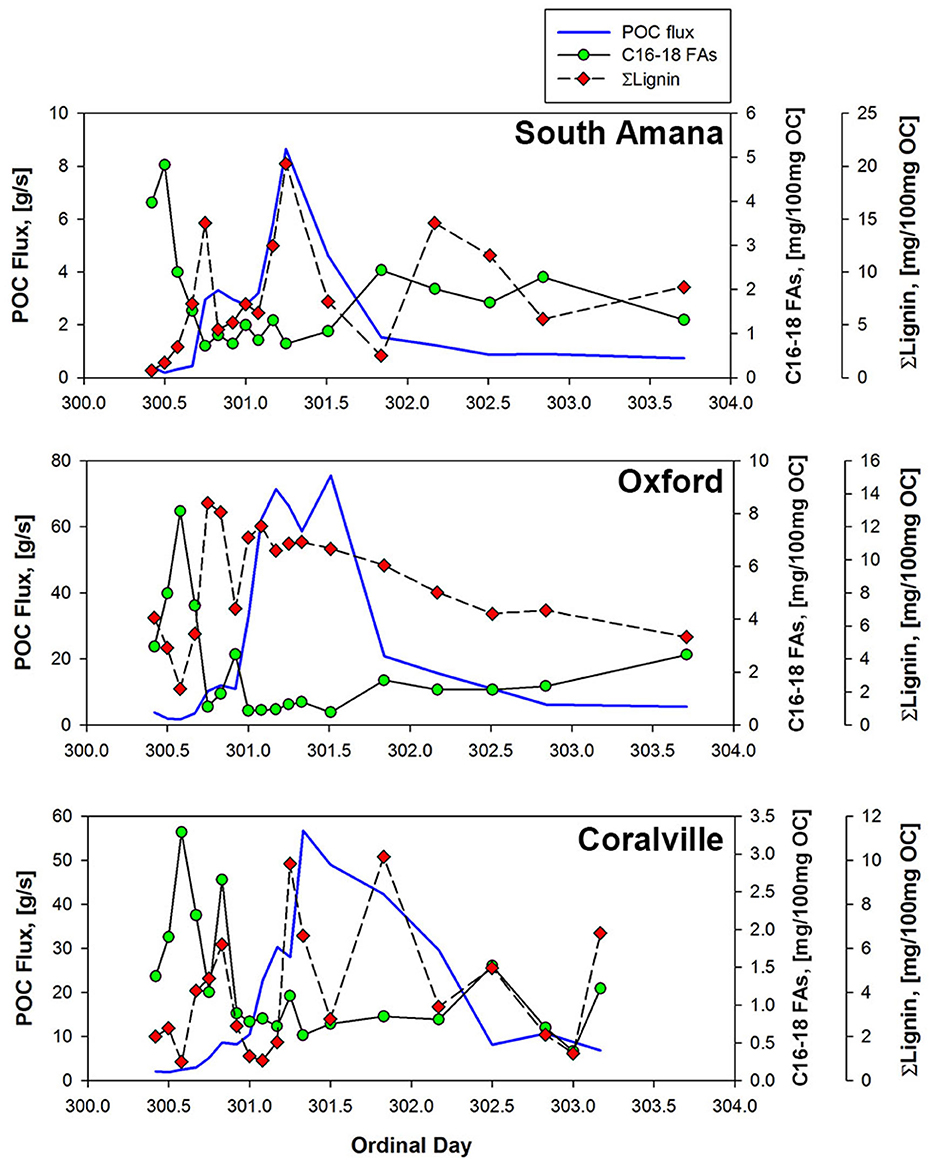
Figure 8. POC fluxes and OC-normalized concentrations of lignin and C16-18 FAs at three sampling stations. From the upper panel on down, South Amana, Oxford, and Coralville.
Whereas the POC in the early ppt and early flush peaks seems to be relatively simple in source, algal material and surface soils from row crops, the OC in the most important storm component in terms of export downstream is clearly more complicated in composition. This main peak appears to be an integrated mix of fresh and degraded vascular plant OC, likely derived from multiple yet to be identified soil sources.
A Conceptual Model for the Evolution of Storm-Pulse POC
The geochemistry has revealed both a temporal sequence of POC inputs and an evolution of the POC mixtures as they are transported downstream (Figure 9). Prior to the initiation of precipitation, the POC is dominated by in-channel sources. In the case of Clear Creek in autumn under low-flow conditions, algal production appeared to be the major source as is commonly seen in eutrophied agricultural streams (Dolph et al., 2017). Precipitation can trigger surface erosion and deliver POC to the channel. The magnitude of this input flux, which can be manifested as an early flush peak, is dependent on multiple factors. In Clear Creek and other agricultural settings, bare soils would be especially susceptible to erosion (Papanicolaou et al., 2015). Valley shape also influences sediment delivery ratios to the channel as illustrated by the attenuation of the early flush peak with valley widening downstream (Figure 9). The primary pulse of POC is correlated with the hydrograph. This complex mixture is derived from the accumulation of material from contributing tributaries and channel erosion. Bank erosion can contribute as much as 80% of sediment in agricultural catchments (Lamba et al., 2015). The broadening of this peak results from dispersion with transport (Romans et al., 2016) and an increase in complexity. This peak is not a homogeneous mixture in that it represents a partially resolved time series of inputs. Even though this conceptual model is based on the single Clear Creek event, aspects of it may be relevant to other events and systems. Specific details, such as the relative importance of the various components, will vary.
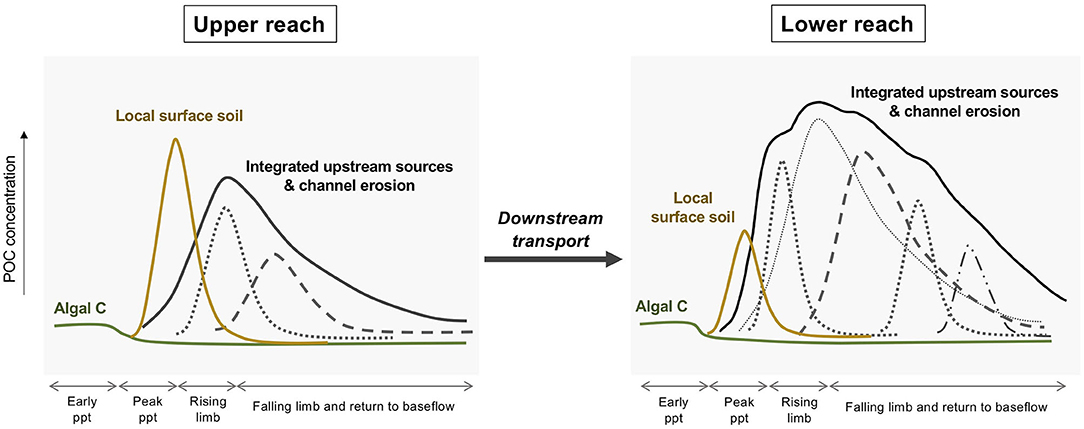
Figure 9. Conceptual response of a small agricultural stream to a storm event in terms of sources of POC. During early ppt periods during the summer-early fall, algal growth dominates the POC pool. Heavy precipitation erodes surface soils from row crop fields, especially after harvest, and this material is delivered to the channel most efficiently in the upper reach. The dominant POC pool is a complex mixture that is an integration of upstream sources including bank erosion. Individual peaks under the larger umbrella curves represent hypothetical constituent sources that arrive at different times.
Conclusion
The results from this study provide a snapshot of the in-stream POC response to a storm in a small agricultural stream system. POC concentrations and compositions in Clear Creek responded to the passage of a storm event in October 2015. Broad spectrum biomarker analyses coupled with stable carbon isotope measurements revealed that the source of POC changed from in-stream sources prior to the storm event to surface soils with vascular plant debris mobilized by precipitation and stream discharge. POC concentrations rapidly increased with discharge with a clockwise C-Q hysteresis pattern. The hysteresis was driven by the generation of early flush peaks of POC. The early peaks occurred during peak precipitation, and based on isotopic and biomarker information, likely were derived from the erosion of bare post-harvest row crop soils. The precipitation dependence was most evident in the upper reach due to the steeper landscape that enabled more efficient erosion and sediment delivery to the channel.
Studies of both the spatial and temporal variability of fluvial POC have been done in the catchments of the Moselle in France (11,500 km2, Le Meur et al., 2017) and the Amazon (6,300,00 km2, Aufdenkampe et al., 2007). It is apparent from these and other studies that the POC is a dynamic entity as it travels downstream. The size of the watershed seems to influence the turnover of bulk tracers such as radiocarbon but the impact on molecular biomarker compounds is unknown (Blair and Aller, 2012). Before this study, it was unclear if an interpretable behavior could be identified in a watershed as small as 280 km2 in size during a storm event when transit times from source to export might be on the order of a day. As was discovered, temporal variations in such a system are obvious on timescales of hours, and probably shorter, and they appear to be linked to changes in precipitation and discharge, which in turn selectively trigger or initiate the delivery of different inputs. Changes in POC composition occur during transport over kilometer distances, primarily due to the integration of accumulating sources. The downstream evolution of valley cross-section morphology from a V- to U-shape appears to have an observable effect on the efficiency by which surface erosion reaches the channel. The C-isotopic contrast offered by the presence of a C4 plant species provided a clear tracer in this agricultural setting, thereby amplifying input signals. Given our observations, we conclude that it may be difficult to scale the magnitude of POC compositional change on the molecular level to the size of the watershed because of the rapidity by which changes occur. Local conditions other than size have control.
Data Availability Statement
Original Clear Creek data are archived on the IML-CZO's Clowder database system. A spreadsheet can be downloaded from http://data.imlczo.org/clowder/datasets/5d922de44f0c55584a21a55b. The names of the repository/repositories and accession number(s) can be found in the article/Supplementary Material.
Author Contributions
KG was responsible for sample collection. JK performed the biomarker analyses and led the manuscript preparation. NB and AW oversaw the project from proposal preparation to final report. All authors contributed to the article and approved the submitted version.
Funding
Financial support was provided by the U.S. National Science Foundation (NSF) Grant # EAR-1331906 for the Critical Zone Observatory for Intensively Managed Landscapes (IML-CZO), a multi-institutional collaborative effort. A portion of time for Ward was supported by NSF Grant EAR-1360276.
Conflict of Interest
The authors declare that the research was conducted in the absence of any commercial or financial relationships that could be construed as a potential conflict of interest.
Acknowledgments
Caroline Davis, Kara Prior, and Courtney Cappalli provided assistance with field sampling. Jessie Moravek, Paul Roots, Yue Zeng, Dana Cooperberg, and Koushik Dutta assisted with analyses. Special thanks to Art Bettis and Thanos Papanicolaou for their leadership at the Iowa field site, and to Praveen Kumar for his of the IML-CZO.
References
Abaci, O., and Papanicolaou, A. N. T. (2009). Long-term effects of management practices on water-driven soil erosion in an intense agricultural sub-watershed: monitoring and modelling. Hydrol. Process 23, 2818–2837. doi: 10.1002/hyp.7380
Alvarez-Cobelas, M., Angeler, D., Sánchez-Carrillo, S., and Almendros, G. (2012). A worldwide view of organic carbon export from catchments. Biogeochemistry 107, 275–293. doi: 10.1007/s10533-010-9553-z
Amado, A. A., Schilling, K. E., Jones, C. S., Thomas, N., and Weber, L. J. (2017). Estimation of tile drainage contribution to streamflow and nutrient loads at the watershed scale based on continuously monitored data. Environ. Monit. Assess 189:13. doi: 10.1007/s10661-017-6139-4
Aufdenkampe, A. K., Mayorga, E., Hedges, J. I., Llerena, C., Quay, P. D., Gudeman, J., et al. (2007). Organic matter in the Peruvian headwaters of the Amazon: compositional evolution from the Andes to the lowland Amazon mainstem. Org. Geochem. 38, 337–364. doi: 10.1016/j.orggeochem.2006.06.003
Behrens, P. W., and Kyle, D. J. (1996). Microalgae as a source of fatty acids. J. Food Lipids 3, 259–272. doi: 10.1111/j.1745-4522.1996.tb00073.x
Bettis, E. A., Muhs, D. R., Roberts, H. M., and Wintle, A. G. (2003). Last glacial loess in the conterminous USA. Quat. Sci. Rev. 22, 1907–1946. doi: 10.1016/S0277-3791(03)00169-0
Bianchi, T. S., Wysocki, L. A., Stewart, M., Filley, T. R., and McKee, B. A. (2007). Temporal variability in terrestrially-derived sources of particulate organic carbon in the lower Mississippi River and its upper tributaries. Geochim. Cosmochim. Acta 71, 4425–4437. doi: 10.1016/j.gca.2007.07.011
Bieroza, M. Z., Heathwaite, A. L., Bechmann, M., Kyllmar, K., and Jordan, P. (2018). The concentration-discharge slope as a tool for water quality management. Sci. Total Environ. 630, 738–749. doi: 10.1016/j.scitotenv.2018.02.256
Blair, N., and Leithold, E. (2013). “Impacts of watershed processes on exported riverine organic carbon,” in Biogeochemical Dynamics at Major River-Coastal Interfaces: Linkages With Global Change, eds T. S. Blanchi, M. A. Allison, and W. J. Cai (Cambridge: Cambridge University Press), 174–199. doi: 10.1017/CBO9781139136853.011
Blair, N. E., and Aller, R. C. (2012). The fate of terrestrial organic carbon in the marine environment. Ann. Rev. Mar. Sci. 4, 401–423. doi: 10.1146/annurev-marine-120709-142717
Blair, N. E., Leithold, E. L., and Aller, R. C. (2004). From bedrock to burial: the evolution of particulate organic carbon across coupled watershed-continental margin systems. Mar. Chem. 92, 141–156. doi: 10.1016/j.marchem.2004.06.023
Blair, N. E., Leithold, E. L., Papanicolaou, A. T., Wilson, C. G., Keefer, L., Kirton, E., et al. (2018). The C-biogeochemistry of a Midwestern USA agricultural impoundment in context: Lake decatur in the intensively managed landscape critical zone observatory. Biogeochemistry 138, 171–195. doi: 10.1007/s10533-018-0439-9
Brooks, P., Eglinton, G., Gaskell, S., McHugh, D., Maxwell, J., and Philp, R. (1976). Lipids of recent sediments, Part I: straight-chain hydrocarbons and carboxylic acids of some temperate lacustrine and sub-tropical lagoonal/tidal flat sediments. Chem. Geol. 18, 21–38. doi: 10.1016/0009-2541(76)90058-9
Canuel, E. A., and Hardison, A. K. (2016). Sources, ages, and alteration of organic matter in estuaries. Ann. Rev. Mar. Sci. 8, 409–434. doi: 10.1146/annurev-marine-122414-034058
Caverly, E., Kaste, J. M., Hancock, G. S., and Chambers, R. M. (2013). Dissolved and particulate organic carbon fluxes from an agricultural watershed during consecutive tropical storms. Geophys. Res. Lett. 40, 5147–5152. doi: 10.1002/grl.50982
Cerro, I., Sanchez-Perez, J. M., Ruiz-Romera, E., and Antigüedad, I. (2014). Variability of particulate (SS, POC) and dissolved (DOC, NO3) matter during storm events in the Alegria agricultural watershed. Hydrol. Process 28, 2855–2867. doi: 10.1002/hyp.9850
Cho, K., and Salton, M. (1966). Fatty acid composition of bacterial membrane and wall lipids. Biochim. Biophys. Acta. 116, 73–79. doi: 10.1016/0005-2760(66)90093-2
Clifford, D. J., Carson, D. M., McKinney, D. E., Bortiatynski, J. M., and Hatcher, P. G. (1995). A new rapid technique for the characterization of lignin in vascular plants: thermochemolysis with tetramethylammonium hydroxide (TMAH). Org. Geochem. 23, 169–175. doi: 10.1016/0146-6380(94)00109-E
Cole, J. J., Prairie, Y. T., Caraco, N. F., McDowell, W. H., Tranvik, L. J., Striegl, R. G., et al. (2007). Plumbing the global carbon cycle: integrating inland waters into the terrestrial carbon budget. Ecosystems 10, 172–185. doi: 10.1007/s10021-006-9013-8
Cooper, W.J., and Blumer, M. (1968). Linear, iso and anteiso fatty acids in recent sediments of the North Atlantic. Deep Sea Res. Oceanogr. Abstr. 15, 535–540. doi: 10.1016/0011-7471(68)90062-4
Coplen, T. (1995). Reporting of stable hydrogen, carbon, and oxygen isotopic abundances. Geothermics 5, 707–712. doi: 10.1016/0375-6505(95)00024-0
Cronan, J. E., and Thomas, J. (2009). Bacterial fatty acid synthesis and its relationships with polyketide synthetic pathways. Meth. Enzymol. 459, 395–433. doi: 10.1016/S0076-6879(09)04617-5
Davis, C. A., Ward, A. S., Burgin, A. J., Loecke, T. D., Riveros-Iregui, D. A., Schnoebelen, D. J., et al. (2014). Antecedent moisture controls on stream nitrate flux in an agricultural watershed. J. Environ. Qual. 43, 1494–1503. doi: 10.2134/jeq2013.11.0438
Del Rio, J. C., and Hatcher, P. G. (1998). Analysis of aliphatic biopolymers using thermochemolysis with tetramethylammonium hydroxide (TMAH) and gas chromatography-mass spectrometry. Org. Geochem. 29, 1441–1451. doi: 10.1016/S0146-6380(98)00070-9
del Rio, J. C., McKinney, D. E., Knicker, H., Nanny, M. A., Minard, R. D., and Hatcher, P. G. (1998). Structural characterization of bio- and geo-macromolecules by off-line thermochemolysis with tetramethylammonium hydroxide. J. Chromatogr. A 823, 433–448. doi: 10.1016/S0021-9673(98)00268-4
Derrien, M., Yang, L., and Hur, J. (2017). Lipid biomarkers and spectroscopic indices for identifying organic matter sources in aquatic environments: a review. Water Res. 112, 58–71. doi: 10.1016/j.watres.2017.01.023
Dhillon, G. S., and Inamdar, S. (2013). Extreme storms and changes in particulate and dissolved organic carbon in runoff: entering uncharted waters? Geophys. Res. Lett. 40, 1322–1327. doi: 10.1002/grl.50306
Dhillon, G. S., and Inamdar, S. (2014). Storm event patterns of particulate organic carbon (POC) for large storms and differences with dissolved organic carbon (DOC). Biogeochemistry 118, 61–81. doi: 10.1007/s10533-013-9905-6
Doetterl, S., Berhe, A. A., Nadeu, E., Wang, Z., Sommer, M., and Fiener, P. (2016). Erosion, deposition and soil carbon: a review of process-level controls, experimental tools and models to address C cycling in dynamic landscapes. Earth Sci. Rev. 154, 102–122. doi: 10.1016/j.earscirev.2015.12.005
Dolph, C. L., Hansen, A. T., and Finlay, J. C. (2017). Flow-related dynamics in suspended algal biomass and its contribution to suspended particulate matter in an agricultural river network of the Minnesota River Basin, USA. Hydrobiologia 785, 127–147. doi: 10.1007/s10750-016-2911-7
Eash, D. A. (1993). Estimating Design-Flood Discharges for Streams in Iowa Using Drainage-Basin and Channel-Geometry Characteristics. Iowa City, IA: IAUS Geological Survey.
Ertel, J. R., and Hedges, J. I. (1985). Sources of sedimentary humic substances: vascular plant debris. Geochim. Cosmochim. Acta 49, 2097–2107. doi: 10.1016/0016-7037(85)90067-5
Ferro, V., and Minacapilli, M. (1995). Sediment delivery processes at basin scale. Hydrol. Sci. J. 40, 703–717. doi: 10.1080/02626669509491460
Filley, T. R., Boutton, T. W., Liao, J. D., Jastrow, J. D., and Gamblin, D. E. (2008). Chemical changes to nonaggregated particulate soil organic matter following grassland-to-woodland transition in a subtropical savanna. J. Geophys. Res. 113:564. doi: 10.1029/2007jg000564
Ford, W. I., and Fox, J. F. (2014). Model of particulate organic carbon transport in an agriculturally impacted stream. Hydrol. Process 28, 662–675. doi: 10.1002/hyp.9569
Frazier, S. W., Nowack, K. O., Goins, K. M., Cannon, F. S., Kaplan, L. A., and Hatcher, P. G. (2003). Characterization of organic matter from natural waters using tetramethylammonium hydroxide thermochemolysis GC-MS. J. Anal. Appl. Pyrolysis 70, 99–128. doi: 10.1016/S0165-2370(02)00098-0
Fry, B., and Sherr, E. B. (1989). “δ13C measurements as indicators of carbon flow in marine and freshwater ecosystems,” in Stable Isotopes in Ecological Research. Ecological Studies (Analysis and Synthesis), Vol. 68, eds P. W. Rundel, J. R. Ehleringer, and K. A. Nagy (New York, NY: Springer). doi: 10.1007/978-1-4612-3498-2_12
Gellis, A. C. (2013). Factors influencing storm-generated suspended-sediment concentrations and loads in four basins of contrasting land use, humid-tropical Puerto Rico. Catena 104, 39–57. doi: 10.1016/j.catena.2012.10.018
Goñi, M. A., Nelson, B., Blanchette, R. A., and Hedges, J. I. (1993). Fungal degradation of wood lignins: geochemical perspectives from CuO-derived phenolic dimers and monomers. Geochim. Cosmochim. Acta 57, 3985–4002. doi: 10.1016/0016-7037(93)90348-Z
Goñi, M. A., Ruttenberg, K. C., and Eglinton, T. I. (1998). A reassessment of the sources and importance of land-derived organic matter in surface sediments from the Gulf of Mexico. Geochim. Cosmochim. Acta 62, 3055–3075. doi: 10.1016/S0016-7037(98)00217-8
Goñi, M. A., and Thomas, K. A. (2000). Sources and transformations of organic matter in surface soils and sediments from a tidal estuary (North Inlet, South Carolina, USA). Estuaries 23, 548–564. doi: 10.2307/1353145
Gordon, E. S., and Goñi, M. A. (2003). Sources and distribution of terrigenous organic matter delivered by the Atchafalaya River to sediments in the northern Gulf of Mexico. Geochim. Cosmochim. Acta 67, 2359–2375. doi: 10.1016/S0016-7037(02)01412-6
Griffiths, N. A., Tank, J. L., Royer, T. V., Warrner, T. J., Frauendorf, T. C., Rosi-Marshall, E. J., et al. (2012). Temporal variation in organic carbon spiraling in Midwestern agricultural streams. Biogeochemistry 108, 149–169. doi: 10.1007/s10533-011-9585-z
Haga, H., Matsumoto, Y., Matsutani, J., Fujita, M., Nishida, K., and Sakamoto, Y. (2005). Flow paths, rainfall properties, and antecedent soil moisture controlling lags to peak discharge in a granitic unchanneled catchment. Water Resour. Res. 41:W12410. doi: 10.1029/2005WR004236
Harris, D., Horwáth, W. R., and Van Kessel, C. (2001). Acid fumigation of soils to remove carbonates prior to total organic carbon or carbon-13 isotopic analysis. Soil Sci. Soc. Am. J. 65, 1853–1856. doi: 10.2136/sssaj2001.1853
Harvey, H. R. (1994). Fatty acids and sterols as source markers of organic matter in sediments of the North Carolina continental slope. Deep Sea Res Part II Top. Stud. Oceanogr. 41, 783–796. doi: 10.1016/0967-0645(94)90048-5
Hatcher, P. G., Nanny, M. A., Minard, R. D., Dible, S. D., and Carson, D. M. (1995). Comparison of two thermochemolytic methods for the analysis of lignin in decomposing gymnosperm wood: the CuO oxidation method and the method of thermochemolysis with tetramethylammonium hydroxide (TMAH). Org. Geochem. 23, 881–888. doi: 10.1016/0146-6380(95)00087-9
Hatten, J. A., Goñi, M. A., and Wheatcroft, R. A. (2012). Chemical characteristics of particulate organic matter from a small, mountainous river system in the Oregon Coast Range, USA. Biogeochemistry 107, 43–66. doi: 10.1007/s10533-010-9529-z
Hedges, J. I., Blanchette, R. A., Weliky, K., and Devol, A. H. (1988). Effects of fungal degradation on the CuO oxidation products of lignin: a controlled laboratory study. Geochim. Cosmochim. Acta 52, 2717–2726. doi: 10.1016/0016-7037(88)90040-3
Hedges, J. I., Clark, W. A., Quay, P. D., Richey, J. E., Devol, A. H., and Santos, M. (1986). Compositions and fluxes of particulate organic material in the Amazon River 1. Limnol. Oceanogr. 31, 717–738. doi: 10.4319/lo.1986.31.4.0717
Hedges, J. I., and Mann, D. C. (1979). The characterization of plant tissues by their lignin oxidation products. Geochim. Cosmochim. Acta 43, 1803–1807. doi: 10.1016/0016-7037(79)90028-0
Hedges, J. I., and Parker, P. L. (1976). Land-derived organic matter in surface sediments from the Gulf of Mexico. Geochim. Cosmochim. Acta 40, 1019–1029. doi: 10.1016/0016-7037(76)90044-2
Hou, T., Berry, T. D., Singh, S., Hughes, M. N., Tong, Y., Papanicolaou, A. T., et al. (2018). Control of tillage disturbance on the chemistry and proportion of raindrop-liberated particles from soil aggregates. Geoderma 330, 19–29. doi: 10.1016/j.geoderma.2018.05.013
Howcroft, H., and Willis, A. (1987). The rainfall-runoff relationship in a small catchment. Field Stud. 6, 619–655.
Jeong, J.-J., Bartsch, S., Fleckenstein, J. H., Matzner, E., Tenhunen, J. D., Lee, S. D., et al. (2012). Differential storm responses of dissolved and particulate organic carbon in a mountainous headwater stream, investigated by high-frequency, in situ optical measurements. J. Geophys. Res. 117:G03013. doi: 10.1029/2012JG001999
Johnson, E. R., Inamdar, S., Kan, J., and Vargas, R. (2018). Particulate organic matter composition in stream runoff following large storms: role of POM sources, particle size, and event characteristics. J. Geophys. Res. Biogeosci. 23, 660–675. doi: 10.1002/2017JG004249
Jung, B. J., Jeanneau, L., Alewell, C., Kim, B., and Park, J. H. (2015). Downstream alteration of the composition and biodegradability of particulate organic carbon in a mountainous, mixed land-use watershed. Biogeochemistry 122, 79–99. doi: 10.1007/s10533-014-0032-9
Jung, B. J., Lee, H. J., Jeong, J. J., Owen, J., Kim, B., Meusburger, K., et al. (2012). Storm pulses and varying sources of hydrologic carbon export from a mountainous watershed. J. Hydrol. 440, 90–101. doi: 10.1016/j.jhydrol.2012.03.030
Khanchoul, K., Saaidia, B., and Altschu, R. (2018). Variation in sediment concentration and water disharge during storm eevents in two catchments, Northeast of Algeria. Earth Sci. Malaysia (ESMY) 2, 1–9. doi: 10.26480/esmy.02.2018.01.09
Klotzbücher, T., Filley, T. R., Kaiser, K., and Kalbitz, K. (2011). A study of lignin degradation in leaf and needle litter using 13C-labelled tetramethylammonium hydroxide (TMAH) thermochemolysis: comparison with CuO oxidation and van soest methods. Org. Geochem. 42, 1271–1278. doi: 10.1016/j.orggeochem.2011.07.007
Koch, J. C., Runkel, R. L., Striegl, R., and McKnight, D. M. (2013). Hydrologic controls on the transport and cycling of carbon and nitrogen in a boreal catchment underlain by continuous permafrost. J. Geophys. Res. Biogeosci. 118, 698–712. doi: 10.1002/jgrg.20058
Kumar, P., Le, P. V. V., Papanicolaou, A. N. T., Rhoads, B. L., Anders, A. M., Stumpf, A., et al. (2018). Critical transition in critical zone of intensively managed landscapes. Anthropocene 22, 10–19. doi: 10.1016/j.ancene.2018.04.002
Kumari, P., Kumar, M., Reddy, C. R. K., and Jha, B. (2013). “Algal lipids, fatty acids and sterols,” in Functional Ingredients From Algae for Foods and Nutraceuticals, ed H. Domínguez (Cambridge: Woodhead Publishing), 87–134. doi: 10.1533/9780857098689.1.87
Kvenvolden, K. A. (1967). Normal fatty acids in sediments. J. Am. Oil Chem. Soc. 44, 628–636. doi: 10.1007/BF02680031
Lamba, J., Karthikeyan, K. G., and Thompson, A. M. (2015). Apportionment of suspended sediment sources in an agricultural watershed using sediment fingerprinting. Geoderma 239, 25–33. doi: 10.1016/j.geoderma.2014.09.024
Le Meur, M., Mansuy-Huault, L., Lorgeoux, C., Bauer, A., Gley, R., Vantelon, D., et al. (2017). Spatial and temporal variations of particulate organic matter from Moselle River and tributaries: a multimolecular investigation. Org. Geochem. 110, 45–56. doi: 10.1016/j.orggeochem.2017.04.003
Leithold, E. L., Blair, N. E., and Wegmann, K. W. (2016). Source-to-sink sedimentary systems and global carbon burial: a river runs through it. Earth Sci. Rev.153, 30–42. doi: 10.1016/j.earscirev.2015.10.011
Li, W., Dagaut, J., and Saliot, A. (1995). The application of sterol biomarkers to the study of the sources of particulate organic matter in the Solo River system and and Serayu River, Java, Indonesia. Biogeochemistry 31, 139–154. doi: 10.1007/BF00004046
Liu, W., Li, X., Wang, Z., Wang, H., Liu, H., Zhang, B., et al. (2018). Carbon isotope and environmental changes in lakes in arid Northwest China. Sci. China Earth Sci. 62, 1193–1209. doi: 10.1007/s11430-018-9232-4
Matsuda, H., and Koyama, T. (1977). Early diagenesis of fatty acids in lacustrine sediments—I. Identification and distribution of fatty acids in recent sediment from a freshwater lake. Geochim. Cosmochim. Acta 41, 777–783. doi: 10.1016/0016-7037(77)90048-5
McClain, M. E., Boyer, E. W., Dent, C. L., Gergel, S. E., Grimm, N. B., Groffman, P. M., et al. (2003). Biogeochemical hot spots and hot moments at the interface of terrestrial and aquatic ecosystems. Ecosystems 301–312. doi: 10.1007/s10021-003-0161-9
McKinney, D. E., Carson, D. M., Clifford, D. J., Minard, R. D., and Hatcher, P. G. (1995). Off-line thermochemolysis versus flash pyrolysis for the in situ methylation of lignin: is pyrolysis necessary? J. Anal. Appl. Pyrolysis 34, 41–46. doi: 10.1016/0165-2370(94)00865-X
Meybeck, M. (1982). Carbon, nitrogen, and phosphorus transport by world rivers. Am. J. Sci. 282, 401–450. doi: 10.2475/ajs.282.4.401
Meyers, P. A., Kawka, O. E., and Whitehead, D. R. (1984). Geolipid, pollen and diaton stratigraphy in postglacial lacustrine sediments. Org. Geochem. 6, 727–732. doi: 10.1016/0146-6380(84)90093-7
Moatar, F., Abbott, B. W., Minaudo, C., Curie, F., and Pinay, G. (2017). Elemental properties, hydrology, and biology interact to shape concentration-discharge curves for carbon, nutrients, sediment, and major ions. Water Resour. Res. 53, 1270–1287. doi: 10.1002/2016WR019635
Nelson, M. D., Barnett, C. J., Brewer, M., Butler, B. J., Crocker, S. J., Domke, G. M., et al. (2016). Iowa forests, 2013. Resour. Bull. 2013:124. doi: 10.2737/NRS-RB-102
Newbold, J., Mulholland, P., Elwood, J., and O'neill, R. (1982). Organic carbon spiralling in stream ecosystems. Oikos 266–272. doi: 10.2307/3544663
Oeurng, C., Sauvage, S., Coynel, A., Maneux, E., Etcheber, H., and Sánchez-Pérez, J. M. (2011). Fluvial transport of suspended sediment and organic carbon during flood events in a large agricultural catchment in southwest France. Hydrol. Process 25, 2365–2378. doi: 10.1002/hyp.7999
Otto, A., and Simpson, M. J. (2006). Evaluation of CuO oxidation parameters for determining the source and stage of lignin degradation in soil. Biogeochemistry 80, 121–142. doi: 10.1007/s10533-006-9014-x
Papanicolaou, A. N., Wacha, K. M., Abban, B. K., Wilson, C. G., Hatfield, J. L., Stanier, C. O., et al. (2015). From soilscapes to landscapes: a landscape-oriented approach to simulate soil organic carbon dynamics in intensively managed landscapes. J. Geophys. Res. Biogeosci. 120, 2375–2401. doi: 10.1002/2015JG003078
Papanicolaou, A. T., Wilson, C. G., Tsakiris, A. G., Sutarto, T. E., Bertrand, F., Rinaldi, M., et al. (2017). Understanding mass fluvial erosion along a bank profile: using PEEP technology for quantifying retreat lengths and identifying event timing. Earth Surf. Process Landf. 42, 1717–1732. doi: 10.1002/esp.4138
Pautler, B. G., Austin, J., Otto, A., Stewart, K., Lamoureux, S. F., and Simpson, M. J. (2010). Biomarker assessment of organic matter sources and degradation in Canadian high arctic littoral sediments. Biogeochemistry 100, 75–87. doi: 10.1007/s10533-009-9405-x
Picouet, C., Hingray, B., and Olivry, J. (2001). Empirical and conceptual modelling of the suspended sediment dynamics in a large tropical African river: the Upper Niger river basin. J. Hydrol. 250, 19–39. doi: 10.1016/S0022-1694(01)00407-3
Rayburn, A. P., and Schulte, L. A. (2009a). Integrating historic and contemporary data to delineate potential remnant natural woodlands within midwestern agricultural landscapes. Nat. Areas J. 29, 4–14. doi: 10.3375/043.029.0102
Rayburn, A. P., and Schulte, L. A. (2009b). Landscape change in an agricultural watershed in the US Midwest. Landsc. Urban Plan. 93, 132–141. doi: 10.1016/j.landurbplan.2009.06.014
Raymond, P. A., Saiers, J. E., and Sobczak, W. V. (2016). Hydrological and biogeochemical controls on watershed dissolved organic matter transport: Pulse-shunt concept. Ecology 97, 5–16. doi: 10.1890/14-1684.1
Romans, B. W., Castelltort, S., Covault, J. A., Fildani, A., and Walsh, J. P. (2016). Environmental signal propagation in sedimentary systems across timescales. Earth Sci. Rev. 153, 7–29. doi: 10.1016/j.earscirev.2015.07.012
Rose, L. A., Karwan, D. L., and Godsey, S. E. (2018). Concentration–discharge relationships describe solute and sediment mobilization, reaction, and transport at event and longer timescales. Hydrol. Process 32, 2829–2844. doi: 10.1002/hyp.13235
Saliot, A., Mejanelle, L., Scribe, P., Fillaux, J., Pepe, C., Jabaud, A., et al. (2001). Particulate organic carbon, sterols, fatty acids and pigments in the Amazon River system. Biogeochemistry 53, 79–103. doi: 10.1023/A:1010754022594
Schilling, K. E., and Helmers, M. (2008). Effects of subsurface drainage tiles on streamflow in Iowa agricultural watersheds: exploratory hydrograph analysis. Hydrol. Process 22, 4497–4506. doi: 10.1002/hyp.7052
Schilling, K. E., Jindal, P., Basu, N. B., and Helmers, M. J. (2012). Impact of artificial subsurface drainage on groundwater travel times and baseflow discharge in an agricultural watershed, Iowa (USA). Hydrol. Process 26, 3092–3100. doi: 10.1002/hyp.8337
Schimmelmann, A., Albertino, A., Sauer, P. E., Qi, H., Molinie, R., and Mesnard, F. (2009). Nicotine, acetanilide and urea multi-level 2H-, 13C-and 15N-abundance reference materials for continuous-flow isotope ratio mass spectrometry. Rapid Commun. Mass Spectrom. 23, 3513–3521. doi: 10.1002/rcm.4277
Skrzypek, G. (2013). Normalization procedures and reference material selection in stable HCNOS isotope analyses: an overview. Anal. Bioanal. Chem. 405, 2815–2823. doi: 10.1007/s00216-012-6517-2
Smith, J. C., Galy, A., Hovius, N., Tye, A. M., Turowski, J. M., and Schleppi, P. (2013). Runoff-driven export of particulate organic carbon from soil in temperate forested uplands. Earth Planet. Sci. Lett. 365, 198–208. doi: 10.1016/j.epsl.2013.01.027
Sutarto, T., Papanicolaou, A., Wilson, C., and Langendoen, E. (2014). Stability analysis of semicohesive streambanks with CONCEPTS: coupling field and laboratory investigations to quantify the onset of fluvial erosion and mass failure. J. Hydraul. Eng. 140:04014041. doi: 10.1061/(ASCE)HY.1943-7900.0000899
Thevenot, M., Dignac, M. F., and Rumpel, C. (2010). Fate of lignins in soils: a review. Soil Biol. Biochem. 42, 1200–1211. doi: 10.1016/j.soilbio.2010.03.017
Thornton, S., and McManus, J. (1994). Application of organic carbon and nitrogen stable isotope and C/N ratios as source indicators of organic matter provenance in estuarine systems: evidence from the Tay Estuary, Scotland. Estuar. Coast. Shelf Sci. 38, 219–233. doi: 10.1006/ecss.1994.1015
Vaculikova, L., and Plevova, E. (2005). Identification of clay minerals and micas in sedimentary rocks. Acta Geodynam. Geomater. 2:163.
Vane, C. H., Abbott, G. D., and Head, I. M. (2001). The effect of fungal decay (Agaricus bisporus) on wheat straw lignin using pyrolysis–GC–MS in the presence of tetramethylammonium hydroxide (TMAH). J. Anal. Appl. Pyrolysis 60, 69–78. doi: 10.1016/S0165-2370(00)00156-X
Wakeham, S. G., and Beier, J. A. (1991). Fatty acid and sterol biomarkers as indicators of particulate matter source and alteration processes in the Black Sea. Deep Sea Res. A Oceanogr. Res. Papers 38, S943–S968. doi: 10.1016/S0198-0149(10)80018-4
Williams, G. P. (1989). Sediment concentration versus water discharge during single hydrologic events in rivers. J. Hydrol. 111, 89–106. doi: 10.1016/0022-1694(89)90254-0
Wilson, C. G., Abban, B., Keefer, L. L., Wacha, K., Dermisis, D., Giannopoulos, C., et al. (2018). The intensively managed landscape critical zone observatory: a scientific testbed for understanding critical zone processes in agroecosystems. Vadose Zone J. 17, 1–21. doi: 10.2136/vzj2018.04.0088
Wilson, C. G., Papanicolaou, A. N. T., and Denn, K. D. (2012). Partitioning fine sediment loads in a headwater system with intensive agriculture. J. Soils Sediments 12, 966–981. doi: 10.1007/s11368-012-0504-2
Wohl, E., Bledsoe, B. P., Jacobson, R. B., Poff, N. L., Rathburn, S. L., Walters, D. M., et al. (2015). The natural sediment regime in rivers: broadening the foundation for ecosystem management. Bioscience 65, 358–371. doi: 10.1093/biosci/biv002
Xu, C., Yang, Z., Qian, W., Chen, S., Liu, X., Lin, W., et al. (2019). Runoff and soil erosion responses to rainfall and vegetation cover under various afforestation management regimes in subtropical montane forest. Land Degrad. Dev. 30, 1711–1724. doi: 10.1002/ldr.3377
Yan, Q. N., Iwasaki, T., Stumpf, A., Belmont, P., Parker, G., and Kumar, P. (2018). Hydrogeomorphological differentiation between floodplains and terraces. Earth Surf. Process. Landf. 43, 218–228. doi: 10.1002/esp.4234
Keywords: organic carbon, streams, erosion, storms, biomarkers
Citation: Kim J, Blair NE, Ward AS and Goff K (2020) Storm-Induced Dynamics of Particulate Organic Carbon in Clear Creek, Iowa: An Intensively Managed Landscape Critical Zone Observatory Story. Front. Water 2:578261. doi: 10.3389/frwa.2020.578261
Received: 30 June 2020; Accepted: 09 September 2020;
Published: 28 October 2020.
Edited by:
Tim Scheibe, Pacific Northwest National Laboratory (DOE), United StatesReviewed by:
Matthew Allen Ginder-Vogel, University of Wisconsin-Madison, United StatesHongyan Bao, Xiamen University, China
Copyright © 2020 Kim, Blair, Ward and Goff. This is an open-access article distributed under the terms of the Creative Commons Attribution License (CC BY). The use, distribution or reproduction in other forums is permitted, provided the original author(s) and the copyright owner(s) are credited and that the original publication in this journal is cited, in accordance with accepted academic practice. No use, distribution or reproduction is permitted which does not comply with these terms.
*Correspondence: Neal E. Blair, bi1ibGFpckBub3J0aHdlc3Rlcm4uZWR1