 Judson W. Harvey
 Noah M. Schmadel
- U.S. Geological Survey, Earth System Processes Division, Reston, VA, United States
River corridors supply a substantial proportion of the fresh water for societal and ecological needs. Individual functions of flowing (lotic) streams and rivers and ponded (lentic) waterbodies such as lakes and reservoirs are well-studied, but their collective functions are not as well understood. Here we bring together nationally consistent river corridor datasets to characterize the contributions of lotic and lentic features and to estimate changes over the past centuries. High-resolution datasets describing waterbodies across 10 million kilometers of the conterminous U.S. (CONUS) river network were classified by waterbody type and origin (historic vs. human-made or intensively managed), surface areal coverage, and degree of connectivity as estimated by a change in water residence timescale in river corridors. Four centuries of human disturbance drove large swings in river corridor makeup, with a transition toward more lotic systems caused by beaver extirpation and abandonment of waterwheel mill ponds by end of the nineteenth century. The twentieth century saw a vast expansion (49%) in river corridor areal coverage resulting from construction and management of small ponds and reservoirs for drinking water, hydropower, irrigation and livestock watering, and stormwater control. Water residence timescale in river corridors doubled or quadrupled over large areas, and more in specific locations, during the twentieth century as a result of the increased coverage of reservoirs and managed small ponds. Although reservoirs and lakes now dominate river corridor surface areas, we found that the growing number of small ponds impacts a greater proportion of network length through their influence on headwater streams where most water and chemical runoff enters the river corridor. We close with an agenda for integrated modeling of the physical, biogeochemical, and ecological drivers of river corridor functions, trajectories of change, and management opportunities.
Introduction
River corridors comprise a small portion of the landscape, on the order of a percent, yet they have outsized importance in supporting freshwater needs of humans and ecosystems (Sparks, 1995; Downing, 2010; Padowski and Jawitz, 2012; Woodward et al., 2012). They store and convey substantial quantities of clean water that support healthy and biodiverse aquatic ecosystems as well as serving societies' water needs for potable and industrial uses, irrigation and livestock, energy production, and more. The resilience of river corridors to changing flow, increasing chemical runoff, higher temperatures, and accelerating water extraction lies in part in their overall functions. River corridors exchange water back and forth between the main channel and the shallower and more slowly moving ponded areas and subsurface zones in the bed, banks, riparian areas, and floodplains (Harvey et al., 2019). The storage zones within river corridors are important in water retention and slow release that moderates effects of floods and drought (National Research Council, 2002). The prolonged interactions with shallow areas and sediments also tend to benefit ecological health and water quality, for example, promoting filtering of fine particulates and transformation of solutes and contaminants in hyporheic zones (Boano et al., 2014). Water purification may therefore be enhanced in river corridors; however, too much storage time may facilitate undesirable algal blooms and hypoxia (Beaulieu et al., 2013). Healthy river corridors have achieved a balance in water residence time, nutrient delivery, and water column depth, light, temperature, and benthic exchange that promote appropriate levels of metabolic activity that process carbon and cycle nutrients (Harvey and Gooseff, 2015; Bernhardt et al., 2018) in amounts that support productive food webs, a diverse fauna, and related ecological services for society.
Comparatively little attention has been paid to the role of lentic features in river corridors, for example, the small ponds, reservoirs, and lakes. Streams and rivers dominate the downstream conveyance of water and materials in river networks, but it is the lentic waterbodies in the river network that dominate water storage. The character of river corridors shift toward wider, deeper, and more slowly moving lentic waters where stream and river valleys abruptly widen and/or lessen in their slope (Wohl, 2020). Geologic features such as glacial moraines, debris flows, or downed logs, or biologically enhanced features such as beaver dams, are some of the constraints on lentic water occurrence in river corridors (Livers and Wohl, 2016). Constructed features such as earthen embankments, culverts, bridge under crossings, low-water fords, and dams of all sizes are increasingly important features associated with human disturbance of river corridors (Nilsson et al., 2005; Doyle et al., 2008; Bellmore et al., 2017). The role of lentic waterbodies in river corridors is hypothesized to vary on a continuum of hydrogeomorphic, climatic, ecological, and anthropogenic gradients according to Ward and Stanford (1995) serial discontinuity concept and related works by Swanson et al. (1998), Soranno et al. (1999), Dunne et al. (1998), Bencala (1993), Stanford and Ward (1993), and Wetzel (1990). However, testing of those ideas has been largely limited to site-specific studies.
Lentic waterbodies in river corridors cause seasonal shifts in the patterns and drivers of primary productivity and the processing rates and storage dynamics of nutrients and sediments (Baker et al., 2016; Schmadel et al., 2019). Their strong biogeochemical influences arise from their larger surface area, greater input of solar energy, longer water residence time, and weak vertical mixing that promotes stratification, with bed sediments that may be light limited or devoid of oxygen compared to streams and rivers. For example, natural lakes below mountain headwaters slow the velocity through river corridors and attenuate the downstream propagation of solutes and particulates during spring snowmelt (Arp et al., 2006). Greater summer autotrophic production in the lakes can promote pulses of dissolved organic matter downstream through the river corridor. Thus, lentic waters strongly influence organic carbon dynamics in river corridors (Goodman et al., 2011). Lentic waters can alter downstream constituent loads by retaining fine sediments (Vörösmarty et al., 2003), organic carbon (Mendonça et al., 2017; Anderson et al., 2020), and nutrients (Harrison et al., 2009; Maavara et al., 2015), while also episodically releasing those constituents to downstream river reaches after long periods of storage (Taguchi et al., 2020).
Human alterations of the river corridor over the past century added substantial areas of reservoirs and small ponds to serve needs for a ready water supply, hydropower production, farm use, as well as stormwater control to reduce nutrient runoff and sedimentation of waterways, and to lower flood risk (Doyle, 2012; Wohl, 2013; Bellmore et al., 2017; Foley et al., 2017; Leyk et al., 2020). The sharp increase in fertilizer and chemical use after World War II substantially increased chemical concentrations in U.S. rivers (Raymond et al., 2008). At the same time the incentives increased for farming intensity and urban expansion, including into less suitable and lower-relief riparian areas and floodplains. These changes were accompanied by widespread tiling of agricultural soils, ditching of roadsides, and paving over and piping of urban streams (National Research Council, 2002). The higher runoff peak flows that resulted mobilized pulses of sediment, nutrients, road salts, and trace metals and exacerbated bank and bed erosion and downstream transport of sediment and constituents through river corridors (Raymond et al., 2008). As the negative consequences became apparent in the later part of the twentieth century there was increasing construction of stormwater retention ponds intended to physically store and enhance the biogeochemical reactions that retain and transform the growing loads of constituents (Liu et al., 2014; Moore et al., 2017; Snodgrass et al., 2017; Schmadel et al., 2019). Construction of tens of thousands of small stormwater retention and recreational ponds in river corridors in the latter twentieth century added to the thousands of water supply and flood control reservoirs and farm irrigation and livestock ponds that had already been constructed earlier in the century.
A key question guiding our study was “how has loss of terrestrial water storage and replacement by construction of lentic waterbodies during the twentieth century affected river corridor functions?” We sought to address that question through analysis of nationally consistent data, for which impressive progress has been made in river ecology and limnology datasets. For example, the National Hydrography Dataset (NHDPlus Version 2.1 medium resolution dataset; U.S. Geological Survey, 2016) has geospatial, land cover, and hydrology data for catchments, rivers, and lentic waterbodies. More specifically for limnology, there is the comprehensive LAGOS dataset (Soranno et al., 2015) for 17 U.S. states with geospatial data on lakes larger than 0.04 km2 (50,000 lakes) including climate, atmospheric deposition, land cover, hydrology, geology, topography, and water quality data. To our knowledge, however, there has yet to be a continental-scale analysis of temporal changes in the character of lotic and lentic features of river corridors using high-resolution data that encompass lentic features as small as 0.0001 km2.
We analyzed trends in the size and network position of nearly two million lentic waterbodies along 10 million kilometers of river corridor across the conterminous U.S. (CONUS) using high-resolution data that include lentic waterbodies as small as 0.0001 km2. Our analysis assessed lotic and lentic contributions to river corridor surface area, hydraulic loading, and water residence timescale. Those metrics are fully defined in section River Corridor Metrics, and we quantified them at scales ranging from individual waterbodies to major river basins to the CONUS. We also assessed changes over time in river corridors based on a classification of lentic waterbodies either as existing historically or having been built or heavily managed during the past century, along with less certain estimations of changes in beaver pond area and mill ponds associated with waterwheel powered granaries (Figure 1).
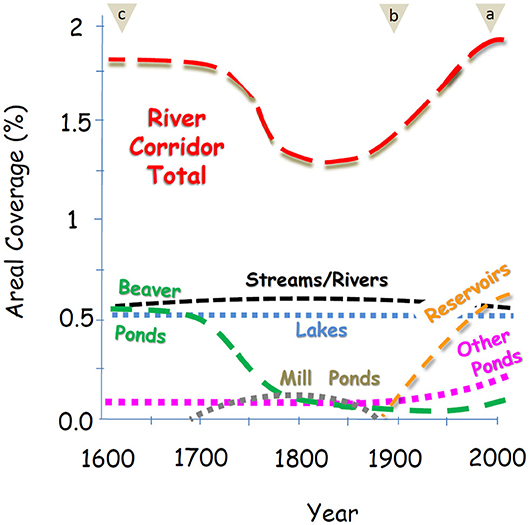
Figure 1. Four hundred years of river corridor change summarized as trends in surface areal coverage of lotic and lentic waterbodies. Key estimation periods are indicated by tan triangles showing present-day time period (circa 2000) analysis of high-resolution National Hydrography Dataset (NHD) and National Inventory of Dams (NID) data sources for streams and rivers, lakes, reservoirs, and small ponds (a), early twentieth century time period (circa 1900) estimates based on subtracting reservoirs and managed small ponds from present-day values (b), and pre-Colonial time period (circa 1600) estimates based on published estimates of the CONUS beaver population and pond area prior to the near extermination of beavers during the 1700s and 1800s (c) (see Supplementary Material). Trends between those periods are inferred based on less certain information from published accounts cited in Changing Balance of Lotic and Lentic Contributions section of the Discussion.
Our analysis of the changing physical template of river corridors helps explain how lotic and lentic elements of river corridors function together. Our discussion concentrates on hydrologic functions such as water storage. Ultimately the need is for integrated modeling of flow and storage, water use, biogeochemical processing, water purification, and ecological health of river corridors. Isolating where and why management has been effective in protecting water resources of some areas, but not in others, is the ultimate goal. Such integrated analyses will form the basis for improved management strategies that meet societal needs to protect ecological functions and values of river corridors.
Methods
River Corridor Data Sources and Analysis
We used publicly available high-resolution datasets for the CONUS to account for the effects of over 90,000 lakes, 34,000 reservoirs, 10 million kilometers of streams and rivers, and 1.7 million small ponds (Schmadel and Harvey, 2020). Lotic and lentic sizes, network positions, and distributions across the nation were quantified to reveal regional patterns in the contribution of lentic waterbody types to river corridor areal coverage, hydraulic load, and water residence timescale. Our estimation of river corridor metrics is the first we know of to incorporate the recently available high-resolution datasets on small pond and small streams with datasets on larger streams, rivers, lakes, and reservoirs in a CONUS-extent analysis (Downing, 2010; Berg et al., 2016).
For reasons of data quality and consistency we restricted our analysis to the time-averaged surface-water expressions of river corridors (e.g., perennial or intermittent stream and river channels and the intersecting ponds, reservoirs, and lakes). Therefore, this analysis disregards other important river corridor features such as riparian wetlands, floodplains, and subsurface hyporheic zones (Harvey and Gooseff, 2015). Although there has been progress in national-scale estimation of those other river corridor features (Dahl, 2011; Gomez-Velez et al., 2015; Scott et al., 2019), we judged that either key elements were lacking for a consistent CONUS-scale analysis or a change-over-time analysis. Also disregarded for this analysis are the upland ponds and wetlands that are geographically isolated from the river corridor (i.e., having no mapped surface water connection) although those watershed features are known to have important subsurface or ephemeral surface (i.e., episodic fill-and-spill) connections that drain to the river corridor (e.g., Cohen et al., 2015; Marton et al., 2015; Schmadel et al., 2019). For the future we envision analyses of terrestrial-aquatic linkages that will bring together all perennial and intermittent surface water features in the uplands and in the river corridor.
River Corridor Network Analysis and Waterbody Classification
We started by merging the medium-resolution NHD (NHDPlus Version 2.1; U.S. Geological Survey, 2016) with the newly available high-resolution NHD (U.S. Geological Survey, 2020) that includes many more small ponds and small streams. At the time of our study the high-resolution NHD was offered without all of the attributes of the medium-resolution NHD and thus we followed Schmadel et al.'s (2019) approach of extending the medium-resolution NHD to include the high-resolution information (see details in Supplementary Material). This “merged” approach permits use of the extensive existing NHDPlus attributes [e.g., land cover, etc., see Wieczorek et al. (2018)] and avoids what will be a major effort to develop high-resolution attributes and model inputs throughout the NHD. Eventually those technical challenges will be overcome, but until then, the merging of medium and high-resolution datasets can provide a robust, accurate, and useful approach for hydrologic analysis and water quality modeling.
Medium-resolution NHD provides surface areas for lentic waterbodies that are generally larger than 1 ha (0.01 km2), except for a limited number of small ponds (10% of medium-resolution lentic waterbodies) that have surface areas as small as 0.1 ha (0.001 km2). Paired with that information in NHD are mean annual volumetric discharge estimates, drainage areas for NHD medium-resolution catchments, and additional attributes across most of the CONUS (see Supplementary Material). Small ponds are commonly classified as having 1 ha (0.01 km2) or smaller surface areas (Downing et al., 2006; Holgerson and Raymond, 2016), which encompass over 90% of the newly mapped lentic waters available in high-resolution NHD down to a size approaching a typical beaver pond, 0.02 ha (0.0002 km2) (Karran et al., 2017). Combining information from high-resolution NHD increased the number of lentic waterbodies considered by a factor of 14 beyond those available in medium-resolution NHD. A small percentage of the medium-resolution waterbodies are duplicated in the high-resolution dataset and thus we eliminated duplicates, likely subject to small errors, from our final dataset before analysis. High-resolution NHD also includes additional coverage of finer resolution small streams beyond the main streams and rivers cataloged in medium-resolution NHD.
We separated lentic waters into four distinct classes: (i) lakes, (ii) reservoirs, (iii) historic small ponds that are naturally functioning and without intensive management during the past century, and (iv) managed small ponds that were constructed for water supply, farm use, or another purpose and that are managed accordingly (Figure 2). Lakes and historic small ponds are therefore interpreted as being long-lasting features that were present more than a century ago and are only marginally managed if at all for human use. Managed waterbodies such as reservoirs and managed small ponds are interpreted as having been created by excavation of impoundments or construction of dams or by other extensive alterations or management of what may have historically been a natural waterbody or that may be altogether a newly created ponded water feature.
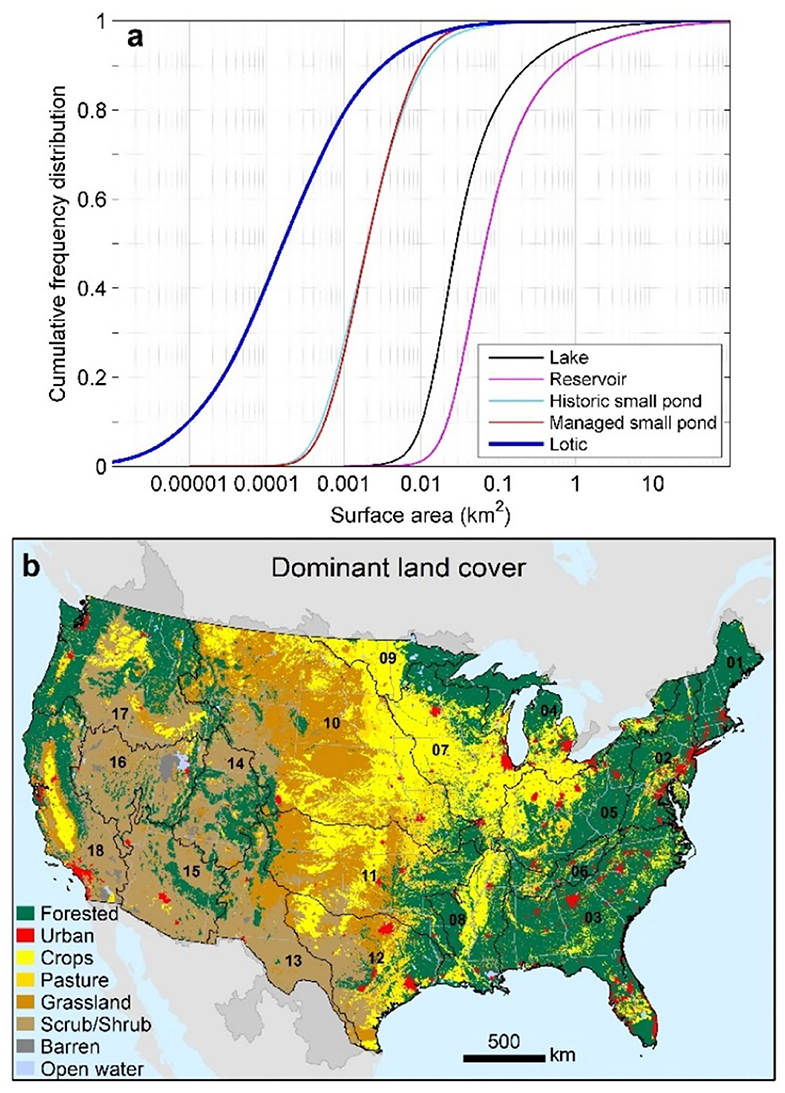
Figure 2. Size distribution of river corridor features for over 90,000 lakes, 34,000 reservoirs, 1.7 million small ponds with over 800,000 managed, and 10 million kilometers of streams and rivers in the CONUS (a) and major land use and land cover in the CONUS and within HUC-2 river basins designated by black numbers and associated basin boundaries (b).
Lakes were identified in this analysis as any medium-resolution lentic waterbody in NHD that was not a reservoir. The 34,000 reservoirs were identified as those waterbodies defined by the National Inventory of Dams (NID; U.S. Army Corps of Engineers, 2020) that were previously included on the medium-resolution NHD (Wieczorek et al., 2018). We identified small managed ponds as the additional 13,000 small impoundments in NID that were below a size of 0.01 km2; those small ponds also were included on the medium-resolution NHD network by Wieczorek et al. (2018) and they also appear in high-resolution NHD, and so we were careful to eliminate duplicates. However, the vast majority of the 1.7 million small ponds in the high-resolution dataset are not cataloged as dammed impoundments in NHD nor are they duplicated in medium-resolution NHD. We classified those waterbodies as either managed small ponds or historic small ponds depending on local indicators of human disturbance (e.g., land cover classification) as explained in the next paragraph.
Small ponds without cataloged dams were classified as managed if located in a NHD catchment where the land cover indicated intensive human management, e.g., where crops, pasture, urban, and grassland had a sum >60% as specified by the 2011 National Land Cover Dataset (NLCD; Homer et al., 2015) which has been linked to medium-resolution NHD (Wieczorek et al., 2018). A justification for the 60% land use threshold is based on a previous analysis in the northeastern U. S. indicating that catchments with 60% or more agriculture or urban cover contain substantially higher densities of small ponds, compared with similar physiographic areas that were not intensively managed (Schmadel et al., 2019). Grasslands are widely used for grazing with many constructed small ponds or ponds that are modified to support livestock (Homer et al., 2015). Therefore, small ponds in catchments covered by 60% or more grassland were classified as managed. Scrub/shrub lands are also used for grazing, but grazing pressure is usually far less than in grasslands. We therefore made a conservative decision not to classify small ponds in scrub/shrublands as managed. All high-resolution small ponds not classified as managed using the above described land cover criteria or without cataloged dams or impoundments were classified as historic small ponds.
We performed many spot checks to ensure accuracy of classification of NHD streams, rivers, and lentic waterbodies and to minimize overlap errors in the combined medium-and-high-resolution dataset. We did not compare to independent data other than NID as that would be an enormous effort for 1.7 million small ponds but conclude through hundreds of spot checks that potential overlap errors occur in a very small proportion (on the order of a few percent or less) of reaches. We do not consider seasonal persistence of waterbodies although it is possible that some waterbodies mapped in NHD only are present for part of the year.
River Corridor Metrics
We quantify the influence of each class of lentic and lotic waters within the river corridor by estimating local and cumulative metrics of areal coverage (or percent cover), hydraulic load, water residence timescale (inverse hydraulic load), and also estimated changes due to management of lentic waters over the past century.
Areal coverage, D [%], is estimated as the percent cover of the upstream accumulated drainage area by the river corridor or by a specified class of lotic or lentic component of the river corridor:
where i is the reach index; m is a specific waterbody type, e.g., lake, reservoir, historic or managed small pond, stream, or combination thereof; N is the total number of m upstream of reach i; j = 1, …, N; AS [area, L2] is the wetted surface area of specific waterbody m; and AD [area, L2] is the drainage area at reach i. This metric provides a general assessment of how river corridor areal coverage varies across the CONUS as well as densities of the component waterbodies.
A standard metric for estimating water flux in lotic and lentic waterbodies is the hydraulic load. Hydraulic load, or HL [L T−1], is the volumetric flux of water per unit surface area of a given waterbody. The inverse of hydraulic load is the residence timescale, or R [T L−1], which is the time required to flush a unit volume of water (Brett et al., 2012):
where Q [L3 T−1] is the volumetric discharge which for our purposes is the annual average discharge exiting the waterbody as provided by NHD. Both medium- and high-resolution NHD products provide volumetric discharges that were estimated using an enhanced unit runoff method involving estimation of unit runoff for each catchment and then accumulation downstream and comparison with measured average flows at gages. Differences at each gage were applied to adjust the upstream unit runoff and provide long-term (1971–2000) estimates of streamflow for all reaches (Moore et al., 2019). The wetted surface areas of streams and rivers were approximated from an estimate of the velocity and width using the equations of Jobson (1996) and Leopold and Maddock (1953). More precise slopes of river reaches used in the velocity estimates were obtained from enhanced NHD attributes (Brakebill et al., 2018).
To understand effects of waterbody types, sizes, and their distributions through river basins, we quantified a cumulative residence timescale, Rw [T L−1], that was weighted by the surface areas of the contributing lentic and lotic waterbodies:
where the summation in Equation (3) estimates the weighted residence timescale, Rw, for all m upstream waterbodies of a given type, e.g., lakes, reservoirs, or for all the river corridor as a whole, as weighted by their surface areas as shown in Equation (4). As for any weighting factor the sum of the surface-area weights equals one, i.e., . Newly accounted for high-resolution small ponds and streams were aggregated per medium-resolution NHD catchment following Equation (3) prior to accumulating downstream, which provides an accurate approach to quantify and accumulate high-resolution information while retaining a linkage to the medium-resolution framework.
The cumulative water residence timescale is useful for estimating how the distribution of various waterbody types in the river basin, or how a change in waterbodies over time, affects the average water residence timescale. When computed for all upstream lotic and lentic waterbodies, equation [3] computes the cumulative river corridor water residence timescale. The cumulative hydraulic load is estimated as the inverse of the cumulative water residence timescale.
Present-Day and Historic Analysis
We quantified changes over time in river corridor surface water areal densities, water residence timescales, and hydraulic loads by comparing present-day conditions to estimated conditions approximately a century ago. The present-day river corridor is defined as containing the existing database of lakes, reservoirs, historic small ponds, managed small ponds, and streams and rivers. For our purposes the early twentieth century river corridor is defined as containing existing lakes, historic small ponds, and present-day streams and rivers. Also included are the estimated stream and river reaches that were displaced by construction of reservoirs or managed small ponds. The surface areas of displaced stream and river reaches were approximated using the flowline length provided by NHD that intersects the corresponding lentic waterbody, an estimate of stream velocity from Jobson (1996) and a width estimate from Leopold and Maddock (1953) and the present-day discharge estimate. Both present-day and early twentieth century river corridor estimates assume the same average annual discharge, which is uncertain but is a practical assumption for these purposes. Also, the early twentieth century river corridor estimates assume that the construction of reservoirs and small ponds always replaced a stream or river, which may overestimate the increase in river corridor surface areas in cases where lakes or historic small ponds were expanded by dam construction to create an even larger reservoir (Hayes et al., 2017). To our knowledge there are no comprehensive pre-1900 data to estimate the areas of historic lakes and ponds that were expanded by reservoir construction and thus we assume that only streams and rivers were replaced.
The change in areal coverage from early twentieth century to present, ΔD, and change in residence timescale, ΔRw, were estimated as:
where Dpres and Dhis [%] are the areal coverages of present-day and historic early twentieth century river corridors (i.e., both lentic and lotic waters), respectively; and Rwpres and Rwhis [T L−1] are the surface-area-weighted residence timescales of present-day and historic river corridors, respectively.
Results
River Corridor Areal Coverage
The total areal coverage of river corridors is 1.8% across the CONUS of which more than two-thirds (~69%) are lentic waterbodies including lakes, reservoirs, and small ponds (Table 1). River corridor areal coverage varies from east to west with higher coverage in the more humid areas (2.2%) generally to the east of the 100th meridian and lower (1.2%) in the drier western basins (Figure 3). The river corridor areal coverage is highest (~4%) in historically glaciated basins such as New England, Lower Mississippi, and Souris-Red-Rainy basins and lowest in the arid western interior in the Rio Grande and Upper and Lower Colorado basins (<1%) (Figure 3, Table 1).
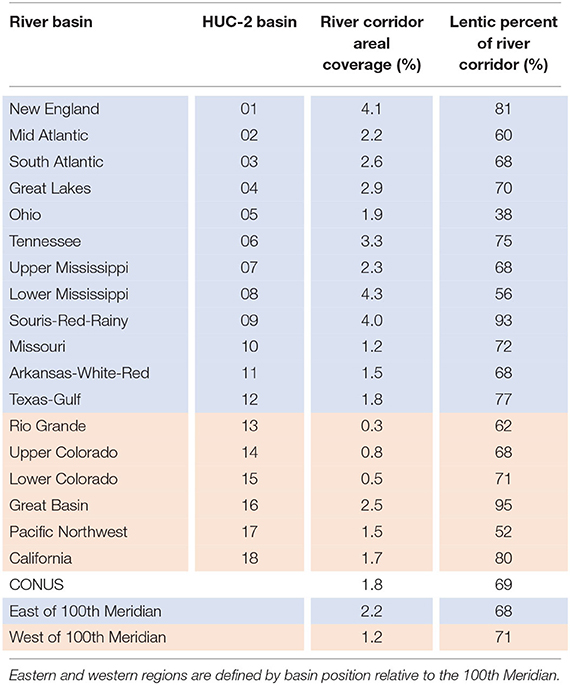
Table 1. Surface water areal coverage of river corridor and lentic waterbody percentage summarized as total values for CONUS, eastern and western regions, and major HUC-2 river basins (delineations shown in Figure 2).
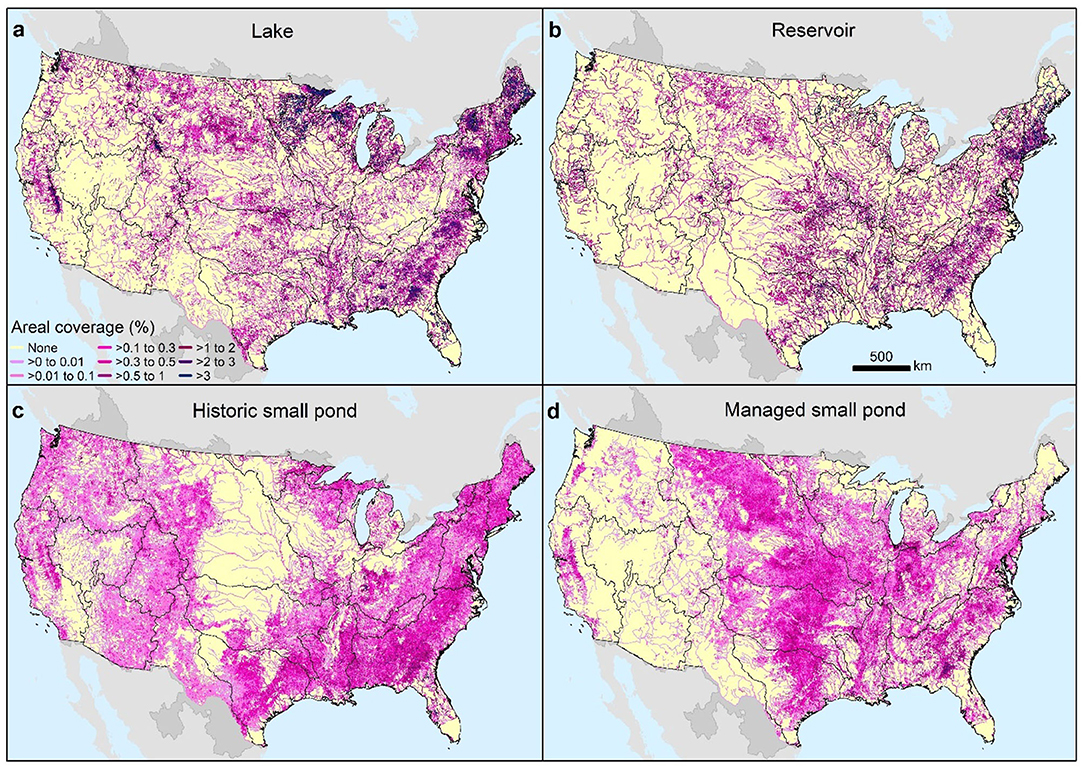
Figure 3. Mapped distribution of surface water areal coverage for lakes (a), reservoirs (b), historic small ponds (c), and managed small ponds (d). The lentic percentage of total river corridor area varies little across the CONUS with reservoirs accounting for most of the lentic surface area (48%) followed by lakes (40%) and small ponds (12% total small ponds with 8% historic small ponds and 4% managed small ponds (Table 1). Black boundaries designate the eighteen 2-digit hydrologic unit code (HUC-2) major river basins of the CONUS.
Streams and rivers account for 31% of the river corridor surface area in the CONUS (areal coverage of 0.6%) with nearly twice the areal coverage in the east (0.7%) compared to the west (0.3%) (Supplementary Table 1). In contrast, lentic waterbodies account for 69% of the river corridor surface area (areal coverage of 1.3%) with generally higher coverages of lakes and reservoirs in the humid eastern basins (0.5 AND 0.7% for lakes and reservoirs, respectively) compared to the more arid western basins (0.4% for both lakes and reservoirs) (Supplementary Table 1). Small ponds are distributed more unevenly across the CONUS, with areal coverages in the east (0.2%) that are approximately three times greater than in the west (0.06%) (Supplementary Table 1). Managed small ponds are even more unevenly distributed, with areal coverages that are approximately eight times more common in the east compared to the west (0.08 vs. 0.01%, respectively) (Supplementary Table 1).
Lake areal coverage is greatest in historically glaciated New England, Great Lakes, and the Souris-Red-Rainy basins (~2%), and also in humid eastern areas of the Upper and Lower Mississippi and Tennessee basins where lake coverage generally exceeds 1%, and in isolated areas of the west such as the Great Basin (Supplementary Table 1). Reservoir areal coverage is highest (>1.7%) in coastal New England, eastern Pennsylvania, eastern Texas, Oklahoma, and Kansas, and in the South Atlantic and Tennessee basins (Figure 3, Supplementary Table 1). Small pond areal coverages are everywhere less than lakes and reservoirs but may be similar to reservoirs or higher in certain areas of New England, Great Lakes, South Atlantic, and Lower Mississippi basins, as well as in other areas of the Upper Midwest and eastern Texas (Figure 3, Supplementary Table 1).
River Corridor Hydraulic Loads and Water Residence Timescales
The median hydraulic load for streams and rivers is 1 m d−1 and varies between 0.1 and 100 m d−1 across the CONUS (Figure 4b). The median hydraulic load for small ponds (0.08 m d−1) is an order of magnitude lower than in streams and rivers, and it varies between 0.001 and 60 m d−1. Lakes and reservoirs have the lowest median hydraulic load (0.03 m d−1) that is approximately a third of small ponds (Supplementary Table 2) with a range between 0.001 and 10 m d−1 across the CONUS (Figure 4b).
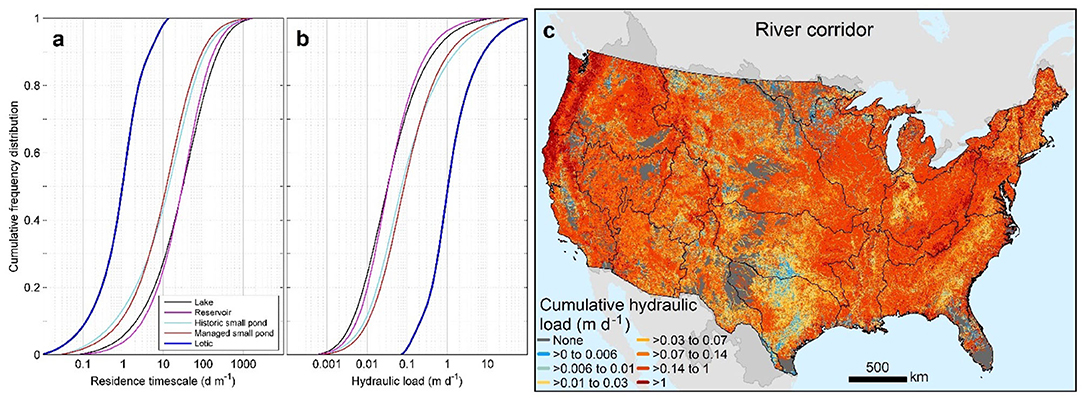
Figure 4. Frequency distributions of residence timescale (a) and hydraulic load (b) of individual waterbodies and cumulative hydraulic load across the CONUS (c). The cumulative hydraulic load is the inverse of the cumulative area-weighted residence timescale across the CONUS shown in Figure 5d. Black boundaries designate HUC-2 river basins.
The median water residence timescale is on the order of 1 d m−1 for streams and rivers, 13 d m−1 for small ponds, and 30 d m−1 for lakes and reservoirs across the CONUS (Figure 4a, Table 2). Water residence timescale varies between 0.01 and 10 d m−1 for streams and rivers, 0.01 to 1,000 d m−1 for small ponds, and 0.1 to 1,000 d m−1 for lakes and reservoirs (Figure 4a). However, lakes and reservoirs in the west generally have shorter residence timescales, indicating faster turnover in lentic waterbodies in the west compared to the east. Lakes and reservoirs together have a median residence timescale of 21 d m−1 in the west compared with 33 d m−1 in the east (Table 2). However, the median residence timescale for managed small ponds in the west is double that of the east (23 vs. 12 d m−1, respectively) due to lower average runoff in the west. Our estimates of water residence timescale for individual lakes and reservoirs are similar to field-based estimates, ranging from 0.1 to 1,000 d m−1 (Brett et al., 2012). Small ponds have shorter water residence timescales compared with lakes and reservoirs, which agrees with the field-based estimates of Fairchild and Velinsky (2006) who observed a maximum residence timescale of 800 d m−1 for small ponds during the low-flow season.
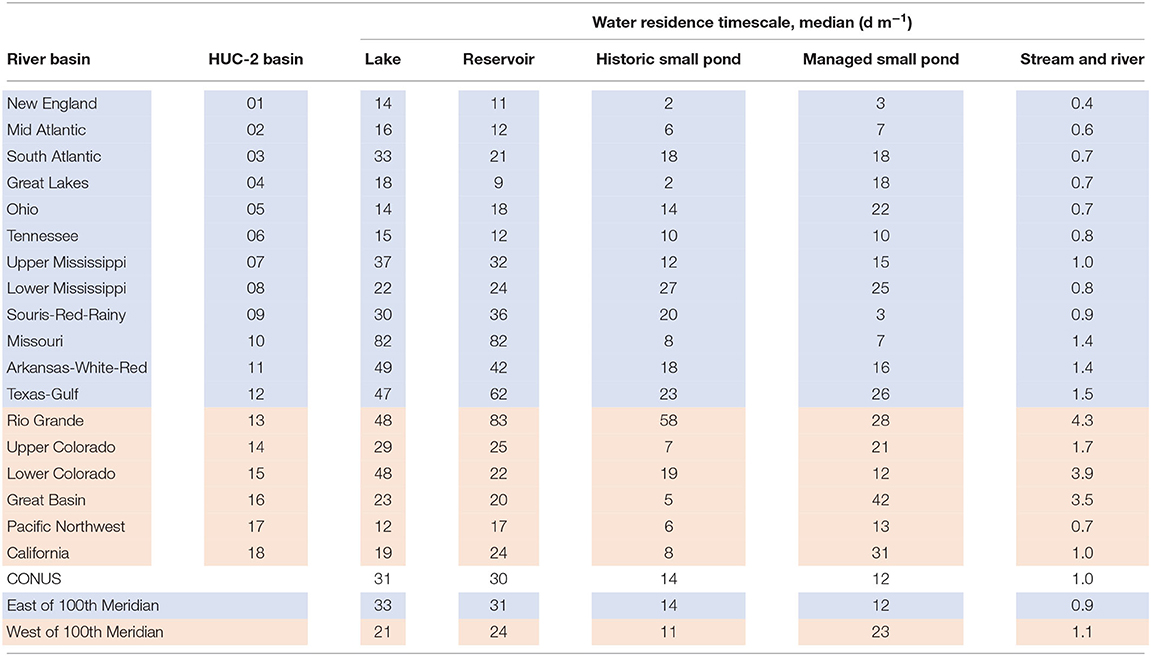
Table 2. Summary table of the median water residence timescale for individual lotic and lentic features of the CONUS, eastern and western regions, and major river basins.
When compared between major river basins, lotic and lentic residence timescales are highly variable (Supplementary Figure 1). Western streams and rivers have a longer median residence timescale compared to the east (1.1 vs. 0.9 d m−1, respectively). The median stream and river residence timescales range from a low of 0.4 d m−1 in New England to highs ranging from 3.5 to 4.3 d m−1 in the arid Rio Grande, Great Basin, and Lower Colorado, which reflects the lower average runoff in those more arid basins. Median lake and reservoir timescales range from a low of 9 d m−1 in the Great Lakes to highs of 82 and 83 d m−1 in the Missouri and Rio Grande basins, respectively; median small pond timescales range from a low of 2 d m−1 in New England to a high of 58 d m−1 in the Rio Grande basin (Table 2).
Not surprisingly, cumulative hydraulic load across much of the CONUS river corridor is dominated by streams and rivers (Figure 4c), where hydraulic loads on the order of 1 m d−1 indicate rapid hydraulic turnover and downstream flow through lotic elements of the river corridor. However, there are also vast areas where the cumulative hydraulic load is orders of magnitude lower, 0.006 m d−1 or less (most evident in the Great Plains, Upper Mississippi, and South Atlantic basins), indicating areas where lentic waterbodies have a much stronger influence on flow.
Lentic waterbodies impart their strongest influence on cumulative water residence timescales in areas where the lentic contribution to river corridor areal coverage is highest (Table 1, Figure 5d compared to Figures 5a–c). High lentic influence is apparent in the southern Great Plains and Upper Mississippi basins and South Atlantic basin where cumulative residence timescales are as high as 365 d m−1, which is two orders-of-magnitude slower than lotic dominated areas with values on the order of 1 d m−1 (Figure 5d). Small ponds and reservoirs dominate water residence timescales in the Great Plains basins (Texas-Gulf, Arkansas-White-Red, and Missouri basins) and in the Upper Colorado and Rio Grande basins while lakes dominate in the Upper Mississippi and New England basins. In contrast, all types of lentic waterbodies are important in lengthening water residence timescales in the South Atlantic basin.
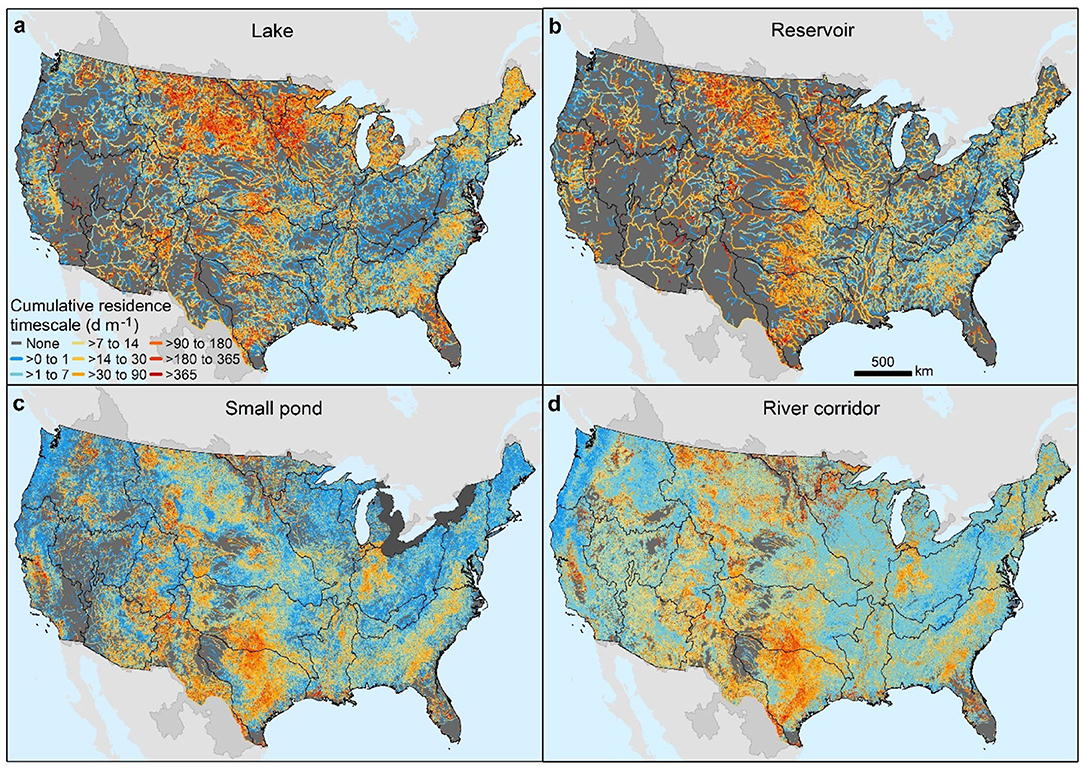
Figure 5. Cumulative area-weighted water residence timescale for lakes (a), reservoirs (b), small ponds (c), and the river corridor (d). Black boundaries designate HUC-2 river basins.
Dramatic Reshaping of River Corridors During the Twentieth Century
The areal densities of lentic and lotic waters in river corridors changed substantially during the past century as a result of human disturbance. River corridors were altered much earlier, of course, and we summarize some of the important changes associated with European exploration, fur trading, and early settlement (pre 1600) and Colonial-era expansion (circa 1700) in Figure 1 and in Discussion section Changing Balance of Lotic and Lentic Contributions. Our detailed quantitative analysis focuses on the twentieth century because the changes brought about by dam building and impoundments on CONUS river corridors (mostly after 1900) are well-constrained by our dataset. Expansion of waterbodies behind those dams caused an estimated 49% increase in river corridor surface area over the past century (Table 3). The largest total increases were in the western U.S. and Great Plains basins, led by a 119% increase in the river corridor surface area of the Lower Colorado basin, a 111% increase in the Arkansas-White-Red basin, and 99 and 96% increases in the Missouri and Texas-Gulf basins. Other areas experienced comparatively smaller increases in river corridor surface area over the past century, including the Great Basin (16%), Rio Grande and Lower Mississippi basins (35 and 13%), and Great Lakes basin (31%).
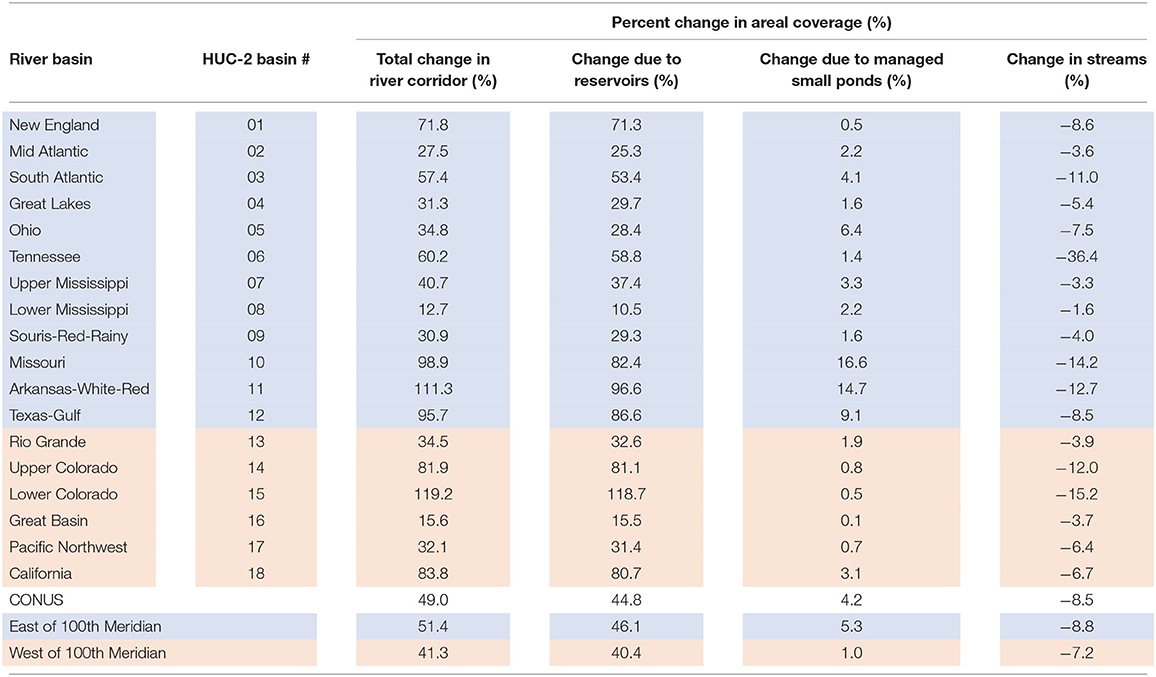
Table 3. Approximate change since early twentieth century in river corridor surface water areal coverage for the CONUS, eastern and western regions, and major river basins.
Reservoirs were the greatest contributor to the expansion in river corridor surface area over the past century, contributing on average 91% of the change across the CONUS basins. For example, almost 100% of the increase in the river corridor surface area of the Upper Colorado basin was accounted for by reservoirs. In contrast, small ponds contributed much less to expanded surface areas, ranging from 0.1 to 0.5% (Great Basin and New England basins) to 15 and 17% (Arkansas-White-Red and Missouri basins) (Table 3). In the Great Plains basins reservoirs dominated change but accounted for a somewhat smaller percentage of the increase (82 to 87%) with managed small ponds accounting for the rest, e.g., managed small ponds contributed 15 and 17% to increases in river corridor surface area in the Arkansas-White-Red and Missouri basins, respectively.
Increases in river corridor surface areas caused by construction of reservoirs and small ponds were partially offset by the loss of the stream and rivers that were present before construction and that were replaced by the lentic waterbodies. We estimate that ~8% of the total stream and river surface area in 1900 was eliminated by construction of small ponds and reservoirs during the twentieth century (Table 3). The estimated loss of stream and river surface area assumes that constructed waterbodies only replaced rivers and streams, rather than expanding on historic lakes and ponds, however, no comprehensive datasets are available to identify or estimate those replaced lentic waterbodies.
Together, reservoirs and small managed ponds substantially increased the cumulative water residence timescale of CONUS river corridors (Figure 6). Increases in cumulative residence timescale of a factor of five or more occurred throughout the Great Plains, Midwest, New England, Mid-Atlantic, and South Atlantic basins and in isolated areas in the west. Reservoirs dominated those increases in southern New England and in certain areas of the South Atlantic and Great Plains basins (Figures 6a,b). Small ponds dominated water residence timescale increases in the western Great Plain grasslands, and in the Midwest, and Mid-Atlantic, Pacific Northwest, and California agricultural areas, and in urbanizing basins across the CONUS (Figures 6a,c).
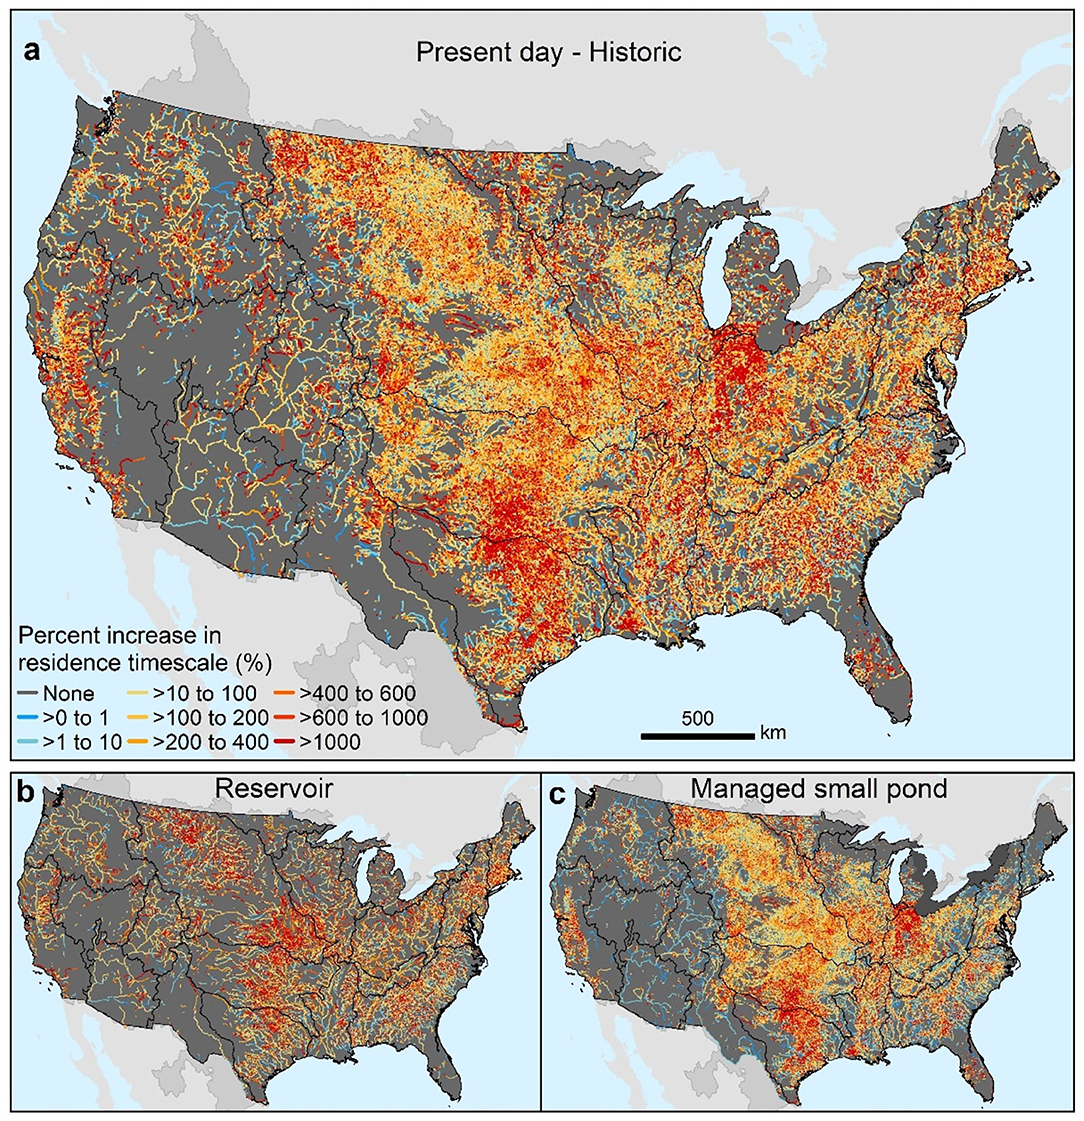
Figure 6. Estimated change, in percent, in river corridor water residence timescale during the twentieth century (a) and estimated twentieth century change in reservoir and managed small pond water residence timescale associated with construction of reservoirs and management of small ponds (b,c). Black boundaries designate HUC-2 river basins.
Discussion
River corridor studies typically overlook the lentic waterbodies that fragment river networks (Baker et al., 2016; Gardner et al., 2019). In fact watershed hydrologists often ignore the lake, reservoir, and small pond effects; transit times are assumed to be short through a stream and river network only (Kirchner et al., 2001; Lindgren and Destouni, 2004; Lindgren et al., 2004; Knapp et al., 2019). As a result, hydrologic models now being built for larger drainage basins often assume that stream water exits the catchment in 10 days or less (Maxwell et al., 2016). Actual transit times through watersheds are likely much slower because of storage in lentic waterbodies (Schmadel et al., 2018) but also because of storage caused by river exchange with hyporheic zones (Gomez-Velez et al., 2015) and floodplains (Scott et al., 2019).
Our study found that the river corridor's surface area in the CONUS grew by 49% during the twentieth century as a result of the construction of reservoirs and managed small ponds. At present the total of lakes, reservoirs, and historic and managed small ponds comprise two thirds of the river corridor's surface area. The past century saw a transition toward more lentic waterbodies in CONUS river corridors. We estimated a 45% and 4% increase in areal coverage of river corridors brought about by a century of construction of reservoirs and small ponds, respectively. The changes in water residence times caused by the addition of reservoirs and small ponds was even more substantial, doubling or quadrupling the water residence timescale over large areas of the CONUS with local increases in water residence time scale of more than an order of magnitude (Figure 6).
Overall, present-day lentic waterbodies on the river corridor lengthen the water transit times through watersheds by months or even years rather compared with the 10 days or less often assumed by many CONUS hydrologic models. In addition to lengthening transit times, the lentic waters moderate downstream flow variability in river corridors by lowering the flow peaks exacerbated by impervious surfaces and piped and tiled drainage (Graf, 2006; Poff et al., 2006, 2007; Eng et al., 2013). Lentic waters in river corridors often elevate and shorten the frequency of low flows, although low-flow responses are variable and can depend on hydroclimatic condition and management style of dams (Eng et al., 2013).
Changing Balance of Lotic and Lentic Contributions
How the lentic functions of river corridors evolved with human activities is the key question addressed by our paper. A rapid and large scale transition in river corridors began about four centuries ago in the eastern U.S. with fur trapping that eradicated beaver colonies and their ponds (Naiman et al., 1988). Using beaver population and beaver pond area numbers from the published literature (Naiman et al., 1988; Whitfield et al., 2015; Goldfarb, 2018) we estimate a total areal coverage of the pre-Colonial river corridor similar to the present day (1.72 vs. 1.85% for present day) but with very different makeup. Approximately a third of the pre-Colonial river corridor surface area was comprised of beaver ponds (see Supplementary Material) compared to the present-day river corridor where reservoirs now comprise 33% of the total river corridor surface area and beaver ponds are a minor contributor. Human activities caused the river corridor to shrink dramatically (26%) in surface area between 1700 and 1900 because of beaver extirpation, followed by dam building that stabilized the surface area and then caused a dramatic increase in river corridor surface area after 1900 (Figure 1). Below we evaluate those changes in more detail.
The era of European exploration and early settlement of North America gave way toward larger scale Colonial era settlements that expanded along river corridors (Fang and Jawitz, 2019). Many thousands of low-head dams were constructed every 5 km or so on streams of the eastern U.S. to power grain mills that operated for decades (Copenheaver et al., 2007). Most of the mill dams were abandoned by the latter nineteenth century, but the sediments captured by the mill ponds that had been mobilized by deforestation on the surrounding uplands remained. After dam breakup the legacy sediments were downcut by the streams, transforming river corridors that previously had exhibited a hybrid lotic-lentic character (e.g., wide, anabranching, slow-flowing streams and beaver ponds) into less sinuous and faster-flowing streams flowing through single thread channels between tall cutbanks (Marris, 2008; Merritts et al., 2013).
The nineteenth and early twentieth centuries saw increased ditching and drag lining to drain ponds and wetlands and to increase drainage and flood conveyance away from the expanding agricultural lands and settled areas. Likewise, a century of logging in many forested watersheds changed the river corridors from spatially heterogeneous, multichannel systems closely connected to their floodplains into single-thread channels (Wohl, 2020) that adjusted to higher peak runoff by eroding bed and banks and incising until becoming disconnected from floodplains. Increasingly their morphologies became pipe-like, which further exacerbated flooding and translated erosion to downstream areas (Merritts et al., 2013).
On the rivers there was extensive dam construction in the early to mid-twentieth century to expand water supply, control floods, improve navigation, and increase recreation for growing population centers (Lehner et al., 2011; U.S. Army Corps of Engineers, 2020). The era of big dams and resulting flow discontinuities wreaked havoc on biological communities, threatening native river organism dispersal and biodiversity worldwide (Collier et al., 1996; Magilligan and Nislow, 2005; Graf, 2006; Poff et al., 2007, 2015). Later the negative consequences and diminished values of river corridors drove more environmentally conscious engineering in the lentic components of river corridors, e.g., tens of thousands of lentic stormwater retention features were constructed on small streams to moderate and reduce peak flows, sustain low flows, and retain sediment and contaminants in order to lengthen storage times and improve downstream water quality (Villarreal et al., 2004; Liu et al., 2014). Most recently a new era of dam removal has begun (Bellmore et al., 2017; Ho et al., 2017).
To summarize, by the early twentieth century human activities had decreased the surface areas of the CONUS river corridor to a low point. The pre-Colonial river corridor surface area had been on the order of 26% larger because of widespread beaver activity, and dam building after 1900 expanded the river corridor surface area by ~49%. The pre-Colonial and present-day river corridor may have been similar in size compared with the early twentieth century, however, it differed substantially in that beaver ponds comprised on the order of a third (31%) of the pre-Colonial river corridor surface area, whereas reservoirs are the dominant waterbody type contributing to present-day river corridors (33%).
Lotic and Lentic Drivers of Water Quality in River Corridors
The ubiquitous imprint of lakes, reservoirs, and small ponds often has been ignored in watershed biogeochemical modeling [but see Harrison et al. (2009) and Seitzinger et al. (2005)]. Recent modeling studies suggest a critical role for ponded waters in structuring nutrient cycles and aquatic health through river networks (Schmadel et al., 2019; Anderson et al., 2020). Lentic waters affect primary productivity, storage and release of nutrients, and also tendencies for out-of-balance ecological behaviors such as hypoxia and harmful algal blooms (HABs). Our analysis suggests a particularly important role for managed small ponds in modifying aquatic biogeochemistry. This is because of the sheer abundance of small ponds and because of their location in headwaters that are the locus of water and chemical inflows to river corridors through runoff and groundwater inflow (Alexander et al., 2007). Small ponds are therefore the early receptors and processors of watershed outputs of constituents and may dominate nutrient reactivity and sediment dynamics in some regions (Schmadel et al., 2019). Even though reservoirs dominated the growth in river corridor surface area in the twentieth century, those reservoirs are few in number (~34,000) compared to small ponds (1.7 million) that impact approximately (82,000 km that are replaced by reservoirs compared to 81,000 km that are replaced by managed small ponds). Reservoir effects are concentrated farther downstream on relatively few larger streams and mid-size rivers compared with small ponds where effects are distributed widely across headwaters where the principal inputs of water and chemicals enter the river corridor (Figure 4).
Continental-scale analyses of lotic vs. lentic contributions to water quality and ecological health of river corridors are in a nascent stage (Baker et al., 2016; Bernhardt et al., 2018). Previous authors have discussed how to potentially integrate all the important water-quality and biological processes that influence function in several key metrics. Hydrologic connectivity is an example (Alexander et al., 2015; Harvey and Gooseff, 2015; Covino, 2017; Ward and Packman, 2019) but rarely has it been actually quantified for river corridors. Harvey et al. (2019) quantified turbulent exchange, hyporheic, and floodplain contributions to hydrologic connectivity, however lentic waters were not included. Lake and reservoir influences on water quality of river corridors were modeled using connectivity metrics such as lentic waterbody aerial coverage (Schmadel et al., 2018, 2019), lentic waterbody perimeter (Winslow et al., 2014), individual waterbody shape (Cohen et al., 2015), and lentic waterbody centeredness on the network (Schmadel et al., 2018). Schmadel et al. (2018) used the lentic connectivity metrics to model outcomes for nitrogen transport and reaction through the northeastern U.S. Those authors evaluated the significance of the lentic connectivity metrics on nitrogen budgets and also compared outcomes of their northeastern river corridor model with the same corridor modeled with replacement of lentic water bodies by appropriately sized streams or rivers. The areal coverage of lentic waterbodies, their size and shape characteristics (perimeter), and centeredness on the river network were all indicated as being important in affecting biogeochemical and energy exchanges with the terrestrial landscape and with the lotic river network. Our paper lays the groundwork for quantifying effects of hydrologic alteration of lentic waterbodies everywhere in the CONUS, using a high-resolution network that is ready for integrated modeling of flow, water quality, and aquatic health. The challenge grows with new understanding that the constructed lentic waterbodies are more vulnerable to harmful and undesirable outcomes (e.g., hypoxia and cyanobacteria blooms) than their lotic countertypes, which has long-term implications for river corridor health (Bernhardt, 2013; Finlay et al., 2013).
Summary and Needs for the Future
Our research builds on the pioneering work of Downing et al. (2006); Downing et al., 2010 who set a framework for large-scale quantification of river corridor attributes and functions. We used emerging data sources to improve the resolution of surface water areas and integrated those with an analysis of water residence timescales, both individually and cumulatively for lotic and lentic components of U.S. river corridors. Our change-over-time analysis observed the effects of humans driving large swings in physical character of river corridors. Several 100 years ago a rebound toward lotic features in small streams during the twentieth century caused by enhanced runoff peaks from tiled farm fields, roadside ditches, and urban impervious areas. The mid twentieth century saw the peak of the era of big dam building on mid-size and larger rivers that expanded water supply and hydropower production and construction of small ponds that expanded livestock grazing into the drier western grasslands. During the latter twentieth century, environmentally conscious engineering and regulatory measures instigated massive investments in building small ponds for stormwater retention in urban and agricultural areas.
Our analysis demonstrated a net result of human disturbances in river corridors during the twentieth century – a 49% total increase in areal coverage of CONUS river corridors and a doubling to quadrupling in water residence timescales, or more, brought about by construction of reservoirs and managed small ponds. Lakes and reservoirs now dominate the river corridor surface area. However, small ponds occupy a greater number of stream kilometers compared with reservoirs (175,000 km in total for small ponds compared to 82,000 km for reservoirs). The surface area of small ponds is currently growing at a faster rate compared with reservoirs, and their collective influence on water residence time dominates the lentic waterbody influence in the headwaters where most water and chemical inputs occur.
Our estimates of hydraulic load (and its inverse, water residence timescale) for the CONUS are a first step toward improved assessment of physical controls on biogeochemistry and water quality of the river corridor. High-resolution small pond surface areas, alone, can vastly improve greenhouse gas evasion estimates (Holgerson and Raymond, 2016). Improved accuracy of flow and depth estimation through the much longer high-resolution river corridor will permit, for the first time, the accurate quantification of water residence time (and not just timescale) as well as travel times – estimation of contaminant fate and transport from river spills and non-point sources can be vastly improved with more accurate travel times. Also, better estimated river, lake, reservoir and small pond depths will themselves aid in quantifying the water volume to sediment area ratio in millions of waterbodies – a key metric needed to upgrade the physical basis for biogeochemical reaction modeling and its cumulative downstream effects on water quality. There is also need for expanding the analysis of hydrologic exchange fluxes (HEFs) beyond rivers and their sediment beds and banks (e.g., Gomez-Velez et al., 2015) to include lakes, reservoirs, and small ponds, as well as into riparian wetlands and floodplains. Accurate quantification of both “connectivity” and “reactivity” in the most highly biogeochemically active sub-environments of rivers corridors will determine where and when (and what the management opportunities are) for specific reactions such as denitrification (e.g., Bernhardt et al., 2018; Harvey et al., 2019) across the lotic and lentic features of river corridors. Furthermore, most CONUS-scale models of water quality are static models for average annual flow conditions, which will not be sufficient in the future as there is substantial need for representing flow dynamics (Walker et al., 2020), including reservoir operations and seasonally changing runoff and human water use.
There is increasing opportunity to integrate ecological and water-quality processes in models for large basins. Light and temperature are fundamental physical controls on biogeochemistry and ecological health that are still not yet well-predicted at large scales. In addition to comprehensive modeling of water temperature and its controls, modeling of light availability to river corridors is needed including effects of shading by topography and riparian trees and light attenuation within the water column. Also needed is modeling of vertical mixing in lotic and lentic waterbodies, including stratification and gas exchange (reaeration) and modeling of dissolved oxygen dynamics to help increase understanding of river corridor energetics and health through estimation of aquatic ecosystem respiration and gross primary production. Metrics of aquatic ecosystem health, e.g., contaminant bioaccumulation and toxicology metrics and indices of tolerance to water-quality disturbances for aquatic insects and fish communities, also need better integration with water quality modeling. Many existing data sets have yet to be assimilated and harmonized to make them nationally consistent. New data collection priorities need assessment to fill gaps for trends analysis that will increase the power of integrated, large-basin modeling of water availability and ecosystem health.
Our results set the stage for addressing emerging challenges with models and analysis tools that represent the full continuum of river corridor features and functions across the 10 million kilometers of CONUS river corridors, including water storage and purification functions, habitat, and resilience to out-of-balance ecosystem behaviors such as hypoxia and harmful aquatic blooms. The focus for the future will be improved forecasting capabilities that anticipate the likely challenges and prioritize strategies for preservation or restoration of river corridor functions.
Data Availability Statement
Publicly available datasets were analyzed in this study. This data can be found here: The medium and high-resolution datasets used to produce analyses and results for this study are publicly available and can be found in the National Hydrography Dataset repository [https://nhd.usgs.gov] with additional attributes defined by Wieczorek et al. (2018) found in https://doi.org/10.5066/F7765D7V. Expressions and equation in the Methods can be used to reproduce results. In addition, the compiled information used for our study are available in the ScienceBase repository at https://doi.org/10.5066/P9TCH5J7.
Author Contributions
JH conceived the study and wrote the manuscript first draft. JH and NS contributed equally to the study design, data assimilation, data analysis, interpretation, and revision of the manuscript. Both authors contributed to the article and approved the submitted version.
Funding
JH was supported by the U.S. Geological Survey (USGS) Water Availability and Use Science Program (WAUSP). NS was supported by a USGS Water Mission Area Mendenhall Post-doctoral Fellowship.
Conflict of Interest
The authors declare that the research was conducted in the absence of any commercial or financial relationships that could be construed as a potential conflict of interest.
Acknowledgments
The authors gratefully acknowledge their colleagues from the Watershed Storage Controls and River Corridor Synthesis working groups at the John Wesley Powell Center for Analysis and Synthesis for the early discussions that sparked this research. Also acknowledged are colleagues from the USGS Water Quality Gap Analysis project and the USGS Integrated Watershed Prediction program who have been generous with their interest and feedback. Any use of trade, firm, or product names is for descriptive purposes only and does not imply endorsement by the U.S. Government.
Supplementary Material
The Supplementary Material for this article can be found online at: https://www.frontiersin.org/articles/10.3389/frwa.2020.580727/full#supplementary-material
References
Alexander, L. C., Autrey, B., DeMeester, J., Fritz, K. M., Golden, H. E., Goodrich, D. C., et al. (2015). Connectivity of Streams and Wetlands to Downstream Waters: A Review and Synthesis of the Scientific Evidence. Washington, DC: Office of Research and Development U.S. Environmental Protection Agency EPA/600/R.
Alexander, R. B., Boyer, E. W., Smith, R. A., Schwarz, G. E., and Moore, R. B. (2007). The Role of Headwater Streams in Downstream Water Quality. J. Am. Water Resour. Assoc. 43, 41–59. doi: 10.1111/j.1752-1688.2007.00005.x
Anderson, N. J., Heathcote, A. J., and Engstrom, D. R. (2020). Anthropogenic alteration of nutrient supply increases the global freshwater carbon sink. Sci. Adv. 6:eaaw2145. doi: 10.1126/sciadv.aaw2145
Arp, C. D., Gooseff, M. N., Baker, M. A., and Wurtsbaugh, W. (2006). Surface-water hydrodynamics and regimes of a small mountain stream–lake ecosystem. J. Hydrol. 329, 500–513. doi: 10.1016/j.jhydrol.2006.03.006
Baker, M. A., Arp, C. D., Goodman, K. J., Marcarelli, A. M., and Wurtsbaugh, W. A. (2016). “Stream-lake interaction: understanding coupled hydro-ecological systems,” in Stream Ecosystems in a Changing Environment, eds J. B. Jones, and E. H. Stanley (Amsterdam: Academic Press), 321–348. doi: 10.1016/B978-0-12-405890-3.00007-5
Beaulieu, M., Pick, F., and Gregory-Eaves, I. (2013). Nutrients and water temperature are significant predictors of cyanobacterial biomass in a 1147 lakes data set. Limnol. Oceanogr. 58, 1736–1746. doi: 10.4319/lo.2013.58.5.1736
Bellmore, J. R., Duda, J. J., Craig, L. S., Greene, S. L., Torgersen, C. E., Collins, M. J., et al. (2017). Status and trends of dam removal research in the United States. WIREs Water 4:e1164. doi: 10.1002/wat2.1164
Bencala, K. E. (1993). A perspective on stream-catchment connections. J. North Am. Benthol. Soc. 12, 44–47. doi: 10.2307/1467684
Berg, M. D., Popescu, S. C., Wilcox, B. P., Angerer, J. P., Rhodes, E. C., McAlister, J., et al. (2016). Small farm ponds: overlooked features with important impacts on watershed sediment transport. J. Am. Water Resour. Assoc. 52, 67–76. doi: 10.1111/1752-1688.12369
Bernhardt, E. S. (2013). Cleaner Lakes Are Dirtier Lakes. Science 342, 205–206. doi: 10.1126/science.1245279
Bernhardt, E. S., Heffernan, J. B., Grimm, N. B., Stanley, E. H., Harvey, J. W., Arroita, M., et al. (2018). The metabolic regimes of flowing waters. Limnol. Oceanogr. 63, S99–S118. doi: 10.1002/lno.10726
Boano, F., Harvey, J. W., Marion, A., Packman, A. I., Revelli, R., Ridolfi, L., et al. (2014). Hyporheic flow and transport processes: mechanisms, models, and biogeochemical implications. Rev. Geophys. 52, 603–679. doi: 10.1002/2012RG000417
Brakebill, J. W., Schwarz, G. E., and Wieczorek, M. E. (2018). An Enhanced Hydrologic Network in Support of SPARROW Modeling. U.S. Department of Interior, U.S. Geological Survey Scientific Investigations Report, 5127.
Brett, M. T., Arhonditsis, G. B., Chandra, S., and Kainz, M. J. (2012). Mass flux calculations show strong allochthonous support of freshwater zooplankton production is unlikely. PLoS ONE 7:e39508. doi: 10.1371/journal.pone.0039508
Cohen, M. J., Creed, I. F., Alexander, L. C., Basu, N., Calhoun, A. J. K., Craft, C., et al. (2015). Do geographically isolated wetlands influence landscape functions? Proc. Natl. Acad. Sci. U.S.A. 113, 1978–1986. doi: 10.1073/pnas.1512650113
Collier, M., Webb, R. H., and Schmidt, J. C. (1996). Dams and Rivers: A Primer on the Downstream Effects of Dams. U.S. Geological Survey. doi: 10.3133/cir1126
Copenheaver, C. A., Prisley, S. P., Pittman, J. R., Yonce, M. E., Issem, C. M. S., and Jensen, K. A. (2007). The geography of grist, flour, and saw mills. Southeast. Geogr. 47, 138–154. doi: 10.1353/sgo.2007.0004
Covino, T. (2017). Hydrologic connectivity as a framework for understanding biogeochemical flux through watersheds and along fluvial networks. Geomorphology 277, 133–144. doi: 10.1016/j.geomorph.2016.09.030
Dahl, T. E. (2011). Status and Trends of Wetlands in the Conterminous United States 2004 to 2009. Washington, DC: U.S. Department of Interior, Fish and Wildlife Service.
Downing, J., Prairie, T., Cole, J., Duarte, M., JL, T., Striegl, G., et al. (2006). The global abundance and size distribution of lakes, ponds, and impoundments. Limnol. Oceanogr. 51, 2388–2397. doi: 10.4319/lo.2006.51.5.2388
Downing, J. A. (2010). Emerging global role of small lakes and ponds: little things mean a lot. Limnetica 29, 9–24. doi: 10.23818/limn.29.02
Doyle, M. W. (2012). America's rivers and the American experiment. J. Am. Water Resour. Assoc. 48, 820–837. doi: 10.1111/j.1752-1688.2012.00652.x
Doyle, M. W., Stanley, E. H., Havlick, D. G., Kaiser, M. J., Steinbach, G., Graf, W. L., et al. (2008). Aging infrastructure and ecosystem restoration. Science 319, 286–287. doi: 10.1126/science.1149852
Dunne, T., Mertes, L. A. K., Meade, R. H., Richey, J. E., and Forsberg, B. R. (1998). Exchanges of sediment between the flood plain and channel of the Amazon river in Brazil. GSA Bull. 110, 450–467. doi: 10.1130/0016-7606(1998)110andlt;0450:EOSBTFandgt;2.3.CO;2
Eng, K., Wolock, D. M., and Carlisle, D. M. (2013). River flow changes related to land and water management practices across the conterminous United States. Sci. Total Environ. 463–464, 414–422. doi: 10.1016/j.scitotenv.2013.06.001
Fairchild, G. W., and Velinsky, D. J. (2006). Effects of small ponds on stream water chemistry. Lake Reserv. Manag. 22, 321–330. doi: 10.1080/07438140609354366
Fang, Y., and Jawitz, J. W. (2019). The evolution of human population distance to water in the USA from 1790 to 2010. Nat. Commun. 10:430. doi: 10.1038/s41467-019-08366-z
Finlay, J. C., Small, G. E., and Sterner, R. W. (2013). Human influences on nitrogen removal in lakes. Science 342, 247–250. doi: 10.1126/science.1242575
Foley, M., Bellmore, J., O'Connor, J., Duda, J., East, A., Grant, G., et al. (2017). Dam removal: listening in. Water Resour. Res. 53, 5229–5246. doi: 10.1002/2017WR020457
Gardner, J. R., Pavelsky, T. M., and Doyle, M. W. (2019). The abundance, size, and spacing of lakes and reservoirs connected to river networks. Geophys. Res. Lett. 46, 2592–2601. doi: 10.1029/2018GL080841
Gomez-Velez, J. D., Harvey, J. W., Cardenas, M. B., and Kiel, B. (2015). Denitrification in the mississippi river network controlled by flow through river bedforms. Nat. Geosci. 8, 941–945. doi: 10.1038/ngeo2567
Goodman, K. J., Baker, M. A., and Wurtsbaugh, W. A. (2011). Lakes as buffers of stream dissolved organic matter (DOM) variability: temporal patterns of DOM characteristics in mountain stream-lake systems. J. Geophys. Res. Biogeosci. 116:G00N02. doi: 10.1029/2011JG001709
Graf, W. L. (2006). Downstream hydrologic and geomorphic effects of large dams on American rivers. Geomorphology 79, 336–360. doi: 10.1016/j.geomorph.2006.06.022
Harrison, J. A., Maranger, R. J., Alexander, R. B., Giblin, A. E., Jacinthe, P.-A., Mayorga, E., et al. (2009). The regional and global significance of nitrogen removal in lakes and reservoirs. Biogeochemistry 93, 143–157. doi: 10.1007/s10533-008-9272-x
Harvey, J., Gomez-Velez, J., Schmadel, N., Scott, D., Boyer, E., Alexander, R., et al. (2019). How hydrologic connectivity regulates water quality in river corridors. J. Am. Water Resour. Assoc. 55, 369–381. doi: 10.1111/1752-1688.12691
Harvey, J., and Gooseff, M. (2015). River corridor science: hydrologic exchange and ecological consequences from bedforms to basins. Water Resour. Res. 51, 6893–6922. doi: 10.1002/2015WR017617
Hayes, N. M., Deemer, B. R., Corman, J. R., Razavi, N. R., and Strock, K. E. (2017). Key differences between lakes and reservoirs modify climate signals: a case for a new conceptual model. Limnol. Oceanogr. Lett. 2, 47–62. doi: 10.1002/lol2.10036
Ho, M., Lall, U., Allaire, M., Devineni, N., Kwon, H. H., Pal, I., et al. (2017). The future role of dams in the United States of America. Water Resour. Res. 53, 982–998. doi: 10.1002/2016WR019905
Holgerson, M. A., and Raymond, P. A. (2016). Large contribution to inland water CO2 and CH4 emissions from very small ponds. Nat. Geosci. 9:222. doi: 10.1038/ngeo2654
Homer, C. G., Dewitz, J. A., Yang, L., Jin, S., Danielson, P., Xian, G., et al. (2015). Completion of the 2011 national land cover database for the conterminous United States-representing a decade of land cover change information. Photogramm. Eng. Remote Sens. 81, 345–354. doi: 10.14358/PERS.81.5.345
Jobson, H. E. (1996). Prediction of traveltime and longitudinal dispersion in rivers and streams. U.S. Geol. Surv. Water-Resources Investig. Rep. 96–4013:69.
Karran, D. J., Westbrook, C. J., Wheaton, J. M., Johnston, C. A., and Bedard-Haughn, A. (2017). Rapid surface-water volume estimations in beaver ponds. Hydrol. Earth Syst. Sci. 21, 1039–1050. doi: 10.5194/hess-21-1039-2017
Kirchner, J. W., Feng, X., and Neal, C. (2001). Catchment-scale advection and dispersion as a mechanism for fractal scaling in stream tracer concentrations. J. Hydrol. 254, 82–101. doi: 10.1016/S0022-1694(01)00487-5
Knapp, J. L. A., Neal, C., Schlumpf, A., Neal, M., and Kirchner, J. W. (2019). New water fractions and transit time distributions at Plynlimon, Wales, estimated from stable water isotopes in precipitation and streamflow. Hydrol. Earth Syst. Sci. 23, 4367–4388. doi: 10.5194/hess-23-4367-2019
Lehner, B., Liermann, C. R., Revenga, C., Vörösmarty, C., Fekete, B., Crouzet, P., et al. (2011). High-resolution mapping of the world's reservoirs and dams for sustainable river-flow management. Front. Ecol. Environ. 9, 494–502. doi: 10.1890/100125
Leopold, L. B., and Maddock, T. (1953). The hydraulic geometry of stream channel and some physiographic implications. Geol. Surv. Prof. Pap. 252:64. doi: 10.3133/pp252
Leyk, S., Uhl, J. H., Connor, D. S., Braswell, A. E., Mietkiewicz, N., Balch, J. K., et al. (2020). Two centuries of settlement and urban development in the United States. Sci. Adv. 6:eaba2937. doi: 10.1126/sciadv.aba2937
Lindgren, G. A., and Destouni, G. (2004). Nitrogen loss rates in streams: scale-dependence and up-scaling methodology. Geophys. Res. Lett. 31:LI3501. doi: 10.1029/2004GL019996
Lindgren, G. A., Destouni, G., and Miller, A. V. (2004). Solute transport through the integrated groundwater-stream system of a catchment. Water Resour. Res. 40:W03511. doi: 10.1029/2003WR002765
Liu, Y., Yang, W., Yu, Z., Lung, I., Yarotski, J., Elliott, J., et al. (2014). assessing effects of small dams on stream flow and water quality in an agricultural watershed. J. Hydrol. Eng. 19:5014015. doi: 10.1061/(ASCE)HE.1943-5584.0001005
Livers, B., and Wohl, E. (2016). Sources and interpretation of channel complexity in forested subalpine streams of the southern rocky mountains. Water Resour. Res. 52, 3910–3929. doi: 10.1002/2015WR018306
Maavara, T., Parsons, C. T., Ridenour, C., Stojanovic, S., Dürr, H. H., Powley, H. R., et al. (2015). Global phosphorus retention by river damming. Proc. Natl. Acad. Sci. U.S.A. 112, 15603–15608. doi: 10.1073/pnas.1511797112
Magilligan, F. J., and Nislow, K. H. (2005). Changes in hydrologic regime by dams. Geomorphology 71, 61–78. doi: 10.1016/j.geomorph.2004.08.017
Marton, J. M., Creed, I. F., Lewis, D. B., Lane, C. R., Basu, N. B., Cohen, M. J., et al. (2015). Geographically isolated wetlands are important biogeochemical reactors on the landscape. Bioscience 65, 408–418. doi: 10.1093/biosci/biv009
Maxwell, R. M., Condon, L. E., Kollet, S. J., Maher, K., Haggerty, R., and Forrester, M. M. (2016). The imprint of climate and geology on the residence times of groundwater. Geophys. Res. Lett. 43, 701–708. doi: 10.1002/2015GL066916
Mendonça, R., Müller, R. A., Clow, D., Verpoorter, C., Raymond, P., Tranvik, L. J., et al. (2017). Organic carbon burial in global lakes and reservoirs. Nat. Commun. 8:1694. doi: 10.1038/s41467-017-01789-6
Merritts, D., Walter, R., Rahnis, M., Cox, S., Hartranft, J., Scheid, C., et al. (2013). The rise and fall of Mid-Atlantic streams: millpond sedimentation, milldam breaching, channel incision, and stream bank erosion. Rev. Eng. Geol. 21, 183–203. doi: 10.1130/2013.4121(14)
Moore, R. B., McKay, L. D., Rea, A. H., Bondelid, T. R., Price, C. V., Dewald, T. G., et al. (2019). User's Guide for the National Hydrography Dataset Plus (NHDPlus) High Resolution. U.S. Geological Survey Open-File Repert. doi: 10.3133/ofr20191096
Moore, T. L., Rodak, C. M., and Vogel, J. R. (2017). Urban stormwater characterization, control, and treatment. Water Environ. Res. 89, 1876–1927. doi: 10.2175/106143017X15023776270692
Naiman, R. J., Johnston, C. A., and Kelley, J. C. (1988). Alteration of North American streams by beaver. Bioscience 38, 753–762. doi: 10.2307/1310784
National Research Council (2002). Riparian Areas: Functions and Strategies for Management. Washington, DC: The National Academies Press
Nilsson, C., Reidy, C. A., Dynesius, M., and Revenga, C. (2005). Fragmentation and flow regulation of the world's large river systems. Science 308, 405–408. doi: 10.1126/science.1107887
Padowski, J. C., and Jawitz, J. W. (2012). Water availability and vulnerability of 225 large cities in the United States. Water Resour. Res. 48:W12529. doi: 10.1029/2012WR012335
Poff, N. L., Bledsoe, B. P., and Cuhaciyan, C. O. (2006). Hydrologic variation with land use across the contiguous United States: geomorphic and ecological consequences for stream ecosystems. Geomorphology 79, 264–285. doi: 10.1016/j.geomorph.2006.06.032
Poff, N. L., Brown, C. M., Grantham, T. E., Matthews, J. H., Palmer, M. A., Spence, C. M., et al. (2015). Sustainable water management under future uncertainty with eco-engineering decision scaling. Nat. Clim. Chang. 6:25. doi: 10.1038/nclimate2765
Poff, N. L., Olden, J. D., Merritt, D. M., and Pepin, D. M. (2007). Homogenization of regional river dynamics by dams and global biodiversity implications. Proc. Natl. Acad. Sci. U.S.A. 104, 5732–5737. doi: 10.1073/pnas.0609812104
Raymond, P. A., Oh, N.-H., Turner, R. E., and Broussard, W. (2008). Anthropogenically enhanced fluxes of water and carbon from the Mississippi River. Nature 451:449. doi: 10.1038/nature06505
Schmadel, N. M., and Harvey, J. W. (2020). NHD-RC: Extension of NHDPlus Version 2.1 With High-Resolution River Corridor Attributes. U.S. Geological Survey data release.
Schmadel, N. M., Harvey, J. W., Alexander, R. B., Schwarz, G. E., Moore, R. B., Eng, K., et al. (2018). Thresholds of lake and reservoir connectivity in river networks control nitrogen removal. Nat. Commun. 9:2779. doi: 10.1038/s41467-018-05156-x
Schmadel, N. M., Harvey, J. W., Schwarz, G. E., Alexander, R. B., Gomez-Velez, J. D., Scott, D., et al. (2019). Small ponds in headwater catchments are a dominant influence on regional nutrient and sediment budgets. Geophys. Res. Lett. 46, 9669–9677. doi: 10.1029/2019GL083937
Scott, D. T., Gomez-Velez, J. D., Jones, C. N., and Harvey, J. W. (2019). Floodplain inundation spectrum across the United States. Nat. Commun. 10:5194. doi: 10.1038/s41467-019-13184-4
Seitzinger, S. P., Harrison, J. A., Dumont, E., Beusen, A. H. W., and Bouwman, A. F. (2005). Sources and delivery of carbon, nitrogen, and phosphorus to the coastal zone: an overview of global nutrient export from watersheds (NEWS) models and their application. Global Biogeochem. Cycles 19:GB4S01. doi: 10.1029/2005GB002606
Snodgrass, J. W., Moore, J., Lev, S. M., Casey, R. E., Ownby, D. R., Flora, R. F., et al. (2017). Influence of modern stormwater management practices on transport of road salt to surface waters. Environ. Sci. Technol. 51, 4165–4172. doi: 10.1021/acs.est.6b03107
Soranno, P. A., Bissell, E. G., Cheruvelil, K. S., Christel, S. T., Collins, S. M., Fergus, C. E., et al. (2015). Building a multi-scaled geospatial temporal ecology database from disparate data sources: fostering open science and data reuse. Gigascience 4:28. doi: 10.1186/s13742-015-0067-4
Soranno, P. A., Webster, K. E., Riera, J. L., Kratz, T. K., Baron, J. S., Bukaveckas, P. A., et al. (1999). Spatial variation among lakes within landscapes: ecological organization along lake chains. Ecosystems 2, 395–410. doi: 10.1007/s100219900089
Sparks, R. E. (1995). Need for ecosystem management of large rivers and their floodplains: these phenomenally productive ecosystems produce fish and wildlife and preserve species. Bioscience 45, 168–182. doi: 10.2307/1312556
Stanford, J. A., and Ward, J. V. (1993). An ecosystem perspective of alluvial rivers: connectivity and the hyporheic corridor. J. North Am. Benthol. Soc. 12, 48–60. doi: 10.2307/1467685
Swanson, F. J., Johnson, S. L., Gregory, S. V., and Acker, S. A. (1998). Flood disturbance in a forested mountain landscape: interactions of land use and floods. Bioscience 48, 681–689. doi: 10.2307/1313331
Taguchi, V. J., Olsen, T. A., Natarajan, P., Janke, B. D., Gulliver, J. S., Finlay, J. C., et al. (2020). Internal loading in stormwater ponds as a phosphorus source to downstream waters. Limnol. Oceanogr. Lett. 5, 322–330. doi: 10.1002/lol2.10155
U.S. Army Corps of Engineers (2020). National Inventory of Dams. Washington, DC: Federal Emergency Management Agency. Available online at: https://nid.sec.usace.army.mil (accessed July 06, 2020).
U.S. Geological Survey (2016). National Hydrography Dataset. Available online at: https://nhd.usgs.gov/ (accessed May 6, 2018).
U.S. Geological Survey (2020). NHDPlus High Resolution. Available online at: https://nhd.usgs.gov/ (accessed April 20, 2020).
Villarreal, E. L., Semadeni-Davies, A., and Bengtsson, L. (2004). Inner city stormwater control using a combination of best management practices. Ecol. Eng. 22, 279–298. doi: 10.1016/j.ecoleng.2004.06.007
Vörösmarty, C. J., Meybeck, M., Fekete, B., Sharma, K., Green, P., and Syvitski, J. P. (2003). Anthropogenic sediment retention: major global impact from registered river impoundments. Glob. Planet. Change 39, 169–190. doi: 10.1016/S0921-8181(03)00023-7
Walker, J. J., Soulard, C. E., and Petrakis, R. E. (2020). Integrating stream gage data and Landsat imagery to complete time-series of surface water extents in Central Valley, California. Int. J. Appl. Earth Obs. Geoinf. 84:101973. doi: 10.1016/j.jag.2019.101973
Ward, A. S., and Packman, A. I. (2019). Advancing our predictive understanding of river corridor exchange. WIREs Water 6:e1327. doi: 10.1002/wat2.1327
Ward, J. V., and Stanford, J. A. (1995). The serial discontinuity concept: extending the model to floodplain rivers. Regul. Rivers Res. Manag. 10, 159–168. doi: 10.1002/rrr.3450100211
Wetzel, R. G. (1990). Land-water interfaces: metabolic and limnological regulators. SIL Proc. 1922-2010 24, 6–24. doi: 10.1080/03680770.1989.11898687
Whitfield, C. J., Baulch, H. M., Chun, K. P., and Westbrook, C. J. (2015). Beaver-mediated methane emission: the effects of population growth in Eurasia and the Americas. Ambio 44, 7–15. doi: 10.1007/s13280-014-0575-y
Wieczorek, M. E., Jackson, S. E., and Schwarz, G. (2018). Select Attributes for NHDPlus Version 2.1 Reach Catchments and Modified Network Routed Upstream Watersheds for the Conterminous United States. U.S. Geological Survey data release.
Winslow, L. A., Read, J. S., Hanson, P. C., and Stanley, E. H. (2014). Lake shoreline in the contiguous United States: quantity, distribution and sensitivity to observation resolution. Freshw. Biol. 59, 213–223. doi: 10.1111/fwb.12258
Wohl, E. (2013). Landscape-scale carbon storage associated with beaver dams. Geophys. Res. Lett. 40, 3631–3636. doi: 10.1002/grl.50710
Wohl, E. (2020). Wood process domains and wood loads on floodplains. Earth Surf. Process. Landforms 45, 144–156. doi: 10.1002/esp.4771
Keywords: lakes, small ponds, lentic, reservoirs, hydraulic load, residence time, hydrologic connectivity, river corridor
Citation: Harvey JW and Schmadel NM (2021) The River Corridor's Evolving Connectivity of Lotic and Lentic Waters. Front. Water 2:580727. doi: 10.3389/frwa.2020.580727
Received: 06 July 2020; Accepted: 04 December 2020;
Published: 07 January 2021.
Edited by:
Sarah E. Godsey, Idaho State University, United StatesReviewed by:
Eve-Lyn S. Hinckley, University of Colorado Boulder, United StatesAdam Wymore, University of New Hampshire, United States
Copyright © 2021 Harvey and Schmadel. This is an open-access article distributed under the terms of the Creative Commons Attribution License (CC BY). The use, distribution or reproduction in other forums is permitted, provided the original author(s) and the copyright owner(s) are credited and that the original publication in this journal is cited, in accordance with accepted academic practice. No use, distribution or reproduction is permitted which does not comply with these terms.
*Correspondence: Judson W. Harvey, andoYXJ2ZXlAdXNncy5nb3Y=