 Gloria Mozzi
 Paul Pavelic
 Mohammad F. Alam
 Catalin Stefan
 Karen G. Villholth
- 1Department of Hydrosciences, Technische Universität Dresden, Dresden, Germany
- 2International Water Management Institute (IWMI), Vientiane, Laos
- 3International Water Management Institute (IWMI), New Delhi, India
- 4Research Group INOWAS, Department of Hydrosciences, Technische Universität Dresden, Dresden, Germany
- 5International Water Management Institute (IWMI), Pretoria, South Africa
In semi-arid India, managed aquifer recharge (MAR) is often used to enhance aquifer storage, and by implication, water security, and climate resilience, by capturing surface runoff, mainly through check dams implemented at the community level. Despite their extensive use, the design of these structures typically does not follow a systematic method to maximize performance. To aid in the improvement of check dam design parameters and location siting, we develop a dynamic tool, which integrates the daily water balance of a check dam with analytical infiltration equations to assess check dam performance measured as temporal dynamics of storage, infiltration, and evaporation. The tool is implemented in R environment and requires meteorological and hydrogeological data, as well as check dam geometry and nearby well-abstractions, if any. The tool is applied to a case study in Saurashtra in Gujarat, where field visits were conducted. Simulations show that typical check dams in the area are able to store a volume between three and seven times their storage capacity annually. Infiltration volumes highly depend on hydroclimatic and hydrogeological conditions, as well as the formation of a clogging layer, highlighting the importance of site selection and periodic maintenance. The tool is validated with data from a previous study in Rajasthan, where daily water balance parameters were monitored. Validation results show an average R2 of 0.93 between the simulated and measured water levels. The results are adequate to suggest that the tool is able to assist in check dam planning in semi-arid environments.
Introduction
In semi-arid India, groundwater represents a vital source of water supply as annual precipitation is concentrated within the few months of the monsoon season (Mooley and Parthasarathy, 1984). In the last few decades, the dependence on groundwater resources has increased, leading to widespread aquifer depletion. The most recent national groundwater assessment indicates that out of the total assessed units, 22% were over-exploited or in critical condition (CGWB, 2019). To mitigate depletion and augment, or stabilize groundwater resources, the government, non-governmental organizations (NGOs), and local communities have implemented managed aquifer recharge (MAR) techniques—such as check dams, percolation tanks, and recharge wells through the capturing of rainwater, surface runoff or river flow in many areas across the country since the 1970s (Dillon et al., 2018).
One of the most common MAR structures in India is the check dam, an in-channel modification technique, which consists of a physical barrier within the bed of an ephemeral stream or river that retains input from seasonal surface runoff. The selection of check dam sites in semi-arid India is typically driven by the availability of favorable sites and local needs for water (Shah, 2014). Because of the bottom-up approach typically applied, most of these structures are constructed with limited ex-ante impact assessment and are often based on a simplistic estimation of expected recharge. These assessments are commonly based on recommendations from the national Groundwater Resource Estimation Committee, which estimates a recharge volume from a check dam at 50% of the total water stored behind the barrier over the season, assuming annual de-silting (GEC, 2017). Alternatively, estimates are based on past studies in the area of interest, if they exist.
In order to understand and optimize the impacts of MAR on groundwater resources, it is necessary to assess the hydrological performance in terms of maximum effective storage capacity, infiltration, and minimum losses by evaporation (Prathapar et al., 2015). Some studies focus on estimating check dam performance from catchment-scale analysis. Methods include numerical groundwater modeling (Gore et al., 1998), remote sensing (Chinnasamy et al., 2015), and lumped hydrological modeling combined with before/after implementation analysis (Jain, 2012). Catchment-scale studies, however, have intrinsic difficulties in isolating the contribution of check dams to recharge from other components of the water balance.
Regarding research on check dam performance at the structure-scale, some studies estimate recharge capacity from field-based observations using a water balance approach (Patel, 2002; Glendenning and Vervoort, 2010; Massuel et al., 2014; Dashora et al., 2018), the water table fluctuation method (Sharda et al., 2006; Renganayaki and Elango, 2013), or environmental tracers such as isotopes and chloride (Sharda et al., 2006; Stiefel et al., 2009; Massuel et al., 2014). The major limitation of field-based studies is the significant time and resources required. Moreover, results apply only to the specific study area and can be difficult to extend elsewhere or integrate to the catchment scale. Another limitation is that these assessments are based on existing structures and cannot easily be used for designing new structures.
Abraham and Mohan (2019) used a 3-dimensional model developed in MODFLOW to evaluate the potential recharge from MAR interventions in Tamil Nadu at the structure- scale. The significant amount of information and data required to prepare such numerical models limits their extensive use in estimating potential recharge for hypothetical cases. Boisson et al. (2014) developed a structure-scale model based on analytical equations for surface and groundwater balances and applied it to a crystalline aquifer in Telangana. Despite the use of simple analytical equations, the applicability of their model is limited by the inherent assumptions for the unsaturated zone, with areas underlain by shallow water tables not well-represented.
Infiltration is affected by many geophysical parameters—such as the soil type and water table depth (Bouwer and Rice, 1989). The influence of groundwater level fluctuations on infiltration is crucial in semi-arid areas, where the water table can rapidly increase as a result of intensive rainfall events. Also, abstractions from nearby wells can induce a drawdown of the water table beneath the check dams, consequently increasing the infiltration rate. This phenomenon is often referred to as induced recharge and can affect the infiltration rate noticeably (Moore and Jenkins, 1966). Most approaches and models do not take these aspects into account.
Given the limitations of existing methods, we propose an alternative, analytical, structure-scale model to assess check dams by considering infiltration dynamic and the geophysical parameters that affect it. The objective of this work is, therefore, to develop and test a new tool to assess check dam performance that considers the temporal dynamics of infiltration. The tool developed is intended to: (i) support the selection of suitable locations for new check dams (considering the hydrogeological setting, meteorological conditions, and catchment area), and (ii) support the planning of maintenance interventions such as desilting or rehabilitation of existing check dam structures. The tool requires limited amounts of data readily available from secondary sources and is user friendly so that not only scientists but also planners, water managers, and engineers can use it to aid in decision making.
Materials and Methods
A daily water balance is set up to assess the hydrological performance of a representative check dam. Indicators for check dam performance include: the infiltration rate, the fraction of surface runoff captured and infiltrated, the infiltration/evaporation ratio, the number of dam fillings per year (calculated as the ratio between the annual stored water volume and the maximum storage capacity of the structure), and the total number of days that water is stored in the check dam each year. The tool is applied to a case study in Gujarat, India and validated with observed data from a previous study in Rajasthan (Dashora et al., 2018).
Conceptual Model
Figure 1 shows the components considered in the water balance of a check dam: incoming runoff (R), precipitation falling within the impounded area of the check dam (P), evaporation from the impounded area of the check dam (E), infiltration from the impounded area of check dam (I), and overflow over the check dam spillway (F). Other potential losses from the check dam, such as direct withdrawals from the structure and water uptake by vegetation in direct proximity to the dam, are neglected or assumed to be zero. The change of storage (ΔV) in the check dam is then computed as the difference between inflows and outflows:
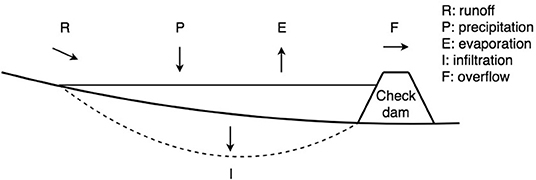
Figure 1. Conceptual diagram of a check dam with impoundment showing the components of the water balance considered by the tool.
If the check dam has reached its storage capacity (VMAX), the overflow is:
The resulting storage at time step t is, therefore:
The conceptual model is simulated on a daily time step and implemented in the R software environment (R Core Team, 2017). The storage capacity is estimated from area to volume relationships, which depend on the topography of the river bed at the check dam site and can be estimated on-site with specific equipment, such as dumpy level or theodolite. In the absence of on-site field measurement, a simplified approximate geometrical approach is used (section Area–volume–elevation relationships). Volumes of precipitation, evaporation, and runoff are derived from their corresponding depths (section Precipitation, evaporation, and runoff). Infiltration is derived using analytical equations from Bouwer's study on infiltration from open channels (Bouwer, 1969).
Area–Volume–Elevation Relationships
As a check dam is built in-channel and accumulates water behind the dam and up along the river channel, the wetted area and stored volume can be estimated from the stream gradient (δ) and the river cross-section, assuming a trapezoidal channel (Figure 2). The volume of water stored in the structure V can be approximated with a quadratic function of the water level in the structure Hw (Figure 2):
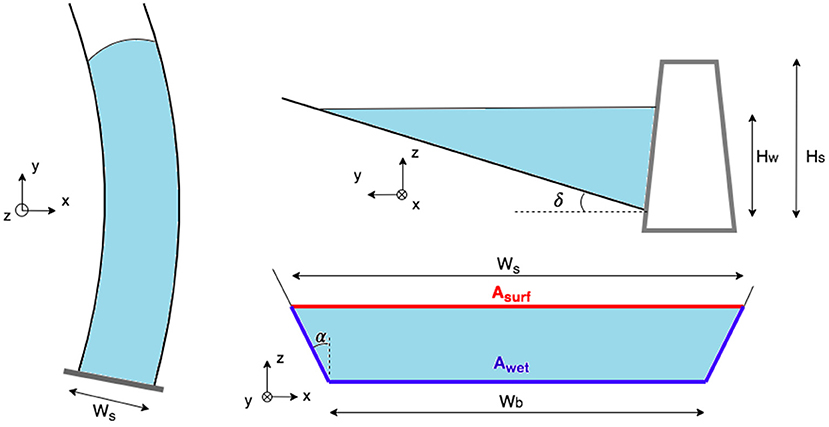
Figure 2. Cross-sections of a check dam and stored water volume.
Being Ws the structure's width. Storage capacity VMAX can therefore be estimated from Equation (4), where Hw = Hs, the height of the structure. The stream gradient δ can be estimated as the topographic slope, which can be calculated from a digital elevation model of the area. The functions estimating water surface [Asurf(Hw)] and wetted areas [Awet(Hw)] (red and blue line, respectively, Figure 2) from water level can then be formulated as:
With α being the river-bank slope.
Precipitation, Evaporation, and Runoff
Daily volumes of precipitation and evaporation are computed by multiplying the surface ponding area (Asurf) with rainfall and evaporation depths (p and e, respectively). The evaporation component is calculated with the Penman equation for evaporation from a free water surface (Penman, 1948). Evaporation from wetted soil as well as transpiration derived from any vegetation adjacent to the dam is neglected. The volume of incoming runoff is calculated from runoff depth (r) falling into the check dam's catchment area (Acatch). Runoff depth is estimated with the SCS—Curve number method (SCS, 1972), while the check dam's catchment area can be delineated from a Digital Elevation Model.
Infiltration
Infiltration volume (I) is calculated by multiplying daily infiltration rate (i) with the wetted area (Awet). According to Bouwer (2002), infiltration depends on the depth to the water table if the unsaturated zone is relatively shallow (i.e., depth to the water table, Dw, is less than twice the structure width, WS). This situation often occurs in semi-arid India, especially during monsoon season, when water depth can get as shallow as <1 m depth (India-WRIS, 2017).
Assuming that water seeps only in the lateral and vertical directions, the check dam basin can be modeled as an open channel (considering the leakage from open channels equivalent to the infiltration from check dams). Bouwer (1969) summarized most of the research on leakage from ephemeral open channels, identifying three main conditions of infiltration depending on the hydrogeological setting (A, B, and C). Conditions A and B consider a hydrogeological setting formed by two layers of different hydraulic conductivity (KI and KII; Figure 3A). A sub-condition (AB′) is added for these settings depending on the depth of the water table (it activates when Dw > DII or Dw > 2Ws). Finally, condition C considers the situation where the subsurface only consists of one layer with uniform hydraulic conductivity but with a clogging layer covering the bottom of the channel (Figure 3B), where clogging is represented by a hydraulic impedance (Ra).
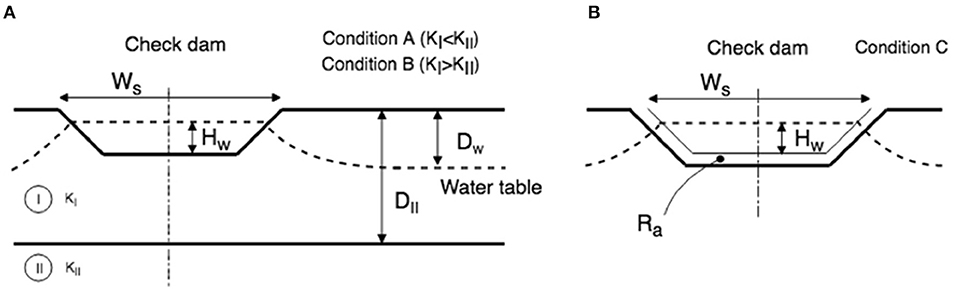
Figure 3. Bouwer model of infiltration for (A) condition A and B, and (B) for condition C with clogging layer.
The flow chart to identify which of the three Bouwer conditions applies to a specific area is illustrated in Figure 4. Information available on the area (even from secondary sources) should assist in the selection of the condition that best represents the hydrogeological setting of the area. Note that the hydraulic conductivity of the underlying layer KII used in conditions A and B is only necessary for identifying which of the Bouwer conditions apply but does not play any role in the computation of the infiltration rate (Equations 7, 8).
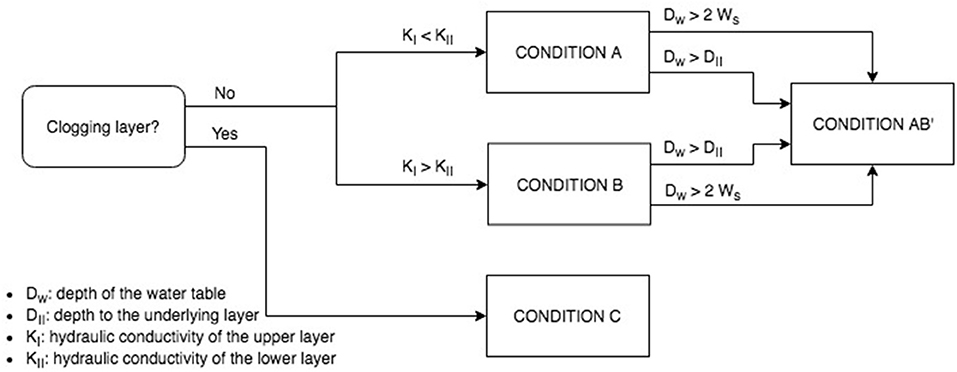
Figure 4. Flow-chart to identify Bouwer's conditions of infiltration.
The first Bouwer condition (A) applies to areas where the lower layer has a higher permeability than the upper one (KI ≪ KII), assuming for analytical purposes an underlying layer of infinite permeability. Infiltration rate is then approximated by Ernst's solution (Ernst, 1962):
Where iA is the infiltration rate [m/day], KI the hydraulic conductivity of the upper layer [m/day], Dw the depth of the water table [m] (variable), DII is the depth to the lower layer [m], w.p. is the wetted perimeter of the structure [m], Wb = Ws − 2Hs/tan(α) is the width of the bottom of the structure [m], a = 4.3.
The second Bouwer condition (B) assumes an underlying impermeable layer and can be used to approximate an area where the lower layer has much lower permeability than the upper one (KI ≫ KII). The infiltration rate is computed with Dupuit–Forcheimer's equation (Bouwer, 1965):
Where Ls = (Ws + Hw + DII)/2 [m].
In both conditions A and B, the infiltration rate is independent of the water table depth if the unsaturated zone is relatively deep (Dillon and Liggett, 1983). This happens when the water table is either below the underlying layer (Dw > DII), or deeper than twice the structure's width (Dw > 2Ws). A sub-condition is considered for both settings A and B that applies when the water table is deep. A solution for this condition (AB′) is:
Where A is a dimensionless parameter depending on the geometry of the structure, which can be found graphically from Bouwer (1969).
Finally, condition C describes channels with a thin soil cover of much lower hydraulic conductivity than the original soil (often referred to as a clogging layer, Figure 3B). The infiltration process in this condition is not affected by the hydrogeology underneath the clogging layer (Bouwer, 2002). For a trapezoidal channel, the infiltration rate is approximated by Bouwer (1969):
Where Ra is the hydraulic impedance of the clogging layer [days], and Pcr is the critical value of pressure for the change in hydraulic conductivity [m]. This value ranges from approximately −0.2 m of water for coarse and medium sands to −0.5 to −1 m water for fine sands and sandy loams and to −1.5 m and less for structureless loams and clays.
Water Table Input Function
The infiltration equations (Equations 7–10) used in the water balance (Equation 1) need daily data on background groundwater table depth (Dw) in the vicinity of the check dam. In the absence of observed daily groundwater table observations, a synthetic daily groundwater table function is developed from groundwater data available in the Water Resources Information System's database (India-WRIS, 2017). In the case of semi-arid India, a sinusoid function is recommended to represent the groundwater table, which is often characterized by an oscillating and periodic behavior following the seasonal variation of rainfall (India-WRIS, 2017). It is assumed that the infiltration from individual check dams does not affect the water table at a regional scale, as these structures are reported to not affect water tables beyond distances of over 2 km (Patel, 2002; Renganayaki and Elango, 2013).
Induced Recharge
Induced recharge is the increase in infiltration because of groundwater withdrawals in nearby wells (Chaturvedi and Srivastava, 1979). Induced recharge is simulated in the model by including a decrease in the groundwater table below the structure from abstraction in nearby wells. For this purpose, the Thiem equation (Thiem, 1906) is used to estimate the decrease in groundwater table depth at the structure (Da) on days when irrigation takes place tirr:
Where T is the transmissivity of the aquifer, Q is the abstraction rate, rs is the distance between the check dam and the well, rwell is the radius of the well and Dwell is the decrease in water level in the well. The decrease in groundwater table due to abstractions (Da) is then added to the groundwater depth (Dw) to calculate the groundwater depth in the days on which irrigation is scheduled (tirr). It is therefore assumed that the drawdown affects infiltration only on the day of scheduled abstractions, and by the following day, the water level in the well is fully recovered.
Case Study
The tool is applied to representative check dams located in Rajkot district in the Saurashtra peninsula of Southern Gujarat (Figure 5). This district was chosen because of the intensive check dam development, initiated in 2000, with currently more than 5,000 check dams in the district (NWRWS, 2018), equivalent to about 0.5 check dams /km2. Field visits were conducted to collect qualitative and quantitative data.
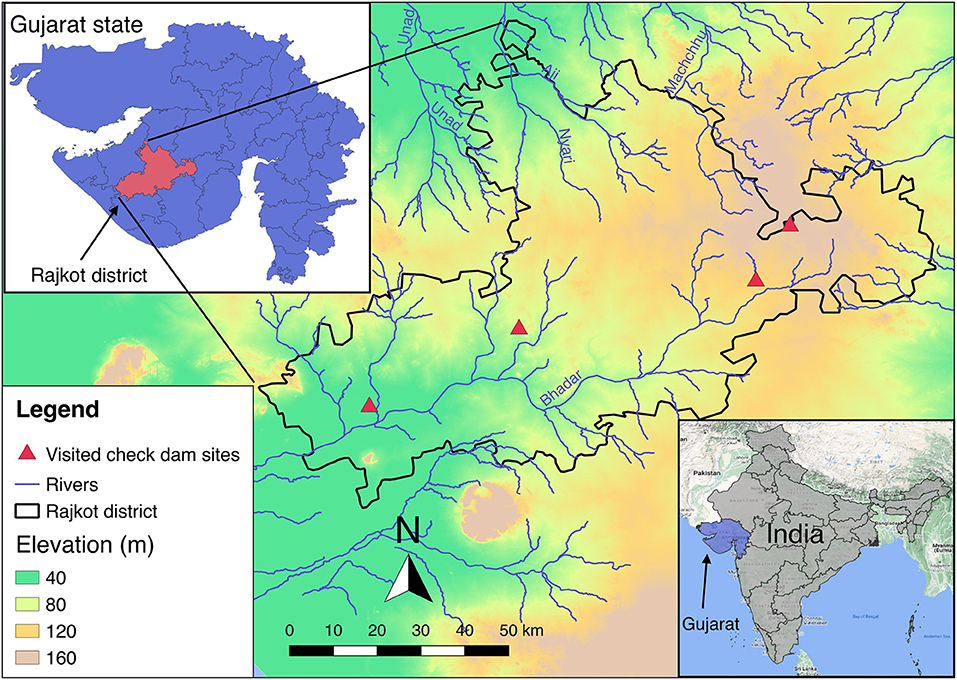
Figure 5. Location of the case-study area, Rajkot district, situated in the state of Gujarat, India. Topographic elevation, main rivers, and the sites where check dams were investigated are shown.
The geology of the area is characterized by the Deccan Traps, a hard-rock formation composed of multiple petrified lava flows. The weathered upper layer forms a good aquifer of varying thickness, which in some areas reaches 20 m (CGWB, 2011). The climate is semi-arid and characterized by three seasons: summer—from April to June, monsoon—from July to September, and winter—from October to March. The average annual rainfall is 625 mm, with over 90% of the precipitation occurring between June and September during the monsoon season. Currently, around 85% of the total area is used for agriculture, and 70% of irrigation is supplied by groundwater, mainly from dug wells (NWRWS, 2010).
Field-Based Data Collection
Field visits to four sites across a longitudinal transect spanning Rajkot district took place during 14–16 May 2019 (Figure 5). These sites were chosen to gain an understanding of the general characteristics and conditions of check dams in the district. Sites were selected considering the geographical location within the basin, the Strahler stream order, elevation, dimensions of the structures and the proximity to an existing observation well. Data on aquifer characteristics, check dam geometry, and groundwater abstractions by farmers in nearby wells were collected (Table 1). This was done via direct inspection and measurements of check dams, river bed geometry, close-by dug wells (within a 100 m proximity to the check dam), and a standardized questionnaire inquiring information on groundwater irrigation practice from farmers cultivating in the vicinity of the structures.
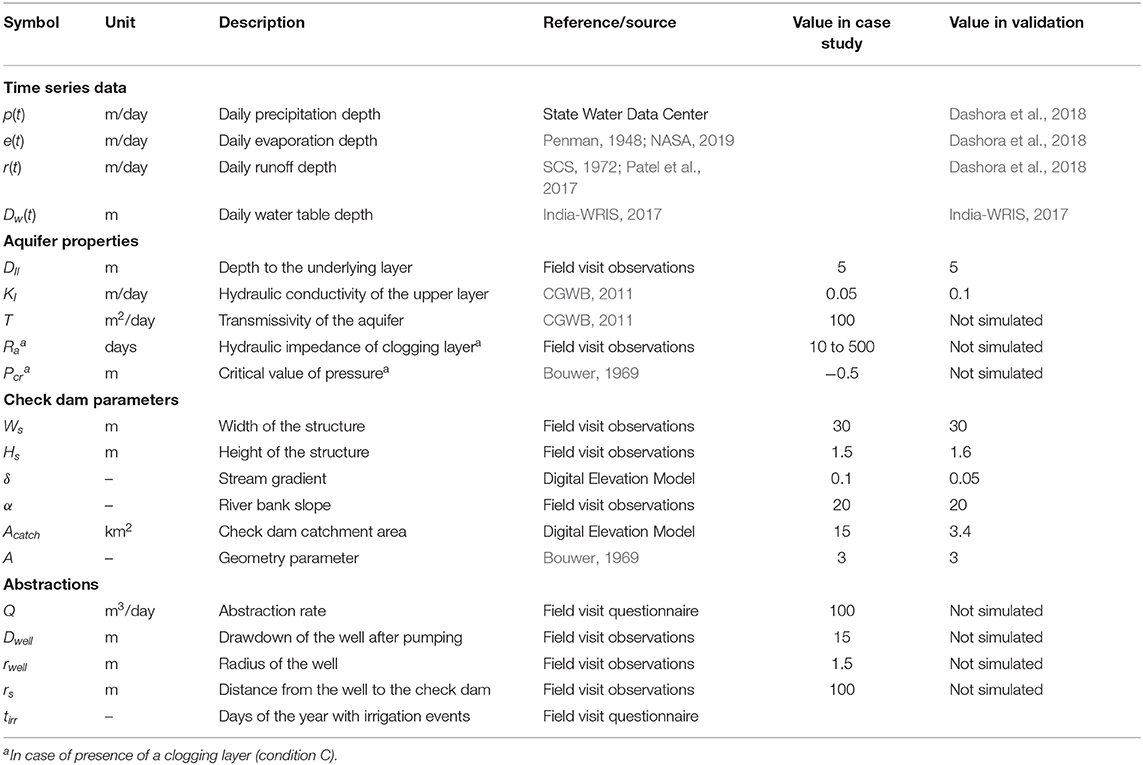
Table 1. Input data for the model and values used in the case study and validation.
Effective check dam height (Hs) and width (Ws) were measured. River cross-sections were measured 5 m upstream from the structure in order to estimate river bank slope (α). For close-by dug wells, the diameter (2rw) was measured as well as their distance from the structure (rs). As dug well casings consistently penetrated only the uppermost layer, the depth to the underlying layer (DII) was taken as the depth of the dug wells casings. Farmers were asked regarding the year of implementation of the check dam, benefits from check dam, the time when check dam storage dries out during the year, and their groundwater irrigation pattern (e.g., abstraction volumes and scheduling). Based on that, a synthetic and representative irrigation calendar was prepared for the crops (mainly cotton, wheat, and groundnut) and the number of irrigation events indicated by the farmers. Irrigation events (i.e., days on which irrigation is scheduled, tirr) were assumed to be at regular intervals within the growing season. Abstraction volumes for each irrigating event were estimated by the drawdown at the well after an irrigation event (Dw) as reported by the farmers. Flow rates (Q) were then estimated by dividing abstraction volumes by the average duration of an irrigation event.
Meteorological Data
Rainfall data from the State Water Data Center (SWDC), which included daily measurements from three meteorological stations in the district between 1961 and 2017, were used. For calculating evaporation depth, daily incoming net solar radiation, wind speed, temperature, surface pressure and relative humidity were taken from NASA POWER project data sets (NASA, 2019). Runoff depth was estimated with the SCS—Curve Number Method developed by the Soil Conservation Service (SCS, 1972). The curve number of the Bhadar basin—the major catchment in the district (Figure 5) is taken from the study of Patel et al. (2017). Years were classified in different rainfall categories (dry, normal, and wet) based on statistical frequency analysis of annual precipitation in the area. From annual rainfall measurements between 1961 and 2017, the following categories were defined: normal for years with annual rainfall between 400 and 800 mm; wet for years with more than 800 mm of rainfall; dry for years with rainfall <400 mm.
Groundwater Table Data
Data from 91 observation wells were retrieved from the national database of the Water Resources Information System (India-WRIS, 2017). Seasonal groundwater level (i.e., four measurements per year) from 1993 to 2018 were exported and used to obtain water table input functions (section Water table input function), which were derived for the three classes of rainfall years by interpolation of the average water depth from the selected observation wells. For days with scheduled irrigation, the local water table was computed as the sum of the input function and the drawdown caused by abstractions (section Induced recharge).
Simulations
Based on the check dam assessment from the field visit, simulations were run for a representative check dam with a storage capacity of VMAX of 20,000 m3. Depth to the underlying layer (DII) was taken as the thickness of the weathered upper zone. Values of input parameters and their source are given in Table 1. Simulations were run for 2000–2011, and annual water balance volumes were analyzed together with the temporal dynamics of infiltration. A local one-at-a-time (OAT) sensitivity analysis was performed to study the sensitivity of infiltration volumes to different input parameters.
Model Validation
In order to validate model performance and check which model condition best applies to the field context, simulation results were compared with observed measurements. Despite the widespread presence of MAR structures in the Saurashtra peninsula, no recent studies reporting daily observations of water level in check dams (necessary as input to the model, Equations (7–10) could be found for this area. The model performance was therefore validated against the observed measurements in the semi-arid Dharta watershed in Rajasthan, India (Dashora et al., 2018). For this, data on rainfall, evaporation, runoff coefficient of the watershed, geometry and daily water level of one of the check dams were provided by the authors (Table 1). Simulations were run for this check dam for 2014–2015 using the input parameters reported.
Results
Annual Water Balance
The check dam annual water balance (Table 2) is simulated from 2000 to 2010 for the Bouwer conditions with permeable and impermeable layer below the top layer (condition A and B, respectively). It can be seen that the contribution of direct precipitation over the impounded area is negligible as compared to the surface runoff inflow. Most of the inflow runoff leaves the check dam as overflow, with 95–99% of inflow going as outflow for both conditions A and B. Infiltration volumes range from 78,000 to 141,000 m3 for condition A (dry and wet year, respectively), and from 31,000 to 78,000 m3 for condition B (normal and wet year, respectively). On average, a setting with an underlying permeable layer (condition A) infiltrates annually 51,000 m3 more compared with an impermeable one. Average evaporation losses from the check dam are 17,000 and 26,000 m3 for conditions A and B, respectively, with condition B losing 9,000 m3 more for evaporation due to the longer infiltration times as infiltration rates are lower.
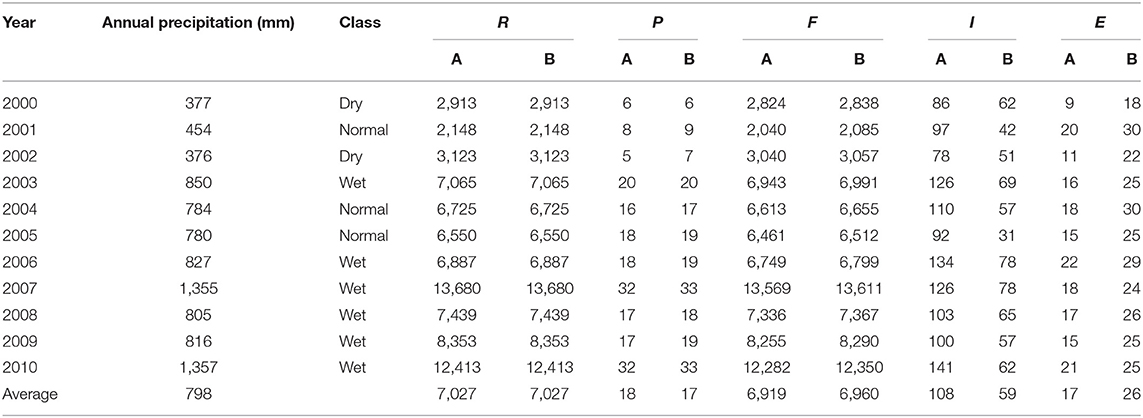
Table 2. Annual water balance components (R, runoff; P, precipitation falling over the surface impounded area in the check dam; F, overflow; I, infiltration; E, evaporation, volumes in 1,000 m3) for the two subsurface conditions (A and B).
From Table 3, it can be seen that the percentage of runoff that infiltrates stays below 3% under all conditions. This suggests that a single check dam has a small impact on runoff for downstream areas. However, while multiple check dams will interact and influence the overall watershed water balance, this is not analyzed here. The infiltration/evaporation ratio (I/E) is always higher than unity for all conditions, with values ranging between 1.5 and 8.5. This result implies that there is a net gain of groundwater storage relative to losses by evaporation. The minimum I/E value is seen for settings represented by condition B in normal years, suggesting long infiltration times. The highest I/E ratio occurs in dry years for condition A. This is a reflection of higher infiltration rates occurring in dry years, in which the water table is deeper and does not impede water from infiltrating into the subsoil—despite a higher evaporation rate in dry years. The number of fillings per year is higher than three under all conditions, and it reaches its maximum for structures located in settings over a permeable layer (A), which can capture up to seven times their storage capacity during a wet year.
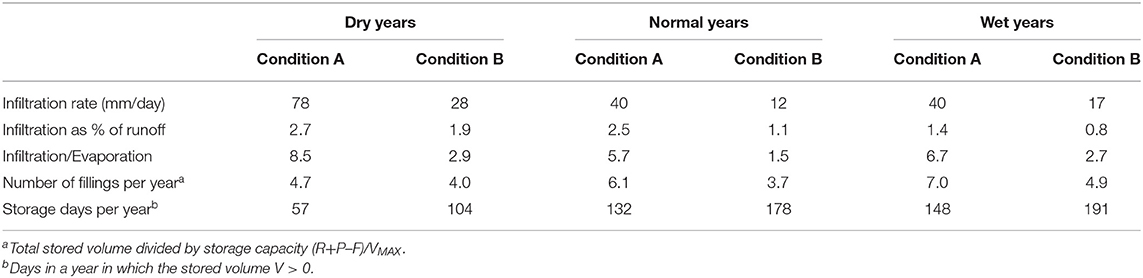
Table 3. Check dam's performance indicators for different rainfall years.
Daily Storage Volumes and Infiltration Rates
From the analysis of the daily hydrological behavior (Figure 6), it can be seen that the water volumes stored in the dam reflect precipitation, with the structure getting full after major rainfall events. After the first filling in mid-June, the water level decreases, and for condition A, it gets empty after 2 weeks from the first filling. For this condition, the check dam stays empty for 4 days before getting filled up again from another precipitation event. The check dam doesn't get empty in condition B, other than before the start of the monsoon. This is due to the lower infiltration rates, therefore corresponding to a lower number of fillings per year, as shown in Table 3. The structure gets empty around mid-October in the case of condition A, and in mid-November in the case of condition B. This higher number of days per year in which some water is stored in the check dam is reflected in a lower I/E ratio for condition B (Table 3).
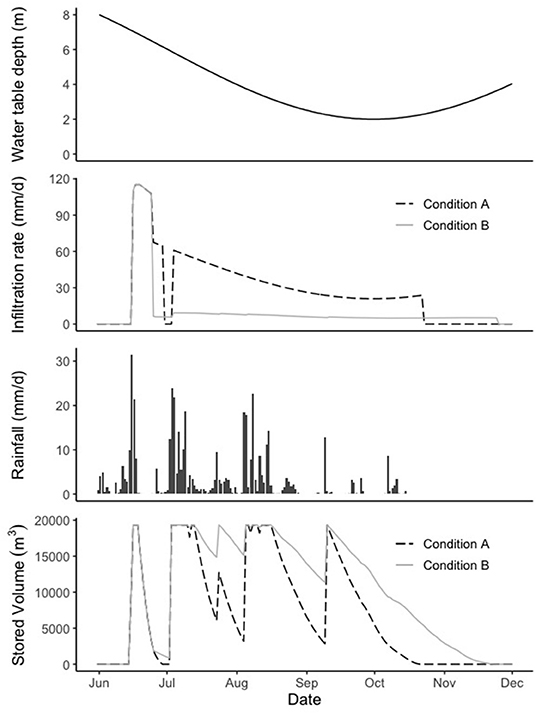
Figure 6. Daily hydrological behavior for the year 2001, normal year (from above: depth to the water table, infiltration rate, daily rainfall, and stored water volume in the dam).
Figure 6 also shows that at the start, the infiltration rate is more than 100 mm/day. This phase corresponds to the water table being below the weathered zone, thus not influencing infiltration. In the case of condition A, the infiltration rate drops to zero for the 4 days in which the check dam does not hold water and then goes up again to about 60 mm/day. For this condition, it can be seen that the infiltration rate replicates the behavior of the water table, reaching its minimum around October at the end of the monsoon season. For condition B, once the water table reaches the weathered zone, infiltration stays below 10 mm/day. This is because this condition considers an underlying impermeable layer, which prevents the vertical downward movement of infiltrated water beneath the weathered zone. Hence, infiltration is significantly reduced by the pounding of groundwater beneath the check dam.
Impact of Clogging Layer
Figure 7 shows the relative decrease in average annual infiltrated volume with a clogging layer of increasing impedance. For impedances lower than 60 days (which corresponds to a silt layer of 18 cm with a hydraulic conductivity of 0.003 m/day), condition C results in infiltration volumes higher than the other two conditions (decrease below zero). This means that for such values of impedance, condition C is not suitable to represent the infiltration process. However, as hydraulic impedance increases, infiltration volume declines rapidly. In this case, infiltration is fully controlled by the clogging layer, which represents the bottleneck for downward water movement. As impedance reaches 100 days (30 cm of silt with a hydraulic conductivity of 0.003 m/day), infiltration is reduced by 20% for condition B and by more than 50% for condition A.
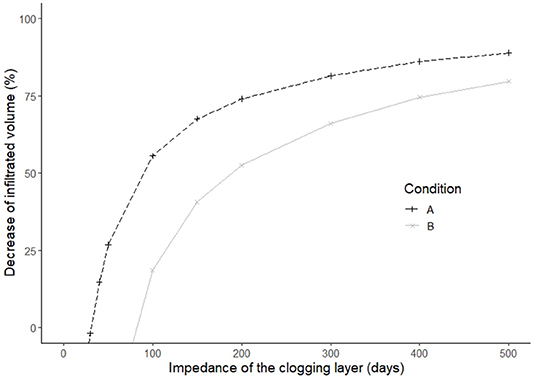
Figure 7. Decrease of average annual infiltrated water volume when a clogging layer is present, relative condition A and B, as a function of clogging layer impedance.
Induced Recharge
Simulation is run to assess the influence of induced recharge due to groundwater abstractions from nearby wells. An abstraction well is considered to be located 100 m from the check dam, from which water is abstracted for irrigation purposes. It is assumed that the entire cropping area (6 ha) is occupied by wheat during the months between December and March (also known as Rabi season); from July to October (Kharif), the area is divided equally between cotton and groundnut. The resulting number of annual irrigation events are 35, 28, and 22 for dry, normal, and wet years, respectively. On a day in which irrigation is scheduled, it is assumed that groundwater is abstracted at a rate of 100 m3/day for irrigating the cropping area associated with the well of the farmer. This pumping corresponds to a decrease of water level by 14 m in the dug well on an irrigation day. For condition A, the average annual infiltrated volume increases by 6.5% (7,000 m3), and losses by evaporation reduce by 6.2%. For condition B, the increase in infiltration volumes is 32.2% (more than 19,000 m3 per year), and the losses by evaporation are reduced by 25.5%. The higher impact of induced recharge on condition B is explained by the higher sensitivity to the shallow water table of this setting.
Sensitivity Analysis
An OAT sensitivity analysis is carried out to investigate the change in infiltration volume with the variation of one input parameter, keeping others constant. In order to study the effect of hydrogeology, hydraulic conductivity (KI) and depth to the underlying layer (DII) are chosen. The influence of geometry is analyzed through the height (HS) and width of the structure (WS), which both affect the storage capacity of the check dam. For each parameter, four simulations are run for −50%, −25%, +50%, and +100% of the original parameter value. The results are given in Table 4 for conditions A and B.
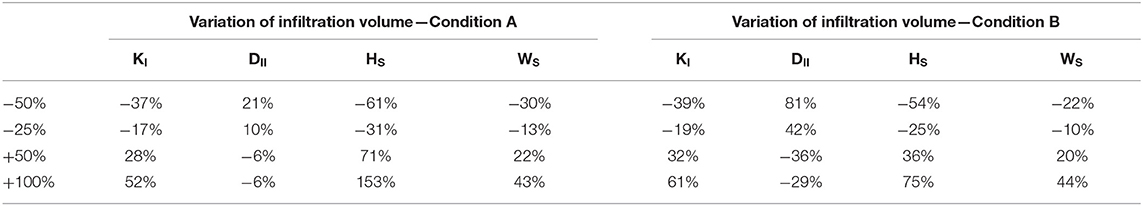
Table 4. One-at-a-time sensitivity analysis of average infiltration volume for hydraulic conductivity of the upper layer (KI), depth to the underlying layer (DII), height of the structure (Hs), and width of the structure (Ws), ranging from −50 to +100%.
From Table 4, it can be seen that hydraulic conductivity (KI) has a moderate influence on infiltration volumes for both conditions A and B, with infiltration increasing by about 50–60% when this parameter is doubled. The depth to the underlying layer (DII) does not play an essential role in condition A. However, for condition B, infiltration is significantly enhanced when this depth goes below 3 m (corresponding to a 50% reduction in DII). In this case, the model does not simulate the infiltration process correctly because the weathered zone is too thin compared to the height of the structure. Height of the check dam (HS) is a parameter highly influential on infiltration. In fact, this parameter is related to the storage capacity with a quadratic relationship. As for the structure's width (WS), the variation on infiltration follows the variation of the parameter almost linearly.
Finally, the sensitivity of infiltration volume to the catchment area of the check dam is investigated. The catchment area influences the amount of runoff intercepted by the check dam. As this area reduces, the amount of runoff available for recharge reduces. From Figure 8, it can be seen that for catchment areas bigger than 5 km2, infiltration volumes are not affected. This is because most of the incoming runoff leaves the structure immediately as overflow. In this case, a higher incoming volume would only imply a higher overflow, with no effect on storage. As the catchment area shrinks below 3 km2, infiltration starts to be heavily affected as a result of insufficient runoff compared to the check dam's storage capacity. In the Rajkot district, which has a check dam density of one structure every 2 km2, a check dam with the geometry like the simulated one suffers a decrease in infiltration volumes of about 7% compared to an isolated structure for both conditions A and B. The above results show that the model is quite sensitive to input parameters, and since observation data are not available to validate the simulation for the Rajkot area, the model results are to be considered indicate for the setting.
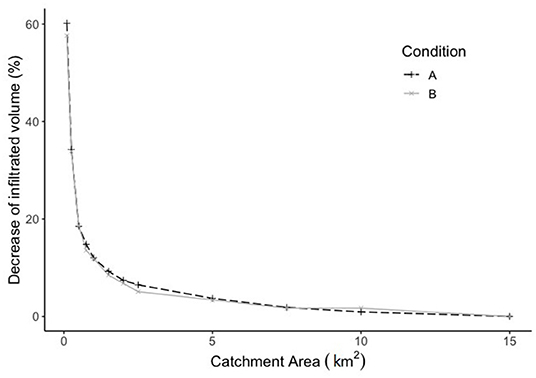
Figure 8. Decrease of average yearly infiltrated water volume for different check dam catchment areas relative to that of a catchment area of 15 km2.
Validation
Using data from the study by Dashora et al. (2018) and comparing check dam levels with the simulations (Figure 9), it can be seen that in 2014, both conditions A and B show a good fit with the observed measurements. There is a general overestimation of the water level from the model, but the difference is generally lower than 0.2 m. Condition A is the one that fits better with the observation, with a coefficient of determination R2 of 0.94 and an error of 2 days in predicting the day of empty. Condition B instead show an R2 of 0.93 and an error of 15 days in predicting when the storage empties.
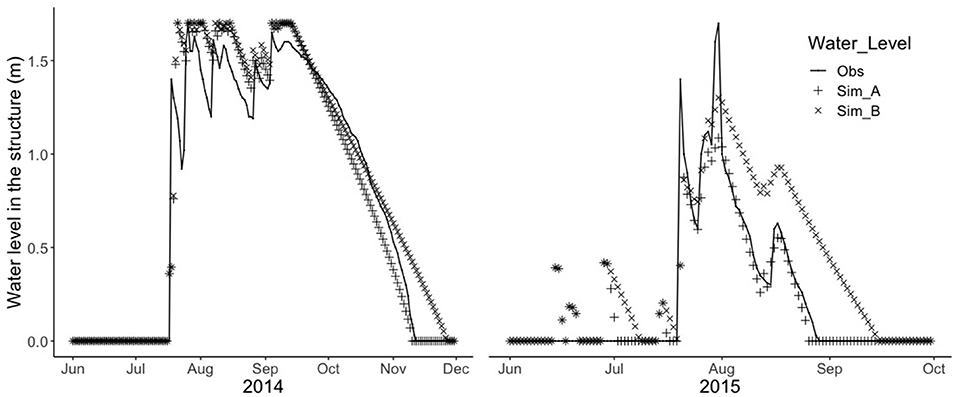
Figure 9. Model validation using data from Dashora et al. (2018): observed and simulated check dam water levels for the years 2014 and 2015.
In 2015, the model performance was poorer than in 2014, with R2 of 0.87 and 0.73 for conditions A and B, respectively. An evident discrepancy between observation and simulations is visible in June and July 2015. At this time, the model simulates some water in the check dam at the beginning of monsoon season, which was not observed. This is likely due to over-estimation of runoff which is derived by multiplying the precipitation depth with runoff coefficient (provided by the authors), thus not taking into consideration the antecedent moisture condition of the basin. However, after the check dam receives runoff and gets full (end of July), condition A replicates the observations very well, and it predicts the emptying of storage with only 3 days of discrepancy.
Discussion
Factors Affecting Infiltration
The results of this study demonstrate that check dam infiltration is strongly influenced by the hydrogeological setting, the density of check dams, the geometry of the structure, and the dynamics of the water table. For sites over a permeable layer (condition A), water is free to move vertically beneath the weathered zone, therefore infiltrating more quickly compared to sites on an impermeable layer. In this case (condition B), downward movement is obstructed, and the water mound prevents further infiltration. The dynamics of the groundwater table are also crucial for infiltration rates (Figure 6), for which two different phases of infiltration can be identified: in the first phase of the filling at the unset of the monsoon, the water table is deep and therefore, hydraulically disconnected from the check dam (Equation 9); in the second phase, the water table is hydraulically connected with the check dam, and infiltration resembles the groundwater fluctuation (Equations 7, 8). This is in accordance with the infiltration model by Dillon and Liggett (1983), who studied the transition between disconnected water table conditions and hydraulic connections for infiltration. Because of this transition, there is no linear correlation between infiltration volumes and annual precipitation. In fact, dry years with lowest storage periods and volumes of infiltration have the highest infiltration rates and lowest losses by evaporation. This highlights the importance of considering infiltration dynamics as a function of groundwater level and the advantage of the present model over methods employing constant infiltration rates (Jain, 2012).
The results also show that groundwater abstractions from nearby wells affect infiltration rates depending on abstraction rates, groundwater levels, and other hydrogeological and geometric conditions. This is an important mechanism in inducing recharge, especially in settings represented by condition B—with underlying impermeable layer—because of its higher sensitivity to the water table. Though it cannot be verified, the field survey indicated that induced recharge is happening in the field, with farmers reporting a much higher recovery of their wells post irrigation when a check dam has water in storage. However, with the presence of a clogging layer, for instance, groundwater abstractions do not affect infiltration rates. This is because induced recharge can occur only when the water table is hydraulically connected with the check dam.
The results show the gradual reduction of infiltration capacity because of clogging as the structure gets filled with a silt layer. The effect of clogging in Rajkot has been studied by Patel (2002), who found that infiltration from non-maintained and silted percolation tanks decreased by about 61%. Our method can provide further insight into the impact on infiltration of the gradual evolution of a clogging layer. This has great potential for scheduling and optimizing MAR maintenance events.
The sensitivity analysis shows that infiltration decreases significantly if the catchment area for the check dam decreases below a threshold value. For check dams with dimensions similar to the simulated one, infiltration decreases by about 7% as the catchment area goes below 3 km2 for both conditions A and B, and for values below this, the decrease is more significant (20% and 10% of reduction for an area of 0.5 km2 for condition A and B, respectively). This threshold is dependent on check dam dimensions, hydrogeological settings, and rainfall/runoff. If two check dams are constructed in series along a stream, the catchment area of the structure downstream is reduced according to the distance from the upstream one. When designing multiple check dams in a basin, the threshold area identified with the simulations can verify if the catchment area of each check dam is sufficient to collect runoff volumes compatible with its storage capacity. The Rajkot district, for instance, has an average check dam density of about 0.5 per km2, which indicates extensive MAR development in the area. Here, the construction of new check dams would not necessarily imply an increase in total recharge at the catchment-scale. In such cases, the tool may be applied to determine whether it is more appropriate to invest in the maintenance of existing structures.
From the validation, it is seen that the model can replicate the daily dam water level observations to an acceptable degree, with errors on storage days limited to less than a week and coefficients of determination of 0.94 and 0.93 in 2014 for the two simulated hydrogeological conditions. While the model application for the Rajkot district was not verified through calibrations, the results of the simulations were compared with field studies carried out in the Rajkot district. Patel (2002) investigated three check dams between 1996 and 1998. He reported average infiltration rates of 30.1 and 34.6 mm/day for two check dams situated on weathered basalt rock, while the infiltration rate from a previously desilted check dam in the same hydrogeological setting was reported to be 47.9 mm/day. These values are within the range of the simulated infiltration rates (Table 3).
Applicability of the Tool
The results demonstrate the applicability of the tool in India and potentially in other semi-arid areas where check dams are employed, such as Northern Africa, Southern Europe, and the Middle East (Martín-Rosales et al., 2007; Alderwish, 2010; Djuma et al., 2017). In these regions, the potential for check dams to enhance aquifer recharge has been assessed using hydrological models based on data from monitoring networks (Djuma et al., 2017) or field campaigns using infiltrometers (Martín-Rosales et al., 2007). The tool developed in this study can provide an effective alternative assessment in cases where site-specific data are scarce. Ideal application of the tool in semi-arid areas is reliant on the availability of basic groundwater level data and nominal information on the hydrogeological setting.
The tool is most suitable for sub-surface configurations that can be characterized as a one or two-layer system. The knowledge of the general hydrogeology of the area should assist in the selection of the Bouwer condition most suitable to represent the setting. In cases of a high degree of uncertainty, multiple conditions can be tested to define a performance range and, consequently, base decisions upon risk minimization. For check dams on shallow weathered zones, it is suggested to use results for condition A. This is because results from the sensitivity analysis show that condition B with a relatively shallow weathered zone (DII ≤ Hs) could not simulate infiltration processes correctly. Check dams over homogeneous and porous aquifers may also be assessed with the tool with slight modification. In these cases, the code should be modified for condition B by implementing an equation for infiltration with infinite depth to the underlying layer (DII → ∞) (Bouwer, 1969).
For simulations with induced recharge from pumping, it is important to note that the Thiem equation is valid for porous confined aquifers under steady-state conditions. Our model assumes abstraction affects the water table only on the day of pumping and that the drawdown recovers by the following day. As a result, simulations with induced recharge are recommended to be used for differential analysis only to determine the total annual water balance volumes.
It is important to note that the tool developed here is intended to provide a first-order assessment of the hydrological performance of check dams. Striving for higher levels of accuracy, as is possible with more sophisticated and data-intensive process-based models, was not the main goal of this study. This required making certain simplifications and assumptions. For instance, the tool neglects evaporation from the wetted soil, as well as the effect of infiltration on the groundwater table away from the structure. Also, the tool simulates infiltration from the ponding area to the subsoil, thus representing the potential recharge. The actual recharge (i.e., infiltrated water reaching the aquifer) is not implemented in the tool. For applications that may require the inclusion of these processes, more advanced 3-dimensional numerical models may instead be used.
The advantage of the tool developed in this study is that it can be used and employed with limited site-specific data. Input parameters on check dam geometry can be remotely retrieved from secondary data and aerial imagery. Also hydrogeological properties—such as hydraulic conductivity, the thickness of the weathered zone, and properties of the underlying layer—can be retrieved from secondary data (e.g., hydrogeological surveys and borehole logging data). Since the model results are quite sensitive to some of these parameters, calibration of the model simulations against observed storage volumes will render more credibility to the model outputs. Where model input information is not available, brief field surveys such as the one carried out in this study can be organized without the need for specialized equipment other than a measuring tape. More detailed knowledge of the study area could identify other input or output volumes, which are not already considered in the water balance Equation (1). For instance, there could be sites where water in the check dam is used as a drinking water source for animals. In these cases, the code can easily be modified to include additional elements in the water balance.
The tool can be applied for ex-ante assessment of check dam performance in terms of infiltration and losses by evaporation. Cumulative impacts on runoff by multiple check dams can also be analyzed by summing up the effect of individual structures. Another ex-ante application is to support the suitable location and geometry of the structures. Once the check dam's dimensions have been estimated, Digital Elevation Models (DEM) can be used to delineate catchment area (Acatch) and check that the catchment area is larger than the threshold area below which infiltration decreases significantly (Figure 8). With this approach, it is also possible to design multiple check dams in series, maintaining a minimum distance between adjacent structures depending on the topography. Once suitable locations are identified, simulations can be run to compute potential recharge for planning purposes and verify if the new check dams meet the expected performance criteria.
The tool can also help study the effect of a clogging layer formation and, consequently, the scheduling of an optimized maintenance plan. Assuming, for instance, an increase of hydraulic impedance (Ra) of 20 days per year (corresponding to a deposition of 6 cm of material with a hydraulic conductivity of 0.003 m/day), it is possible to foresee the annual decrease of potential recharge from the structure. For the case of a check dam with the dimensions and characteristics of the one simulated here, this would imply a decrease in infiltration by 50% after 5 years for a structure over a permeable layer (condition A), and after 10 years in case of an impermeable layer (B). This can be used to establish a desilting frequency, which will depend on the pre-defined threshold considered to represent a significant performance reduction. It is assumed that the decrease of infiltration due to the reduced storage capacity in the check dam over time is negligible, but for a more precise estimation, structure height (HS) can be gradually reduced by the thickness of accumulated sediments.
Another possible application is the assessment of the hydrologic performance of an existing check dam. In this case, input parameters can be defined more accurately so that results can simulate check dam behavior more closely. For this, daily water level measurements should be taken to understand which hydrogeological condition (A or B) fits best the study area and to calibrate other model parameters. As storage volume is one of the most sensitive parameters, retrieving accurate area-volume-elevation curves will increase the accuracy of the simulations. This can be done using a dumpy level or theodolite in the collecting area of the check dam when this is empty (i.e., in the dry season). Once the tool replicates fairly well-water storage of an existing check dam, it is possible to predict its future recharge potential depending on the meteorological conditions. The effects of different climate change scenarios on infiltration capacity can then be tested.
Conclusions
A new tool has been developed for assessing the performance of check dams for capturing water and storing it underground. The tool integrates the daily water balance of the check dam with a set of analytical infiltration equations and time series of groundwater table depth. The effective storage, infiltration, and losses by evaporation from a check dam can be simulated for different structure geometries and hydrogeological settings. The tool can satisfactorily simulate infiltration dynamics with validation results showing an average R2 of 0.93 between the simulated and measured water levels for a test case in Rajasthan, India. Based on a case in Rajkot district, Gujarat, the findings indicate that check dams have the potential to store up to seven times their storage capacity per year. It is demonstrated that the structure's dimensions, the hydrogeological setting, and the maintenance of check dams play an important role in infiltration capacity, indicating that the selection of suitable locations and management are crucial to achieving the intended benefits of recharge structures. Results also show the complexity of recharge in semi-arid areas with large groundwater fluctuations and highlight the supremacy of models accounting for variable infiltration rates depending on groundwater level to assess check dam performance. The tool can be employed with limited data to carry out ex-ante analysis to assess suitable locations and potential recharge from check dams. Maintenance interventions—such as desilting and repair to damaged structures—can be planned and optimized according to site characteristics and the structure's dimensions. Other applications could involve the study of climate change impacts on check dam performance for different future scenarios, possibly under heavy flooding. Although this study focuses on semi-arid India, the tool developed can potentially be applied to other semi-arid regions of the world where check dams have prominence, such as Africa and the Middle East.
Data Availability Statement
The raw data supporting the conclusions of this article will be made available by the authors, without undue reservation.
Ethics Statement
Ethical review and approval was not required for the study on human participants in accordance with the local legislation and institutional requirements. Written informed consent for participation was not required for this study in accordance with the national legislation and the institutional requirements.
Author Contributions
GM conducted the literature review, field work, model development, results analysis, and writing of the manuscript. PP supervised the work and mentored GM. MA conducted field work together with GM and supervised the activity. CS supervised the work from the academic side. KV provided technical contribution and was the responsible for the partnership. All authors contributed to the article and approved the submitted version.
Funding
This research was made possible through financial support provided by the CGIAR Research Program on Water, Land, and Ecosystems (WLE).
Conflict of Interest
The authors declare that the research was conducted in the absence of any commercial or financial relationships that could be construed as a potential conflict of interest.
Acknowledgments
We thank Praharsh Patel from the International Water Management Institute (IWMI) for his dedicated support in translation with local farmers during the field visit in Saurashtra. Our appreciation also goes to Punjan Patel, Shilp Verma, and all the colleagues from the IWMI Anand office who gave assistance and support for the fieldwork activities. We sincerely thank Yogita Dashora from Maharana Pratap University of Agriculture and Technology, Udaipur, India, for generously sharing the data from her previous work. We also thank Saxon State and University Library Dresden (SLUB) for covering the publication costs.
References
Abraham, M., and Mohan, S. (2019). Effectiveness of check dam and percolation pond with percolation wells for artificial groundwater recharge using groundwater models. Water Sci. Technol. Water Supply 19, 2107–2115. doi: 10.2166/ws.2019.091
Alderwish, A. M. (2010). Induced recharge at new dam sites-Sana'a Basin, Yemen. Arab. J. Geosci. 3, 283–293. doi: 10.1007/s12517-009-0075-8
Boisson, A., Baïsset, M., Alazard, M., Perrin, J., Villesseche, D., Dewandel, B., et al. (2014). Comparison of surface and groundwater balance approaches in the evaluation of managed aquifer recharge structures: case of a percolation tank in a crystalline aquifer in India. J. Hydrol. 519, 1620–1633. doi: 10.1016/j.jhydrol.2014.09.022
Bouwer, H. (1965). Limitation of the Dupuit-Forchheimer assumption in recharge and seepage. Trans. ASAE 8, 512–515. doi: 10.13031/2013.40565
Bouwer, H. (1969). Theory of seepage from open channels. Adv. Hydrosci. 5, 121–172. doi: 10.1016/B978-1-4831-9936-8.50008-8
Bouwer, H. (2002). Artificial recharge of groundwater : hydrogeology and engineering. Hydrogeol. J. 10, 121–142. doi: 10.1007/s10040-001-0182-4
Bouwer, H., and Rice, R. C. (1989). Effect of water depth in groundwater recharge basins on infiltration. J. Irrig. Drain. Eng. 115, 556–567. doi: 10.1061/(ASCE)0733-9437(1989)115:4(556)
CGWB (2011). State Profile - Groundwater Scenario of Gujarat. Central Ground Water Board (CGWB), Ministry of Water Resources, Government of India. Available online at: http://cgwb.gov.in/State-Profiles/Gujarat.pdf (accessed April 1, 2019).
CGWB (2019). Ground Water Year Book. Central Ground Water Board (CGWB), Ministry of Water Resources, Government of India. Available online at: http://cgwb.gov.in/Regions/GW-year-Books/GWYB-2015-16/GWYBDelhi2015-16.pdf (accessed April 26, 2019).
Chaturvedi, M. C., and Srivastava, V. K. (1979). Induced groundwater recharge in the Ganges Basin. Water Resour. Res. 15, 1156–1166. doi: 10.1029/WR015i005p01156
Chinnasamy, P., Misra, G., Shah, T., Maheshwari, B., and Prathapar, S. (2015). Evaluating the effectiveness of water infrastructures for increasing groundwater recharge and agricultural production - a case study of Gujarat, India. Agric. Water Manag. 158, 179–188. doi: 10.1016/j.agwat.2015.05.009
Dashora, Y., Dillon, P., Maheshwari, B., Soni, P., Dashora, R., Davande, S., et al. (2018). A simple method using farmers' measurements applied to estimate check dam recharge in Rajasthan, India. Sustain. Water Resour. Manag. 4, 301–316. doi: 10.1007/s40899-017-0185-5
Dillon, P., Stuyfzand, P., Grischek, T., Lluria, M., Pyne, R. D. G., Jain, R. C., et al. (2018). Sixty years of global progress in managed aquifer recharge. Hydrogeology 27, 1–30. doi: 10.1007/s10040-018-1841-z
Dillon, P. J., and Liggett, J. A. (1983). An ephemeral stream-aquifer interaction model. Water Resour. Res. 19, 621–626. doi: 10.1029/WR019i003p00621
Djuma, H., Bruggeman, A., Camera, C., Eliades, M., and Kostarelos, K. (2017). The impact of a check dam on groundwater recharge and sedimentation in an ephemeral stream. Water 9, 1–16. doi: 10.3390/w9100813
Ernst, L. (1962). Grondwaterstromingen in de Verzadigde Zone en Hun Berekening Bij Aanwezigheid van Horizontale Evenwijdige Open Leidingen. Centrum voor Landbouwpublikaties en Landbouwdocumentatie.
GEC (2017). Report of the Ground Water Resource Estimation Committee (GEC-2015). Ministry of Water Resources, River Development and Ganga Rejuvenation, Government of India, New Delhi, 137.
Glendenning, C. J., and Vervoort, R. W. (2010). Hydrological impacts of rainwater harvesting (RWH) in a case study catchment: the Arvari River, Rajasthan, India. Part 1. Field-scale impacts. Agric. Water Manag. 98, 331–342. doi: 10.1016/j.agwat.2010.09.003
Gore, K. P., Pendke, M. S., Gurunadha Rao, V. V. S., and Gupta, C. P. (1998). Groundwater modelling to quantify the effect of water harvesting structures in Wagarwadi watershed, Parbhani district, Maharashtra, India. Hydrol. Process. 12, 1043–1052. doi: 10.1002/(SICI)1099-1085(19980615)12:7<1043::AID-HYP638>3.0.CO;2-I
India-WRIS (2017). India Water Resources Information System developed under National Hydrology Project. Available online at: http://indiawris.gov.in/wris/ (accessed April 26, 2019).
Jain, R. C. (2012). Role of Decentralized Rainwater Harvesting and Artificial Recharge in Reversal of Groundwater Depletion in the Arid and Semi-arid Regions of Gujarat, India. IWMI-TATA Water Policy Program. Available online at: http://www.iwmi.cgiar.org/iwmi-tata/PDFs/2012_Highlight-49.pdf (accessed April 1, 2019).
Martín-Rosales, W., Gisbert, J., Pulido-Bosch, A., Vallejos, A., and Fernández-Cortés, A. (2007). Estimating groundwater recharge induced by engineering systems in a semiarid area (southeastern Spain). Environ. Geol. 52, 985–995. doi: 10.1007/s00254-006-0541-5
Massuel, S., Perrin, J., Mascre, C., Mohamed, W., Boisson, A., and Ahmed, S. (2014). Managed aquifer recharge in South India: what to expect from small percolation tanks in hard rock? J. Hydrol. 512, 157–167. doi: 10.1016/j.jhydrol.2014.02.062
Mooley, D. A., and Parthasarathy, B. (1984). Fluctuations in All-India summer monsoon rainfall during 1871-1978. Clim. Change 6, 287–301. doi: 10.1007/BF00142477
Moore, J. E., and Jenkins, C. T. (1966). An evaluation of the effect of groundwater pumpage on the infiltration rate of a semipervious streambed. Water Resour. Res. 2, 691–696. doi: 10.1029/WR002i004p00691
NASA (2019). POWER Project Data Sets. Available online at: https://power.larc.nasa.gov (accessed April 26, 2019).
NWRWS (2010). Bhadar Water Resources Project. Narmada Water Resources Water Supply and Kalpsar Department. Available online at: https://guj-nwrws.gujarat.gov.in/showpage.aspx?contentid=1643andlang=english (accessed April 15, 2019).
NWRWS (2018). Details of Checkdams Completed in Gujarat State as on 31 March 2018. Narmada Water Resources Water Supply and Kalpsar Department.
Patel, A. S. (2002). Impact of Groundwater Recharge Activities in Saurashtra. IWMI-TATA Water Policy Program. Available online at: https://econpapers.repec.org/paper/iwtworppr/h029643.htm (accessed April 1, 2020).
Patel, J., Singh, N. P., Prakash, I., and Mehmood, K. (2017). Surface runoff estimation using SCS- CN method - a case study on Bhadar. Imperial J. Interdiscipl. Res. 3, 1213–1218.
Penman, H. L. (1948). Natural evaporation from open water, hare soil and grass. Proc. R. Soc. London Ser A Math Phys Sci. 193, 120–145. doi: 10.1098/rspa.1948.0037
Prathapar, S., Dhar, S., Rao, G. T., and Maheshwari, B. (2015). Performance and impacts of managed aquifer recharge interventions for agricultural water security: a framework for evaluation. Agric. Water Manag. 159, 165–175. doi: 10.1016/j.agwat.2015.06.009
R Core Team (2017). R: A Language and Environment for Statistical Computing. Vienna: R Fundation for Statistical Computing. Available online at: https://www.r-project.org/
Renganayaki, S. P., and Elango, L. (2013). A review on managed aquifer recharge by check dams: a case study near Chennai, India. Int. J. Res. Eng. Technol. 02, 416–423. doi: 10.15623/ijret.2013.0204002
SCS (1972). “Section 4: Hydrology,” in National Engineering Handbook, ed V. Mockus (Washington, DC: USDA Soil Conservation Service), 21.1–21.115.
Shah, T. (2014). Towards a Managed Aquifer Recharge strategy for Gujarat, India: an economist's dialogue with hydro-geologists. J. Hydrol. 518, 94–107. doi: 10.1016/j.jhydrol.2013.12.022
Sharda, V. N., Kurothe, R. S., Sena, D. R., Pande, V. C., and Tiwari, S. P. (2006). Estimation of groundwater recharge from water storage structures in a semi-arid climate of India. J. Hydrol. 329, 224–243. doi: 10.1016/j.jhydrol.2006.02.015
Keywords: managed aquifer recharge, groundwater management, semi-arid, Gujarat, India
Citation: Mozzi G, Pavelic P, Alam MF, Stefan C and Villholth KG (2021) Hydrologic Assessment of Check Dam Performances in Semi-Arid Areas: A Case Study From Gujarat, India. Front. Water 3:628955. doi: 10.3389/frwa.2021.628955
Received: 13 November 2020; Accepted: 23 March 2021;
Published: 20 April 2021.
Edited by:
Tibor Stigter, IHE Delft Institute for Water Education, NetherlandsReviewed by:
Ray G. Anderson, U.S. Salinity Laboratory, United StatesMoctar Diaw, Cheikh Anta Diop University, Senegal
Copyright © 2021 Mozzi, Pavelic, Alam, Stefan and Villholth. This is an open-access article distributed under the terms of the Creative Commons Attribution License (CC BY). The use, distribution or reproduction in other forums is permitted, provided the original author(s) and the copyright owner(s) are credited and that the original publication in this journal is cited, in accordance with accepted academic practice. No use, distribution or reproduction is permitted which does not comply with these terms.
*Correspondence: Gloria Mozzi, Z2xvcmlhLm1venppOTNAZ21haWwuY29t