 Florian U. Jehn
 Lutz Breuer
 Philipp Kraft1
 Tobias Houska
- 1Research Center for BioSystem, Land Use and Nutrition (iFZ), Institute for Landscape Ecology and Resources Management (ILR), Justus Liebig University Giessen, Giessen, Germany
- 2Centre for International Development and Environmental Research (ZEU), Justus Liebig University Giessen, Giessen, Germany
Hydrological theory often assumes an exponential relationship between storage and discharge, but how often do we find such a behavior in real catchments? We analyze catchment attributes, discharge and weather conditions from 1992 to 2018 for 88 catchments in Hesse, Germany. All catchments have similar weather conditions, but a wide range of catchment characteristics. We find that only a fraction of catchments follow a roughly exponential behavior in their storage-discharge relationship. Far more catchments are complex and depict irregular patterns with even extreme variation from 1 year to another. This large set of catchments with similar weather conditions reveals that physical attributes that drive catchment complexity are diverse and include soil permeability, hydraulic conductivity, geology, and soil type. We link the examined simple and complex behavior to the fill and spill hypotheses and the interconnectedness of the catchments. Simpler catchments have more preferential flow and more connected hillslopes and thus lower runoff generation thresholds. This creates a more straightforward relationship between storage and discharge.
Introduction
What determines how a catchment reacts to a specific climatic forcing? A seemingly simple question, which is still hard to answer conclusively (Sivapalan, 2005; Clark et al., 2016). This is mainly because every catchment is unique and thus slightly different to even the ones most similar to it (Beven, 2000). Still, we find similarities in catchment behavior, ranging from hillslope (Loritz et al., 2018) to continental scales (Kuentz et al., 2017). We have even made progress in predictions of behavior in ungauged basins (Hrachowitz et al., 2013). Still, we need to find more reliable ways to transfer our understanding of hydrological processes between catchments.
There are many different approaches in trying to quantify and understand the similarity between catchments. One approach is to take a large sample of catchments, sort them into groups of similar behavior and then examine which characteristics they share (Berghuijs et al., 2014; Kuentz et al., 2017; Jehn et al., 2020). This can also be done the other way around, thus starting from similar catchment characteristics and then study the catchment behavior (Knoben et al., 2018). Others derive understanding of catchment behavior from studies of experimental hillslopes or catchments like Tromp-van Meerveld and McDonnell (2006). However, there are also more theoretical approaches, such as using hydrological models to infer the underlying processes in the catchment (Clark et al., 2011; Fenicia et al., 2014). There are also approaches that try to link catchment behavior to thermodynamic theory (Loritz et al., 2018, 2019) or to elegant mathematical approaches (Kirchner, 2009; Savenije, 2018).
This study is inspired by earlier works about recession and water balance that show that hydrological recession behavior can often be described with exponential functions, if no additional water is added. This implies that the outflow is proportional to storage and the underlying aquifer reacts like a single linear reservoir (Tallaksen, 1995; Wittenberg, 1999). However, it remains unclear how often this “simple” behavior really occurs in catchments and on what scales it is present. Those dynamics can be explored by examining a large sample of storage-discharge relationships. Using the storage-discharge relationship to explore catchment dynamics is not a new idea (e.g., Kirchner, 2009; Spence, 2010; Sayama et al., 2011), but is seen as a valuable way to improve the understanding of catchments (Tetzlaff et al., 2011). Especially dynamic storage behaviors of catchments provide a way for comparing catchments across landscapes (Spence, 2010; Buttle, 2016).
Studies of storage change often consider only few catchments (e.g., Geris et al., 2015; Cheng et al., 2017; Floriancic et al., 2018), or focus on a single catchment attribute class, like topography (Liu et al., 2016; Staudinger et al., 2017), geology (Sayama et al., 2011; Creutzfeldt et al., 2014; Pfister et al., 2017) or vegetation (Geris et al., 2015; Cheng et al., 2017). This makes it hard for generalization, as these investigations only capture a snapshot of catchment attributes and their effect on hydrological behavior. Therefore, studies using large sample sizes are needed that explore the storage-discharge relationship in complex landscapes that have similar climate conditions (Loritz et al., 2019). At best, the selection of catchments should consider similar climate conditions so that the boundary conditions are similar and catchment behavior is not governed by hydrometric differences. This will help connecting the knowledge gained of more theoretical approaches (Wittenberg, 1999; Kirchner, 2009) with experimental studies that examine single hillslopes in depth and highlight the importance of physical processes like preferential flow (Wienhöfer and Zehe, 2014). We use a dataset of 88 catchments from the federal state of Hesse, Germany, that features a wide range of catchment attributes, while having a relatively similar climate. To address all factors that are commonly attributed to influence hydrological behavior, we study catchment area, catchment shape, soil, geology, topography, and land use (Sivapalan, 2005) and use the storage-discharge relationship as a proxy of catchment complexity. The more the storage-discharge relationship fits an exponential function, the simpler we view the behavior of that catchment.
The aim of this study is to scrutinize catchments with a varying complexity of their storage-discharge relationship and explore which catchment attributes are linked to this changing complexity using a large dataset. This focus on how much catchments obey a “simple” mode of behavior will highlight which processes are active or dominant in different locations and will help to understand causes of hydrological similarity.
Materials and Methods
Study Area
We analyze a database of 88 catchments located in the state of Hesse, Germany (Figure 1) with discharge and climatic data over 26 years (1992–2018), resulting in 2,314 separate catchment years. Rivers with major technical structures that obstruct the discharge by artificial impoundment (e.g., reservoir) are excluded from the analysis. However, some of the rivers have floodgates. As Hesse has a very diverse geology (HLNUG, 2007), it allows very different types of catchments to be considered under similar climatic conditions. Still, the climate has a considerable range, especially in the precipitation (Figure 2). This is a compromise between climatic similarity and sample size. We included climatic data in our analysis to determine the influence on the final results. Overall, the climate is humid and typical for Central Europe. To capture all factors that are usually attributed to influence the storage-discharge relationship, we investigate 15 attributes of climate (evapotranspiration, runoff-ratio, precipitation), land use, topography (slope, elongation ratio, area), soils (soil texture, soil type, soil depths), and geology (aquifer hydraulic conductivity, geology type, permeability) and water flow (discharge, ground water recharge). These attributes show a wide variety in the database (Figure 2). Snow was not explicitly considered in this study as Stoelzle et al. (2020) showed that in a similar set of catchments snow had only minor influence on streamflow if the catchments were below 800 m a.s.l., which is the case for the catchments in this study.
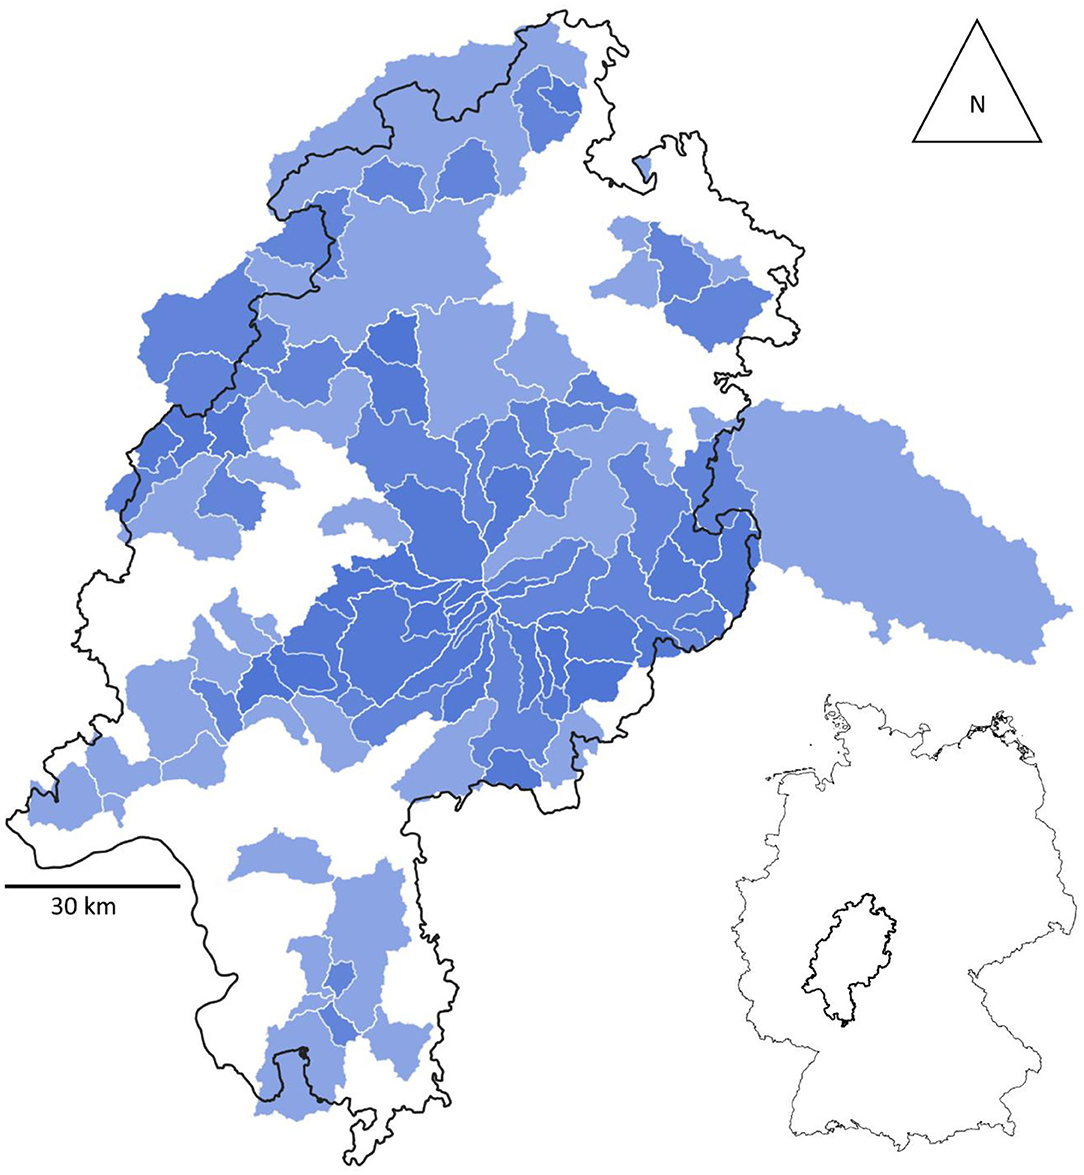
Figure 1. Locations of the catchments in Hesse and location of Hesse in Germany. Darker blues indicate nested catchments.
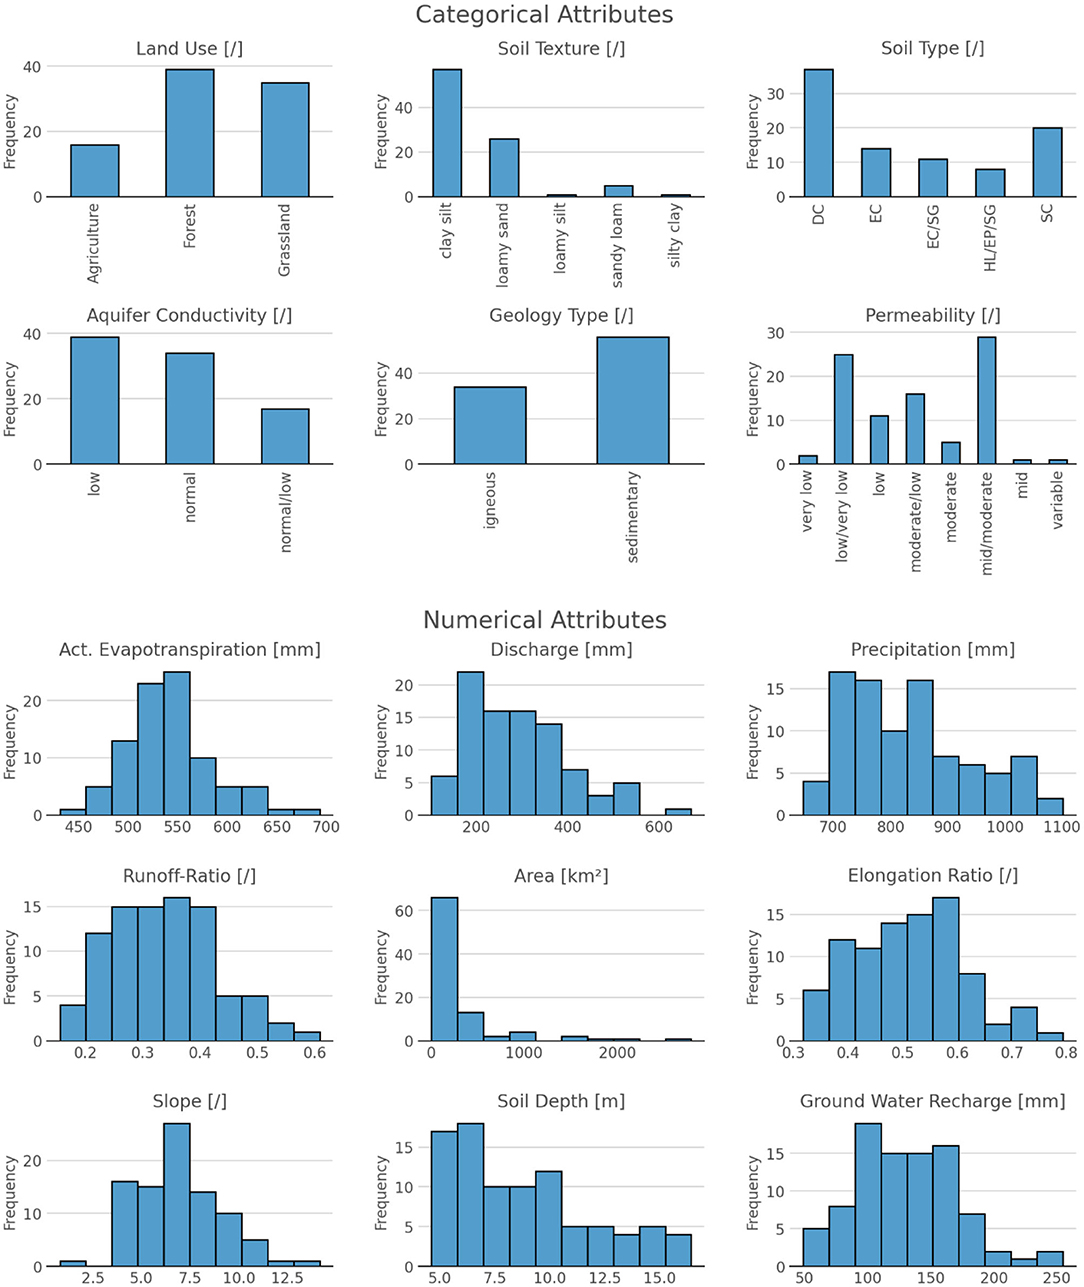
Figure 2. Attributes of the 88 catchments considered in this study. Climatic attributes of the catchment are the mean for all years. Soil type abbreviations: DC, Dystric Cambisol; EC, Eutric Cambisol; SC, Spodic Cambisol; SG, Stagnic Gleysol; HP, Haplic Luvisol; EP, Eutric Podzuluvisol.
Data Sources
All soil and geology data are extracted from maps of the Federal Institute for Geosciences and Natural Resources (namely the HUEK 250 hydrogeology, GWN1000 groundwater, BOART 1,000 soil texture, BK 500 soil type and PHYSGRU 1,000 soil depth maps). The values for the catchments were extracted from those maps with QGIS. Numerical attributes were averaged over the catchment. Categorical attributes used the dominant/highest value (e.g., a catchment with more than 50% grassland was classified as grassland). The coarse resolution of the land cover data results in few cover types, so selecting the one with the highest portion is likely to distinguish the most extensive. Discharge is provided by the Hessian Agency for Nature Conservation, Environment and Geology (https://www.hlnug.de/static/pegel/wiskiweb2/). Further long-term data, which is not available online, can be obtained by contacting the Hessian Agency for Nature Conservation, Environment and Geology. Data on precipitation and evapotranspiration is obtained from the REGNIE project of the German Weather Service (https://www.dwd.de/DE/leistungen/regnie/regnie). The original raster datasets can be downloaded from the Climate Data Center of the German Weather Service (https://www.dwd.de/DE/klimaumwelt/cdc/cdc_node.html). The temporal resolution for discharge, evapotranspiration and precipitation is daily. The areas based values of water budget fluxes in mm per catchment can be found in the repository of this paper (Jehn, 2020). The elongation ratio (i.e., the ratio of the diameter of a circle of the same area as the basin to the maximum flow length) is assessed following (Sukristiyanti et al., 2018). Slope and catchment area are derived from a digital elevation map with a resolution of 40 × 40 m. The runoff-ratio is calculated from discharge and precipitation. All water fluxes (discharge, precipitation, evapotranspiration) are converted to mm.
The REGNIE evapotranspiration data are calculated with the AMBAV model (Löpmeier, 1994), assuming a homogenous land cover of grass over sandy loam. As land uses and soils are often very different in the catchments considered, we correct the evapotranspiration accordingly. For this, we assume a storage change of zero over a long period, representing a closed water balance. Based on the uncorrected water balance and the total evapotranspiration over the whole time period we calculate the water balance error relative to the evapotranspiration. This results in catchment specific correction factors for the evapotranspiration, so that the storage change equals zero over the 26 years period. This procedure increased the mean actual evapotranspiration over all catchments from 431 to 541 mm per year, which is equivalent to the long term mean of 530 mm per year for Hesse (KLIWA et al., 2017). Both the start year 1992 and the end year 2018 have similar drought conditions as indicated by the standardized precipitation index (McKee et al., 1993) of −10 for 1992 and −12 for 2018 and therefore the long term change in storage can be assumed to be close to zero.
Annual Cumulative Storage Change
As the storage of a catchment cannot be measured directly, we approximate the storage following the basic water balance equation (Equation 1).
With daily precipitation P [mm], evapotranspiration ET [mm], discharge Q [mm] and storage change △S [mm]. We use Equation (2) to calculate the annual cumulative storage relative to the state at the beginning day (τ = 0) of a hydrological year (1st Nov - 31st Oct) using daily data. This means storage change is calculated on daily basis. Based on this we determine the cumulative sum of the storage, resulting in the vector S′cum that contains the cumulative sum of the storage change for every day.
This is done for every hydrological year separately to avoid the accumulation of errors in the measurements and to allow inter-annual comparisons. Note that this annual cumulative storage change does not capture the total storage of a catchment, but is a proxy of the active/dynamic storage changes as defined by Staudinger et al. (2017) and McNamara et al. (2011).
Complexity of Storage-Discharge Relationship
After calculating the annual cumulative storage, we evaluate the relationship between the annual cumulative storage change and the discharge. As we want to test how well-catchments follow an exponential storage-discharge relationship, we test how well the storage-discharge relationship can be fitted with an exponential function (Equation 3). As a functional approach we are using an exponential relationship of discharge with the storage as proposed in the baseflow component of TOPMODEL (Beven and Kirkby, 1979) [described in the supplement of Knoben et al. (2019)]. However, this relationship could also be described power function (see e.g., Kirchner, 2009).
with discharge Q [mm d−1], shape parameters a and b [-], as well as cumulative storage change △S' [mm d−1]. To fit the function to the data we used the curve_fit module of the Python package scipy (version 1.4.1), which uses a non-linear least squares fit. We only use days without precipitation to avoid a direct influence of precipitation on the discharge (Kirchner, 2009). This step allows us to estimate how much the real data deviate from the exponential function (Figure 3), by calculating the Kling-Gupta efficiency (KGE) (Gupta et al., 2009). A KGE of 1 describes a catchment with perfectly exponential behavior in a given year. This results in 27 (one per year) separate fits (as described in Figure 3), and therefore KGE values, for every catchment.
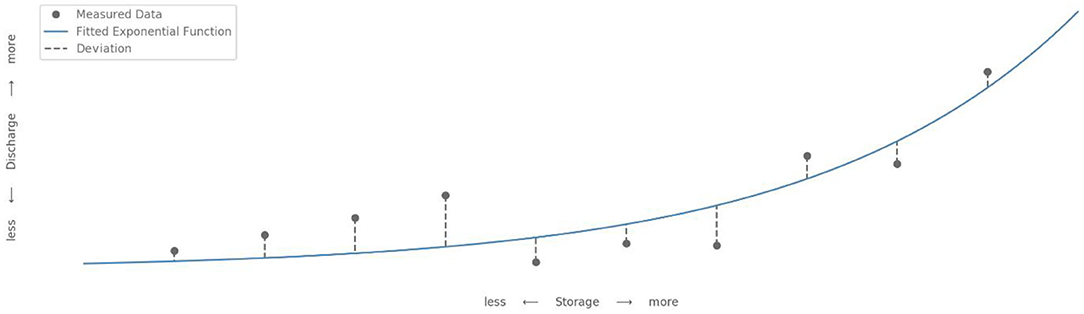
Figure 3. Visualization of the deviation of the measured and the idealized storage-discharge relationship (artificial data).
This KGE is a proxy for the catchment's complexity. The lower the combined residuals are the simpler is the catchment. Therefore, catchments in this study that are described as simple refer to a storage-discharge relationship for a given year and catchment, which follow an exponential function without much deviation. Complex behavior on the other hand refers to a storage-discharge relationship which deviates substantially from an exponential function. We use the unbinned KGE in Table 1 (section Differences in Catchment Attributes Between Simple and Complex Catchments) to determine if there is a relationship among catchment attributes and complexity for the complete dataset.
To detect the effect of the catchment attributes on the storage-discharge relationship, we bin the 20% of catchments (n = 18) together with the lowest/highest mean KGE and refer to them as being simple/complex. We use this in the analyses in Figure 6 (section Differences in Catchment Attributes Between Simple and Complex Catchments) to highlight the differences between the most extreme catchments. We compare the mean KGE for all years of all catchments with catchment attributes using linear regression (for the numerical attributes) and ANOVA (for categorical attributes). All slopes of the linear regressions are tested, if they are significantly different from zero. To keep the rate of false positive results low, we corrected all p-values by multiplying them with the overall amount of statistical tests done in this study [Bonferroni adjustment (Haynes, 2013)]. Significant in this study refers to a significance level of 1%.
To delineate the differences between simple, complex catchments and the overall dataset, we calculate an ANOVA for the numerical attributes with the same correction as mentioned above. The categorical attributes are compared qualitatively.
Results and Discussion
Complexity of the Storage-Discharge Relationship
The storage-discharge relationship shows four groups of different behaviors (Figure 4). Many storage-discharge relationships show almost perfect exponential behavior (Figure 4A). Those catchments are identified as simple. The other patterns (Figures 4B–D) cannot be fitted with a simple function. Hence, we conclude them complex. Complex behavior comes in three distinct types. Simple behavior is more strictly defined than complex behavior, as it can only arise from the pattern seen in Figure 4A. The first complex type (Figure 4B) has a relationship where the catchment has a distinct peak discharge at the beginning of the year. After that peak it dries up and later refills. However, during refilling the catchment does not show an increase in discharge, even though it is also defined by storing more water than at the beginning of the year. The second complex type (Figure 4C) also has peak discharge at the beginning of the year and dries up after that. However, in contrast to the others, peak discharge can be found at low storage as well. The third complex type (Figure 4D) shows erratic behavior with no clear pattern. In addition, the behavior of catchments often varies from year to year (Figure 5).
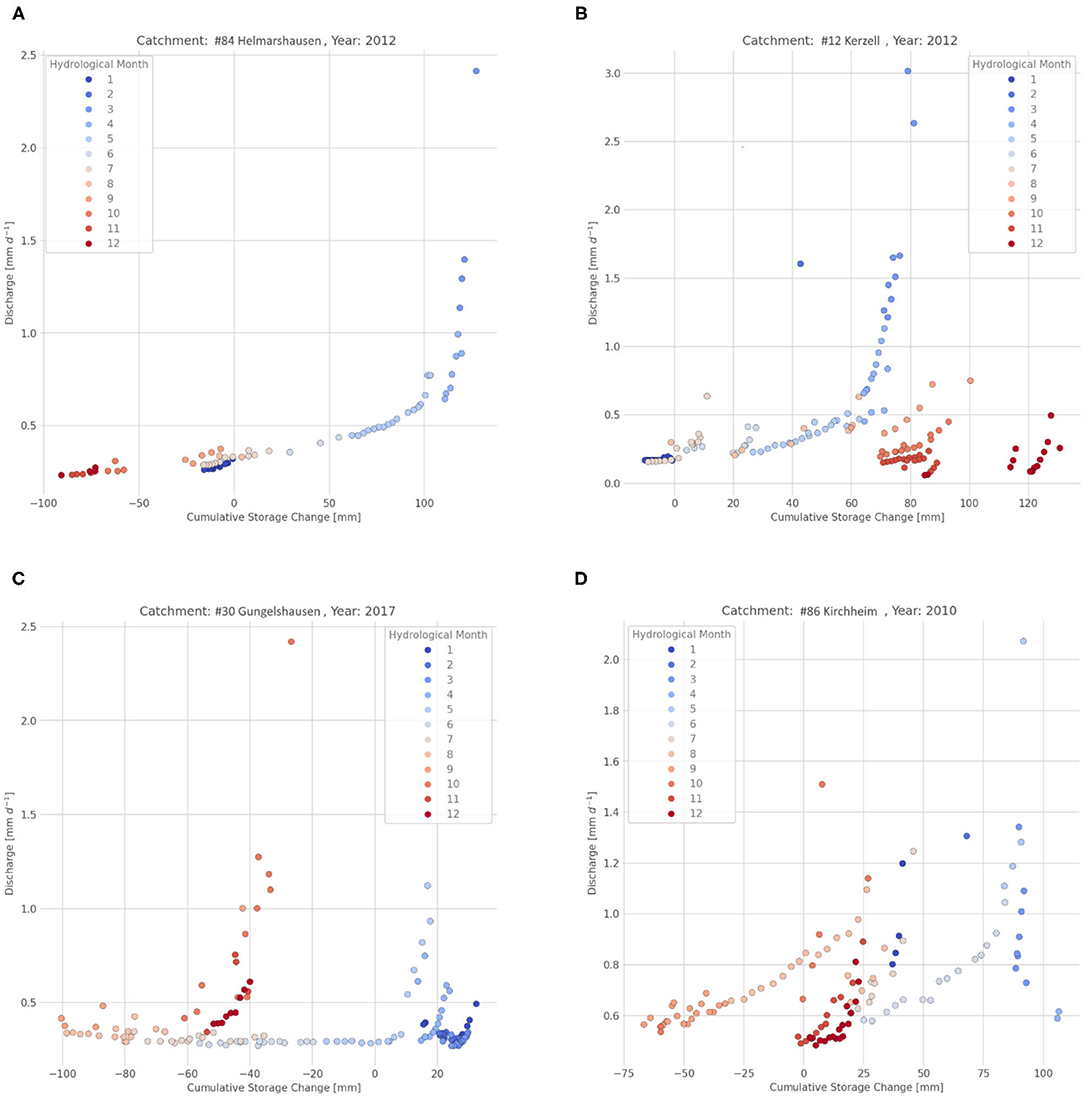
Figure 4. Plots show cumulative change in storage against discharge during recession periods in a hydrological year. Color indicates the month of the hydrological year. Examples of the patterns in the storage-discharge relationship. (A) an almost perfectly exponential storage-discharge relationship (B) low discharge, even though the storage is higher than at previous peak discharge (C) peak discharge, even though the storage is lower than at previous peak discharge (D) erratic behavior.
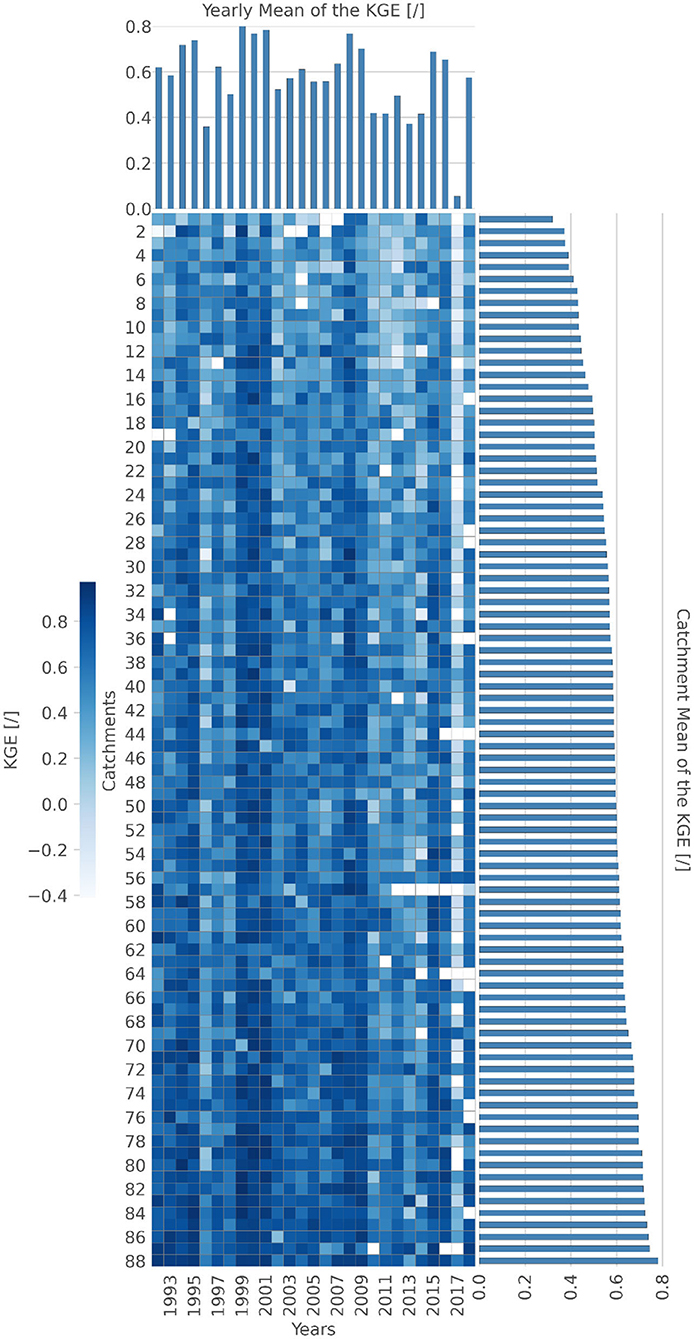
Figure 5. Heatmap of the Kling-Gupta Efficiency (KGE) (measure of catchment complexity) for the 88 catchments of the Hesse dataset, separated by years. Darker colors indicate lower complexity. Bar charts depict the mean values for the rows and columns.
The complexity of a catchment's storage-discharge relationship as described in section Complexity of Storage-Discharge Relationship can show a wide range (Figure 5). Some of the catchments depict a low complexity (e.g., catchment #88) for the every year. Contrasting, none of the catchments are characterized by a high complexity during all years. Nevertheless, several catchments indicate a rather complex behavior most of the time (e.g., catchment #1). In general, the complexity (when measured as the catchment's mean KGE) changes by more than a factor of two between the most simple and the most complex catchments. This reflects the variability among catchments with an almost perfect exponential storage-discharge relationship and those of primarily erratic behavior. Even though we can order the catchments according to their complexity, we see that complexity varies greatly from year to year, even in the most complex catchments. For example, catchment #1, which has the highest complexity of all catchments, we still find years with very low complexity. We can also see the same pattern for the complexity of the years. For example, 2017 is the most complex of all years, but also has catchments with a very low complexity (e.g., #56, #69, or #76). We verified the reliability of our approach by using the mean sum of least squares and the Nash-Sutcliffe efficiency as alternative objective functions. This resulted in almost exactly the same results for both years and catchments.
The interannual variability suggests weather conditions play an important role in the complexity of the identified storage-discharge relationship. Both, years (histogram on the top of Figure 5) and catchments (histogram to the right of Figure 5), exhibit the same mean (meanyears = 0.013, meancatchments = 0.013) and similar standard deviation (std) (stdyears = 0.006, stdcatchments = 0.012) for their respective mean KGE. Several years show a very simple storage-discharge relationship across all catchments (e.g., 1999, 2001). As with the catchments, the factor between the most complex and most simple year is larger than two. Those most complex years are characterized by a negative standardized precipitation index (McKee et al., 1993), which is an indicator for drought conditions. This might be linked to processes analogous to fill and spill runoff generation (Tromp-van Meerveld and McDonnell, 2006) and more generally a function of the hydrological connectivity of the catchments (Bracken and Croke, 2007). In drier years, the catchments could be less connected and thus show more erratic behavior, while years with more precipitation allow more stable connections, both spatially and in time. This higher connectedness could lead to simpler behavior, as the amount of water in the river is more directly connected with the amount of water in the catchment. Interestingly, while the three most complex years (1996, 2013, 2017) all have a negative standardized precipitation index (McKee et al., 1993), none of them is considered a drought year (Erfurt et al., 2020). Thus, a severe drought cuts most connections in the catchment and only leaves groundwater as the main contributor to streamflow, which again results in simpler behavior. In addition, all three of the most complex years have at least 1 month with precipitation >150 mm. This can also be linked to the approach of Loritz et al. (2018), which uses information theoretic and thermodynamic reasoning in combination with topographic information to study how the entropy of the hillslopes in a catchment changes of time. They show that the entropy and thus complexity increases strongly to large precipitation events after dry periods in the summer. They also highlight that this emerging behavior is caused by the interaction of different parts (in this case hillslopes) of the catchment.
This influence of large precipitation events on catchment complexity can also be found in other studies. For example (Capell et al., 2012) studied a catchment that was split between more mountainous uplands and lowlands with sand stone. The lowlands usually experienced linear discharge recession behavior, except when large precipitation events were recorded in the uplands. We conclude that this is probably the difference between the discharge being mainly baseflow provided from the valley bottom or stormflow generated in the upper stream reaches. The catchments cannot take up all the additional water due to large precipitation events, either because rainfall intensity exceeds infiltration capacity or catchments reach a storage capacity (Teuling et al., 2010; Sayama et al., 2011).
Another factor that might contribute to the complexity of the storage-discharge relationship is hysteresis. Hysteresis has been found to influence hydrological behavior at different scales (Zuecco et al., 2016). In this study, we use hydrological years to avoid cutting off a long time hysteresis process before it has ceased. However, hysteresis processes that start before or end after a hydrological year are not fully covered by our approach, but are important for catchments with low aquifer conductivity (Hellwig et al., 2020). Thus, more complex years and catchments might be an indicator of long term storage-discharge hysteresis that are triggered by reaching certain storage thresholds (Spence, 2010). It might also be the case that simple/complex behavior is a proxy for less/more hysteretic catchments. The more connected a catchment is, the more direct is the relationship between its storage and the discharge.
Differences in Catchment Attributes Between Simple and Complex Catchments
To find the most consistently simple and complex catchments, we use 20% of the catchments with the highest catchment mean KGE and the 20% with the lowest catchment mean KGE (Figure 5). We only analyze those catchment attributes that show a significant relationship in the whole dataset (Table 1). This removes the soil depth from the further analysis, as it shows no significant differences concerning the KGE. When we compare the remaining attributes of the simple and complex catchments with each other and the overall dataset, we can see clear differences, especially in the categorical catchment attributes (Figure 6):
- Simple catchments: Normal aquifer conductivity and permeability, regions with igneous geology, clay silt soil texture, wide range of soil types, more grassland and forest.
- Complex catchments: Low aquifer conductivity and permeability, regions with sedimentary geology, loamy sand soil texture, dystric cambisols, more agriculture.
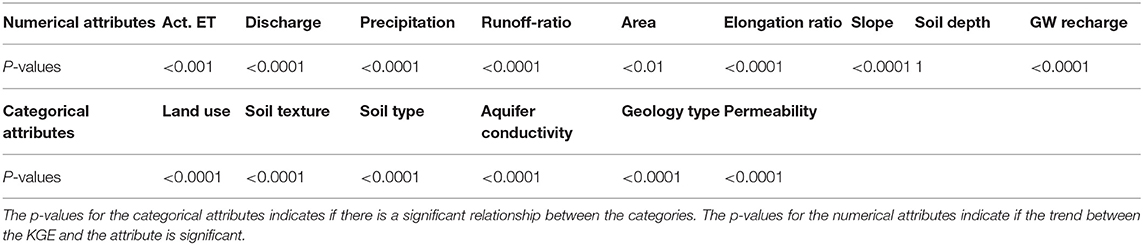
Table 1. Differences in the Kling-Gupta Efficiency for the categorical and numerical catchment attributes for all years of all catchments.
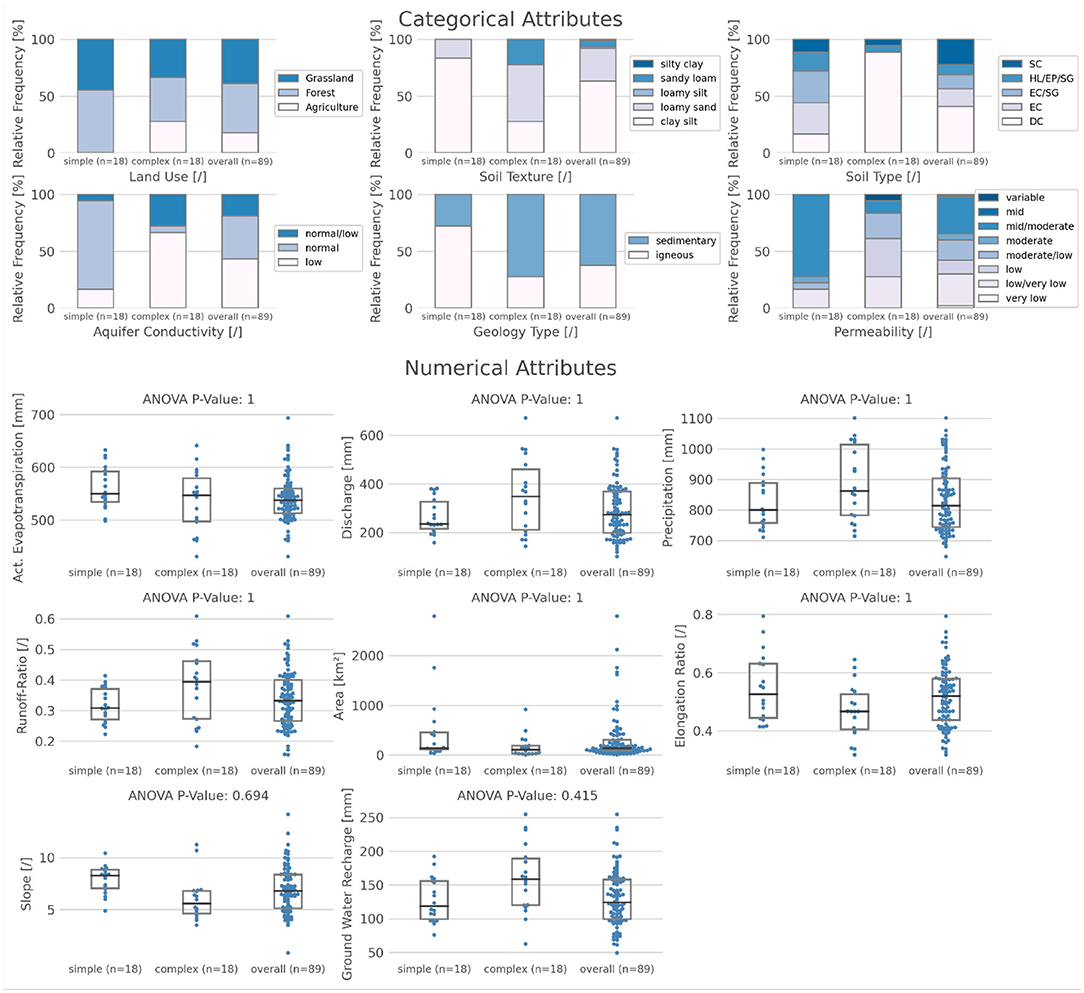
Figure 6. Differences in the categorical (top five panels) and numerical (bottom six panels) catchment attributes between simple and complex catchments and the overall dataset. Only those attributes are shown that have a significant trend over the whole dataset. Simple and complex refers to the 20% of the catchments (n = 18), which have the lowest/highest catchment Kling-Gupta Efficiency (KGE) considered. The p-values on top of the box plots for the numerical attributes indicate significant differences between the simple, complex and all catchments. Black line is the median and gray lines show the interquartile range. Soil type abbreviations: DC, Dystric Cambisol; EC, Eutric Cambisol; SC, Spodic Cambisol; SG, Stagnic Gleysol; HP, Haplic Luvisol; EP, Eutric Podzuluvisol.
The trend is less clear for the numerical catchment attributes. Simpler catchments tend to be steeper, while complex catchments are more flat. However, this trend is not significant. All other catchment attributes from Figure 2 do not influence the complexity of the storage-discharge relationship, at least not to an extend that is detectable with our method. As expected, climatic attributes, which are relatively similar for all catchments, are also not relevant. These results might also explain why it is easier to find the important drivers for the behavior of extreme 20% most simple/complex catchments than for the remaining catchments (Singh et al., 2014). While the most simple/complex catchments have attributes that have a considerable influence on the hydrological behavior, the other catchments lie somewhere in between (Figure 5). These “in between” catchments have a compensating mix of attributes, which makes it very hard to disentangle the specific attributes that control complexity. This variation in catchment attribute influence has also been found for parts of a single catchment (Sun et al., 2014) and small sample studies (e.g., Hoylman et al., 2019).
Therefore, this study highlights what kind of catchment attributes are important when we have a large sample of catchments that all have a similar climate conditions. Our study found an influence of evapotranspiration and precipitation on the overall dataset (Table 1), but not in the behavior of the most simple and complex catchments (Figure 6). The trend of the evaporation is significant for the complete dataset, but not significant when comparing the most simple with the most complex catchments. Contrasting, large sample studies conducted over larger scales usually that climate has a larger influence (Oudin et al., 2010; Kuentz et al., 2017). This highlights that both climate and catchment attributes are important but on different scales. While the overall behavior is determined by the climate, this climatic signal is shaped by the catchment attributes, specifically soils and geology.
Relationship of Catchment Complexity and Hydrological Processes
Our results show that there are clear differences in the characteristics of simple and complex catchments. Interestingly, the attributes of both, simple and complex catchments show deviation in their attribute values of similar size from the overall dataset (Figure 6). This is unexpected, as there are several modes of complex behavior (Figure 4). Therefore, complex catchments should show a wider diversity of their attributes than simple catchments, if their complex behavior is caused by separate processes. This is not the case, which hints that the same underlying hydrological processes cause all the modes of complex behavior. Studies have highlighted that especially in humid and mountainous catchments subsurface stormflow is one of the main runoff generation processes (Wittenberg, 1999; Wienhöfer and Zehe, 2014; Chifflard et al., 2019) and that overall connectivity in a catchment defines its behavior (Jencso et al., 2009). This could also explains the results of this study. Simple catchments show high permeability and conductivity, while complex catchments show low permeability, and conductivity. We therefore conclude that catchment complexity might simply be a proxy for catchment connectivity. Connectivity is to be understood herein as the combination of connections between hillslopes and riparian zone (Jencso et al., 2009) and the interconnectedness within hillslope (Tromp-van Meerveld and McDonnell, 2006). One possible explanation for the higher permeability and connectivity in the simpler catchment might be earthworms, as they prefer clay silt soils of those catchment (Curry, 2004) and increase preferential flow (Zehe et al., 2010). This also relates to the concept of thermodynamic equilibria discussed in Loritz et al. (2018). More permeable and connected catchments return quicker to their thermodynamic equilibria and thus show more simple behavior, while less connected and less permeable catchments need longer to return to their equilibrium and show more complex behavior.
This concept of connectivity can also be linked to threshold behavior, which has been identified as an important factor for catchment behavior (Spence, 2010; Tetzlaff et al., 2011) at both hillslope (Tromp-van Meerveld and McDonnell, 2006) and catchment scale (Jencso et al., 2009). Simple catchments might have lower thresholds, as they are always more interconnected due to their higher permeability and conductivity. Those lower thresholds could allow a more direct connection between the overall amount of water in the catchment and the discharge. For complex catchments, this is less the case, as they could have more isolated hillslopes and thus spill behavior happens more erratically. In essence, the amount of water in the catchment is less important without a connection to the river.
Summary and Conclusion
This study looks at the complexity of the storage-discharge relationship of 88 catchments in Hesse, Germany. The most simple and complex catchments show clear differences in their conductivity, permeability, geology and soils. The signal of weather patterns is transformed differently, depending on the catchment attributes. This leads to simple behavior for some catchment and to more complex for others. It is not uncommon for small and large scale studies to have contrasting results regarding the influence of climate on catchment response. The role of climate needs to be controlled in such studies in order to determine the influence of non-climatic factors, as we did in this study.
To further explore the importance of catchment attributes in relation to climate, additional studies in different climates are needed, as this study only focused on humid catchments in central Germany. What we finally need to understand is why certain catchments behave simple in 1 year and complex in another. Possible causes are extreme weather events, a complex interaction between the distribution of precipitation, the geology and the soils of a catchment and connecting and disconnecting of different stores in the catchment. All those attributes and processes ultimately define the catchment's active storage. We link the observed simple and complex behavior of catchments to the fill and spill hypotheses and the interconnectedness of spatial entities within a catchment. Simpler catchments have more preferential flow and more connected hillslopes and thus lower spill thresholds. High hydrological connectivity provides a more direct link from storage to discharge and implies that the simplicity of catchment is linked to certain hydrological processes being active or dominant. Further research should explore how this catchment simplicity can be linked to predictability of streamflow.
Data Availability Statement
The datasets presented in this study can be found in online repositories. The names of the repository and accession number(s) can be found at: Code and data is stored in http://doi.org/10.5281/zenodo.4282470.
Author Contributions
FJ, LB, TH, and PK conceived and designed the study. FJ did the data analysis. All authors helped with the interpretation and discussion of the results and with the writing of the manuscript.
Conflict of Interest
The authors declare that the research was conducted in the absence of any commercial or financial relationships that could be construed as a potential conflict of interest.
Acknowledgments
We would like to thank the editor and the reviewers, especially Christopher Spence, who helped improve this paper. We would further like to thank Keirnan Fowler in giving valuable feedback on an earlier draft of this paper. TH acknowledges funding by the German Science Foundation DFG (HO 6420/1-1).
References
Berghuijs, W. R., Sivapalan, M., Woods, R. A., and Savenije, H. H. G. (2014). Patterns of similarity of seasonal water balances: a window into streamflow variability over a range of time scales. Water Resour. Res. 50, 5638–5661. doi: 10.1002/2014WR015692
Beven, K. J. (2000). Uniqueness of place and process representations in hydrological modeling. Hydrol. Earth Syst. Sci. 4, 203–213. doi: 10.5194/hess-4-203-2000
Beven, K. J., and Kirkby, M. J. (1979). A physically based, variable contributing area model of basin hydrology. Hydrol. Sci. Bull. 24, 43–69. doi: 10.1080/02626667909491834
Bracken, L. J., and Croke, J. (2007). The concept of hydrological connectivity and its contribution to understanding runoff-dominated geomorphic systems. Hydrol. Process. 21, 1749–1763. doi: 10.1002/hyp.6313
Buttle, J. M. (2016). Dynamic storage: a potential metric of inter-basin differences in storage properties: dynamic storage: metric of inter-basin differences in storage. Hydrol. Process. 30, 4644–4653. doi: 10.1002/hyp.10931
Capell, R., Tetzlaff, D., Hartley, A. J., and Soulsby, C. (2012). Linking metrics of hydrological function and transit times to landscape controls in a heterogeneous mesoscale catchment. Hydrol. Process. 26, 405–420. doi: 10.1002/hyp.8139
Cheng, L., Zhang, L., Chiew, F. H. S., Canadell, J. G., Zhao, F., Wang, Y.-P., et al. (2017). Quantifying the impacts of vegetation changes on catchment storage-discharge dynamics using paired-catchment data: vegetation changes on storage-discharge. Water Resour. Res. 53, 5963–5979. doi: 10.1002/2017WR020600
Chifflard, P., Blume, T., Maerker, K., Hopp, L., Meerveld, I., Graef, T., et al. (2019). How can we model subsurface stormflow at the catchment scale if we cannot measure it? Hydrol. Process. 33, 1378–1385. doi: 10.1002/hyp.13407
Clark, M. P., Kavetski, D., and Fenicia, F. (2011). Pursuing the method of multiple working hypotheses for hydrological modeling: hypothesis testing in hydrology. Water Resour. Res. 47:9. doi: 10.1029/2010WR009827
Clark, M. P., Schaefli, B., Schymanski, S. J., Samaniego, L., Luce, C. H., Jackson, B. M., et al. (2016). Improving the theoretical underpinnings of process-based hydrologic models: Narrowing the gap between hydrologic theory and models. Water Resour. Res. 52, 2350–2365. doi: 10.1002/2015WR017910
Creutzfeldt, B., Troch, P. A., Güntner, A., Ferré, T. P. A., Graeff, T., and Merz, B. (2014). Storage-discharge relationships at different catchment scales based on local high-precision gravimetry: water storage and discharge dynamics: a gravimeter perspective. Hydrol. Process. 28, 1465–1475. doi: 10.1002/hyp.9689
Curry, J. P. (2004). “Factors affecting the abundance of earthworms in soils,” in: Earthworm Ecology, ed C. A. Edwards (Boca Raton, FL: CRC Press). doi: 10.1201/9781420039719.pt3
Erfurt, M., Skiadaresis, G., Tijdeman, E., Blauhut, V., Bauhus, J., Glaser, R., et al. (2020). Exploring the added value of a long-term multidisciplinary dataset in drought research – a drought catalogue for southwestern Germany dating back to 1801, preprint. Hydrol. Hazards. doi: 10.5194/nhess-2019-424-supplement
Fenicia, F., Kavetski, D., Savenije, H. H. G., Clark, M. P., Schoups, G., Pfister, L., et al. (2014). Catchment properties, function, and conceptual model representation: is there a correspondence? Hydrol. Process. 28, 2451–2467. doi: 10.1002/hyp.9726
Floriancic, M. G., Meerveld, I., Smoorenburg, M., Margreth, M., Naef, F., Kirchner, J. W., et al. (2018). Spatio-temporal variability in contributions to low flows in the high alpine poschiavino catchment. Hydrol. Process. 32, 3938–3953. doi: 10.1002/hyp.13302
Geris, J., Tetzlaff, D., McDonnell, J., and Soulsby, C. (2015). The relative role of soil type and tree cover on water storage and transmission in northern headwater catchments: soil and vegetation effects on water storage and transmission. Hydrol. Process. 29, 1844–1860. doi: 10.1002/hyp.10289
Gupta, H. V., Kling, H., Yilmaz, K. K., and Martinez, G. F. (2009). Decomposition of the mean squared error and NSE performance criteria: implications for improving hydrological modelling. J. Hydrol. 377, 80–91. doi: 10.1016/j.jhydrol.2009.08.003
Haynes, W. (2013). “Bonferroni correction,” in: Encyclopedia of Systems Biology, eds W. Dubitzky, O. Wolkenhauer, K.-H. Cho, and H. Yokota (New York, NY: Springer). 154.
Hellwig, J., Stoelzle, M., and Stahl, K. (2020). Stress-testing groundwater and baseflow drought responses to synthetic climate change-informed recharge scenarios, preprint. Groundwater Hydrol. doi: 10.5194/hess-2020-211
HLNUG (2007). Geologische Übersichtskarte von Hessen, in: Umweltatlas Hessen. Available online at: http://atlas.umwelt.hessen.de/atlas/ (accessed January 13, 2021).
Hoylman, Z. H., Jencso, K. G., Hu, J., Holden, Z. A., Martin, J. T., and Gardner, W. P. (2019). The climatic water balance and topography control spatial patterns of atmospheric demand, soil moisture, and shallow subsurface flow. Water Res. Res. 55, 2370–2389. doi: 10.1029/2018WR023302
Hrachowitz, M., Savenije, H. H. G., Blöschl, G., McDonnell, J. J., Sivapalan, M., Pomeroy, J. W., et al. (2013). A decade of predictions in ungauged basins (PUB)—a review. Hydrol. Sci. J. 58, 1198–1255. doi: 10.1080/02626667.2013.803183
Jehn, F. U. (2020). zutn/Simple-Catchments-Hesse: Updated version for Frontiers in Water. doi: 10.5281/zenodo.3532653
Jehn, F. U., Bestian, K., Breuer, L., Kraft, P., and Houska, T. (2020). Using hydrological and climatic catchment clusters to explore drivers of catchment behavior. Hydrol. Earth Syst. Sci. 24, 1081–1100. doi: 10.5194/hess-24-1081-2020
Jencso, K. G., McGlynn, B. L., Gooseff, M. N., Wondzell, S. M., Bencala, K. E., and Marshall, L. A. (2009). Hydrologic connectivity between landscapes and streams: transferring reach- and plot-scale understanding to the catchment scale. Water Resour. Res. 45:4. doi: 10.1029/2008WR007225
Kirchner, J. W. (2009). Catchments as simple dynamical systems: catchment characterization, rainfall-runoff modeling, and doing hydrology backward. Water Res. Res. 45:2. doi: 10.1029/2008WR006912
KLIWA Landesanstalt für Umwelt, Messungen und Naturschutz Baden-Württemberg, Bayerisches Landesamt für Umweltschutz, Rheinland-Pfalz, Hessisches Landesamt für Naturschutz, Umwelt und Geologie and Deutscher Wetterdienst, (eds.)., (2017). Entwicklung von Bodenwasserhaushalt und Grundwasserneubildung in Baden-Württemberg, Bayern, Rheinland-Pfalz und Hessen (1951–2015): KLIWA-Projekt A 2.3.4: Langzeitverhalten des Grundwasserhaushalts, KLIWA-Projekt B 3.3.2: Simulation der Grundwasserneubildung mit weiteren regionalen Klimaprojekten, März 2017. LUBW, Karlsruhe.
Knoben, W. J. M., Freer, J. E., Fowler, K. J. A., Peel, M. C., and Woods, R. A. (2019). Modular assessment of rainfall–runoff models toolbox (MARRMoT) v1.2: an open-source, extendable framework providing implementations of 46 conceptual hydrologic models as continuous state-space formulations. Geosci. Model Dev. 12, 2463–2480. doi: 10.5194/gmd-12-2463-2019
Knoben, W. J. M., Woods, R. A., and Freer, J. E. (2018). A quantitative hydrological climate classification evaluated with independent streamflow data. Water Res. Res. 54, 5088–5109. doi: 10.1029/2018WR022913
Kuentz, A., Arheimer, B., Hundecha, Y., and Wagener, T. (2017). Understanding hydrologic variability across Europe through catchment classification. Hydrol. Earth Syst. Sci. 21, 2863–2879. doi: 10.5194/hess-21-2863-2017
Liu, J., Han, X., Chen, X., Lin, H., and Wang, A. (2016). How well can the subsurface storage-discharge relation be interpreted and predicted using the geometric factors in headwater areas?: interpreting storage-discharge relations using geometric factors. Hydrol. Process. 30, 4826–4840. doi: 10.1002/hyp.10958
Löpmeier, F.-J. (1994). Berechnung der bodenfeuchte und verdunstung mittels agrarmeteorologischer Modelle. Zeitschrift Bewaesserungswirtschaft 29, 157–167.
Loritz, R., Gupta, H., Jackisch, C., Westhoff, M., Kleidon, A., Ehret, U., et al. (2018). On the dynamic nature of hydrological similarity. Hydrol. Earth Syst. Sci. 22, 3663–3684. doi: 10.5194/hess-22-3663-2018
Loritz, R., Kleidon, A., Jackisch, C., Westhoff, M., Ehret, U., Gupta, H., et al. (2019). A topographic index explaining hydrological similarity by accounting for the joint controls of runoff formation. Hydrol. Earth Syst. Sci. Discus. doi: 10.5194/hess-2019-68
McKee, T. B., Doesken, N. J., and Kleist, J. (1993). “The relationship of drought frequency and duration to time scales,” in Proceedings of the Eighth Conference on Applied Climatology, American Meteorological Society (Anaheim, CA). 179–184.
McNamara, J. P., Tetzlaff, D., Bishop, K., Soulsby, C., Seyfried, M., Peters, N. E., et al. (2011). Storage as a metric of catchment comparison. Hydrol. Process. 25, 3364–3371. doi: 10.1002/hyp.8113
Oudin, L., Kay, A., Andréassian, V., and Perrin, C. (2010). Are seemingly physically similar catchments truly hydrologically similar? Water Res. Res. 46:11. doi: 10.1029/2009WR008887
Pfister, L., Martínez-Carreras, N., Hissler, C., Klaus, J., Carrer, G. E., Stewart, M. K., et al. (2017). Bedrock geology controls on catchment storage, mixing, and release: a comparative analysis of 16 nested catchments. Hydrol. Process. 31, 1828–1845. doi: 10.1002/hyp.11134
Savenije, H. H. G. (2018). HESS Opinions: linking Darcy's equation to the linear reservoir. Hydrol. Earth Syst. Sci. 22, 1911–1916. doi: 10.5194/hess-22-1911-2018
Sayama, T., McDonnell, J. J., Dhakal, A., and Sullivan, K. (2011). How much water can a watershed store? Hydrol. Process. 25, 3899–3908. doi: 10.1002/hyp.8288
Singh, R., Archfield, S. A., and Wagener, T. (2014). Identifying dominant controls on hydrologic parameter transfer from gauged to ungauged catchments – a comparative hydrology approach. J. Hydrol. 517, 985–996. doi: 10.1016/j.jhydrol.2014.06.030
Sivapalan, M. (2005). “Pattern, process and function: elements of a unified theory of hydrology at the catchment scale, in: Encyclopedia of Hydrological Sciences, eds M. G. Anderson and J. J. McDonnell (Chichester: John Wiley & Sons, Ltd). doi: 10.1002/0470848944.hsa012
Spence, C. (2010). A paradigm shift in hydrology: storage thresholds across scales influence catchment runoff generation: paradigm shift in hydrology. Geograp. Comp. 4, 819–833. doi: 10.1111/j.1749-8198.2010.00341.x
Staudinger, M., Stoelzle, M., Seeger, S., Seibert, J., Weiler, M., and Stahl, K. (2017). Catchment water storage variation with elevation. Hydrol. Process. 31, 2000–2015. doi: 10.1002/hyp.11158
Stoelzle, M., Schuetz, T., Weiler, M., Stahl, K., and Tallaksen, L. M. (2020). Beyond binary baseflow separation: a delayed-flow index for multiple streamflow contributions. Hydrol. Earth Syst. Sci. 24, 849–867. doi: 10.5194/hess-24-849-2020
Sukristiyanti, S., Maria, R., and Lestiana, H. (2018). Watershed-based morphometric analysis: a review. IOP Confer. Series: Earth Environ. Sci. 118:012028. doi: 10.1088/1755-1315/118/1/012028
Sun, Y., Tian, F., Yang, L., and Hu, H. (2014). Exploring the spatial variability of contributions from climate variation and change in catchment properties to streamflow decrease in a mesoscale basin by three different methods. J. Hydrol. 508, 170–180. doi: 10.1016/j.jhydrol.2013.11.004
Tallaksen, L. M. (1995). A review of baseflow recession analysis. J. Hydrol. 165, 349–370. doi: 10.1016/0022-1694(94)02540-R
Tetzlaff, D., McNamara, J. P., and Carey, S. K. (2011). Measurements and modelling of storage dynamics across scales: measurements and modelling of storage dynamics across scales. Hydrol. Process. 25, 3831–3835. doi: 10.1002/hyp.8396
Teuling, A. J., Lehner, I., Kirchner, J. W., and Seneviratne, S. I. (2010). Catchments as simple dynamical systems: experience from a Swiss prealpine catchment. Water Res. Res. 46:11. doi: 10.1029/2009WR008777
Tromp-van Meerveld, H. J., and McDonnell, J. J. (2006). Threshold relations in subsurface stormflow: 2. The fill and spill hypothesis: threshold flow relations. Water Resour. Res. 42:2. doi: 10.1029/2004WR003800
Wienhöfer, J., and Zehe, E. (2014). Predicting subsurface stormflow response of a forested hillslope – the role of connected flow paths. Hydrol. Earth Syst. Sci. 18, 121–138. doi: 10.5194/hess-18-121-2014
Wittenberg, H. (1999). Baseflow recession and recharge as nonlinear storage processes. Hydrol. Process. 13, 715–726. doi: 10.1002/(SICI)1099-1085(19990415)13:5<7115::AID-HYP775>3.0.CO;2-N
Zehe, E., Blume, T., and Blöschl, G. (2010). The principle of ‘maximum energy dissipation’: a novel thermodynamic perspective on rapid water flow in connected soil structures. Phil. Trans. R. Soc. B 365, 1377–1386. doi: 10.1098/rstb.2009.0308
Keywords: storage-discharge relationship, catchment complexity, catchment hydrology, climatic forcing, catchment behavior, fill and spill, catchment interconnectedness, large sample hydrology
Citation: Jehn FU, Breuer L, Kraft P, Bestian K and Houska T (2021) Simple Catchments and Where to Find Them: The Storage-Discharge Relationship as a Proxy for Catchment Complexity. Front. Water 3:631651. doi: 10.3389/frwa.2021.631651
Received: 20 November 2020; Accepted: 04 January 2021;
Published: 04 February 2021.
Edited by:
Okke Batelaan, Flinders University, AustraliaReviewed by:
Kevin Bishop, Swedish University of Agricultural Sciences, SwedenChristopher Spence, Environment and Climate Change, Canada
Copyright © 2021 Jehn, Breuer, Kraft, Bestian and Houska. This is an open-access article distributed under the terms of the Creative Commons Attribution License (CC BY). The use, distribution or reproduction in other forums is permitted, provided the original author(s) and the copyright owner(s) are credited and that the original publication in this journal is cited, in accordance with accepted academic practice. No use, distribution or reproduction is permitted which does not comply with these terms.
*Correspondence: Florian U. Jehn, ZmxvcmlhbmplaG5AcG9zdGVvLmRl