 Hsin-Fu Yeh
- Department of Resources Engineering, National Cheng Kung University, Tainan, Taiwan
In recent years, Taiwan has been facing severe water shortages due to extreme drought. In addition, changes in rainfall patterns have resulted in an increasingly notable drought phenomenon, which affects the management and utilization of water resources. Therefore, this work examines basins in Central Taiwan. Long-term records from 13 rainfall and 17 groundwater stations were selected. The Standardized Precipitation Index (SPI) and Standardized Groundwater Level Index (SGI) were used to analyze the drought characteristics of this region. The rainfall and groundwater level data from basins in Central Taiwan were analyzed in this study. The results show that the year 2015 experienced extreme drought conditions due to a correlation with SPI and SGI signals. In addition, with regard to groundwater drought, more drought events occurred in the Da'an River basin; however, the duration and intensity of these events were relatively low, in contrast to those of the Wu River basin. Finally, the correlation between SPI and SGI was observed to vary in different basins, but a certain degree of correlation was observed in all basins. The results show that drought intensity increases with longer drought durations. Moreover, severe droughts caused by rainfall tend to occur at a greater frequency than those caused by groundwater.
Introduction
Climate abnormalities are regarded as major environmental threats in the twenty-first century. According to the 2007 report by the Intergovernmental Panel on Climate Change (IPCC), global surface temperatures have been increasing since the last 157 years with extremely large regional differences (IPCC Climate Change, 2007). Warming has intensified the global hydrologic cycle (Milly et al., 2002) and caused average global temperatures to increase, resulting in extreme hydrological events such as droughts or floods (Huntington, 2006; Jung et al., 2012; Gosling, 2014; Huang et al., 2017).
In recent years, droughts have been among the most severe environmental disasters. Droughts are complex and recurring environmental hazards that affect large areas, and have attracted the attention of scholars in various fields such as environment, ecology, hydrology, meteorology, geology, and agriculture. The main cause of droughts is a significant reduction in rainfall over a given period. Therefore, droughts can occur in any climatic region worldwide. Natural environmental factors, such as temperature, wind, and humidity, have important roles in the occurrence of droughts. Droughts decrease the supply of surface and groundwater resources, cause a degradation of water quality, decrease crop yields, and impact socioeconomic activities (Mishra and Singh, 2010; Tabari et al., 2013; Tsakiris, 2017). The environment is continuously affected by global meteorological and hydrological hazards, despite an improved understanding of extreme climate events in recent years and a significant improvement in environmental management with respect to scientific and technical aspects (Nafarzadegana et al., 2012; Tao et al., 2013). Because it is difficult to predict the occurrence of droughts, studies on the occurrence and development of droughts have important implications.
Wilhite and Glantz (1985) defined four types of droughts: meteorological, hydrological, agricultural, and socioeconomic. Among these, the meteorological, hydrological, and agricultural droughts are physical and result from a deficiency of water in the hydrological cycle (Bazrafshan et al., 2014). Studies on meteorological and hydrological droughts have attracted the most attention. Meteorological drought is the most basic of the drought types; it initiates the other three drought types, and is caused by reduced rainfall in a region for a certain period (Nalbantis and Tsakiris, 2009; Bierkens et al., 2013). Hydrological drought results from long periods of meteorological drought and includes groundwater and streamflow droughts.
When monitoring historical drought events, different methods can be used to analyze drought events and provide more information for the prediction of future droughts. These methods include the use of drought indices. To evaluate risk and formulate of alleviation measures for droughts, it is necessary to identify the severity of drought events. Therefore, many drought indicators were developed in the past to describe the characteristics of different drought types (Palmer, 1965; Shafer and Dezman, 1982; McKee et al., 1993; Tsakiris and Vangelis, 2005; Nalbantis, 2008; Nalbantis and Tsakiris, 2009; Sharma and Panu, 2010; Bloomfield and Marchant, 2013; Mu et al., 2013; Liu et al., 2017). Table 1 compares the most commonly used drought indices.
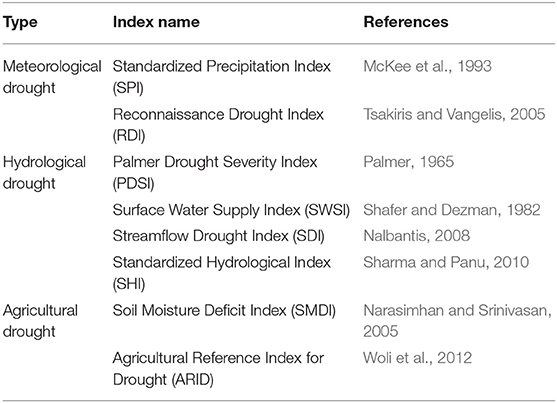
Table 1. Commonly used drought indices of three types (Yeh, 2019).
Among the various drought indicators that describe meteorological and hydrological droughts, most indicators require diverse data and complex calculations. In comparison, the Standardized Precipitation Index (SPI) and Standardized Groundwater Level Index (SGI) are effective and easy to manage. Therefore, these two indicators were selected in this study to evaluate drought characteristics at the study site.
Study Site
The study site was divided into three regions: the Da'an, Dajia, and Wu River basins. The Da'an River basin includes Taichung City and Miaoli County. Its main watercourse has a length of ~96 km and a drainage area of ~759 km2. The strata types downstream of the Da'an River are the Toukoshan Formation, the conglomerate layer, and the modern alluvium. The Toukoshan Formation consists of conglomerates and sandstone layers, while the modern alluvium contains gravel and clay. The main watercourse of the Dajia River has a length of ~124 km and a drainage area of 1,236 km2. The geological soil downstream of the basin mainly consists of alluvium and laterite layers. The main watercourse of the Wu River has a length of 119 km and its drainage area is 2,026 km2, which encompasses Taichung City and the Changhua and Nantou counties. In terms of geology, the downstream strata are mostly composed of alluvium consisting of gravel, sand, and mud. Among these regions, the Dadu Plateau mainly consists of thick sandstone, siltstone, and mudstone with occasional conglomerates containing the Toukoshan Formation. The Taichung Basin consists mainly of sandstone, shale, and the Cholan Formation (interbedded sandstone, shale, and mudstone).
The study site has a subtropical climate with high temperatures and humidity. The climate is greatly affected by the monsoon winds and the terrain. Rainfall mainly occurs from May to October, resulting in a greater amount of summer rain as compared to that of winter rain. The spatial distribution of rainfall is extremely unique due to terrain factors: the rainfall increases from west to east. The average annual rainfall at the study site is 1,733 cm (Central Weather Bureau, 2016). In this study, long-term observation data were collected from 13 rainfall stations and 17 groundwater stations to examine the drought characteristics in Central Taiwan. Table 2 shows information about the stations in various basins, while Figure 1 displays the spatial layout of various stations.
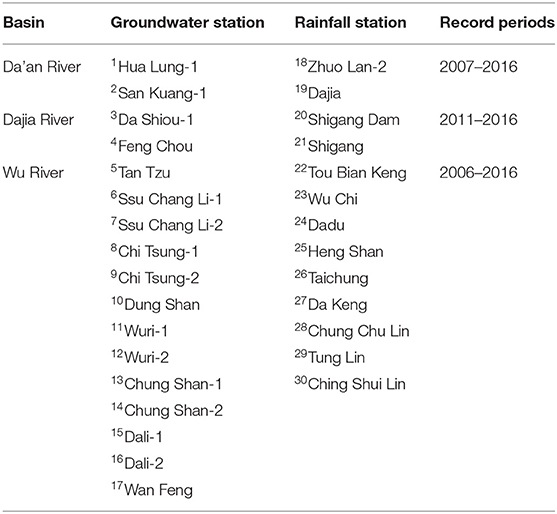
Table 2. Information for the 13 rainfall stations and 17 groundwater stations.
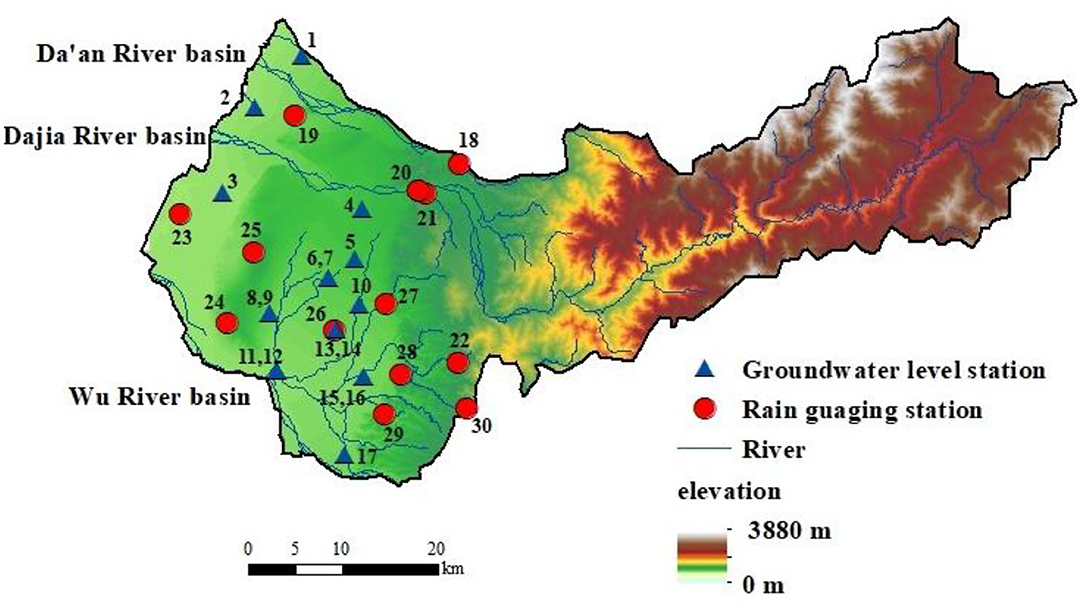
Figure 1. Topography of study site and location of the rainfall stations and groundwater stations used in the study.
Methodology
Standardized Precipitation Index (SPI) Method
The Standardized Precipitation Index (SPI) evaluation method was proposed by McKee et al. (1993) to assess the severity of meteorological drought events. In this method, cumulative precipitation data over different periods of time are used to calculate and examine the distribution and changes in drought severity over these periods. The results of this method can be used to gain insights into the severity, frequency, and occurrence cycle of regional drought events.
This analytical approach assumes that the average monthly rainfall data (Pi) are continuous. Pi accumulates according to the duration q of the period under analysis. This leads to the cumulative precipitation Ri,q for the duration q of the ith year, as expressed in Equation (1):
where Ri,q is the cumulative precipitation, q is the cumulative number of months, Pi is the average monthly precipitation (mm) for the current month, and Pj is the average monthly precipitation (mm) for the month projected ahead of Pi.
The statistical characteristics of the data must satisfy normal or logarithmic-normal (lognormal) distributions; however, actual precipitation patterns are instead better approximated by the Gamma distribution. Hence, these patterns must first be converted before the SPI can be used to analyze the precipitation data. This study used the two-parameter lognormal distribution function for conversion and for obtaining the natural logarithm of the flow data (Yeh, 2019). SPI can be defined as given in Equation (2):
where SPIq is the SPI value for precipitation over the cumulative duration q, Wi,q is the cumulative precipitation after the natural logarithm is obtained, is the mean, and Sw,q is the standard deviation. After the SPI value for each year is calculated, these values can be categorized to define the range of severity for the various drought events (Table 2).
Standardized Groundwater Level Index (SGI) Method
The Standardized Groundwater Level Index (SGI), developed by Bloomfield and Marchant (2013), describes the severity and characteristics of hydrological droughts. It can be applied to any timescale and can easily fulfill regional and application requirements. Therefore, SGI has been widely employed in hydrological drought research in recent years (Kumar et al., 2016; Loon et al., 2017; Rust et al., 2018; Hellwig et al., 2020) to analyze drought characteristics in many countries (Lorenzo-Lacruz et al., 2017). The SGI method is used to assess the severity of groundwater drought events. Specifically, continuous changes in the groundwater level are used for calculations to determine the distribution of drought severity and changes in the same. This provides insight into the severity, frequency, and occurrence cycle of regional drought events. In this study, calculations were performed using cumulative groundwater levels over different durations. Before the SGI value is assessed, the characteristics of its groundwater level data must be well-described by a normal distribution. Because the pattern of groundwater level data might have a Gamma distribution or be offset by extreme values (with the type of offset further divided into left or right categories), conversion of the statistical distribution patterns must be performed before the SGI can be used to analyze the groundwater level data. For this method, unlike the SPI method, it is not necessary to obtain the natural logarithm of the groundwater level data. The SGI is defined as given in Equation (4):
where SGIq is the SGI value for the groundwater level over the cumulative duration q, Li is the monthly average groundwater level, is the mean, and Sq is the standard deviation.
After the SGI value for each year was calculated, the SPI classification method presented in Table 2 was similarly used to define drought events with varying SGI degrees. The results of the SGI and SPI analyses of the study area were then compared to understand the drought characteristics. This comparison was then used to define the severity and duration of drought events that occurred within the study area.
Drought Identification Characteristics
The procedure described in sections Standardized Precipitation Index (SPI) method and Standardized Groundwater Level Index (SGI) method are used for generating drought index values. A drought event is defined as a period in which the index is continuously negative and reaches a given threshold (< -1). Drought classification is presented in Table 3. Usually, there are three drought characteristics to describe the drought event, namely the frequency (or number of drought events) (N), duration (D), and magnitude (M). The duration of a drought event is the number of months in which the index is below the threshold (−1). The magnitude of the drought event is the absolute value of the sum of index values during the event. The mean duration and mean magnitude were calculated to compare drought characteristics in the regional analysis. The mean duration was calculated as the duration divided by the number of drought events, and the mean magnitude is calculated as the magnitude divided by the number of drought events, as expressed in Equation (5):
where is the mean duration of drought [T], and is the mean magnitude of the drought [-].
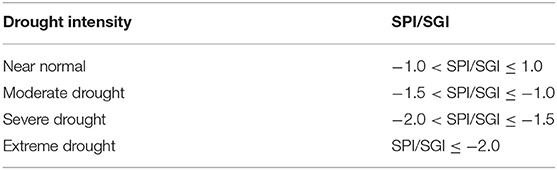
Table 3. Drought intensity according to SPI/SGI (McKee et al., 1993; Bloomfield and Marchant, 2013).
Cross-Correlation Function of SPI and SGI
The time scale for studying SPI was q = 1, 2,…, 12. Cross-correlation analysis was performed for the SGI while varying the duration from q = 1 to the SPI at different time scales. This cross-correlation requires the calculation of the convolution of two different variables X and Y to examine the degree of their similarity at different locations. The larger the cross-correlation coefficient obtained after calculations, the higher the degree of similarity between the variables. The calculation was based on Equation (6):
Here, cov(X, Y) and E[(X - μx)(Y-μy)] represent the covariance of the data at locations X and Y, σx and σy represent the standard deviations for the data from location X and Y, respectively. After calculation of the cross-correlation coefficient Rq between the SGI and the SPI, correlation analysis was performed between Rq and the duration q. From the calculation results, the maximum value qmax (time) of the correlation coefficient was obtained. qmax signifies that the trends of droughts and their severity, as represented by the SGI and SPI, were most correlated for the cumulative duration q. Next, the SPI and SGI for the same cumulative duration were used to analyze the duration of drought events at the individual measuring stations.
Results and Discussions
SPI and SGI Analysis Results
This study utilized the SPI and SGI at different durations (q = 1, 2, …, 12) to analyze the characteristics and intensity of drought events in basins in Central Taiwan. The study area was divided into three river basins for the examination of drought characteristics (from north to south), namely, the Da'an, Dajia, and Wu River basins. Long-term observation data from two rainfall stations and two groundwater stations were used for the Da'an and Dajia Rivers, while long-term observation data from nine rainfall stations and 13 groundwater stations were used for the Wu River to examine the drought characteristics of the basins in Central Taiwan.
The results show that SPI and SGI evaluated with a short accumulation periods exhibit cyclical fluctuations and cannot be used to effectively evaluate and predict the occurrence of drought events. However, the SPI and SGI evaluated for a longer accumulation period can be easily used to evaluate drought events at the study site. For example, significant cyclical changes were observed when the accumulation period q at the Da'an River rainfall stations was 1, 6, and 9 months (Figure 2). However, when the accumulation period was extended to 12 months, the characteristics of the drought events could be demonstrated. Therefore, long-term cumulative rainfall and cumulative groundwater levels (q = 12) were used in this study to analyze the characteristics of drought events in the basins.
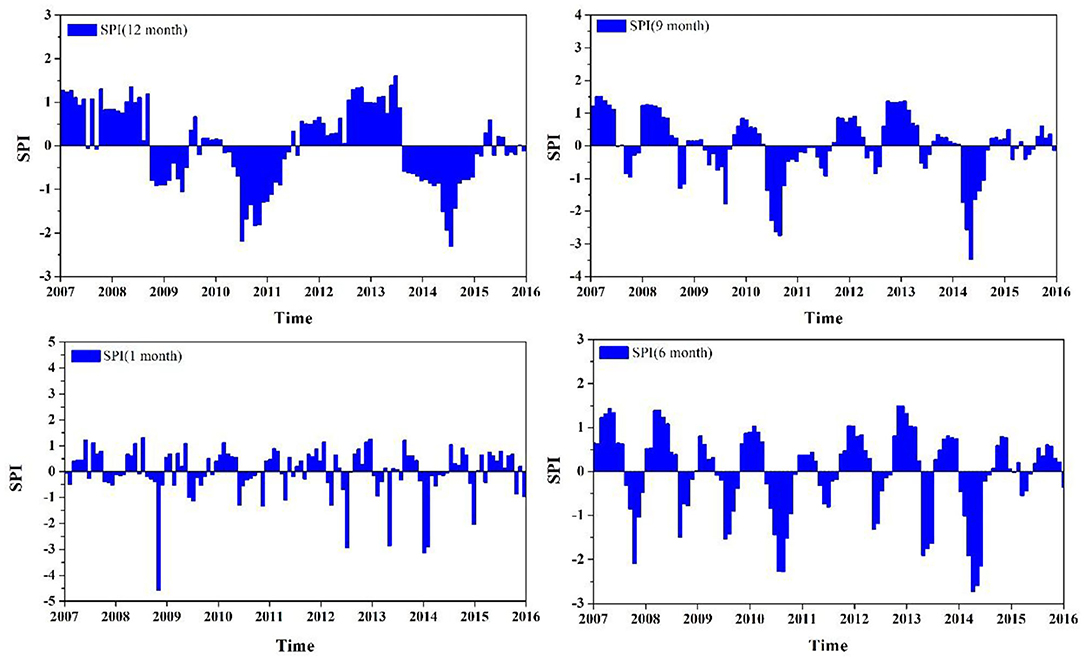
Figure 2. Cumulative rainfall (SPI) at different time scales (using the Da'an River as an example).
First, the Da'an River basin was subject to SPI analysis with an accumulation period of q = 12. The analyzed period ranged from 2008 to 2016. The results show that two extreme drought events occurred previously in the Da'an River basin, in June 2011 and July 2015. The SPI values were −2.19 and −2.32, respectively. The periods from July 2011 to January 2012 and from May 2015 to August 2015 were relatively dry and droughts with moderate intensity and above occurred (Figure 3A). SPI analysis of the Dajia River basin with an accumulation period of q = 12 was performed for the years 2012 to 2016. Extreme drought events occurred in June and July 2015, with SPI values of −2.14 and −2.32, respectively. May to December 2015 were relatively dry months, with a mean SPI of −1.50 (Figure 4A). The SPI analysis of the Wu River basin with an accumulation period of q = 12 covers contains data from 2007 to 2016. The results show that extreme drought events occurred from July to September 2015. The SPI values were −1.61, −1.93, and −1.58, respectively. The periods from June 2011 to January 2012 and from February 2015 to December 2015 were relatively dry and droughts with moderate intensity and above occurred (Figure 5A).
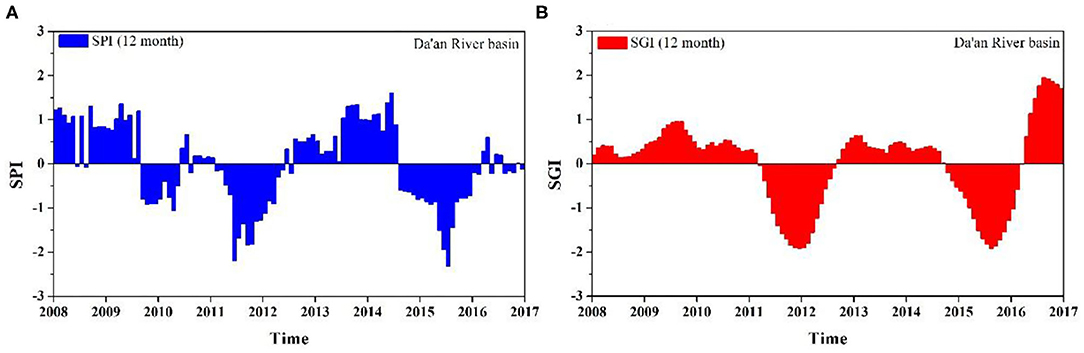
Figure 3. (A,B) Long-term (q = 12) SPI and SGI analysis results for the Da'an River Basin.
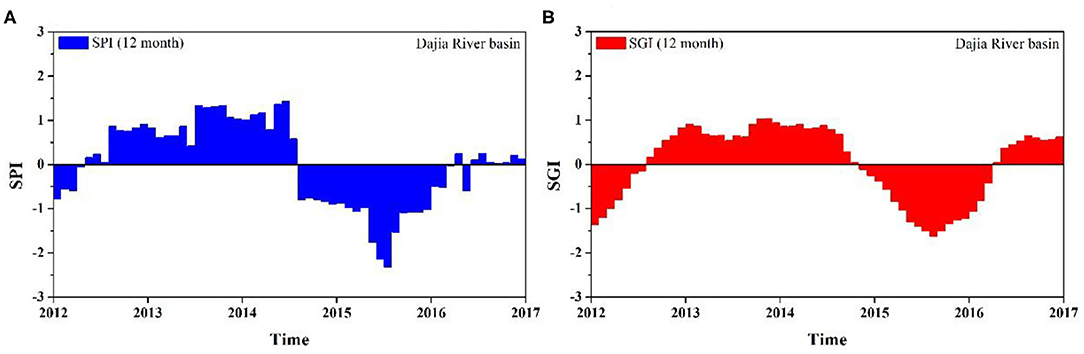
Figure 4. (A,B) Long-term (q = 12) SPI and SGI analysis results for the Dajia River Basin.
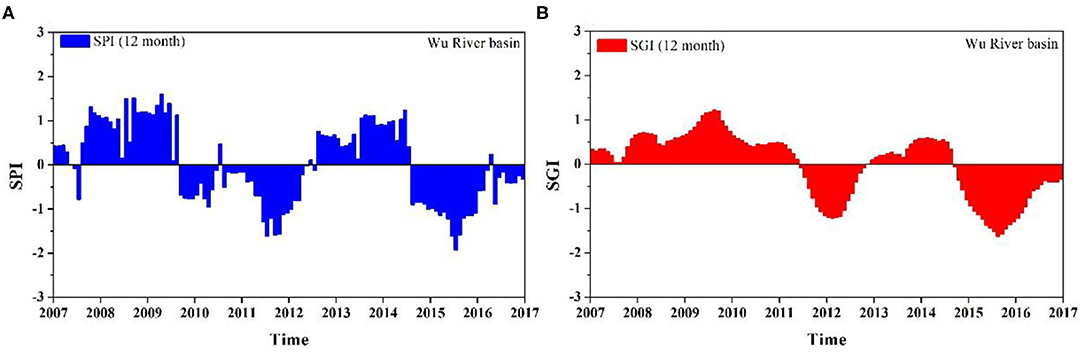
Figure 5. (A,B) Long-term (q = 12) SPI and SGI analysis results for the Wu River Basin.
A longer accumulation period of q = 12 was also used for the SGI analysis in this study to effectively analyze the characteristics of groundwater drought. The SGI analysis of the Da'an River basin with an accumulation period of q = 12 was carried out from 2008 to 2016. Severe drought events occurred from August 2011 to March 2013. The average SGI value was −1.78. In this period, December 2011 showed the lowest SGI value of −1.91. Long periods of severe drought events also occurred from May 2015 to November 2015; the mean SGI value is −1.72 (Figure 3B). SPI analysis of the Dajia River basin with an accumulation period of q = 12 was performed from 2012 to 2016. From April 2015 to January 2016, drought events with moderate and greater intensity occurred. The SPI value is −1.62, as shown in Figure 4B. The SPI analysis of the Wu River basin with an accumulation period of q = 12 is based on the period from 2007 to 2016. A long period of drought events with moderate intensity and above occurred from February 2015 to February 2016. In addition, moderate droughts occurred from November 2011 to May 2012, with a mean SPI of −1.15 (Figure 5B).
Overall, the SPI and SGI trends of the various basins are generally consistent. The lowest SPI value of −2.32 was obtained in July 2015 in the Da'an River basin indicating extreme drought had occurred. The corresponding SGI value for the same period also indicates a severe drought event. The SPI values for the Dajia River basin indicate extreme droughts in June and July 2015. The corresponding SGI value for the same period also reaches the threshold of severe drought. Similarly, the SPI values for the Wu River Basin show severe droughts from July to September 2017. The corresponding SGI value for the same period is < -1.50, which implies that a severe drought event had occurred. Based on the above-mentioned results, SPI and SGI are correlated. Therefore, when examining drought events, rainfall and groundwater data should be integrated to accurately determine the time of occurrence and intensity of droughts.
Evaluation of the Groundwater Drought Characteristics
Drought Frequency Analysis Results
The frequency of occurrence for moderate droughts in the Dajia River basin is the lowest among the three basins by a factor of <2. The Wu River basin has the highest frequency, with more than half of the groundwater stations experiencing more than four moderate drought events. The average occurrence of moderate droughts in the Wu River Basin is 3.6, with the most events occurring at the Chung Shan-1 and Dali-2 groundwater stations (>5 moderate droughts). In addition, the average occurrence of moderate droughts in the Da'an River basin is four times. Figure 6A shows the spatial distribution of the frequency of occurrence of moderate droughts.
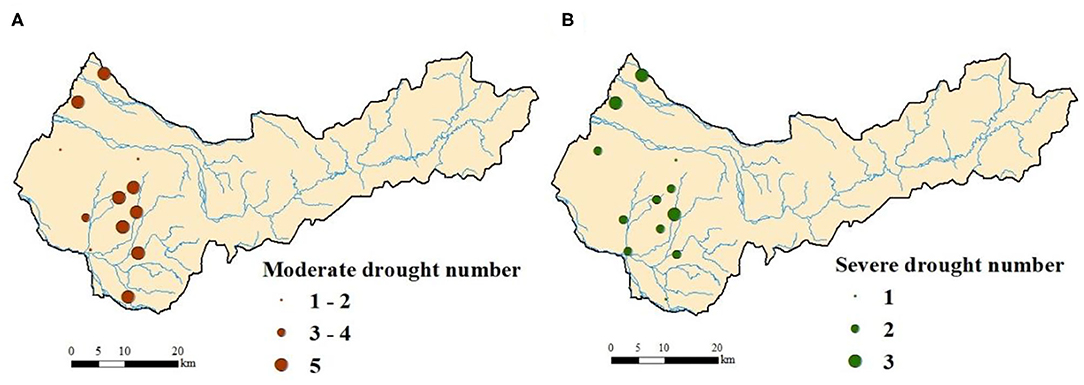
Figure 6. Occurrence frequency of (A) moderate groundwater drought and (B) severe groundwater drought.
In terms of severe drought analysis, 1–2 severe droughts occurred in the Dajia River basin, which is the lowest number among the three basins. The average number of occurrences is 1.5. The average number of occurrences in the Da'an River basin is three, which is the most frequent among the three basins. The frequency of occurrence of severe droughts in the Wu River basin is between the two, with an average occurrence of 1.9. Figure 6B shows the spatial distribution of the frequency of occurrence of severe droughts.
Analysis Results for the Average Drought Duration
Figure 7 shows the spatial distribution of the average duration of moderate and severe droughts in basins in Central Taiwan. The study site includes four stations with an average moderate drought duration of <2 months and two stations with an average moderate drought duration of more than 5 months. The longest average duration (8 months) was obtained at the Chi Tsung-2 and Wuri-2 stations (Figure 7A).
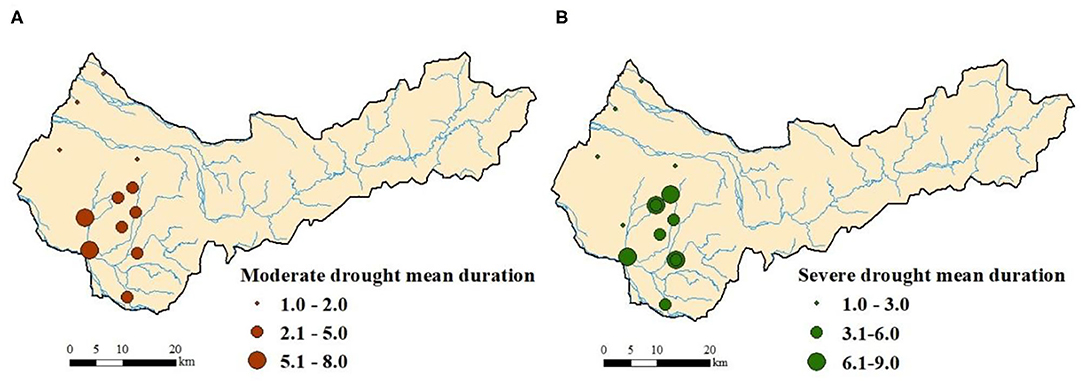
Figure 7. Mean duration of (A) moderate groundwater drought and (B) severe groundwater drought.
The average duration of moderate droughts in the Da'an River basin is <2 months, with an average of 1.8 months. The average duration of moderate droughts at the two groundwater stations in the Dajia River basin is 1 month. The average duration of moderate droughts in the Wu River Basin ranges from 1.5 to 8 months, with an average of 3.9 months.
The study site includes six stations with an average severe drought duration of <3 months and two stations with an average severe drought duration of more than 6 months; all of them being in the Wu River basin. Among these stations, the longest severe drought occurred at the Tan Tzu and Wuri-2 stations in the Wu River Basin, with an average duration of 9 months (Figure 7B).
The average severe drought duration in the Da'an River basin is lower than 3.5 months, with an average of 3.2 months. The average severe drought duration in the Dajia River basin is 2–3 months, with an average of 2.5 months. The average severe drought duration in the Wu River Basin shows drastic changes, ranging from 1 to 9 months, with an average of 5.1 months.
Analysis Results for the Mean Drought Intensity
Figure 8 shows the spatial distribution of moderate and severe droughts. The study site includes five stations with a mean moderate drought intensity of <3 and 2 stations with an intensity greater than eight. Among these stations, the mean moderate drought intensity at the Wuri-2 Station in the Wu River Basin was 10.1, while the intensity at the Chi Tsung-2 Station was 9.6 (Figure 8A).
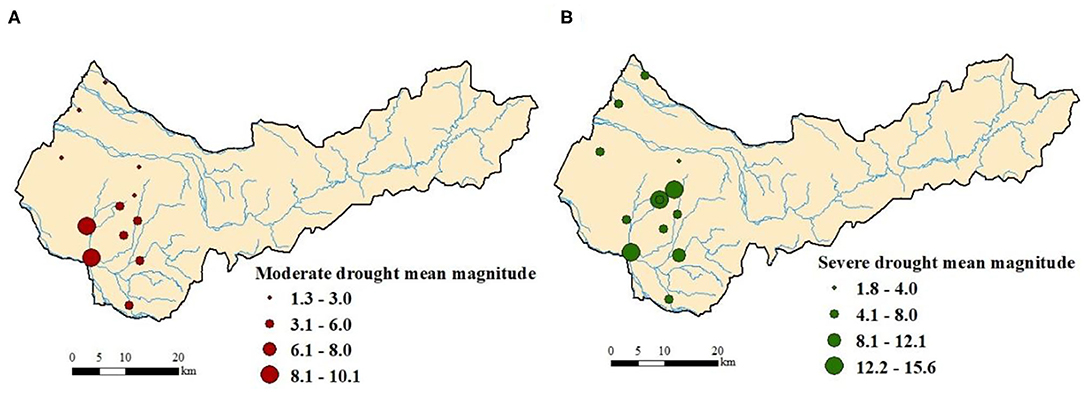
Figure 8. Mean drought intensity of (A) moderate groundwater drought and (B) severe groundwater drought.
The mean moderate drought intensity in the Da'an River basin ranges from 1.8 to 2.6. with an average of 2.2. The mean moderate drought intensity in the Dajia River basin is 1.3. The mean moderate drought intensity in the Wu River Basin ranges from 1.8 to 10.1, with an average of 4.7. In addition, there are two stations in the Wu River basin with a mean severe drought intensity of <4 and 3 stations with a mean intensity >12. Among these stations, the station with the highest intensity is the Tan Tzu Station in the Wu River basin, with an average intensity of 15.6 (Figure 8B).
The mean severe drought intensity in the Da'an River basin ranges from 1.8 to 6, with an average of 5.4. The mean moderate drought intensity in the Dajia River basin ranges from 3.5 to 5.5, with an average of 4.4. The mean moderate drought intensity in the Wu River Basin ranges from 1.8 to 15.6, with an average of 8.7.
Based on the above analysis, the results of the groundwater drought characteristics show that the duration and intensity of drought in the Da'an and Dajia River basins are smaller than those in the Wu River basin. The Wu River Basin covers a densely populated area in the lower reaches of Taichung City and some specific agricultural areas, and the hillside conservation area is close to the upstream. Because of human activities and industrial activities, the groundwater may be extracted downstream, causing the groundwater level in the area to drop. In such cases, the drought characteristics are analyzed by comparing them with those of basins that have a more serious groundwater drought situation. In the upper and middle areas of the region, due to sufficient rainfall and less human activities, the groundwater level is less susceptible to impact; thus, there is a wider range of drought intensity. Human and industrial activities can be incorporated for further analysis.
Cross-Correlation Function of Groundwater and Meteorological Droughts
The study site was divided into three subbasins in this study for cross-correlation analysis: the Da'an, Dajia, and Wu River basins. The drought indicators of the various rainfall and groundwater stations were separately calculated before being averaged to obtain the SPI and SGI. Finally, the correlation coefficient (Rq) between the SPI and SGI and different accumulation periods (q) was used for cross-correlation analysis. Figure 9 shows the results. The largest SPI and SGI cross-correlation coefficient varies from 0.83 to 0.91, while the corresponding accumulation period of the greatest cross-correlation coefficient in the various basins is qmax. qmax shows the SPIqmax for the accumulation period of qmax and that SGI contains the most similar trend. The maximum cross-correlation coefficient at a qmax of 8 months is 0.91 in the Dajia River basin, which is the highest cross-correlation coefficient among the three basins. The qmax of the Wu River basin is 5 months and the greatest cross-correlation coefficient is 0.83, which is the lowest maximum cross-correlation coefficient of the three basins. The qmax of the Da'an River is 5 months, and the maximum cross-correlation coefficient falls between that of the other two basins at 0.85. In addition, when the cross-correlation coefficient reaches its maximum value (q = 5) in the Da'an and Wu River basins, it gradually decreases when the accumulation period continues to increase. This phenomenon was not observed in the Dajia River basin; the cross-correlation coefficient was maintained between 0.8 to and 0.92 for accumulation periods greater than q = 6.
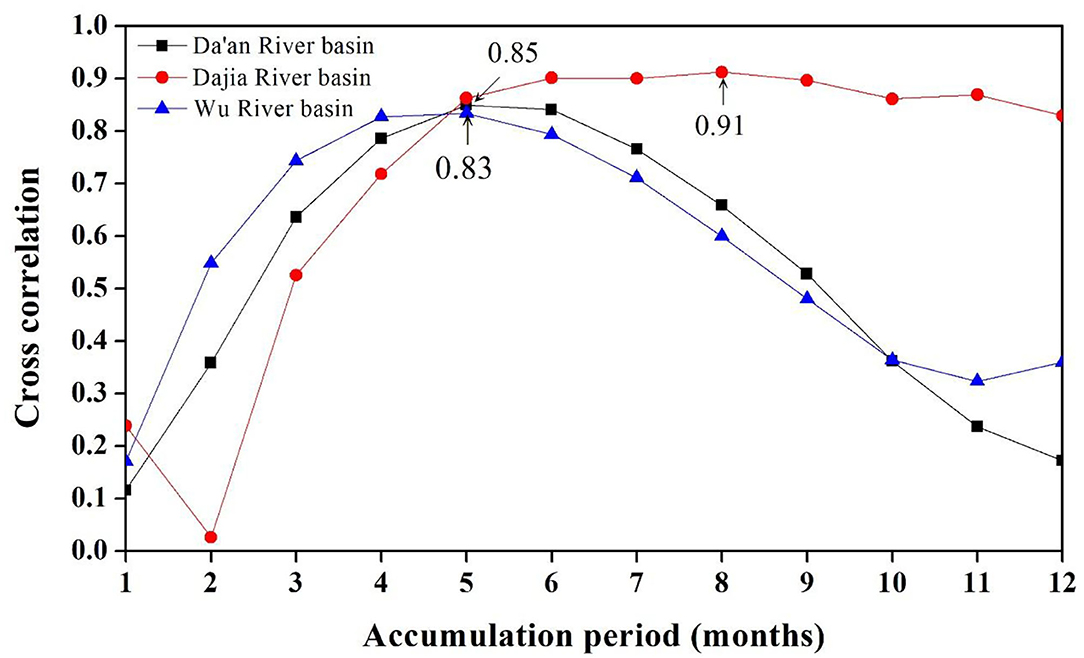
Figure 9. Cross-correlation function of SPI and SGI for various basins.
The analysis results show that the SPIqmax of the Da'an River and Wu River basins is 5 months. This indicates that the accumulated rainfall after 5 months has the response most similar to that of the groundwater level. It also indicates that it will take 5 months for rainfall to have a significant impact. For groundwater, 5 months is the propagation time. Similarly, the propagation time in the Dajiaxi Basin was 8 months.
Figure 10 shows the time series for SPIqmax and SGI in various basins. The time series of SPIqmax can be roughly divided into two types. The SPI-5 time series of the Da'an River (Figure 10A) and Wu River basins (Figure 10C) show a relatively similar distribution of drought events. The time of occurrence of droughts is generally similar. Continuous drought events occurred in the Da'an River basin in January 2011. At the same time, the SPI values of the Wu River Basin are relatively smaller. In addition, the fluctuations of the indicator values are smaller in 2012 and 2013. The shape of the SPIqmax time series (Figure 10B) of the Dajia River basin indicates a non-up–down fluctuation type. Extreme drought occurred in April 2014, while a prolonged period of drought events occurred in January 2015; beyond 2016. The drought events gradually alleviated.
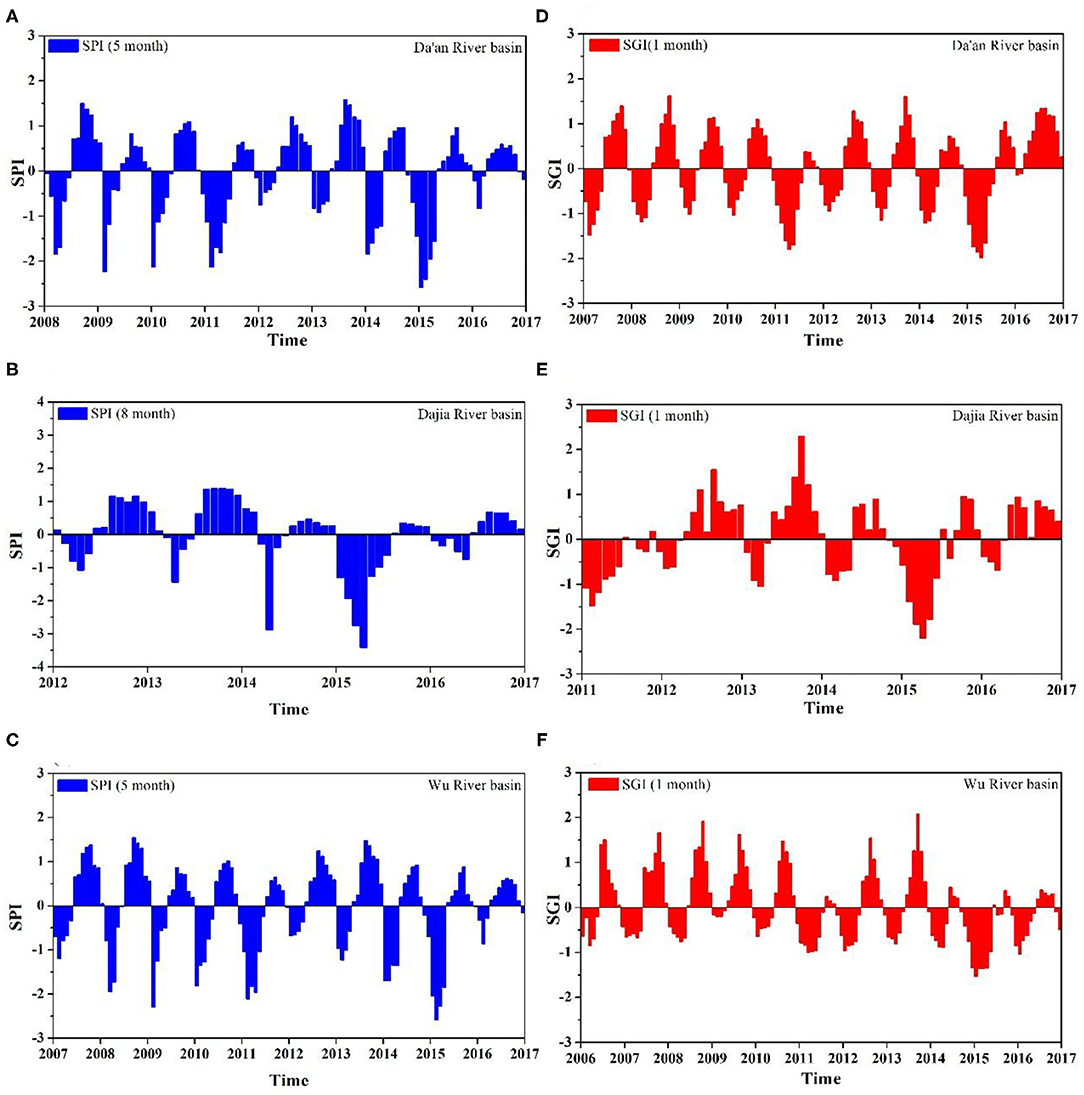
Figure 10. (A–F) SPIqmax and SGI time series for various basins.
In the SGI time series, the graph shapes of the Da'an and Wu River basins are relatively similar, that is, both are up–down fluctuation types. The Da'an River basin, in which eight moderate and two severe droughts previously occurred, has more apparent groundwater drought events (Figure 10D). The drought events in the Wu River basin are not apparent; only five moderate droughts and one severe one occurred (Figure 10F) with maximum impacts lasting from December 2014 to April 2015. The SGI time series of the Da'an River basin (Figure 10E) is relatively irregular. An extreme drought occurred in March 2015, while three moderate droughts and one severe drought occurred during the study period.
The relationship between groundwater drought (SGI) and its corresponding meteorological drought (SPI) varies across different regions. The study site generally shows that the time series differences between SPIqmax and SGI in various basins are insignificant. However, the SPI and SGI of the Dajia River basin show a stronger correlation than the same measures for the Da'an or Wu River basins. Table 4 shows the drought frequency, mean drought duration, and mean drought intensity based on the analysis of the SGI and SPIqmax results for various basins.
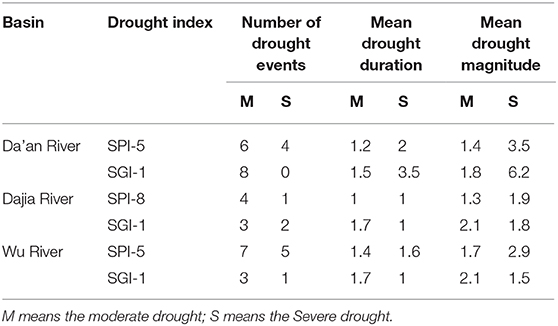
Table 4. Drought characteristics for moderate and severe drought of each basin.
Conclusions
The SPI and SGI were used in this study to investigate the drought characteristics of basins in Central Taiwan by applying different time scales to evaluate drought characteristics (such as drought frequency, duration, and intensity). In addition, a correlation analysis between meteorological and groundwater droughts was performed. Drought events can be better determined based on the analysis of long-term data. The SPI analysis results show that in 2015 the basins of Central Taiwan experienced drought events with moderate and greater intensity. In addition, based on the SGI analysis, the threshold for drought events was satisfied in 2015. This shows that SPI and SGI are correlated. In addition, the characteristics of groundwater droughts were examined in this study. The results show that the drought frequency in the Da'an River basin is relatively high, but the drought duration and intensity are relatively low. In contrast, the number of drought events is relatively smaller in the Wu River Basin, but its drought duration and intensity are greater compared to those of other basins. The correlation analysis results show that the relationship between groundwater drought (SGI) and its corresponding meteorological drought (SPI) varies in different basins. Compared with the other basins, meteorological and groundwater droughts in the Dajia River basin show a greater correlation. Finally, the analysis results of the SGI and SPIqmax drought events show that the drought duration is longer when the drought intensity is high. During severe droughts, droughts caused by low rainfall occur at a higher frequency than those caused by groundwater. This study quantifies the characteristics of drought in central Taiwan and displays it in a spatial distribution. Therefore, using long-term monitoring data and the methods of this research can effectively grasp the drought situation in various regions of Taiwan and provide references for the deployment and management of water resources.
Data Availability Statement
The original contributions presented in the study are included in the article/supplementary material, further inquiries can be directed to the corresponding author/s.
Author Contributions
H-FY conceived of the subject of the article, performed the literature review, and contributed to the writing of the paper.
Conflict of Interest
The author declares that the research was conducted in the absence of any commercial or financial relationships that could be construed as a potential conflict of interest.
Acknowledgments
The authors are grateful for the support of the Research Project of the Ministry of Science and Technology (MOST 106-2116-M-006-012).
References
Bazrafshan, J., Hejabi, S., and Rahimi, J. (2014). Drought monitoring using multivariate standardized precipitation index (MSPI). Water Resourc. Manag. 28, 1045–1060. doi: 10.1007/s11269-014-0533-2
Bierkens, M. F. P., Wada, Y., Wisser, D., Wanders, N., and Van Beek, L. P. H. (2013). Human water consumption intensifies hydrological drought worldwide. Environ. Res. Lett. 8:034036. doi: 10.1088/1748-9326/8/3/034036
Bloomfield, J. P., and Marchant, B. P. (2013). Analysis of groundwater drought building in the standardized precipitation index approach. Hydrol. Earth Syst. Sci. 17, 4769–4787. doi: 10.5194/hess-17-4769-2013
Central Weather Bureau (2016). Climate Monitoring 2016 Annual Report. Taipei: Central Weather Bureau, Taiwan, ROC.
Gosling, R. (2014). Assessing the impact of projected climate change on drought vulnerability in Scotland. Hydrol. Res. 45, 806–816. doi: 10.2166/nh.2014.148
Hellwig, J., de Graaf, I. E. M., Weiler, M., and Stahl, K. (2020). Large-scale assessment of delayed groundwater responses to drought. Water Resourc. Res. 56:e2019WR025441. doi: 10.1029/2019WR025441
Huang, S., Li, P., Huang, Q., Leng, G., Hou, B., and Ma, L. (2017). The propagation from meteorolrgical to hydrological drought and its potential influence factors. J. Hydrol. 547, 184–195. doi: 10.1016/j.jhydrol.2017.01.041
Huntington, T. G. (2006). Evidence for intensification of the global water cycle: review and synthesis. J. Hydrol. 319, 83–95. doi: 10.1016/j.jhydrol.2005.07.003
IPCC Climate Change (2007). “The physical science basis,” in Contribution of Working Group, I. To the Fourth Assessment Report of the Intergovernmental Panel on Climate Change, eds Solomon, S., Qin, D., Manning, M., Chen, Z., Marquis, M., Averyt, K. B., Tignor, M., Miller, H. L. (Cambridge; New York, NY: Cambridge University Press), 996.
Jung, G., Wagner, S., and Kunstmann, H. (2012). Joint climatehydrology modeling: an impact study for the data-sparse environment of the Volta Basin in West Africa. Hydrol. Res. 43, 231–248. doi: 10.2166/nh.2012.044
Kumar, R., Musuuza, J. L., Loon, A. F. V., Teuling, A. J., Barthel, R., Ten Broek, J., et al. (2016). Multiscale evaluation of the Standardized Precipitation Index as a groundwater drought indicator. Hydrol. Earth Syst. Sci. 20, 1117–1131. doi: 10.5194/hess-20-1117-2016
Liu, M., Xu, X., Xu, C., Sun, A. Y., Wang, K., Scanlon, B. R., et al. (2017). A new drought index that considers the joint effects of climate and land surface change. Water Resourc. Res. 53, 3262–3278. doi: 10.1002/2016WR020178
Loon, A. F. V., Kumar, R., and Mishra, V. (2017). Testing the use of standardised indices and GRACE satellite data to estimate the European 2015 groundwater drought in near-real time. Hydrol. Earth Syst. Sci. 21, 1947–1971. doi: 10.5194/hess-21-1947-2017
Lorenzo-Lacruz, J., Garcia, C., and Morán-Tejeda, E. (2017). Groundwater level responses to precipitation variability in Mediterranean insular aquifers. J. Hydrol. 552, 516–531. doi: 10.1016/j.jhydrol.2017.07.011
McKee, T. B., Doesken, N. J., and Kleist, J. (1993). “The relationship of drought frequency and duration to time scales,” in Proceedings of the Eighth Conference on Applied Climatology (Anaheim, CA), 179−184.
Milly, P. C. D., Wetherald, R. T., Dunne, K. A., and Delworth, T. L. (2002). Increasing risk of great floods in a changing climate. Nature 415, 514–517. doi: 10.1038/415514a
Mishra, A. K., and Singh, V. P. (2010). A review of drought concepts. J. Hydrol. 391, 202–216. doi: 10.1016/j.jhydrol.2010.07.012
Mu, Q. Z., Zhao, M. S., Kimball, J. S., McDowell, N. G., and Running, S. W. (2013). A remotely sensed global terrestrial drought severity index. Bull. Am. Meteorol. Soc. 94, 83–98. doi: 10.1175/BAMS-D-11-00213.1
Nafarzadegana, A. R., Zadeha, M. R., Kherada, M., Ahania, H., Gharehkhania, A., Karampoora, M. A., et al. (2012). Drought area monitoring during the past three decades in Fars Province, Iran. Quatern. Int. 250, 27–36. doi: 10.1016/j.quaint.2010.12.009
Nalbantis, I. (2008). Evaluation of a hydrological drought index. Eur. Water Resourc. Assoc. 23/24, 67–77.
Nalbantis, I., and Tsakiris, G. (2009). Assessment of hydrological drought revisited. Water Resourc. Manag. 23, 881–897. doi: 10.1007/s11269-008-9305-1
Narasimhan, B., and Srinivasan, R. (2005). Development and evaluation of Soil Moisture Deficit Index (SMDI) and Evapotranspiration Deficit Index (ETDI) for agricultural drought monitoring. Agri. Forest Meteorol. 133, 69–88. doi: 10.1016/j.agrformet.2005.07.012
Palmer, W. C. (1965). Meteorological drought. Research Paper No. 45. Washington, DC: US Department of Commerce Weather Bureau.
Rust, W., Holman, I., Corstanje, R., Bloomfield, J., and Cuthbert, M. (2018). A conceptual model for climatic teleconnection signal control on groundwater variability in Europe. Earth-Sci. Rev. 177, 164–174. doi: 10.1016/j.earscirev.2017.09.017
Shafer, B. A., and Dezman, L. E. (1982). “Development of a surface water supply index (SWSI) to assess the severity of drought conditions in snowpack runoff areas,” in Western snow conference (Fort Collins, CO), 164–175.
Sharma, T. C., and Panu, U. S. (2010). Analytical procedures for weekly hydrological droughts: a case of Canadian rivers. Hydrol. Sci. J. 55, 79–92. doi: 10.1080/02626660903526318
Tabari, H., Nikbakht, J., and Talaee, P. H. (2013). Hydrological drought assessment in Northwestern Iran based on streamflow drought index (SDI). Water Resourc. Manag. 27, 137–151. doi: 10.1007/s11269-012-0173-3
Tao, H., Borth, H., Fraedrich, K., Su, B. D., Zhu, X. H., and Bai, Y. G. (2013). Drought and wetness variability in the Tarim River Basin and connection to large–scale atmospheric circulation. Int. J. Climatol. 34, 2678–2684. doi: 10.1002/joc.3867
Tsakiris, G. (2017). Drought risk assessment and management. Water Resourc. Manag. 31, 3083–3095. doi: 10.1007/s11269-017-1698-2
Tsakiris, G., and Vangelis, H. (2005). Establishing a drought index incorporating evapotranspiration. Eur. Water 9/10, 3–11.
Wilhite, D. A., and Glantz, M. H. (1985). Understanding the drought phenomenon: the role of definitions. Water Int. 10, 111–120. doi: 10.1080/02508068508686328
Woli, P., Jones, J. W., Ingram, K. T., and Fraisse, C. W. (2012). Agricultural reference index for drought (ARID). Agron. J. 104, 287–300. doi: 10.2134/agronj2011.0286
Keywords: standardized precipitation index, standardized groundwater level index, drought, Central Taiwan, cross-correlation
Citation: Yeh H-F (2021) Spatiotemporal Variation of the Meteorological and Groundwater Droughts in Central Taiwan. Front. Water 3:636792. doi: 10.3389/frwa.2021.636792
Received: 02 December 2020; Accepted: 02 February 2021;
Published: 22 February 2021.
Edited by:
Rohini Kumar, Helmholtz Centre for Environmental Research (UFZ), GermanyReviewed by:
Andrzej Walega, University of Agriculture in Krakow, PolandQuoc Bao Pham, Ton Duc Thang University, Vietnam
Copyright © 2021 Yeh. This is an open-access article distributed under the terms of the Creative Commons Attribution License (CC BY). The use, distribution or reproduction in other forums is permitted, provided the original author(s) and the copyright owner(s) are credited and that the original publication in this journal is cited, in accordance with accepted academic practice. No use, distribution or reproduction is permitted which does not comply with these terms.
*Correspondence: Hsin-Fu Yeh, aGZ5ZWhAbWFpbC5uY2t1LmVkdS50dw==