 Carlotta Quagliolo
 Elena Comino
 Alessandro Pezzoli
- 1DIST - Interuniversity Department of Regional and Urban Studies and Planning, Politecnico di Torino and Università degli Studi di Torino, Turin, Italy
- 2DIATI - Department of Environment, Land and Infrastructure Engineering, Politecnico di Torino, Turin, Italy
Cities are vulnerable to extreme weather events, particularly by considering flash flood risk as a result of even more short-duration intensive rainfall. In the context of climate change, compound flooding due to simultaneous storm surges and increased runoff may further exacerbate the risk in coastal cities, and it is expected to be frequent and severe across several European urban areas. Despite this increasing evidence, the spatial knowledge of the hazardous events/vulnerabilities through modelling scenarios at the urban level is quite unexplored. Moreover, flood-prone areas often do not correspond to the traditional flood risk classification based on predicted return-period. The result that huge impacts (human losses and damages) occur everywhere throughout the city. Consequently, this new challenge requires stormwater flooding mitigation strategies to adapt to cities while mainstreaming urban flood resilience. In this paper, we considered the Urban Flood Risk Mitigation model through the employment of the open-source tool—Integrated Evaluation of Ecosystem Services and Trade-off (InVEST)—developed by the Natural Capital Project, integrated into a GIS environment. The model application in the three urban coastal territory of the Liguria Region (Italy) estimated the amount of runoff due to two extreme rainfall events for each watershed considered. These index calculation results help define examples of Natural Water Retention Measures (NWRM) per land-use type as resilient solutions by addressing site-specific runoff reduction. Local sensitivity analysis was finally conducted to comprehend the input parameter's influence of rain variation on the model.
Introduction
Worldwide, urban water management (water scarcity, surface runoff and flooding, water pollution) became one of the most challenging issues to be tackled with new approaches (Qi et al., 2020). Since climate change impacts cities through more frequent and intense short rainfall events which lead to pluvial (rain-related) flooding affecting people and buildings, the contemporary city regularly faces urban stormwater management issue (Burian and Edwards, 2002; Rosenzweig et al., 2019). Instead of fluvial or coastal flooding, which is well-known, the pluvial flood occurs unexpectedly as an “invisible hazard” in areas not recognised as a flood-prone risk. Pluvial flooding represents the conversion of rainfall into a runoff when the rain rate exceeds the maximum infiltration capacity of stormwater by the land (Houston et al., 2011).
Urbanisation has widely modified local, regional and national water cycles through the traditional drainage systems' evident inability to cope with new urban sprawl (Hernández-Hernández et al., 2020). Modification from permeable to impervious land, especially in urban contexts (i.e., streets, roofs, buildings) leads to a higher peak flow rate of runoff while limiting the groundwater recharge. Soils that reduce infiltration result in an increasing amount of runoff water that contributes to accelerating erosion. Surface runoff is the volume of excess water that runs off a drainage area, and rainfall is the primary source of this process (Berndtsson et al., 2019). Indeed, not all the rain that hits the ground reaches the watershed outlet or infiltrates the soil. Frequently, flash floods are associated with the lower intensity of rains over a longer period in saturated surfaces. The main factors affecting the rainfall volume that runs off are soil, the cover land or land use and the vegetation. It is well-known the importance of vegetation cover in improving soil permeability. Vegetation cover affects soil infiltration by changing the hydrological process of rainfall-infiltration on slopes and modifying the soil pore spaces (Huang et al., 2013).
Due to their impermeability, cities are highly vulnerable to extreme rainfall events, so-called cloudburst, which determines flash flood all around the city. The term “cloudburst” is not considered new as formally defined in meteorology by Woolley et al. (1946); however, it became frequently used in the urban resilience literature (Woolley et al., 1946). Therefore, research on the spatial and temporal variability of the hydrological cycle in urban areas has become one of the most important resilience planning issues (Brunetta et al., 2019). Quoting one coastal European metropolitan area, Copenhagen adopted in 2012 the Cloudburst Management Plan when the previous year the city has experienced cloudbursts with wide damages due to flash flooding. This plan divided the city into seven catchment areas for stormwater management following two key principles (1) as the larger amount of rainfall is managed at the surface and (2) more the adopted solutions have operated as new urban spaces for recreational functions of citizens (Engberg, 2018).
The degree of manageability for climate change effects on pluvial flooding is expected to remain small at the city level. However, various socio-ecological-technological solutions can be considered to face flood risk optimising urban stormwater management (Pappalardo et al., 2017; Berndtsson et al., 2019). Innovative solutions related to Sustainable urban drainage systems (SuDS) as Low Impact Development (LID), Blue-Green Infrastructures, Natural Water Retention Measures (NWRM), or Nature-Based Solutions (NBS) comprise natural features for water management that are integrated into the urban water cycle. These measures had proven positive effect in delaying and reducing the burden of runoff by restoring the infiltration treated water and improving water quality (Debele et al., 2019). NWRM are suites of technical, nature-based and hybrid adaptation measures that constitute an integral part of the overall urban water cycle and are integrally planned and managed across time, including space and stakeholders at the landscape scale. Indeed, these measures are considered “living solutions” driven by participatory approaches which generate multiple co-benefits (e.g., improving biodiversity, mitigating climate change impacts, etc.). Simultaneously, these solutions can reduce urban areas' environmental footprint when well-designed, maintained and managed (Grêt-Regamey et al., 2017; Dushkova and Haase, 2020). Despite widespread growing interest in NBS and ecosystem-based measures, few studies have focussed on implementing site-specific solutions and related biophysical impacts (Matthews et al., 2015). Therefore, simulation of the biophysical effects of NBS to reduce runoff volume can be a good practise to quantify the tangible benefits of these measures in terms of water regulation and mainly flood control. This method could help define quantitative runoff reduction targets to reach flash flood resilience by implementing specific NBS. The quantification of ecosystem benefits in biophysical and economic terms is crucial to integrate the natural capital in policy planning. The InVEST- Integrated Evaluation of Ecosystem Services and Trade-off tool of Natural Capital Project is employed for ecologically calibrated urban planning (Liu et al., 2017; Kadaverugu et al., 2021).
In light of the above, this research aims to investigate the usability of the InVEST model to analyse the site-specific vulnerabilities due to rainfall-generated runoff in three coastal urban areas of Italy located in the Liguria region, identifying resilient solutions inspired to ecological values. The watersheds were selected in the Liguria region because it is characterised by dense built-up and a high sealed soils rate. At the same time, a strong sloping of this land intensifies the flooding effect by increasing runoff events' speed. The spatial urban modelling application in this urban land represents new experimental knowledge in flood vulnerability analysis, as historically, this territory experienced flood-related disasters.
Although these short-duration intensive rainfalls are increasing in the face of climate change projections, spatial knowledge about the distribution of these events through vulnerability analysis with urban modelling scenarios is not common with respect to the prevalence of studies and data on fluvial flooding (Sörensen and Mobini, 2017).
Through the employment of the Urban Flood Risk Mitigation model, this research assesses the urban system ability to reduce runoff effect due to two mainly intensive rainfalls typical of that coastal area. This model is one of the most recent realise of InVEST for urban analysis. Kadaverugu et al. (2021) employed this model in a metropolitan Indian city to evaluate the flood mitigation service of green spaces and estimating the economic damage to buildings (Kadaverugu et al., 2021). As in literature exists few research concerning the use of this model, this study contributes to increase knowledge on the involved hydrological aspects to be applied into ecological adaptation planning. Particularly, by providing more awareness on how information related to the model's output should be strictly linked to define adaptation scenarios. Site-specific vulnerability knowledge helps identify “where” and “what” kind of proper urban resilient solutions (Brunetta and Salata, 2019). Comparing urban contexts by implementing two different rainfall extremes in the model is performed to identify resilient solutions (by presenting ecosystem services-based measures).
This paper is structured as follow: (1) Methodology section presenting the area of study, the functioning and input data for the Urban Flood Mitigation Model; (2) Results and Discussion section illustrating the numerical/graphical elaboration of the model's output by showing comparative analysis among analysed study areas. This section is integrated by the spatial runoff evaluation with resilience classes at the watershed level to support the NWRM definition. The final part presents an introduction to sensitivity test on InVEST flood model; and (3) Conclusion section briefly summarising relevant issues of this research while setting potentiality for further improvement.
Methodology
The Study Area
This study's area of interest is part of the Metropolitan City of Genoa within the Liguria Region in Italy (Figure 1). Liguria is one of Italy's smaller regions covering 2% of Italian territory, while the population density is almost 287 Inhab./sq. Km. Considering the orography of the territory and that more than 50% is covered by forestry, the coastline, particularly the Metropolitan City of Genoa, show the region's higher population density (population amount of 850,000 only in the metropolitan area). Indeed, this region went through rapid urbanisation in coastal areas combined with a population that has doubled in a rather short period (about 150 years until 2009) (Arvati, 2011).
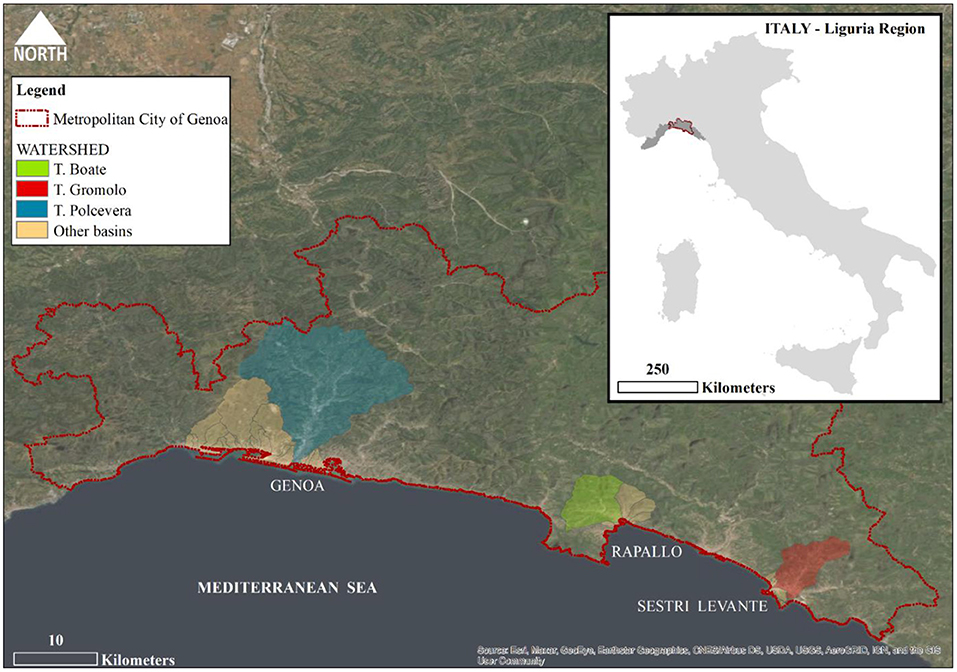
Figure 1. Area of interest (source: authors).
Unfortunately, the model's input data do not cover the original area of study (city of Genoa) entirely; therefore, we decided to focus on 45 watersheds, of which three major basins and others smaller all included in the Metropolitan City of Genoa where we have data. The intent to adopt watersheds instead of administrative units as boundaries for running the model is determined by the need to consider natural aspects due to the territory's geomorphology and hydrology. This study area is represented by the Polcevera torrent as the main Watershed for Genoa and by the Boate and Gromolo torrents, respectively, for Rapallo and Sestri Levante cities. To have an overall view of what concerns the output data, 42 smaller basins and those three main watersheds are added into the analysis. Despite the high administrative fragmentation, the territory of the Liguria Region is highly and continuous urbanised. This research aims to evaluate runoff retention ability in different urban contexts in terms of each considered zone's primary activities. As the third-largest city in Northern Italy in the number of inhabitants, Genoa is characterised by intense urban density and industrial activities. At the same time, Rapallo and Sestri Levante are mainly recognised for their touristic activities. This study represents essentially a first attempt to work with this model on that coastal area (Mediterranean Sea) which is historically exposed to hydrometeorological events. Frequent flooding has resulted in significant destruction in the past, primarily due to intense rainfall on a highly urbanised landscape.
This area's climate is typically Mediterranean, warm, and temperate, with essentially rainier months during the winter season. In particular, the average annual temperature is 14.7°C, and about 1,086 mm of precipitation falls annually, with a difference of 125 mm between the driest and the wettest months1. Although rainfall is on average with the Mediterranean climate, numerous extreme rainfalls and storms occurred during the last few years, causing short and intense flooding events across the city. By precipitation analysis with time series from 1961 to 2010 of Liguria, it has been outlined that the western part of the region—Ponente—is less rainy than the eastern part—Levante—in terms of average cumulative rainfall2.
Genoa is characterised by a narrow coastal zone with hills and steep mountains in the backcountry. Genoa lies at about 39 m above sea level. A wide range of watercourses has been historically incorporated into the urban area through the expansion of the city. These processes did not consider the extraordinary rising water volume of runoff flow, especially during an extreme runoff event; therefore, the city is plagued by frequent flooding. The main basins that cross the territory and give the valleys are Polcevera (west Genoa) and Bisagno (east Genoa) torrents. Polcevera valley stretched perpendicularly to the coast and was historically considered the main access way to Genoa from the Padan plain. This city area is characterised by industrial and commercial buildings along the west part of Polcevera, while the eastern part of the river is residential. Moreover, this catchment area has a steep topography with a particular drainage system essentially.
Rapallo and Sestri Levante, situated further to the east of Genoa, are parts of the Gulf of Tigullio. While the first city is in the western part of that Gulf, Sestri Levante is one of the last localities of Tigullio Gulf. Rapallo lies 3 m above sea level extending through a lowland area between two main torrents (Boate and San Francesco). Moreover, several small water courses cross the territory. The heterogeneity of landscape is composed of hills and mountains which surround the city of Rapallo. Sestri Levante is located in the floodplain of Gromolo torrent close to a rocky promontory extended toward the sea.
According to Land Cover Liguria 2019 data3, the Polcevera watershed covers 138.64 km2, of which about 14% is urban, 18% agroecosystems, and 66% forestry lands. Boate watershed has an area of 26.13 km2, of which about 13% is urban, 25% agroecosystems, and 61% forestry lands. The other Watershed Gromolo covers 25.87 km2, of which about 10% is urban, 23% agroecosystems, and 67% forestry lands.
Instead, to what concerns the impervious/sealed areas, Figure 2 highlights the characteristic of highly urbanised coastal areas typical of Genoa's metropolitan city. The imperviousness captures the percentage of soil sealing that means areas characterised by substituting the original (semi-) natural land cover or water surface with an artificial, often impervious cover. The imperviousness HRL (High-resolution layer) represents the spatial distribution of artificially sealed areas, including sealing the soil per area unit. This map is based on 0 (low impervious land) to 100 (high impervious land) values. Polcevera watershed has evident built-up distribution along the torrent, while other basins on Genoa's city present higher values of imperviousness along the coast. Similar situation for Boate and Gromolo watersheds which register impervious lands essentially along the main torrents.
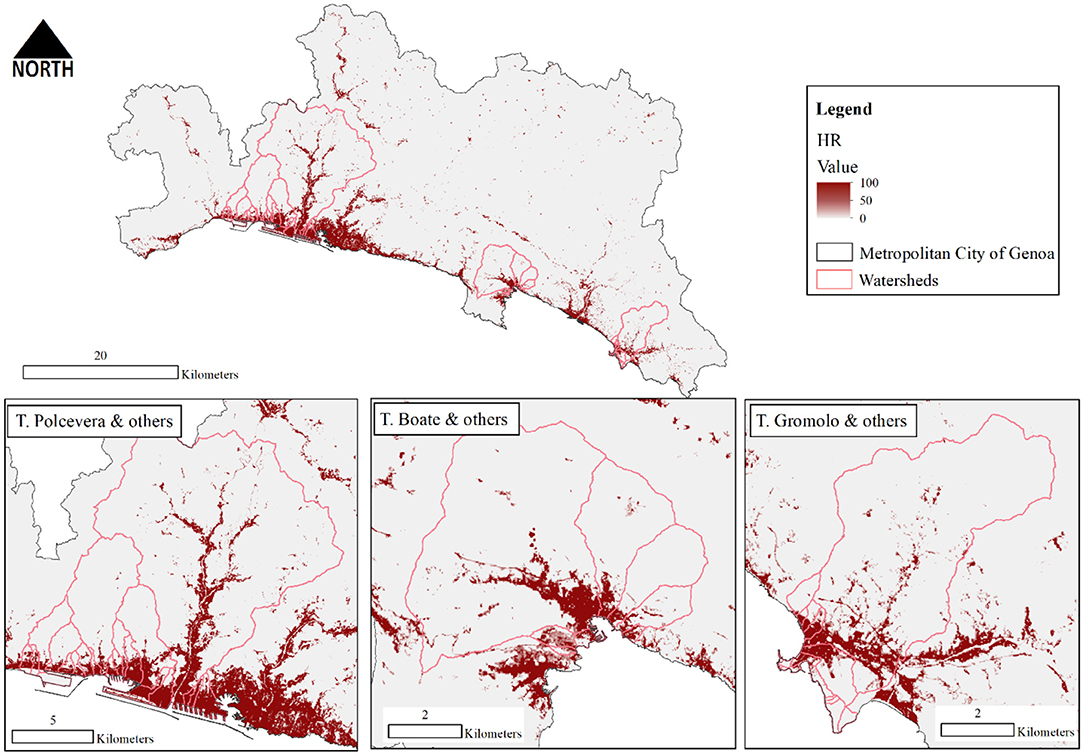
Figure 2. Imperviousness HRL (High resolution layer) map (source: authors).
Model and Input Data
The Urban Flood Mitigation Model is a recent product (2019) of the software InVEST (Integrated Valuation of Ecosystem Services and Tradeoffs) version 3.8.6 added to Natural Capital Project's tools4. Particularly, this model considers the influence of built-up footprint on the different kind of ecosystem services delivered by Natural Capital in the urban context. This model focusses on cities' ability to reduce the runoff process due to extreme rainfall (as cloudburst events), limiting the potential flooding. As hydrological modelling, this InVEST model takes into account precipitation within a watershed as input to estimate the resulting runoff discharge from a watershed. Since natural infrastructures play a crucial role in reducing flooding events, this model considers the potentiality of permeable green areas to mainly reduce runoff while slowing surface flows and creating space for water (as in floodplains or basins).
The model's main assumption considers flood-prone areas due to the interaction between the permeable-impermeable surface layers (i.e., land use type) and the soil drainage (depending on the soil characteristics), which generates the surface runoff during cloudburst event. For each pixel, the model output represents the runoff reduction (i.e., the amount of retained per pixel compared to the storm volumes).
Model inputs required:
• Watershed vector delineating the areas of interest. This study considers watersheds (Bacini idrografici)5 located in the selected municipalities of the Metropolitan City of Genoa.
• Numeric value of rainfall depth of a single extreme rainfall event (mm).
• Land Cover Map.
• Soils Hydrological Group raster.
• Biophysical table containing the value corresponding to each land use classes in the Land Cover Map (Table 3).
Since the rainfall depth is the measure of rain total for a given storm event, this research considers two unique values of rain's amount (in mm) to include different scenarios. As stated by Rosenzweig et al. (2019), the cloudburst event is considered as a single rain event of 50 mm (Rosenzweig et al., 2019). This runoff model does not consider the spatial and temporal dynamics of the rainfall event. Neither how other aspects influence the variability of the storms (as temperature). Indeed, the model's main assumption concerns the saturated hydraulic conductivity of soil as a starting point. In the light of this, two design storm of 3 h duration rainfall with an intensity of 50 and 70 mm over 100 sq. Km are included in this analysis, representing a cloudburst event typical of the Liguria region. According to ARPA Liguria (ARPAL), these two extreme events have been chosen as the most significant cases in high-risk condition for that area of study. In line with ARPAL, we follow thresholds and precipitation classification, which provides climatic analysis of that area (Figure 3). The classification criteria for precipitation are derived from the intensity-duration curve, while for thunderstorm are related to the occurring probability (frequency).
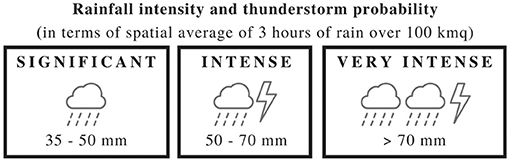
Figure 3. Precipitation and thunderstorm classification according to ARPAL6 (source: authors).
Since the runoff evaluation derived by the interaction of land use and soil characteristics through the Curve Number (CN) method, the elaboration of two main databases is crucial for this model: data on hydraulic conductivity of soils and data on land use.
In literature, CN method has been developed for runoff volume estimation founding in the last 50 years widespread use by the public agency, local governments, and professionals (Eli and Lamont, 2010). Indeed, this method has been widely applied to small watersheds and urban catchments as well adopted by the Basin Plan of Liguria Region (Banasik et al., 2014). Despite its limitations, CN method on which InVEST model is based can be considered useful to determine approximately the effective condition of the watershed considered. Since this research's main objective is to evaluate the usability of the InVEST model for urban planning adaptation, we assume consistency of runoff outputs to evaluate the watershed flash flood resilience (see section Watershed Resilience to Flash Flood). Moreover, it helps define adaptive strategies to flash flooding in the watershed with the worst resilience [see section Natural Water Retention Measures (NWRM) Per Land Use]. Given this assumption, we considered relevant from a methodological point of view the development of a sensitivity analysis on the model. The sensitivity test has been implemented to evaluate the robustness of the InVEST model through the influence of rain input parameter variation on the runoff output (see section Sensitivity Analysis of the Model).
The first data is related to the hydrologic soil group (HSG). HSG is a group of soils having similar runoff potential under similar storm and cover conditions. Soil properties, without considering the slope of soil surface, are used to calculate HSGs through these groups' assignment to soil map unit components. This procedure allows deriving a soil's associated runoff curve number which is used to estimate direct runoff or infiltration from rainfall excess. Indeed, HSGs are fundamental components of the USDA (United States Department of Agriculture) Soil Conservation Service—“SCS runoff curve number (CN)”—method for estimation of rainfall-runoff. Soils have been essentially classified into four standard classes of hydrologic soil groups—A, B, C, and D—according to USDA classification (Table 1). To determine HSGs, hydraulic conductivity (K) and soil depth should be considered [United States Department of Agriculture (USDA), 2009]. This input represents essentially the saturated hydraulic conductivity of soils (Ksat mm/h), which means the soils' ability to be vertically drained by liquids in a saturated condition. In literature, it is recognised that the hydraulic conductivity (K) depends on land-texture (soil's nature), which is strictly connected to the porosity of the ground: clay soils (impermeable soils) generally have a lower saturated hydraulic conductivity than the sandy and gravel soils (permeable soils), where the pores, less numerous but larger, facilitates the passage of big volumes of water (Abdelrahman et al., 2016).
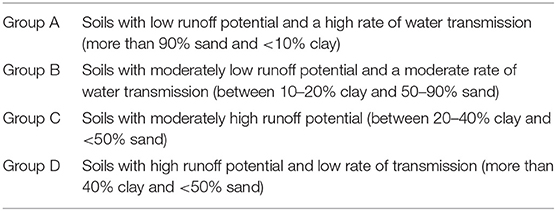
Table 1. Hydrological soil groups according to USDA classification.
For this specific area of interest, the combination of different data has been employed to finally map soil's conductivity (soil hydrological group raster). These maps are “Landscape Units” (Unità di Paesaggio—UDP)4 and “Profili and Trivellate4” (2000), which contain information about the land-texture and the associated infiltration coefficient following the classification of Soil Taxonomy 997. Table 2 shows in the first line the USDA criteria used to convert soil conductivity into HSGs easily. In contrast, the second line represents our reclassification, crossing the information about the type of soils (TS) and infiltration coefficient (CI). “Landscape Units” map has been grouped in four classes (A, B, C and D), taking into account the maximum soil's depth equal to 1 m, which is the information provided by soil analysis of the “Profili and Trivellate” map.
Table 2. Construction of HSGs input data.
The table on HSGs with associated curve number has been connected to the second data on land use classification through the Land Cover Liguria employment (2019)8. This classification has been built around the USDA classes [United States Department of Agriculture (USDA), 2004]. According to USDA classification, another dataset has been used to rank the “urban” category in permeability classes. The national high-resolution land consumption map (NHRLC)9, which is a database of 10 m raster produced yearly by the Italian Institute for Environmental Protection and Research (ISPRA) and open access at the SINANET Portal give information (from satellite images) on sealed and artificial areas. The NHRLC was intersected with the land use data to achieve the urban districts' classification following the permeability. We employed values that correspond as closely as possible to the classification USDA [United States Department of Agriculture (USDA), 2004] to what concerns the “agricultural lands” category. Table 3 represents the final biophysical table obtained with 24 land use classes associated with HSGs.
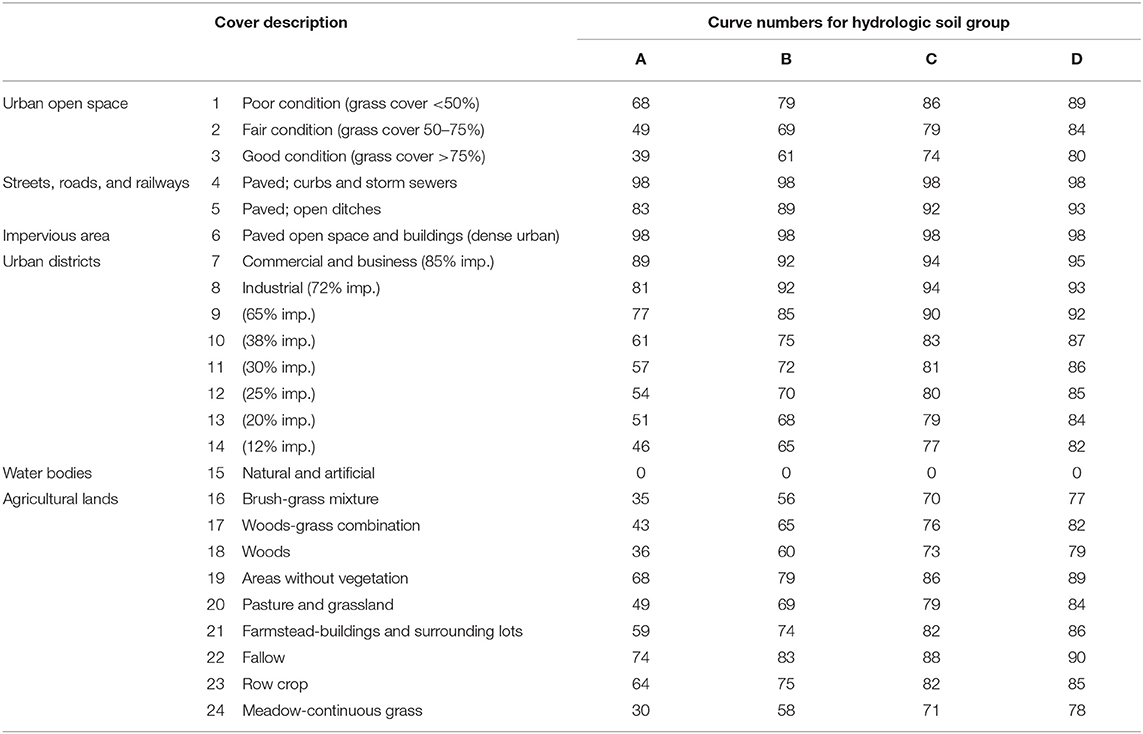
Table 3. Biophysical table with land use and curve numbers.
Results and Discussion
In this section, the output of InVEST models on estimated runoff distribution is essentially analysed and discussed through four steps. First, section Estimated Runoff Distribution examines the InVEST model results on the runoff process. Then, section Watershed Resilience to Flash Flood integrates the spatial runoff evaluation of each watershed with flash flood resilience classes to both two extreme events (50 and 70 mm of 3 h duration rainfall over 100 sq. Km). Section Natural Water Retention Measures (NWRM) Per Land Use focusses on an in-depth analysis of the watershed with the worst resilience by identifying site-specific NWRM to address flash flood vulnerabilities. Finally, section Sensitivity Analysis of the Model presents a sensitivity test on the overall model by observing how changes on the rain input parameter interact with the output. The usefulness of models depends partially on the accuracy and reliability of the output. Input data errors and modelling uncertainties are strictly related while determining uncertainty associated with model output (Loucks et al., 2005). Indeed, the sensitivity analysis carried out in this study represents a first-order uncertainty analysis which is crucial to the decision-making and modelling process.
Estimated Runoff Distribution
The InVEST model results provide data on the runoff process, identifying values both on flow retention and volume of surface runoff. Table 4 shows elaboration of the model's output for each of 45 watersheds considered in the analysis situated into the Metropolitan city of Genoa. Each basin has been associated with the reference watershed management unit of the Liguria Region10. The watershed without denomination from the input data has been assigned an alphabetic letter (A, B, etc.) to identify them in maps. Table 4 includes for every single watershed both the indices on runoff retention and runoff in percentage, the absolute volume of retained water in cube metres, the relative values of runoff retention volume and runoff volume per extension of each basin (cube metres/hectare). All the values are provided for two rain events: 50 and 70 mm (3 h duration) of rainfall events.
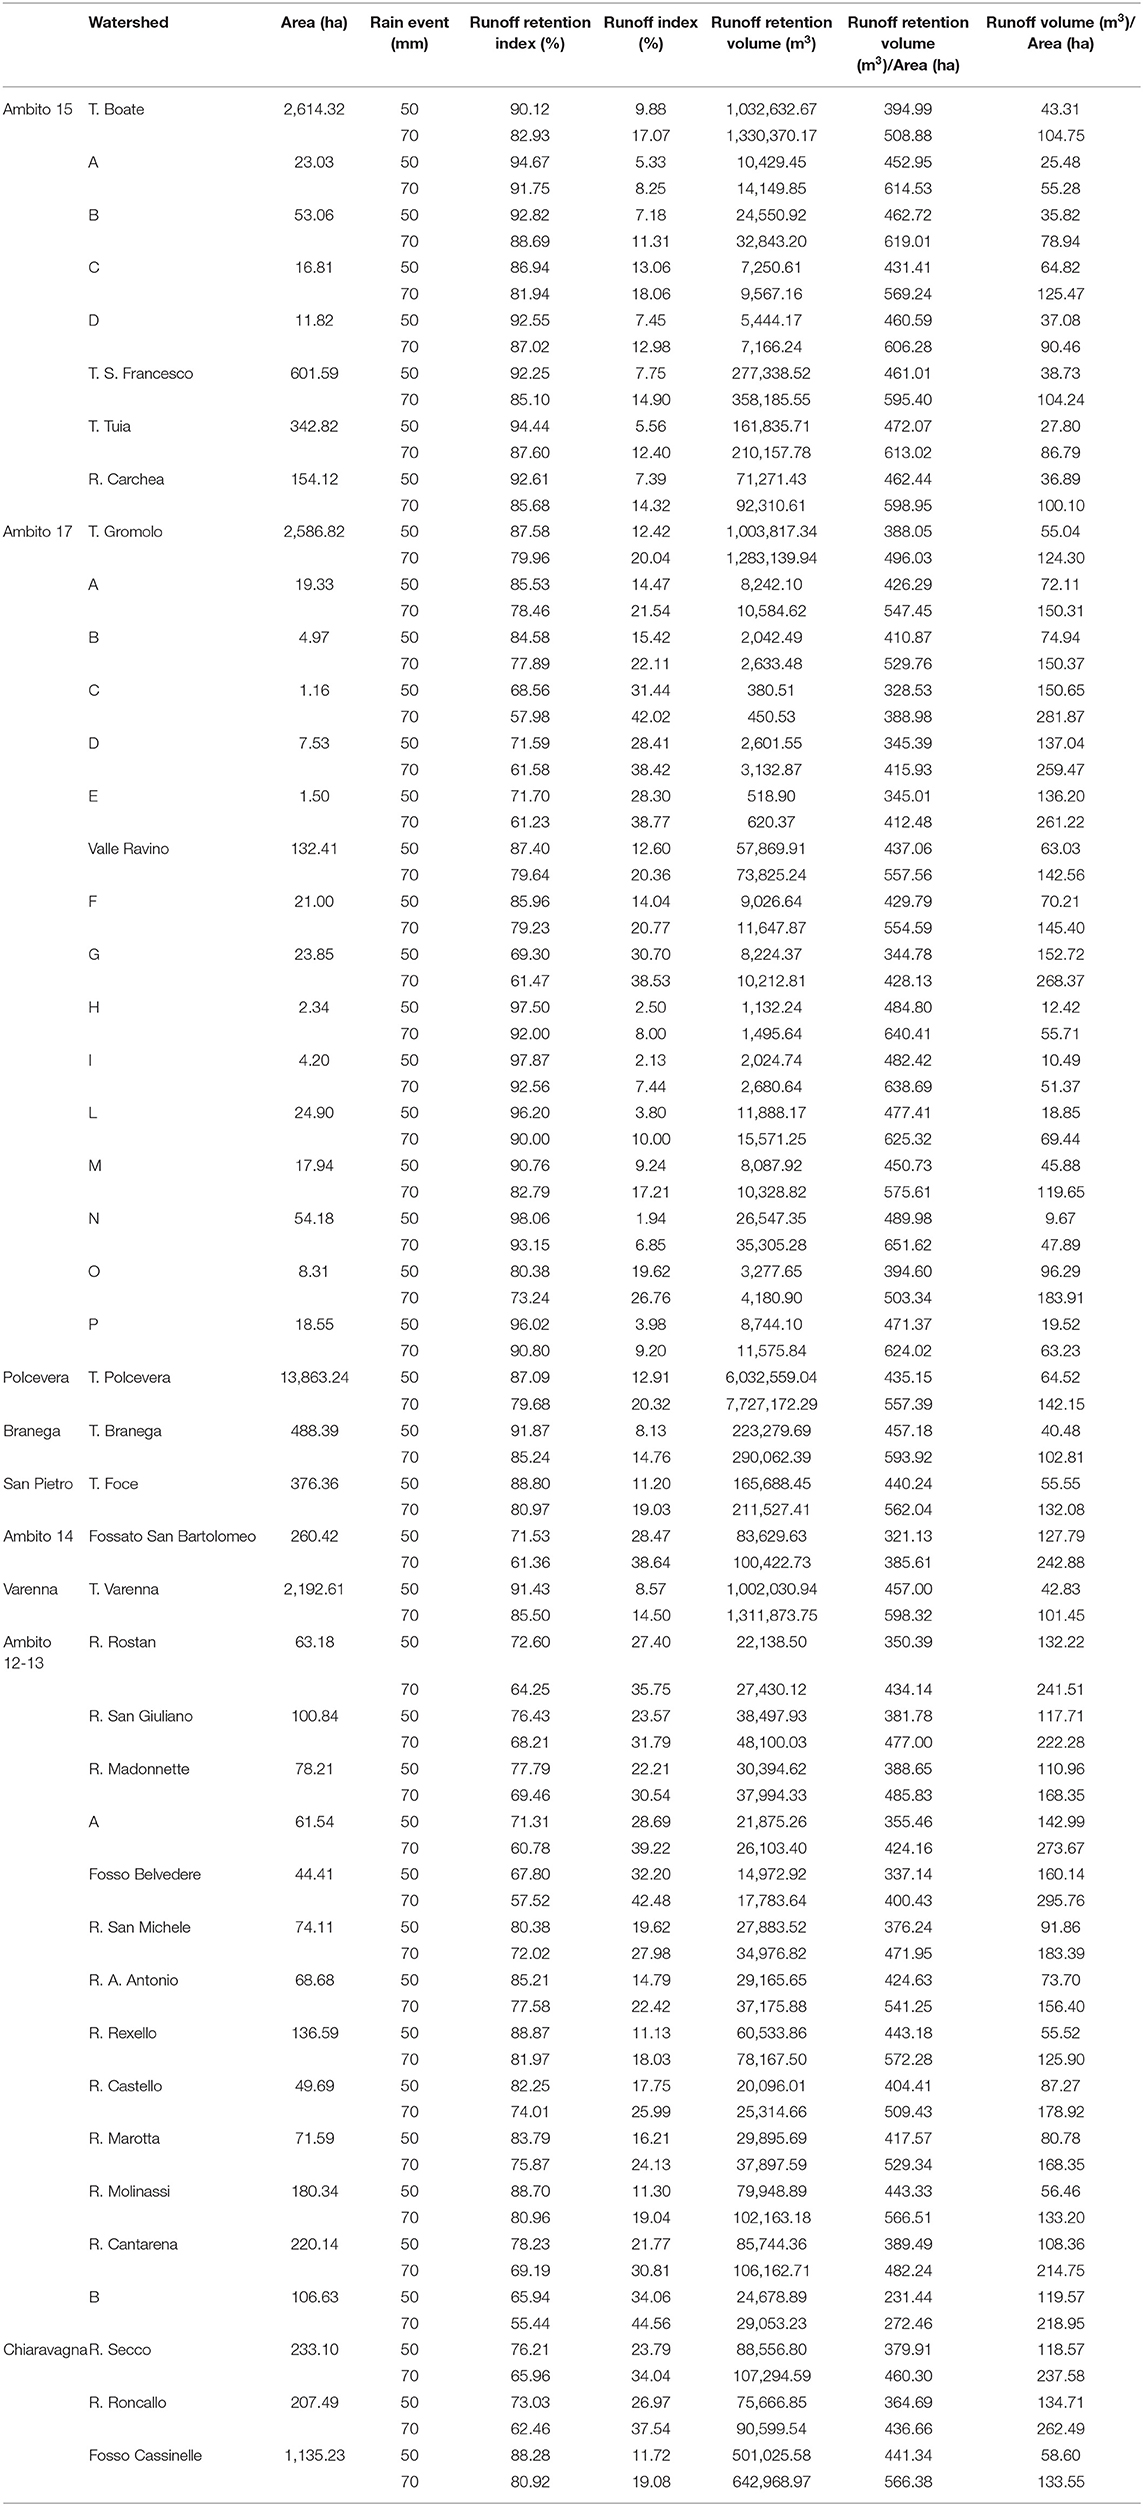
Table 4. Flood Risk Mitigation model output for each of 45 watersheds.
In terms of runoff retention index with a 50 mm rainfall event, the lowest retention capacity value is 65.94% belonging to a small watershed (re-named B in Table 4) included in the watershed management unit “Ambito 12–13” (Municipality of Genoa). In comparison, the highest value of retention is 98.06% of a basin (re-named N in Table 4) included in the watershed unit “Ambito 17” (Municipality of Sestri Levante). With 70 mm of rain, the lowest and highest retention values are, respectively, 55.44 and 93.15% belonging to the same watersheds above mentioned.
Table 4 provides the absolute value of total runoff retention volume in cube metres: Polcevera watershed registers the highest amount (about 6 million m3) while C watershed included in basins management unit “Ambito 17” presents the lowest value of retention (equal to 380.51 m3). This absolute value is proportional to the watersheds' dimension as it represents the cumulative runoff retention volume. Indeed, Polcevera is the biggest watershed with an area of 13,863.2 ha while the smallest one is C watershed into “Ambito 17” with an area of 1.16 ha.
To have a clearer idea of how effectively each watershed is most performing than the other, Table 4 elaborates the relative retention capacity (cube metres) and relative runoff (cube metres) per hectare. In the case of retention volume per hectare, N watershed included in the “Ambito 17” results in the highest value (489.98 m3/ha), while the runoff volume per hectare has the lowest value equal to 9.67 m3/ha. This watershed is the most performing counting and the lowest runoff index equal to 1.94%, which means that <2% (or 6.85%) of volume in relation to 50 mm (or 70 mm) rain events cannot be retained by the soil. On the contrary, for 50 mm of cloudburst event, Varenna watershed has the highest relative value of runoff (160.14 m3/ha). In contrast, the N basin in watershed management unit “Ambito 12–13” has the lowest relative runoff retention volume equal to 231.144 m3/ha. This means that for these two relative indices, the worst-performing watershed for retention volume and runoff volume per hectare is not the same.
Figure 4 provides a spatial distribution of the runoff volume (m3) calculated per area (ha) among selected watersheds for the rainfall event of 50 mm. The watersheds closer to the colour dark blue present a small amount of runoff per hectare differently the ones nearer to red register a big amount of runoff per hectare. In Figure 4 is illustrated the three main Watershed (Polcevera, Boate, Gromolo) for the selected area of interest for this study. Boate basin and other smaller watersheds, including the municipality of Rapallo, have essentially the smallest runoff volume per hectare regarding the other two cities considered. Indeed, except for two small watersheds covering Sestri Levante's city present high runoff values, Gromolo and other basins in that area have a good retention capacity, taking into account that the relative runoff per hectare for those watersheds range from about 9–96 m3 per Ha. By observing the spatial distribution of the runoff volume per hectare for Polcevera and other basins, it is evident how this relative index highlights the worst-performing situation, especially for the basins belonging to Genoa's municipality. The total runoff volume per hectare in that area registers values ranging from about 80 to 160 m3/Ha.
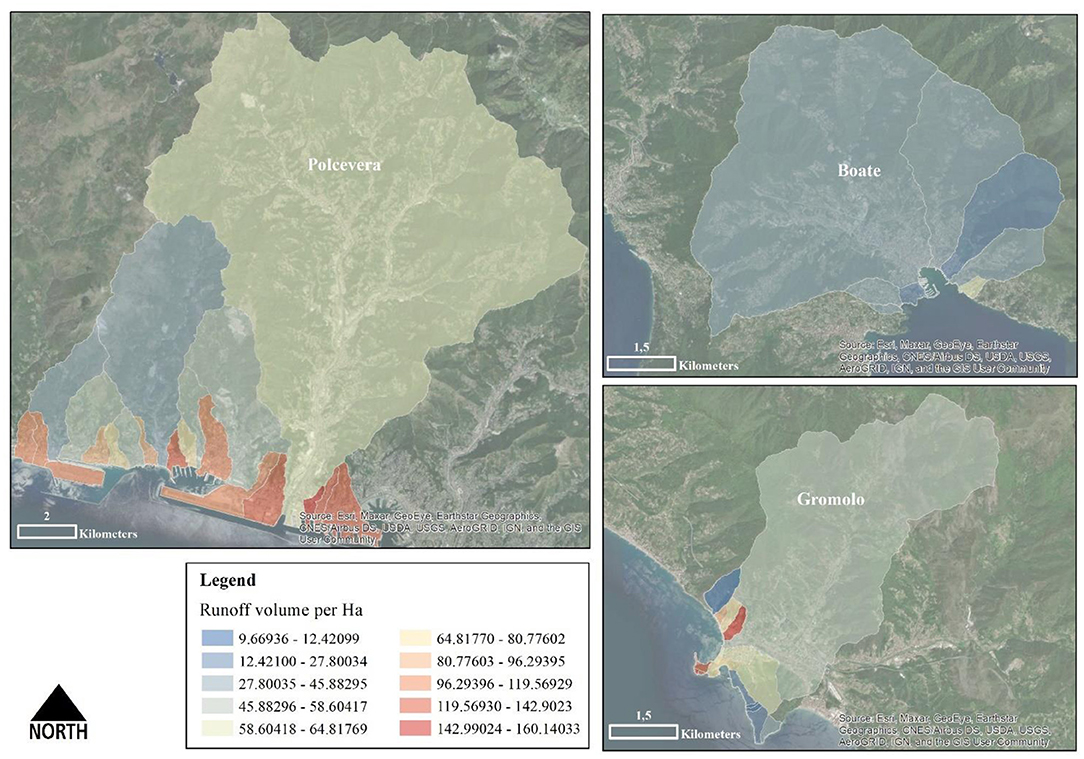
Figure 4. Runoff volume per Ha for each watershed (50 mm of rainfall) (source: authors).
To sum up, these first results calculated as averages for each watershed demonstrate a relatively good runoff retention capacity at basin level both for rainfall events of 50 and 70 mm. Indeed, what emerges is strictly linked to the land cover distribution. A portion equal to 66% of the Polcevera territory is covered by forestry. A big part of other basins close to the Polcevera watershed (blue and light blue in Figure 5) is covered by vegetated and pasture areas. Similar situation for Boate watershed which has 61% of forestry and 25% of agroecosystem essentially made by vineyards. Finally, the Gromolo watershed is covered by 67% of forestry and 23% of agroecosystems, of which the majority are pastures.
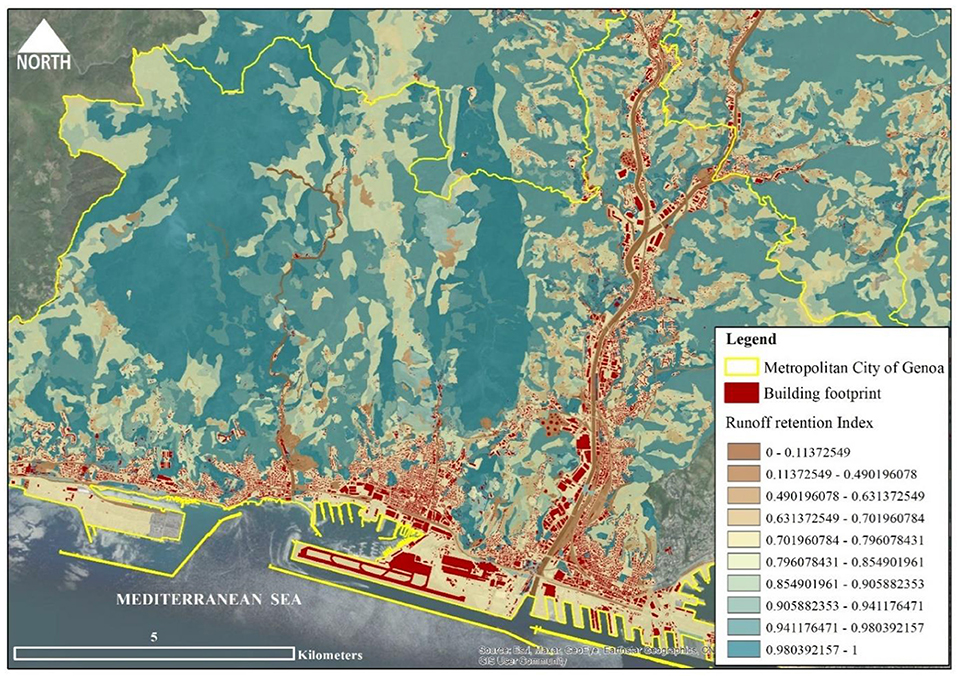
Figure 5. Runoff retention Index per pixels (50 mm of rainfall) for the Municipality of Genoa (source: authors).
The model output provides a detailed spatial distribution per pixels of the runoff retention index to overcome this limitation. In this way, it is possible to visualise the phenomenon's entity and particularly identify how the retention capacity should be increased to enhance resilience to flash floods. Figure 5 provides the runoff retention index per pixels by considering 50 mm of rainfall focussed on Genoa's municipality. The flood output at the watersheds level underlined the most difficult situation for that area of study. The runoff retention index ranges from 0 (low retention) to 1 (high retention) and is overlayed to the building footprint. Streets and industrial areas register lower retention capacity (colour brown in the map). Simultaneously, the urbanised district with residential and commercial activities presents values ranging from 0.6 to 0.8% of runoff retention capacity (close to the colour yellow in the map).
Watershed Resilience to Flash Flood
The output estimated by InVEST Urban Flood Risk Mitigation model could finally support the definition of strategies and solutions by addressing site-specific runoff vulnerability reduction. The spatial knowledge about runoff distribution and a first estimate of the volume of water that flows during both rainfall events considered are crucial to mainstream resilience to flash floods. We calculated the runoff variation index for each watershed from 50 to 70 mm of a rainfall event. Those results helped define a resilience ranking to flash flood based on five classes at the watershed level. Low resilience means an elevated change of runoff from 50 to 70 mm of rain, while high resilience means smaller runoff values (Figure 6).
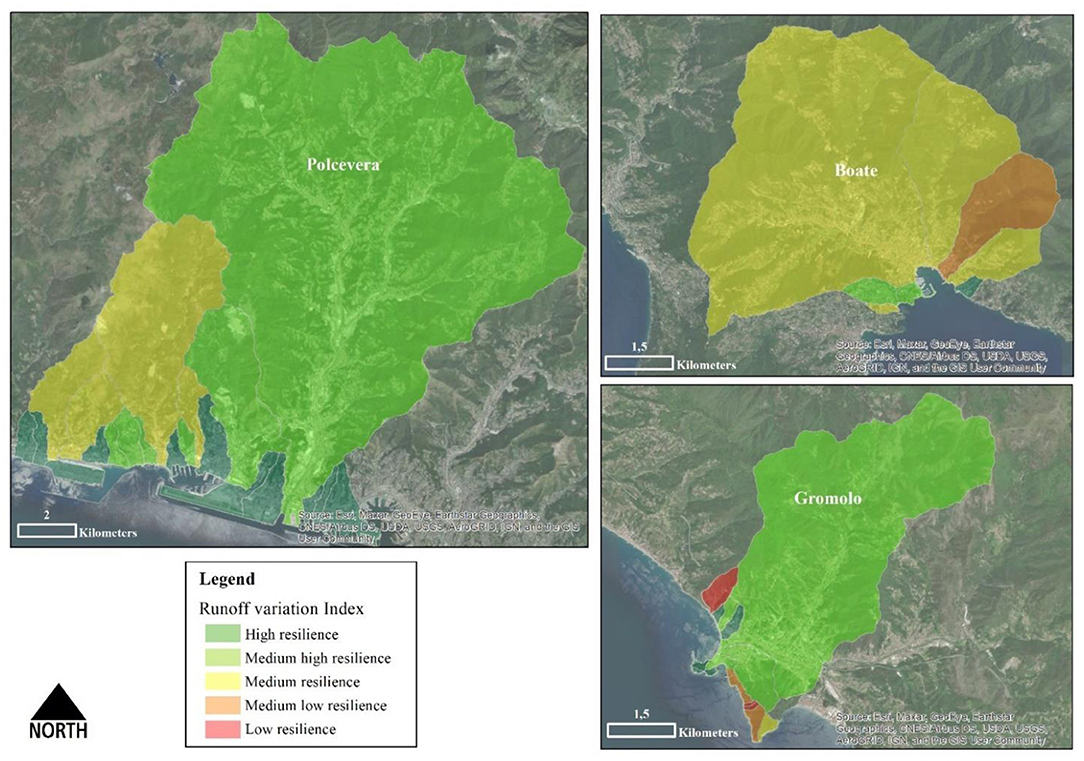
Figure 6. Variation of runoff retention index from 50 to 70 mm of rainfall (source: authors).
Figure 6 shows that watersheds identified as the most vulnerable to flash flooding due to the low retention capacity are more resilient if considered a rainfall event more intense of 40%. Indeed, the highest runoff volume is registered in the less resilient watershed, which is N included in “Ambito 17” covering Sestri Levante municipality. Since the runoff volume was strictly linked to the land-use typology showing high values related to the urban district and impervious surfaces, the runoff variation due to rainier events seems more related to the soil texture. Indeed, this low resilient watershed belongs to the hydrological soil group B with the soil characterised by 10–20% of clay and 50–90% of sand. This result could demonstrate that exists a threshold of retention per land-use type. With a variation of rain equal to 40%, the streams' volume increases beyond the retention capacity threshold. The reasons could be different and should be deepened. One parameter which influences the vertical water transmission of soils is related to the level of aquifers. A high level of aquifer represents a strong limit to the water infiltration while causing large runoff volumes.
Natural Water Retention Measures (NWRM) Per Land Use
During heavy rain, surface water management is a more adaptive way of responding to climate change than building larger sewers. As mentioned above, urban planning is increasingly considered “soft” measures (i.e., NBS) as one of the most important tools for Flood Risk Reduction (FRR), particularly by radically reducing or avoiding the impact of extreme rainfall (Berndtsson et al., 2019). NBS also includes Natural Water Retention measures as multi-functional measures focussing on addressing water-related challenges by restoring and maintaining ecosystems.
Here, we focussed on the worst resilient watershed identified in the above section Watershed Resilience to Flash Flood, finally integrating the runoff quantification analysis and watersheds vulnerability assessment with specific solutions to mainstream flash flood resilience. By following the NWRM project11 of DG Environment for building knowledge on Natural Water Retention Measures (NWRM) in Europe, we proposed some examples of NWRM associated with land use type to reduce flash flood risk for critical runoff thresholds. As Sustainable Urban Drainage System (SUDS), Natural Water Retention measures have the goal to manage volumes and flows rates from impervious surfaces by helping the stormwater drainage system. Figure 7 shows the runoff retention index's analysis spatially distributed using the mean retention value for each land-use type in Sestri Levante's municipality. This stage was useful to define a set of natural measures in the most critical watershed by distinguishing from urban to agricultural or forest lands. From the high value of retention (blue on the map) to the low value of retention (red in map), the mean runoff retention index for a 50 mm rain event is represented in Figure 7.
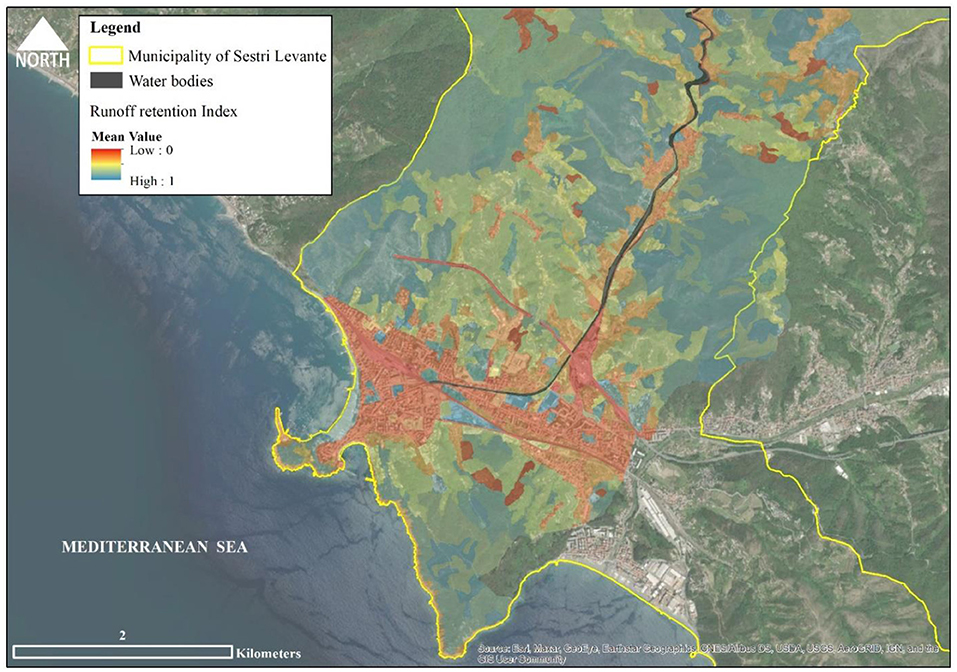
Figure 7. Runoff retention Index per Land use for Sestri Levante (50 mm of rainfall) (source: authors).
Figure 8, instead, is a zoom on the most critical watershed area in Sestri Levante municipality. Three examples of NWRMs selected are shown in the map with a specific location related to the land use type and the mean value of retention capacity.
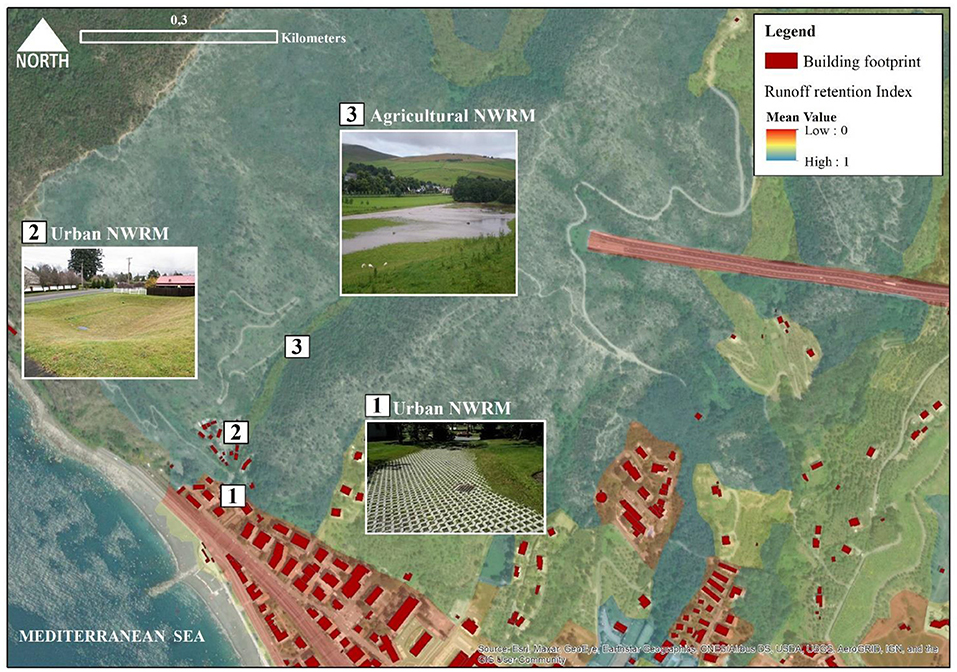
Figure 8. NWRM for watershed N of “Ambito 17” in Sestri Levante (source: authors).
The first urban NWRM is related to the high level of sealed surfaces (red on map). Therefore, we proposed the replacement of artificial surfaces like the road with asphalt by “permeable paving.” This solution is designed to allow the controlled rate of rainwater to increase infiltration through the surface or be stored below the ground. Two typologies of permeable paving exist:
1. Porous pavements, where water is infiltrated across the surface as reinforced grass or gravel, or porous concrete and cobblestones;
2. Permeable pavements, where materials such as bricks are distributed to provide void space through to the sub-base by using porous seals rather than mortar material.
Roads and car parking are common areas of implementation for these types of NWRM, even if these solutions can apply to broader permeable areas to increase infiltration of rain. According to Blanc et al. (2012), new permeable paving can reduce runoff by 98%, slowing and storing water surface. Moreover, EU Floods Directive (2007/60/EC) considers permeable paving an effective source control component of SUDS by contributing to sustainable runoff management in urban areas.
The other urban NWRM is “infiltration basin” imagined in a built-up area, creating a vegetation depression designed to hold runoff. Storage is provided through landscaped areas that allow temporary ponding on the land surface and then stored water to infiltrate into soils and groundwater. Those infiltration basins are dry, constituting a recreational area except during a period of heavy rainfall. They could act as “bioretention areas” as well, by removing a load of pollutants while reducing runoff thanks to the action of specific vegetation. Barber et al. (2003) evidenced that infiltration basins can be effective in reducing peak runoff by up 65–87% (“small storms”), 50–60% (“medium storms”), and 40% (“large storms”).
The agricultural NWRM are “meadows and pastures,” areas with vegetation as grass or a combination between grass and woody plants. Due to their rooted soils and their permanent cover, these areas provide good conditions for water storage during temporary flooding as flash flood while slowing runoff. As infiltration basins, these solutions are capable of protecting water quality by trapping sediments and nutrients. As Kedziora (2010) mentioned, meadows in Poland's specific region during the wet year (936 mm estimated) can reduce runoff by 23% for arable land.
Sensitivity Analysis of the Model
Sensitivity analysis (SA) is an important tool for investigating model behaviours (Wagener and Pianosi, 2019). SA is not the same as an uncertainty analysis which represents attempts to describe the entire set of possible outcomes, together with their associated probabilities of occurrence. Sensitivity analysis aims to determine the change in model output values that results from modest changes in model input values. SA assesses how variations in input parameters affect the model output. Any little significant parameters produce a small change in the model's output. At the same time, considerable inputs substantially affect the results, allowing the model's improvement and calibration. SA is considered a general investigation of the uncertainty and model precision used to assess system performance for alternatives scenarios. As a result, this analysis should be interesting to the general public as planners since its results should provide information and model predictions (Loucks et al., 2005).
The use of SA in environmental and urban modelling has become important due to the high complexity of natural and urban systems. Additionally, this complexity evokes models' complex nature, particularly if considered spatially distributed models that include parameters' spatial nature (Koo et al., 2020). Different methods of sensitivity analysis are grouped into two large classes: local and global sensitivity analysis.
This research is focussed on the local sensitivity analysis (LSA), paying attention to the local impact of input parameters on the model's output (Douglas-Smith et al., 2020). We run the model two times by modifying data input related to rainfall events considering 50 and 70 mm of rain as extreme events. Output' sensitivity analysis was conducted to analyse the variance between input and output.
This sensitivity test's assessment method is conducted by calculating the partial derivatives of the input factor X (rain amount) with respect to the output Y (Norton, 2015). The slope of the function represents the function of sensitivity (Equation 1):
Considering the rainfall variation of 40% (from 50 to 70 mm), the result of the sensitivity test gives a flexible outcome with the value Si, j equal to 1.76. This means that changing one single parameter in this case, the rainfall input in InVEST model, the output presents a disproportion in the amount of runoff volume generated. Indeed, this imbalance is almost double (1.76 close to 2) regarding the increase of the input parameter on rainfall. With an increase of 40% in the rainfall intensity, the runoff index has increased on average by 70%, which indicates that an increase in rainfall intensity causes huge runoff, as also confirmed by Kadaverugu et al. (2021).
Conclusion
This research represents a first attempt to adopt the InVEST flood model as a tool for the definition of adaptation planning strategies to cope with flash flood events due to extreme rainfalls in a complex urban area, as the Metropolitan area of Genoa (Italy). Mainly, this study wanted to raise awareness by providing applied knowledge around a way of employment of this new InVEST model. The quantification of spatially explicit runoff enabled a comparative analysis to evaluate flash flood vulnerabilities at the watersheds level. The estimated runoff has been considered basically from the integration of land use and soil hydrological conductivity maps.
The model was performed two times by considering different extremes rainfall events (50 and 70 mm) to determine runoff variation useful to identify resilience ranking classes to flash flood finally. This result supported the adoption of site-specific NWRM in the less resilient watershed, demonstrating how performance-based solutions can support decision-making in planning.
Even if the InVEST model uses a simple approach (SCS-Curve Number) which has limitations and uncertainties, the ranking on different land uses are generally well-captured by such model's method (as the effect of natural infrastructures qualitatively represented in the model output). This research presents some limitations and the results presented could be deepened by further studies while testing the effect of natural measures implementation through the running model at different times. Moreover, as discussed in section Sensitivity Analysis of the Model, the InVEST model presented high sensitivity to a change in the rain input parameter. Therefore, this issue could be critical in defining adaptation solutions, especially in a complex urban catchment. This one analysed, where a little variation of rain could determine consequences in planning strategies.
The observed result regarding the sensitivity analysis could be the starting point for future research that deepens the sensitivity testing for Flood Risk Mitigation models' output. Understanding from which amount of rain in the study context will be generated a disproportion in the volume of runoff produced could be useful to define the theoretical reference threshold to evaluate resilient strategies against flash flood events in this specific context of the study.
In general, this InVEST model appears to be a useful tool for urban planners to define adaptive strategies to cope with flash flood events in a metropolitan area and discussed with the presented case studies in sections Natershed Resilience to Flash Flood and Natural Water Retention Measures (NWRM) Per Land Use. However, to consider integrating this tool and related vulnerability analysis into urban planning instruments in the context of climate change adaptation, an in-depth assessment of hydrological aspects and outputs should be implemented. Otherwise, the definition of adaptation measures could be related to implementing scenarios while considering different biophysical values of runoff retention capacity. Indeed. working with models requires to incorporate what is known about the uncertainty into input parameters through simulation scenarios while helping in quantifying the uncertainty in the resulting model predictions. In this way, the contribution of diffuse implementation of NWRM scenarios to manage flash flood risk can be estimated in biophysical terms over the analysed urban context.
Data Availability Statement
The raw data supporting the conclusions of this article will be made available by the authors, without undue reservation.
Author Contributions
CQ, EC, and AP: conceptualisation, review, and editing. CQ: investigation, writing for Introduction, Methodology, Results and Discussion, and Conclusion, data curation, and validation. EC and AP: supervision. All authors contributed to the article and approved the submitted version.
Conflict of Interest
The authors declare that the research was conducted in the absence of any commercial or financial relationships that could be construed as a potential conflict of interest.
Footnotes
1. ^Available online at: https://en.climate-data.org/.
2. ^Available online at: https://www.arpal.liguria.it/homepage/meteo/analisi-climatologiche/atlante-climatico-della-liguria.html.
3. ^Available online at: https://geoportal.regione.liguria.it/catalogo/mappe.html.
4. ^Available online at: https://naturalcapitalproject.stanford.edu/software/invest.
5. ^Available online at: https://geoportal.regione.liguria.it/catalogo/mappe.html.
6. ^https://www.arpal.liguria.it/homepage/meteo/glossario/classificazione-soglie-e-ore.html
7. ^Available online at: https://www.nrcs.usda.gov/wps/portal/nrcs/main/soils/survey/class/taxonomy/.
8. ^Available online at: https://geoportal.regione.liguria.it/catalogo/mappe.html.
9. ^Available online at: http://groupware.sinanet.isprambiente.it/uso-copertura-e-consumo-di-suolo/library/consumo-di-suolo.
10. ^Piani di Bacino: http://www.pianidibacino.ambienteinliguria.it/GE/genova.html.
11. ^Available online at: http://nwrm.eu/.
References
Abdelrahman, M. A. E., Natarajan, A., and Hegde, R. (2016). Assessment of land suitability and capability by integrating remote sensing and GIS for agriculture in Chamarajanagar district, Karnataka, India. Egyptian J. Remote Sensing Space Sci. 19, 125–141. doi: 10.1016/j.ejrs.2016.02.001
Banasik, K., Krajewski, A., Sikorska, A., and Hejduk, L. (2014). Curve number estimation for a small urban catchment from recorded rainfall-runoff events. Arch. Environ. Protect. 40, 75–86. doi: 10.2478/aep-2014-0032
Barber, M. E., King, S. G., Yonge, D. R., and Hathhorn, W. E. (2003). Ecology ditch: a best management practice for storm water runoff mitigation. J. Hydrologic Eng. 8, 111–122. doi: 10.1061/(ASCE)1084-0699(2003)8:3(111)
Berndtsson, R., Becker, P., Persson, A., Aspegren, H., Haghighatafshar, S., Jönsson, K., et al. (2019). Drivers of changing urban flood risk: a framework for action. J. Environ. Manage. 240, 47–56. doi: 10.1016/j.jenvman.2019.03.094
Blanc, J., Arthur, S., and Wright, G. (2012). Natural Flood Management (NFM) Knowledge System: Part 1 – Sustainable Urban Drainage Systems (SUDS) and Flood Management in Urban Areas. Available online at: http://www.crew.ac.uk/sites/default/files/sites/default/files/publication/CREW_NFMProject_SUDS.pdf
Brunetta, G., Ceravolo, R., Barbieri, C. A., Borghini, A., de Carlo, F., Mela, A., et al. (2019). Territorial resilience: toward a proactive meaning for spatial planning. Sustainability 11, 1–17. doi: 10.3390/su11082286
Brunetta, G., and Salata, S. (2019). Mapping urban resilience for spatial planning—a first attempt to measure the vulnerability of the system. Sustainability 11, 1–24. doi: 10.3390/su11082331
Burian, S., and Edwards, F. (2002). “Historical perspectives of urban drainage,” in Global Solutions for Urban Drainage, eds E. W. Strecker, and W. C. Huber (Portland; Reston, VA: American Society of Civil Engineers), 1–16. doi: 10.1061/40644(2002)284
Debele, S. E., Kumar, P., Sahani, J., Marti-Cardona, B., Mickovski, S. B., Leo, L. S., et al. (2019). Nature-based solutions for hydro-meteorological hazards: revised concepts, classification schemes and databases. Environ. Res. 179:108799. doi: 10.1016/j.envres.2019.108799
Douglas-Smith, D., Iwanaga, T., Croke, B. F., and Jakeman, A. J. (2020). Certain trends in uncertainty and sensitivity analysis: an overview of software tools and techniques. Environ. Model. Softw. 124:104588. doi: 10.1016/j.envsoft.2019.104588
Dushkova, D., and Haase, D. (2020). Not simply green: nature-based solutions as a concept and practical approach for sustainability studies and planning agendas in cities. Land. 9:19. doi: 10.3390/land9010019
Eli, R. N., and Lamont, S. J. (2010). “Curve numbers and urban runoff modeling - application limitations,” in Low Impact Development 2010: Redefining Water in the City - Proceedings of the 2010 International Low Impact Development Conference (San Francisco, CA), 405–418. doi: 10.1061/41099(367)36
Engberg, L. A. (2018). “Climate adaptation and citizens participation in denmark: experiences from copenhagen,” in Climate Change in Cities. The Urban, eds S. Hughes, E. K. Chu, and S. G. Mason (Cham: Springer), 139–161. doi: 10.1007/978-3-319-65003-6_8
Grêt-Regamey, A., Altwegg, J., Sirén, E. A., Van Strien, M. J., and Weibel, B. (2017). Integrating ecosystem services into spatial planning—A spatial decision support tool. Landsc. Urban Plann. 165, 206–219. doi: 10.1016/j.landurbplan.2016.05.003
Hernández-Hernández, M., Olcina, J., and Morote, Á. F. (2020). Urban stormwater management, a tool for adapting to climate change: from risk to resource. Water 12, 1–20. doi: 10.3390/w12092616
Houston, D., Werrity, A., Bassett, D., Geddes, A., Hoolachan, A., and McMillan, M. (2011). Pluvial (Rain-Related) Flooding in Urban Areas: The Invisible Hazard. York: Joseph Rowntree Foundation. Available online at: http://www.jrf.org.uk/publications/pluvial-flooding-invisible-hazard
Huang, J., Wu, P., and Zhao, X. (2013). Effects of rainfall intensity, underlying surface and slope gradient on soil infiltration under simulated rainfall experiments. Catena 104, 93–102. doi: 10.1016/j.catena.2012.10.013
Kadaverugu, A., Nageshwar Rao, C., and Viswanadh, G. K. (2021). Quantification of flood mitigation services by urban green spaces using InVEST model: a case study of Hyderabad city, India. Model. Earth Syst. Environ. 7, 589–602. doi: 10.1007/s40808-020-00937-0
Kedziora, A. (2010). Landscape management practices for maintenance and enhancement of ecosystem services in a countryside. Ecohydrol. Hydrobiol. 10, 133–152. doi: 10.2478/v10104-011-0006-7
Koo, H., Iwanaga, T., Croke, B. F., Jakeman, A. J., Yang, J., Wang, H. H., et al. (2020). Position paper: sensitivity analysis of spatially distributed environmental models- a pragmatic framework for the exploration of uncertainty sources. Environ. Model. Softw. 134:104857. doi: 10.1016/j.envsoft.2020.104857
Liu, J., Zhang, G., Zhuang, Z., Cheng, Q., Gao, Y., Chen, T., et al. (2017). A new perspective for urban development boundary delineation based on SLEUTH-InVEST model. Habitat Int. 70, 13–23. doi: 10.1016/j.habitatint.2017.09.009
Loucks, D. P., van Beek, E., Stedinger, J. R., Dijkman, J. P. M., and Villars, M. T. (2005). Water Resources Systems Planning and Management: An Introduction to Methods, Models and Applications, Water Resources Systems Planning and Management An Introduction to Methods, Models and Applications. Paris: UNESCO.
Matthews, T., Lo, A. Y., and Byrne, J. A. (2015). Reconceptualizing green infrastructure for climate change adaptation: barriers to adoption and drivers for uptake by spatial planners. Landsc. Urban Plann. 138, 155–163. doi: 10.1016/j.landurbplan.2015.02.010
Norton, J. (2015). An introduction to sensitivity assessment of simulation models. Environ. Model. Softw. 69, 166–174. doi: 10.1016/j.envsoft.2015.03.020
Pappalardo, V., La Rosa, D., Campisano, A., and La Greca, P. (2017). The potential of green infrastructure application in urban runoff control for land use planning: a preliminary evaluation from a southern Italy case study. Ecosyst. Serv. 26, 345–354. doi: 10.1016/j.ecoser.2017.04.015
Qi, Y., Chan, F. K. S., Thorne, C., O'Donnell, E., Quagliolo, C., Comino, E., et al. (2020). Addressing challenges of urban water management in chinese sponge cities via nature-based solutions. Water 12, 1–24. doi: 10.3390/w12102788
Rosenzweig, B., Ruddell, B. L., McPhillips, L., Hobbins, R., McPhearson, T., Cheng, Z., et al. (2019). Developing knowledge systems for urban resilience to cloudburst rain events. Environ. Sci. Policy 99, 150–159. doi: 10.1016/j.envsci.2019.05.020
Sörensen, J., and Mobini, S. (2017). Pluvial, urban flood mechanisms and characteristics – Assessment based on insurance claims. J. Hydrol. 555, 51–67. doi: 10.1016/j.jhydrol.2017.09.039
United States Department of Agriculture (USDA) (2004). “Hydrologic soil-cover complexes,” in National Engineering Handbook: Part 630 - Hydrology. Available online at: https://www.nrcs.usda.gov/wps/portal/nrcs/detailfull/national/water/manage/hydrology/?cid=stelprdb1043063
United States Department of Agriculture (USDA) (2009). “Hydrologic soil groups,” in National Engineering Handbook: Part 630 - Hydrology. Available online at: https://www.nrcs.usda.gov/wps/portal/nrcs/detailfull/national/water/manage/hydrology/?cid=stelprdb1043063
Wagener, T., and Pianosi, F. (2019). What has Global Sensitivity Analysis ever done for us? A systematic review to support scientific advancement and to inform policy-making in earth system modelling. Earth Sci. Rev. 194, 1–18. doi: 10.1016/j.earscirev.2019.04.006
Woolley, R., Marsell, R., and Grover, N. (1946). Cloudburst Floods in Utah. 1850-1938. U.S. Geologic Survey. Available online at: http://pubs.usgs.gov/wsp/0994/report.pdf
Keywords: urban flood resilience, natural water retention measures, urban runoff, InVEST model, coastal cities
Citation: Quagliolo C, Comino E and Pezzoli A (2021) Experimental Flash Floods Assessment Through Urban Flood Risk Mitigation (UFRM) Model: The Case Study of Ligurian Coastal Cities. Front. Water 3:663378. doi: 10.3389/frwa.2021.663378
Received: 02 February 2021; Accepted: 03 May 2021;
Published: 31 May 2021.
Edited by:
Julie A. Winkler, Michigan State University, United StatesReviewed by:
Erik Nordman, Grand Valley State University, United StatesPilar Andrea Barria, University of Los Lagos, Chile
Copyright © 2021 Quagliolo, Comino and Pezzoli. This is an open-access article distributed under the terms of the Creative Commons Attribution License (CC BY). The use, distribution or reproduction in other forums is permitted, provided the original author(s) and the copyright owner(s) are credited and that the original publication in this journal is cited, in accordance with accepted academic practice. No use, distribution or reproduction is permitted which does not comply with these terms.
*Correspondence: Carlotta Quagliolo, Y2FybG90dGEucXVhZ2xpb2xvQHBvbGl0by5pdA==