 Qina Yan1*†
 Praveen Kumar1,2
- 1Department of Civil and Environmental Engineering, University of Illinois at Urbana-Champaign, Urbana, IL, United States
- 2Department of Atmospheric Sciences, University of Illinois at Urbana-Champaign, Urbana, IL, United States
Soil respiration that releases CO2 into the atmosphere roughly balances the net primary productivity and varies widely in space and time. However, predicting its spatial variability, particularly in intensively managed landscapes, is challenging due to a lack of understanding of the roles of soil organic carbon (SOC) redistribution resulting from accelerated soil erosion. Here we simulate the heterotrophic carbon loss (HCL)—defined as microbial decomposition of SOC—with soil transport, SOC surface redistribution, and biogeochemical transformation in an agricultural field. The results show that accelerated soil erosion extends the spatial variation of the HCL, and the mechanical-mixing due to tillage further accentuates the contrast. The peak values of HCL occur in areas where soil transport rates are relatively small. Moreover, HCL has a strong correlation with the SOC redistribution rate rather than the soil transport rate. This work characterizes the roles of soil and SOC transport in restructuring the spatial variability of HCL at high spatio-temporal resolution.
1. Introduction
Soil is the largest reservoir of carbon in the terrestrial system, which contains an estimated 1,500–2,400 Pg C (Friedlingstein et al., 2020). The amount of CO2 released through soil respiration contributes to about 120 Pg C/yr to the atmosphere, which roughly balances the net primary productivity but much higher than what fossil fuel burning contributes to the atmosphere (≈9 Pg C/yr) (Boden et al., 2010; Friedlingstein et al., 2020). A small perturbation of the carbon flux released from soils through anthropogenic events (e.g., farming activities) can potentially rival the fossil fuel loading. Therefore, understanding the spatio-temporal dynamics of soil respiration rate is vital for quantifying terrestrial carbon cycling and developing future climate change mitigation strategies.
Soil respiration can be characterized as (1) root and litter respiration (autotrophic carbon loss), and (2) microbial metabolic decomposition of organic carbon (heterotrophic carbon loss). The heterotrophic carbon loss (HCL) is sustained by organic matter inputs to the soil from above-ground litterfall, humic substances, and root detritus. HCL makes up approximately 40–60% of the total respiration, and this ratio is relatively constant in different environmental settings (Raich and Potter, 1995; Bond-Lamberty et al., 2004; Hashimoto et al., 2015). Many studies have investigated factors that directly influence the HCL such as soil type, land cover, and climate (Ise and Moorcroft, 2006; Prescott, 2010; Stockmann et al., 2013; Catalán et al., 2016; Xu et al., 2016; Sierra et al., 2017). However, an increasingly important factor affecting the HCL that has not been well-studied is the direct and indirect influences of the accelerated soil erosion (Billings et al., 2019); particularly in intensive agriculture, which includes seasonal land cover change, tillage, irrigation, surface and sub-surface drainage infrastructure, and topographic modification. These activities result in accelerated mobilization of soil organic carbon (SOC) from uplands and its burial in bottomlands, which may alter the fate and rate of HCL. In this work, we use a modeling based study (Yan et al., 2019, 2020) to characterize the HCL and its dependence on erosional and depositional processes due to the rapid soil transport over time in a watershed.
The HCL through a soil column is directly controlled by microbial activity, soil moisture, soil temperature, soil carbon and nitrogen content, vegetation cover, and other soil properties (Stockmann et al., 2013). Topographic variability such as gradient, curvature, and aspect, on the other hand, controls the HCL indirectly by affecting soil moisture and soil transport (erosion and deposition) rate. The anthropogenic activities have accelerated the soil erosion rate up to 1,000 times (Amundson et al., 2015), and such soil perturbations have potentially contributed to a large portion of global atmospheric CO2 (Schimel, 1995; Foley et al., 2005). Soil erosion leads to the exposure of subsoils or parent material. The newly exposed subsoils have slower HCL rates because the formerly deeper soils have lower carbon content and tend to increase subsoils weathering rate, which could favor C sequestration and provide local net sinks of atmospheric C (Berhe et al., 2007; Van Oost et al., 2007; Quinton et al., 2010; Doetterl et al., 2016; Yan et al., 2019). At depositional sites, former top-layer soils with relatively high SOC content are gradually buried into deeper layers. This process may result in a vertical profile that has the highest content at some depth from the surface, i.e., a “nose” in the SOC profile below the surface (Yan et al., 2019), which is in contrast to the exponential profile of SOC that is used as a typical representation of natural settings (Jobbágy and Jackson, 2000; Rosenbloom et al., 2006; Wynn et al., 2006; Fontaine et al., 2007). The burial of SOC may suppress the decay rate in a water-saturated, and hence oxygen limited slow turn-over environments (Wilson et al., 2009; Doetterl et al., 2016); and therefore, reduce the HCL (which equals the decay rate times the SOC amount). On the other hand, it may also increase the total HCL amount because of the higher SOC availability and the possibility of the breaking down of buried topsoil aggregates which may alter the chemical reactivity (Wilson et al., 2009). Therefore, quantifying the impacts of the lateral redistribution of SOC (defined as the outcomes of physical movement of SOC driven by the soil movement in the two-dimensional land surface [M/L2/T]) on the spatial variability of HCL remains an open problem.
Quantitative estimation of the vertical distribution of HCL is critical for estimating the production of CO2 (Fontaine et al., 2007; Cheng et al., 2017). Most of the studies so far have focused on topsoils (<0.2 m) because the SOC is relatively young with short turnover time (i.e., decades or less) (Hopkins et al., 2012), and it is vulnerable to microbial decomposition (Yergeau et al., 2011; Karhu et al., 2014; Crowther et al., 2016). Relatively fewer studies focus on the deeper soil HCL, even though more than half of the total SOC is stored between 0.2 and 1 m depth (Jobbágy and Jackson, 2000; David et al., 2009; Wang et al., 2014; Wiaux et al., 2014; Berhe and Torn, 2017; Zieger et al., 2017). Previous understanding is that deeper SOC has longer turnover (i.e., centuries to millennia) (Rumpel et al., 2002; Cheng et al., 2017) and hence has a longer feedback time to climate and landscape evolution. However, deeper SOC at depositional sites could be still relatively young, due to the accelerated burial of surface soils detached at erosional sites, and hence contribute to a portion of CO2 release. Therefore, quantifying the HCL from the SOC stored through the vertical soil column is necessary but remains highly uncertain and challenging (Stockmann et al., 2013).
In this work, we use a process-based quasi 3-D model, SCALE (Soil Carbon and Landscape co-Evolution) (Yan et al., 2019), to study how landscape evolution and biogeochemical transformation collectively affect the HCL profiles under the influence of accelerated soil erosion and deposition as well as the mechanical-mixing from tillage. The model has been already validated about its ability to capture the evolution of vertical profiles of SOC across a landscape gradient for the study site presented here (Yan et al., 2019). We first explain the equations associated with the HCL in the SCALE model, and introduce the inputs and forcing of our study site. Then we discuss simulation results that highlight the roles of lateral redistribution of SOC in determining the HCL through soil columns.
2. Methodology and Study Site
2.1. SOC Decomposition
SOC is a continuum of progressively decomposing organic components ranging from labile compounds that decompose quickly to recalcitrant compounds that decomposes extremely slowly (Lehmann and Kleber, 2015). Following the SCALE model (Yan et al., 2019), here we categorize SOC into three pools with feedbacks between each other—fast pool (Cl), slow pool (Ch), and microbial biomass (Cb) (Porporato et al., 2003). Combining the biogeochemical transformation, soil erosion/deposition (and resultant landscape evolution), and bioturbation by soil fauna, the SOC mass conservation in a soil column is summarized as Yan et al. (2019):
where subscripts 1 and n denote the surface soil layer and the nth layer below-surface, respectively; is the SOC content, where Cl, Ch, Cb represent the fast (or litter), slow (or humus), and microbial biomass pools, respectively [ML−3]; t represents time [T], z represents soil depth [L], ∇ · qC is the sum of surface SOC fluxes due to erosion from overland flow and diffusion-like surface transport (Yan et al., 2019); ∇ · [D(z)∇C] is the vertical diffusion process resulting from bioturbation by soil fauna, where D(z) is the bioturbation diffusivity, parameterized as (Quijano et al., 2013). The biogeochemical transformation term g represents the carbon influx from above- and below-ground plant residues, and carbon efflux due to decomposition throughout the three pools. Their relationships are shown as Porporato et al. (2003):
where Ilitter is the litter input from litterfall and root-litter [ML−2T−1]; krd is the death rate of microbes [T−1]; rh is referred to as “isohumic” coefficient (Wild, 1988), which is the fraction of decomposing litter that undergoes humification and ranges from 0.15 to 0.35 [−] (Brady and Weil, 1996; O'dorico et al., 2003; Porporato et al., 2003); rr defines the fraction of decomposed organic C to CO2 [−] (0 ≤ rr ≤ 1 − rh); Kl and Kh are decomposition rate in fast and slow pool, respectively [T−1]. These two rates are regulated by microbial biomass, soil moisture, C/N ratio, and soil temperature. The influence of soil temperature is not addressed in this study but can be added within this framework as needed.
The control of microbial biomass, soil moisture and C/N ratio on the decomposition rates in the fast pool (Kl) and slow pool (Kh) are given below (Porporato et al., 2003):
where kl and kh represent the rates of decomposition as simplified terms that encompass different organic components in fast and slow pools, respectively [L3T−1M−1]; φ is a ratio that is from the reduction of the decomposition rate if the immobilization (controlled by nitrogen content) fails to meet the nitrogen demand by the microbes [−]. φ ≈ 1 in agricultural fields where nitrogen supply is usually sufficient from fertilizers; fd(θ) [−] represents the soil moisture effects on decomposition. The relationship between soil moisture (θ) and the index fd(θ) is given as Porporato et al. (2003):
The soil moisture is estimated following the Richard's equation for one-dimensional vertical soil moisture dynamics (Yan et al., 2019). The parameters related to the simulation are based on field measurements (Abaci and Papanicolaou, 2009; Wilson et al., 2018). The optimal soil moisture condition is the field capacity (θfc) which provide the maximum decomposition rate (fd(θ) = 1). Drier or wetter conditions will result in a smaller fd(θ), and hence reduce the decomposition rate.
Summing the three terms of g in Equation (2) gives the total rate of change of SOC due to biogeochemical transformation:
The total HCL through the soil column and the effective decay rate (Dr) for SOC are expressed as:
Here we focus on the two key processes resulting from agricultural activities —accelerated soil transport rate and tillage-induced mechanical-mixing on top soils. In our simulations, the soil transport (the net flux the of incoming subtracting the outgoing soil material in a unit volume. In this study, it represents soil depth change rate driven by erosion or deposition [L/T]) is a combination of diffusive-like process of topographic elevation, driven by topographic gradient, wind erosion, biogenic disturbance, soil creep, and rain drop splash; and advective erosion of the topography driven by land surface overland flow process. Soil transport not only results in soil erosion and deposition but also causes the spatial redistribution of SOC contents on the land surface. The redistribution rate of SOC is assumed to be positively proportional to the rate of soil transport, which is captured by ∇·qC term in Equation (1) (Yan et al., 2019).
The tillage happens before planting in Spring season, assuming on day 104 each year, and several days variation around this date does not have any significance bearing on the results presented. The mechanical-mixing from tillage creates a uniform SOC content throughout the tillage depth, assumed here as 20 cm. We investigate the impacts of mechanical-mixing separately from the accelerated soil transport, where the latter arises partially from tillage but also from seasonal landcover change, and other anthropogenic activities.
This study focuses on the CO2 production by microbial decomposition through the soil column. To further translate this to the amount of CO2 released from the soil to the atmosphere, one has to incorporate the control of the CO2 gradient between the soil and atmosphere, mineral absorption, dissolution in soil-water, etc., which is beyond the scope of this study. Also, the impact of soil temperature is an important factor in the SOC decomposition process but not included in this study because the study area has very low local relief (with a gradient about 0.0002), and therefore, the soil temperature is expected to exhibit little spatial difference in HCL over the time scale of 150 years. However, the soil temperature influences could be added within this framework in future studies.
2.2. Study Site, Forcing, and Initial Conditions
We performed our study in a first-order sub-watershed in the Clear Creek Watershed (CCW) in eastern Iowa (Figure 1). The CCW represents most Midwestern watersheds regarding the Mollisols soils, humid-continental climate (hot summers, cold winters, and wet springs with freeze-thaw periods in late fall and early spring), and predominantly agricultural land use. The surface layer soils are loess-derived, which is highly productive but also highly erodible. The mean annual precipitation is about 889 mm with prominent thunderstorms in the summer and snowfall in the winter. The mean annual temperature is 9°C with mean warmest month at 29°C and mean coldest month at −13°C. This area was prairie wetlands and forests until the European Settlement in 1880s since when farming activities eventually converted about 80% of the lands to crops and pastures. After transforming into farmable lands, soil transport (erosion and deposition) was accelerated since then (Kumar et al., 2018).
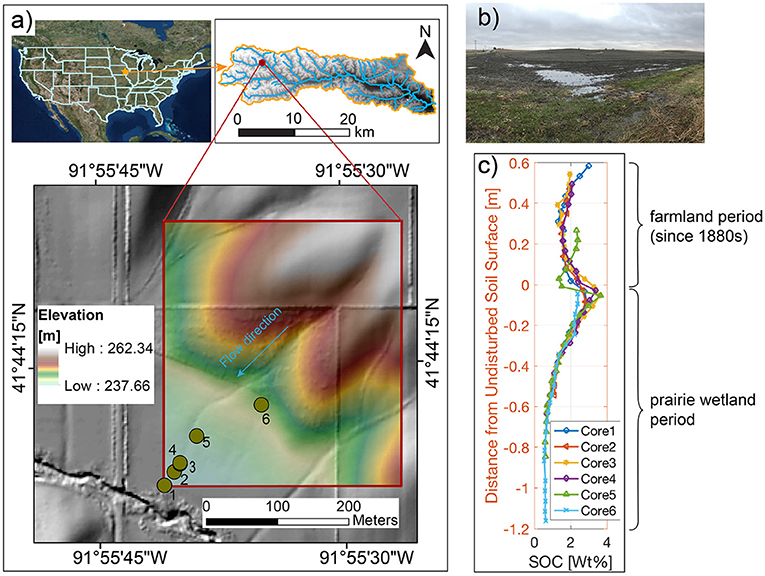
Figure 1. Study site and core sampling (adapted from Yan et al., 2019) with permission from Wiley. (a) Study site and 2 m digital elevation model (DEM). The six dots are locations where soil-core samples are collected. (b) The field view. (c) The SOC concentration profiles of the six cores that have been realigned so that zero depth corresponds to estimated pre-industrial agricultural period. The six profiles with re-alignment show a “nose” below the surface in the depositional sites. The “nose” is a result of the burial of legacy carbon due to accelerated deposition of soils after European Settlement and associated SOC mobilized from upland erosion.
The forcing includes daily precipitation from stochastic simulation, daily organic carbon input from plant litters, corn-soybean rotation in alternate years, and soil properties (i.e., saturated hydraulic conductivity, soil porosity, maximum infiltration rate, and Van Genuchten parameters). The forcing that drives the physical and biogeochemical processes is spatially uniform due to a relatively small size study domain (0.15 km2). The initial values of this simulation include light detection and ranging (lidar) Digital Elevation Model (DEM), which provides a 2-m resolution as for the land surface grid size; SOC and soil moisture profiles at each grid cell; and soil layer thickness at each grid cell. The vertical profiles of SOC and soil moisture along the soil depth have seven grids (see values in Table 1) and are updated after each computational time step. The control volumes of the vertical grids are dynamic because of the changing elevations due to surface soil transport (Yan et al., 2019). Except for the elevation, all other variables are spatially uniform at an initial stage of the simulation. The key variables and corresponding initial values are provided here (Table 1). The full list of input parameters are summarized in Yan et al. (2019) and are not repeated here for brevity.
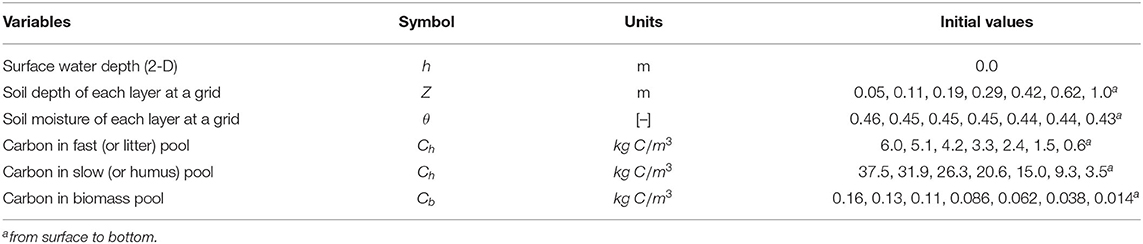
Table 1. Variables and initial values.
Our simulation starts with an initially exponential SOC profile as a function of depth. This profile is computed based on a steady-state between C input from plant residues and decomposition under climate forcing (Yan et al., 2019) because local prairie wetlands were formed and provided a relatively stable SOC condition after thousands of years after the end of the last glacial episode (Yan et al., 2017). This site has previously served as a validation site of the SCALE model (Yan et al., 2019) in characterizing the spatial heterogeneity of the evolution of SOC profiles. The simulated spatial mean soil transport rate after 150 years of anthropogenic influences is ~1 mm/yr (Yan et al., 2019), which has been validated with field measurements (Wilson et al., 2009; Papanicolaou et al., 2015). We implemented the mechanical-mixing at year 100 when the HCL has reached steady-state from soil transport, litter input, meteorologic forcing, and natural bioturbation driven diffusive mixing. The mechanical-mixing, a result of tillage in agriculture practices, mixes the top 20 cm of the soil creating a uniform SOC profiles but conserves the total carbon mass. Our assumption here is that the soil depth change is all from the surface soil transport and not from the soil bottom weathering. The main reason is that the bottom of soils is layered with loess and glacial drifts, and the weathering processes are much slower than the surface transport rate, which is very different compared to mountainous areas (Anders et al., 2018; Yan et al., 2021).
3. Results and Discussion
3.1. Time Series of SOC Decomposition at Erosional and Depositional Sites
We simulated a 150-year period to understand the long-term dynamics of HCL (Figure 2) due to the influences of accelerated soil transport (and the resultant landscape evolution) and mechanical-mixing. The HCL reached a dynamic steady-state at around 75 years before the mechanical mixing started, and a new dynamic steady-state re-established approximately 40 years after the implementation of the mechanical mixing at year 100. The accelerated transport of solid phase of soil material leads to an increase of HCL by approximately 40% and 57% before and after the mechanical mixing, respectively (from the initial stage of 28.5 to 40.0 g C/m2/yr at year 75 and 44.8 g C/m2/yr at year 140). To characterize the differences arising from soil erosion and deposition across the landscape, four zones were selected (Figure 2a)—Zones A and D represent areas with the most erosion and deposition, respectively; and Zones B and C are areas with moderate erosion and deposition, respectively. The spatial locations corresponding to the four zones are shown in Figure 2b. The temporally variation of the spatial mean values of each of the four zones as well as the whole watershed are shown in Figure 2c. The annual mean values from year 75 till year 100 for each of the four zones are 21.6, 30.7, 54.5, and 59.3 g C/m2/yr; and from year 140 till year 150 are 16.1, 25.5, 68.5, and 72.8 g C/m2/yr for Zone A, B, C, and D, respectively.
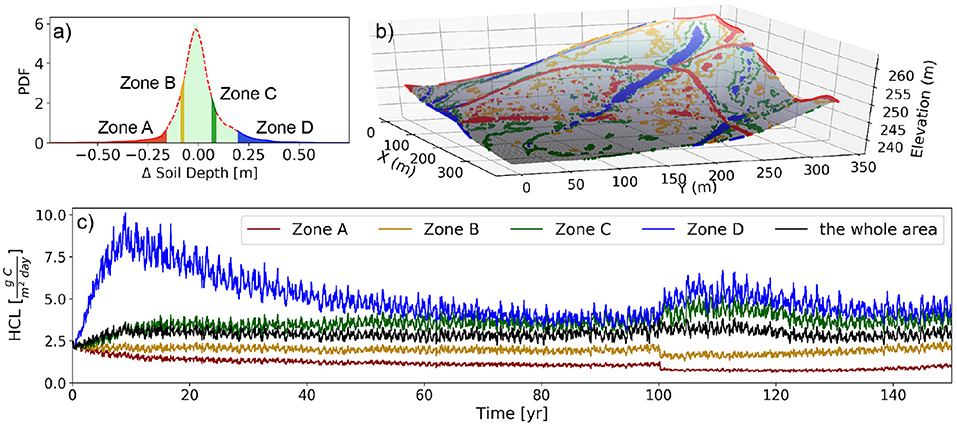
Figure 2. Illustration of spatial variability of the dynamics of heterotrophic carbon loss (HCL). The HCL value at each 2-D grid box is the vertical integration of the HCL through the profile, which corresponds to different soil depth at different locations. (a) Probability density function (PDF) of soil thickness change due to erosion and deposition after 150 years simulation on the landscape along with four selected zones (5% of the total area each) for analysis, corresponding to the high erosion (Zone A) and deposition (Zone D), and moderate erosion (Zone B) and deposition (Zone C). (b) The location of the four zones on the topography. (c) The temporally varying spatial mean values of the HCL of the four zones and the whole watershed. The mechanical-mixing is implemented at year 100. Note (a,b) are adapted from Yan et al. (2019) with permission from Wiley.
Soil respiration rates from field measurement in temperate ecosystems ranges from 10 to 1,500 g C/m2/yr (Bouma and Bryla, 2000; Raich and Tufekcioglu, 2000; Bond-Lamberty and Thomson, 2010a,b). One study measured the annual average soil respiration rate in a corn and soybean field in central Iowa (Tufekcioglu et al., 2001), which is 600–750 g C/m2/yr, and the mean daily soil respiration in corn and soybean ranges about 0.1 to 5 gC/m2/day. Another estimation in corn in WI, USA (von Haden et al., 2019) shows that the annual accumulated HCL is about 550 gC/m2/year. Assuming that the HCL takes approximately half of the total soil respiration (Raich and Potter, 1995; Bond-Lamberty et al., 2004; Bond-Lamberty and Thomson, 2010a; Hashimoto et al., 2015), the HCL is around 300–550 g C/m2/yr in corn-soybean field in the Midwest U.S., and within the total range of 5–750 g C/m2/yr globally. Even though our simulation results are smaller than the two studies in corn fields, we do find sites where the HCL is over 250 g C/m2/yr (see next subsection). The possible reasons that our simulations show smaller values than the measurement would be that (1) the measurements are at a certain location, and possibly in a lower hillslope location, which may tends to be a higher soil respiration spot in a watershed; (2) our litter input from crop residues is around 32 g C/m2/yr, which may be smaller than other study sites; (3) the autotrophic respiration may take a larger portion than 50% to the total soil respiration, and (4) the annual respiration in other studies are predicted based on a growing season then projected into a year, which may overestimation.
Comparing the spatial variation of the HCL in a watershed, the HCL is higher at depositional sites than erosional sites (Figure 2c). Specifically, soil erosion leads to a reduction of HCL, and deposition leads to an increase in HCL. At erosional sites, the removal of surface soils exposes subsoils, which have less available SOC to produce HCL. Further, the newly exposed subsoils tend to have fast weathering rate, which turns the exposed subsoil layers to be unsaturated with sorbed organic carbon compounds. The high capability to store more SOC of the newly exposed subsoils reduces the release of carbon as HCL. At depositional sites, the near-surface SOC that is removed from erosional sites gradually accumulates at depositional zones. The high SOC availability at depositional sites can enhance the HCL; meanwhile, the burial of soils can suppress the decomposition rates (Kl and Kh) in that the microbial biomass and decomposition coefficients (kl and kh, Equation 3) both decrease with depth. The suppression of decomposition would offset the positive influence of the SOC accumulation on the HCL. The simulation result suggests that the accumulation of near-surface SOC in depositional sites plays a more important role on the HCL than the effect of burying SOC. Overall, erosion causes a reduction of HCL by the removal of SOC, which in turn can compensate for the loss of eroded SOC; and deposition leads to an increase of HCL, which offsets the accumulation of deposited SOC.
At year 100 from the start of the simulation (Figure 2c), a mechanical-mixing was implemented to capture the effect of tillage, which vertically homogenized the SOC content of the topsoils (i.e., 20 cm, once a year). The mechanical-mixing reduces the HCL at erosional zones, which eventually slows down the SOC stock loss from erosion. Similarly, the mechanical-mixing enhances the HCL at depositional zones, which eventually slows down the SOC stock accumulation from deposition. In other words, the mechanical-mixing reduces the spatial differences of the rate of SOC stock change among erosional and depositional areas. More discussions about the effect of mechanical-mixing on HCL are given in section 3.4.
3.2. The Non-linear Relationship Between HCL, SOC Transport, and Soil Transport
Comparing the relationship between the soil transport rate and annual accumulated HCL (Δ Soil Depth) at each 2-D grid box in the study domain, we find that the sites with fast soil deposition rate does not necessarily correspond to high HCL (Figure 3A1), even though depositional sites show higher HCL than erosional sites by average. For example, in Zone D (Figure 3A1, highlighted in blue color) where soil thickness increases most due to deposition, it accumulates more solid soils than other zones, but the burial of SOC suppresses its decay rate (due to smaller decomposition coefficients (kl and kh, Equation 3) with increasing soil depth in the model). The highest HCL corresponds to relatively moderate erosional or depositional areas (Zones B and C in Figure 3A1) where there exists steep slopes that are associated with high soil influx (the incoming soil material to a unit volume due to deposition [L/T]) and efflux exchange (the outgoing soil material from a unit volume due to erosion [L/T]).
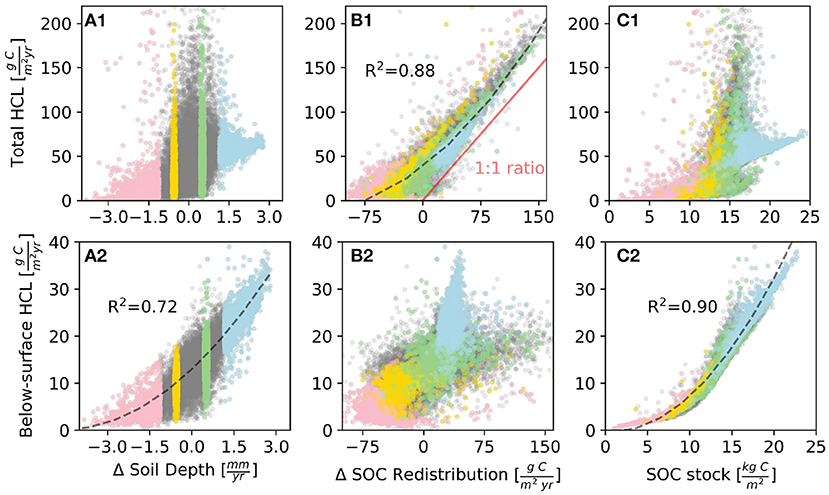
Figure 3. The relationship between heterotrophic carbon loss (HCL), soil thickness change rate, SOC redistribution rate, and SOC stock at each 2-D grid box with annual mean values from years 85 to 90, which is within a period of dynamic steady-state. A positive value means deposition, and vice-versa for erosion. The red, yellow, green, and blue dots correspond to 5% areas of fast erosion areas (Zone A), moderate erosion areas (Zone B), moderate deposition areas (Zone C), and fast depositional areas (Zone D), respectively (Figure 2a). (A1–C1) The total HCL vs. other variables. (A2–C2) The below-surface HCL vs. other variables. The fitting curves (dash lines) are second-order polynomial fitting for (A1,A2,C2). The corresponding R2 values are labeled next to the curves.
Specifically, among Zones B and C, even though the soil transport rate (Δ Soil Depth, defined as the net flux of influx minus efflux), is relatively small; locations with high influx and efflux of soil can create an environment that favors high HCL.
In some other areas among Zone B and C where both the influx and efflux of soil are small, the corresponding HCL is also small. We hypothesize that the high variation of influx and efflux among Zone B and C is the reason that causes high HCL variation.
The total HCL has a strong positive monotonic correlation with the SOC redistribution (R2 = 0.88, Figure 3B1). At sites where SOC redistribution is positive, meaning a net deposition of SOC, the total HCL increases almost linearly with SOC redistribution. The ratio of total HCL to SOC redistribution is close to but larger than one (Figure 3B1), and the SOC redistribution accounts for approximately 65% of the total HCL in depositional sites. This implies that most of the HCL is from the SOC redistribution, and a small portion of HCL is from local immobile SOC. As with the HCL, the areas that have highest spatial variation of SOC redistribution rates correspond to the very small soil transport rate (Δ Soil Depth) (Figure 4A). This demonstrates that a zero net flux of soil transport would not necessarily result in a zero net flux of SOC redistribution because the SOC concentration is not spatially uniform. There exist areas, even though relatively small, where the values of influx and efflux of soil are similar (where Δsoil depth ≈ 0) but SOC redistribution and HCL variation are relatively high.
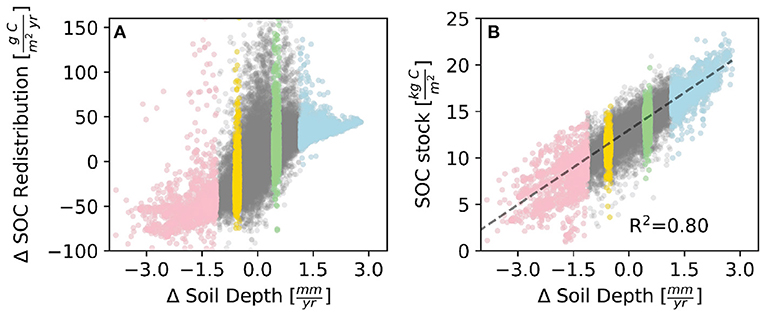
Figure 4. The relationship between the annual rate of change of soil depth and (A) SOC redistribution, and (B) SOC stock averaged between years 85 and 90. A positive SOC redistribution means that the incoming SOC flux is higher than outgoing flux (resulting in accumulation), and vice-versa for negative values. The red, yellow, green, and blue dots correspond to 5% areas of fast erosion areas (Zone A), moderate erosion areas (Zone B), moderate deposition areas (Zone C), and fast depositional areas (Zone D), respectively, as shown in Figure 2a.
Regarding the non-linear relationship between SOC stock and HCL, our results show that the highest HCL is around the moderate SOC stock zone rather than the high SOC stock zone (Figure 3C1). This is because the SOC stock has a positive linear relationship with the soil transport rate (Figure 4B), so the relationship of HCL v.s. soil transport is similar as the one of HCL v.s. SOC stock. In our initial settings, the SOC stock is spatially uniform. The factors that drive the spatial heterogeneity of SOC stock are the SOC redistribution and biogeochemical turnover. The biogeochemical turnover is the outcomes of spatially uniform carbon input from plant residues and the microbial decomposition of organic carbon (represented as HCL in this study). The monotonic positive relationship between soil transport and SOC stock implies that the redistributed SOC happens to largely contribute to the HCL, particularly for high HCL sites sot that the HCL systematically influences the impact of SOC redistribution on SOC stock. In other words, this indicates that the detached and thereafter redistributed SOC can be efficiently and rapidly decomposed by microbial biomass. This non-linear relationship between SOC stock and HCL is different from a study in a farm land in Iowa, which claims that soil respiration has a positive correlation with SOC stock (Tufekcioglu et al., 2001). However, we find the positive correlation holds for below-surface HCL and SOC stock.
The below-surface HCL (the sharp shift of HCL rates, starting about 5 cm below the surface) has one order of magnitude smaller than the total HCL (see section 3.3 for more information). The below-surface HCL shows a high positive relationship with SOC stock (R2 = 0.90, Figure 3C2) and a relatively high positive relationship with soil transport (R2 = 0.72, Figure 3A2) because the fast soil deposition leads to high SOC stock (Figure 4B). A high soil transport rate not necessarily leads to a high SOC redistribution, and close to zero soil transport rate corresponds to high variation of SOC redistribution (Figure 4A); therefore, the high values of below-surface HCL corresponds to areas where SOC redistribution are relatively small (Figure 3B2). The below-surface HCL shows opposite correlation with soil transport, SOC redistribution, and SOC stock as compared with total HCL. This indicates that the SOC redistribution mostly affects the surface HCL rather than the processes of the below-surface HCL. For the below-surface HCL, it is mostly controlled by SOC stock. We explore other controling factors on the HCL in the following section.
3.3. Vertical Profiles of SOC Decomposition at Erosional and Depositional Sites
To explore the spatial heterogeneity of the vertical profiles of HCL, the daily mean values of HCL profiles of the four representative zones (Zone A, B, C, and D) are shown in Figure 5A. For all of the zones, the HCL rates decrease rapidly with depth, which is consistent with other studies (Martel and Paul, 1974; Risk et al., 2002; Rumpel et al., 2002; Hirano et al., 2003; Schöning and Kögel-Knabner, 2006; Maier et al., 2011), in that the near-surface HCL is 1 to 2 orders of magnitude higher than those at deeper depths, which is primarily determined by the microbial biomass. The HCL is the product of SOC content and effective decay rates (Equation 6). Similar to the HCL profiles, the near-surface effective decay rate (Dr, in Equation 7) is 1 to 2 orders of magnitude higher than the one below (Figure 5B). Dr is primarily controlled by soil moisture and microbial biomass (Equation 3). The index fd(θ) (Equation 4) represents the influence of soil moisture on the SOC decomposition in that very dry soil condition can reduce Dr because of low microbial activity, and very wet soil condition can also reduce Dr because of limited oxygen access. The optimal soil moisture condition that favors Dr is the field capacity. We show the vertical profile of fd(θ), which increases with depth because deeper layer is closer to the field capacity level (Figure 6A). In other words, the high HCL value at near-surface is primarily determined by Dr rather than SOC content, and Dr is primarily determined by the microbial biomass rather than soil moisture. The surface microbial biomass decreases with increasing soil depth (Figure 6B). Studies show that microbial biomass up to 40 cm can be one to two orders of magnitude higher than layers below (Federle et al., 1986; Sun et al., 2021), which is consistent with our simulation results. The reasons may include higher oxygen in the near surface layers that favors the decomposition and physical protection of SOC from microbial that opposes decomposition.
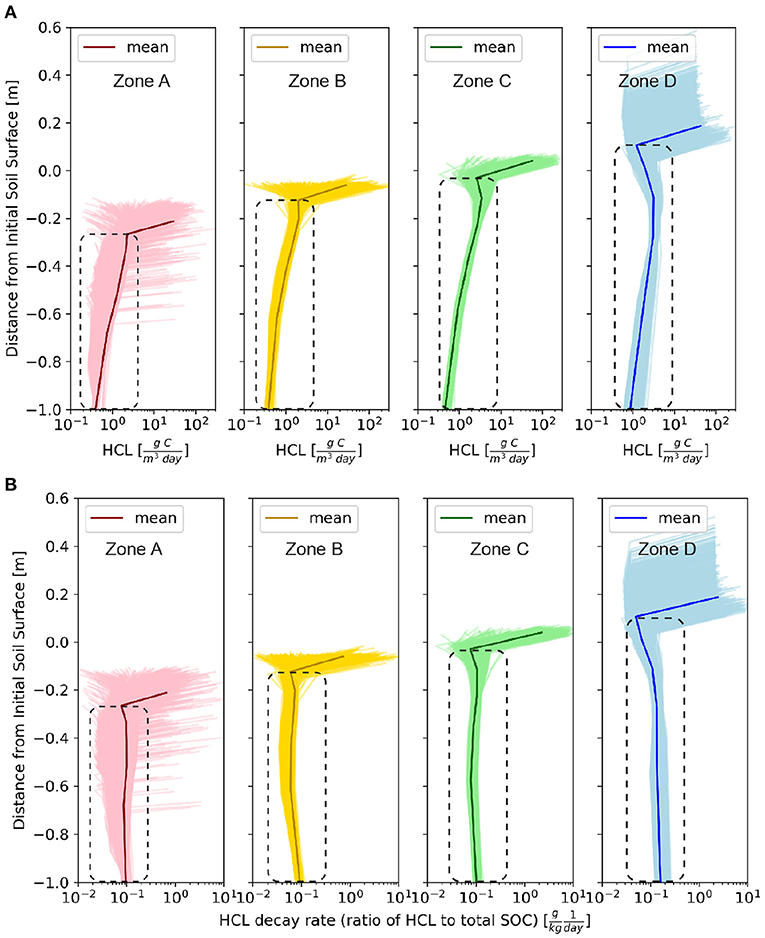
Figure 5. The vertical profiles of daily mean values at a dynamic steady-state condition at 85 years. The dash box corresponds to below-surface layers. (A) The HCL at a dynamic steady-state condition at 85 years. (B) The decay rates Dr (the ratio of heterotrophic carbon loss to the total SOC).
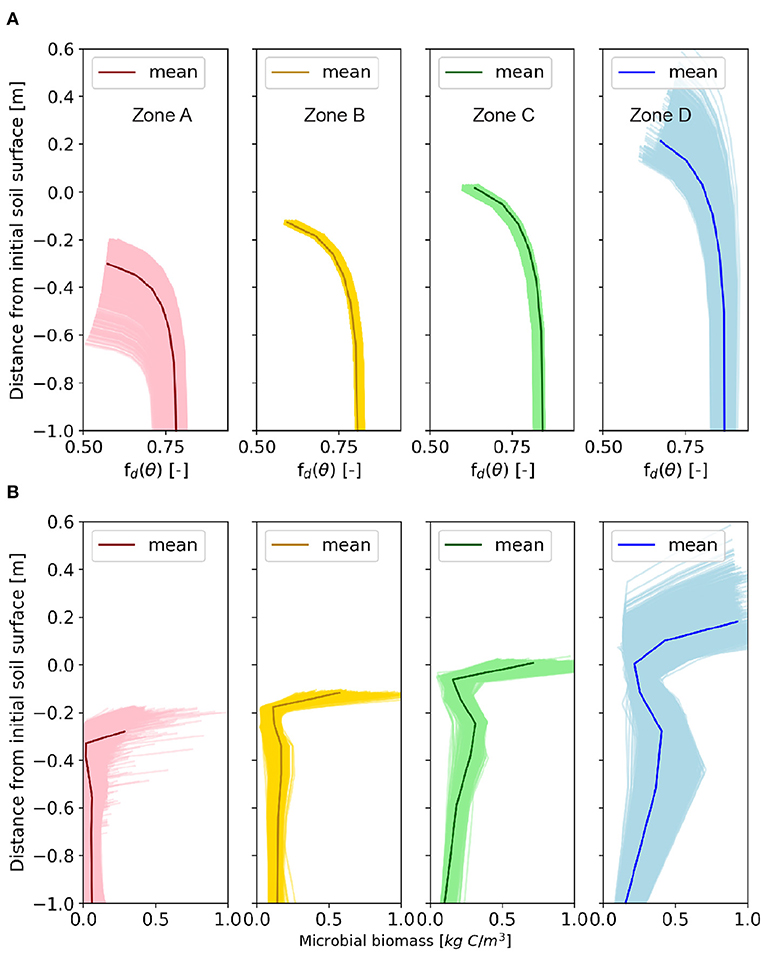
Figure 6. The vertical profiles of (A) soil moisture index, fd(θ), and (B) microbial biomass at year 85. The vertical profiles of fd(θ) and microbial biomass of the four zones, from Zone A to D corresponding to the highest erosional zone, moderate erosional zone, moderate depositional zone, and the highest depositional zone, which correspond to the areas in Figure 2a.
In comparison to the near-surface layer, below-surface HCL profiles are controlled by different factors. The profiles follow a similar trend to the SOC profiles (Figure 1C). At depositional sites, higher content or “noses” show up at deeper depths; whereas at erosional sites, the profiles are exponentially decreasing with depths (Figure 5A). This suggests that the SOC content, rather than the soil moisture or microbial biomass, has a dominant control on the HCL profiles for deep layers. This finding is consistent with the results discussed in section 3.2; and consistent with a study that claims the SOC stock, rather than soil microbial community composition, should be preferentially considered for the spatial soil respiration variance for subsurface layers (Wei et al., 2015). The below-surface effective decay rate, Dr, (Figure 5B) increases slightly toward deeper layers, which is consistent with the fd(θ) profiles (Figure 6A) and suggests that soil moisture has stronger influence on Dr rather than microbial biomass. The microbial profiles (Figure 6B) also shows a “nose” at deep layers at depositional sites, which indicates the influence from SOC content. Therefore, the SOC content rather than soil moisture and microbial biomass plays a more important role on the below-surface HCL profiles.
3.4. The Impact of Mechanical-Mixing on HCL
To investigate the impacts of mechanical-mixing, resulting from tillage, on the vertical profiles and spatial heterogeneity of HCL, we compare the values before and after the implementation of mechanical-mixing in the model at year 100 (Figure 2c). Since the mechanical-mixing homogenizes the near-surface SOC contents, here assumed for the top 20 cm, it reforms the SOC profiles by reducing the surface content at erosional sites (Figure 7A, Zone A and B) and slightly increasing it at depositional sites (Figure 7A, Zone C and D). With all other conditions the same (including landcover and erosion rate), vertically mixing the near-surface SOC contents results in the reduction of surface values of HCL at erosional sites but addition at depositional sites (Figure 7B). In other words, mechanical-mixing suppresses the CO2 release at erosional sites but enhances the CO2 release at depositional sites.
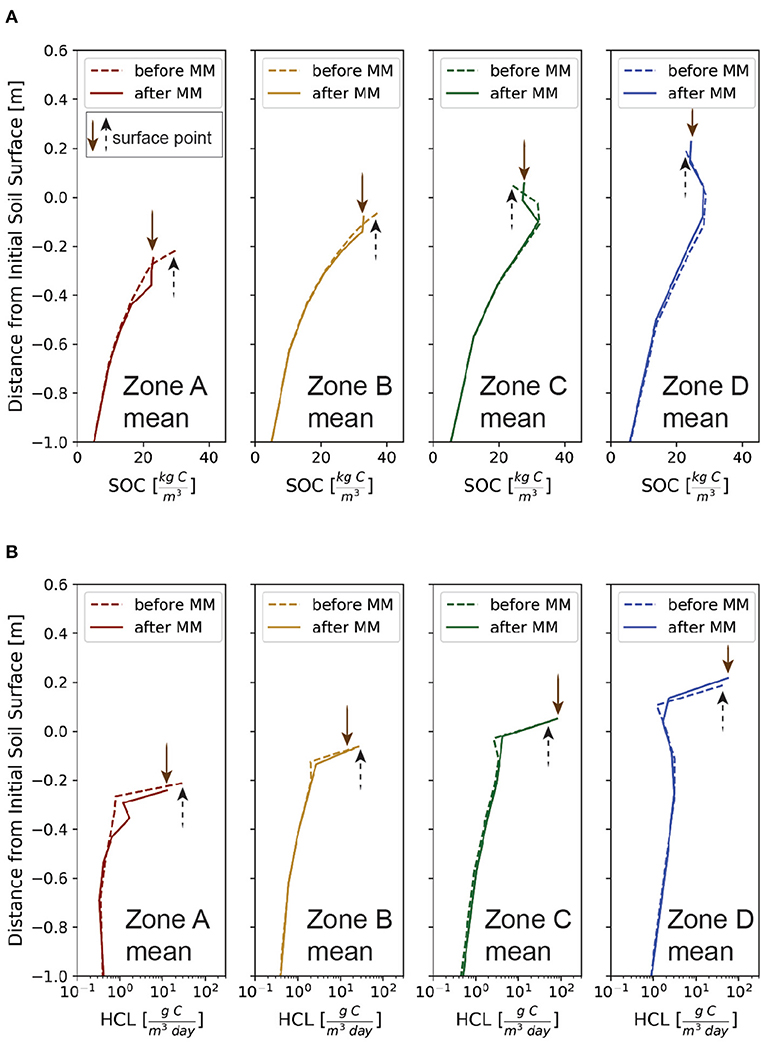
Figure 7. Comparison of (A) SOC and (B) HCL profiles for before and after the mechanical mixing (labeled MM in the figures) for the 4 zones (Figure 2a). The profiles are for spatially averaged daily mean for years 85 and 140 to capture the scenarios before and after mechanical mixing, respectively.
Because the mechanical-mixing enhances the spatial difference of HCL among erosional and depositional sites, the HCL shows a unimodal probability density function (PDF) before mechanical-mixing (Figure 8A) but a bimodal PDF after the mechanical-mixing (Figure 8B). Moreover, among the two PDF plots, the spatial mean values of the HCL is slightly higher after the implementation of mechanical-mixing from 40.0 g C/m2/yr to 44.8 g C/m2/yr due to increase in the vertical distribution of fresh organic carbon input along the soil profile, which provides a source of energy for soil microbes at deeper layers that could stimulate the loss of older buried SOC (Fontaine et al., 2007).
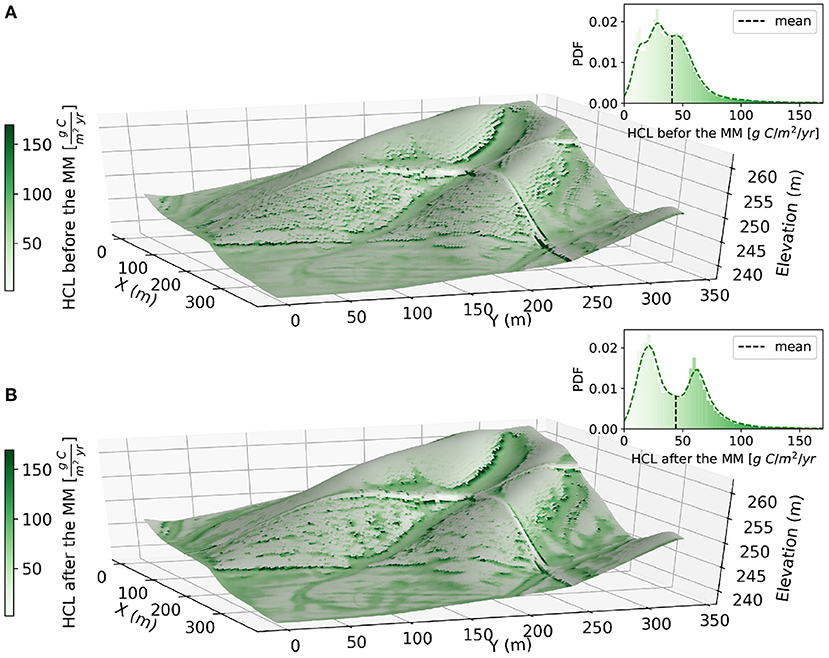
Figure 8. Comparison of the spatial distribution of vertically integrated HCL before and after the mechanical-mixing. Annual mean values of the HCL between (A) years 85–90 and (B) years 140–145 corresponding to dynamic steady-states before and after mechanical-mixing, respectively. The probability distribution function for each plot is shown in the inset.
4. Conclusion
This work aims to understand and characterize the impacts of soil transport (erosion and deposition), and the resultant SOC redistribution, on the spatial heterogeneity of the heterotrophic carbon loss (HCL) by quantifying the dynamics of vertical profiles of HCL across a watershed. We simulated a 150-yr co-evolution that couples landscape evolution with SOC physical transport and biogeochemical transformation throughout vertical soil columns using the SCALE model (Yan et al., 2019) in an intensively managed landscape in the Clear Creek Watershed in Iowa. The results show that SOC redistribution play significant roles in determining the HCL due to the comparable magnitudes of the rates of SOC redistribution and HCL. The SOC redistribution rate, not soil transport rate or SOC stock, is the main factor that directly affects the HCL. On the average, the HCL is higher in depositional zones in comparison to erosional zones. However, sites with small rates of soil transport could lead to the highest HCL due to the high effluxes and influxes of SOC redistribution. For the sub-surface HCL, which contributes to about one-fifth of the total HCL, SOC stock is the main driving factor. The mechanical-mixing accentuates the contrast of HCL between erosional and depositional sites, hence reducing the spatial variation of SOC stock caused by the SOC redistribution.
We propose a conceptual model to represent heterogeneous profiles of HCL and SOC in different locations in a fast soil transport hillslope (Figure 9). At erosional site, the soil thickness is thin, and both HCL and SOC decrease with increasing soil depth. The influx of soil material is smaller than the efflux, but the influx of carbon from plant residues is higher than the efflux of decomposed SOC (or the HCL). This creates a local environment that tends to be a sink for the atmospheric CO2 because of the smaller HCL compared to the carbon input from plants. At the transitional sites, the soil thickness is slightly higher than the erosional sites, and the SOC and HCL profiles may have a tiny “nose” due to a fast burial of SOC. The influx and efflux of soil material are similar, which results in a relatively small net soil flux and small soil depth change. However, the HCL may have a high variation. Specifically, high influx and high efflux of soil transport would result in high SOC redistribution and high HCL, and small influx and small efflux of soil transport would result in small SOC redistribution and small HCL. At depositional site, the soil thickness is even higher. The influx of soil material is higher than the efflux, causing the SOC and HCL profiles more obvious “nose” below surface due to the fast burial of SOC. The HCL at depositional sites, in average, is higher than other sites, but the variation of HCL is lower than transitional sites.
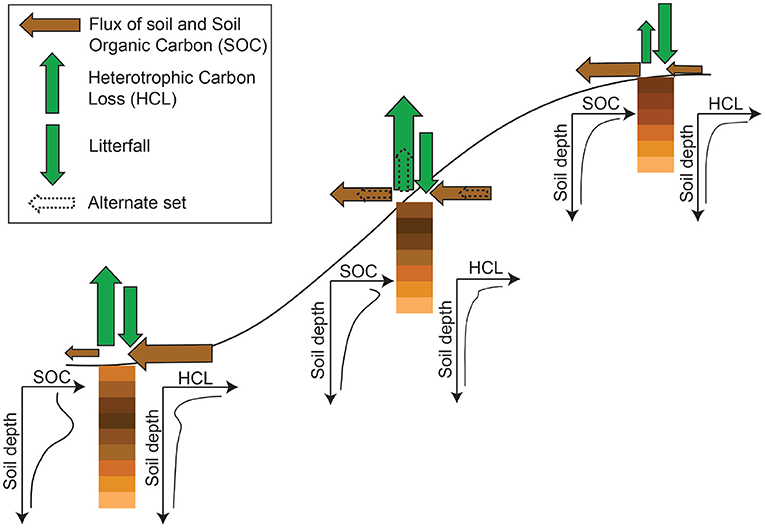
Figure 9. Schematic of conceptualized SOC and HCL profiles at a hillslope under high soil erosion and deposition processes. “Alternative set” here means that the arrows that represent the carbon fluxes both laterally and vertically have two scenarios at sites where the lateral influx and efflux of soil material are similar (which results in a small soil thickness change rate). Specifically, if the lateral influx and efflux of soil material are both small, the corresponding HCL is also small; if the lateral influx and efflux of the soil material are both quite large, the corresponding HCL tends to be high as well.
This study shows that the HCL is mostly correlated and caused by the spatial redistribution of the SOC. This work allows us to better understand how accelerated soil transport and the resultant SOC redistribution impact the HCL, particularly at high erosional locations such as dominant farms fields, grazing fields, and high lattidue areas where permanent frozen soils are disappearing due to global warming. Because the HCL strongly relates to the SOC redistribution, one could underestimate the CO2 release from soils if not considering the soil transport and SOC redistribution in the Earth System Models. Further, without taking the soil transport and SOC redistribution into account for the carbon cycling, one could easily underestimate the spatial variation of soil respiration, and overestimate or underestimate the soil respiration in different environment settings.
Data Availability Statement
The original contributions presented in the study are included in the article/supplementary materials, further inquiries can be directed to the corresponding author/s.
Author Contributions
PK and QY conceptualized and designed the study and contributed to the revision of the manuscript. QY performed the numerical simulations and developed the initial draft. Both authors contributed to the article and approved the submitted version.
Funding
Funding support from National Science Foundation Grants EAR 1331906 (Intensively Managed Landscapes Critical Zone Observatory-IMLCZO), remote CBET 1290445, ACI 1261582 (BrownDog), OAC 1835834, and EAR 2012850 are gratefully acknowledged.
Conflict of Interest
The authors declare that the research was conducted in the absence of any commercial or financial relationships that could be construed as a potential conflict of interest.
Publisher's Note
All claims expressed in this article are solely those of the authors and do not necessarily represent those of their affiliated organizations, or those of the publisher, the editors and the reviewers. Any product that may be evaluated in this article, or claim that may be made by its manufacturer, is not guaranteed or endorsed by the publisher.
References
Abaci, O., and Papanicolaou, A. N. T. (2009). Long-term effects of management practices on water-drivensoil erosion in an intense agricultural sub-watershed: monitoring and modelling. Hydrol. Process. 23, 2818–2837. doi: 10.1002/hyp.7380
Amundson, R., Berhe, A. A., Hopmans, J. W., Olson, C., Sztein, A. E., and Sparks, D. L. (2015). Soil and human security in the 21st century. Science 348:1261071. doi: 10.1126/science.1261071
Anders, A. M., Bettis, E. A., Grimley, D. A., Stumpf, A. J., and Kumar, P. (2018). Impacts of quaternary history on critical zone structure and processes: Examples and a conceptual model from the intensively managed landscapes critical zone observatory. Front. Earth Sci. 6:24. doi: 10.3389/feart.2018.00024
Berhe, A. A., Harte, J., Harden, J. W., and Torn, M. S. (2007). The Significance of the Erosion-induced Terrestrial Carbon Sink. Bioscience 57, 337–346. doi: 10.1641/B570408
Berhe, A. A., and Torn, M. S. (2017). Erosional redistribution of topsoil controls soil nitrogen dynamics. Biogeochemistry 132, 37–54. doi: 10.1007/s10533-016-0286-5
Billings, S. A., Richter, D. D. B., Ziegler, S. E., Prestegaard, K., and Wade, A. M. (2019). Distinct contributions of eroding and depositional profiles to land-atmosphere CO2 exchange in two contrasting forests. Front. Earth Sci. 7:36. doi: 10.3389/feart.2019.00036
Boden, T., Marland, G., and Andres, R. (2010). Global, regional, and national fossil-fuel CO2 emissions. Technical report, Carbon Dioxide Information Analysis Center, Oak Ridge National Laboratory, U.S. Department of Energy, Oak Ridge, TN.
Bond-Lamberty, B., and Thomson, A. (2010a). A global database of soil respiration data. Biogeosciences 7, 1915–1926. doi: 10.5194/bg-7-1915-2010
Bond-Lamberty, B., and Thomson, A. (2010b). Temperature-associated increases in the global soil respiration record. Nature 464, 579–582. doi: 10.1038/nature08930
Bond-Lamberty, B., Wang, C., and Gower, S. T. (2004). A global relationship between the heterotrophic and autotrophic components of soil respiration? Glob. Chang Biol. 10, 1756–1766. doi: 10.1111/j.1365-2486.2004.00816.x
Bouma, T. J., and Bryla, D. R. (2000). On the assessment of root and soil respiration for soils of different textures: interactions with soil moisture contents and soil CO2 concentration. Plant Soil. 227, 215–221. doi: 10.1023/A:1026502414977
Brady, N., and Weil, R. (1996). The Nature and Properties of Soils, 11th Edn. Upper Saddle River, NJ: Prentice Hall.
Catalán, N., Marcé, R., Kothawala, D. N., and Tranvik, L. J. (2016). Organic carbon decomposition rates controlled by water retention time across inland waters. Nat. Geosci. 9:501. doi: 10.1038/ngeo2720
Cheng, L., Zhang, N., Yuan, M., Xiao, J., Qin, Y., Deng, Y., et al. (2017). Warming enhances old organic carbon decomposition through altering functional microbial communities. ISME J. 11:1825. doi: 10.1038/ismej.2017.48
Crowther, T. W., Todd-Brown, K. E. O., Rowe, C. W., Wieder, W. R., Carey, J. C., Machmuller, M. B., et al. (2016). Quantifying global soil carbon losses in response to warming. Nature 540:104. doi: 10.1038/nature20150
David, M. B., McIsaac, G. F., Darmody, R. G., and Omonode, R. A. (2009). Long-Term changes in Mollisol organic carbon and nitrogen. J. Environ. Qual. 38, 200. doi: 10.2134/jeq2008.0132
Doetterl, S., Asefaw, A., Nadeu, E., Wang, Z., Sommer, M., and Fiener, P. (2016). Erosion, deposition and soil carbon: a review of process-level controls, experimental tools and models to address C cycling in dynamic landscapes. Earth Sci. Rev. 154, 102–122. doi: 10.1016/j.earscirev.2015.12.005
Federle, T. W., Dobbins, D. C., Thornton-Manning, J. R., and Jones, D. D. (1986). Microbial Biomass, activity, and community structure in subsurface soils. Groundwater 24, 365–374. doi: 10.1111/j.1745-6584.1986.tb01013.x
Foley, J. A., DeFries, R., Asner, G. P., Barford, C., Bonan, G., Carpenter, S. R., et al. (2005). Global consequences of land use. Science 390, 570–574. doi: 10.1126/science.1111772
Fontaine, S., Barot, S., Barré, P., Bdioui, N., Mary, B., and Rumpel, C. (2007). Stability of organic carbon in deep soil layers controlled by fresh carbon supply. Nature 450, 277–280. doi: 10.1038/nature06275
Friedlingstein, P., O'Sullivan, M., Jones, M. W., Andrew, R. M., Hauck, J., Olsen, A., et al. (2020). Global carbon budget 2020. Earth Syst. Sci. Data 12, 3269–3340. doi: 10.5194/essd-12-3269-2020
Hashimoto, S., Carvalhais, N., Ito, A., Migliavacca, M., Nishina, K., and Reichstein, M. (2015). Global spatiotemporal distribution of soil respiration modeled using a global database. Biogeosciences 12, 4121–4132. doi: 10.5194/bg-12-4121-2015
Hirano, T., Kim, H., and Tanaka, Y. (2003). Long-term half-hourly measurement of soil CO2 concentration and soil respiration in a temperate deciduous forest. J. Geophys. Res. Atmospheres 108, 1–13. doi: 10.1029/2003JD003766
Hopkins, F. M., Torn, M. S., and Trumbore, S. E. (2012). Warming accelerates decomposition of decades-old carbon in forest soils. Proc. Natl. Acad. Sci. U.S.A. 109, E1753–E1761. doi: 10.1073/pnas.1120603109
Ise, T., and Moorcroft, P. R. (2006). The global-scale temperature and moisture dependencies of soil organic carbon decomposition: an analysis using a mechanistic decomposition model. Biogeochemistry 80, 217–231. doi: 10.1007/s10533-006-9019-5
Jobbágy, E. G., and Jackson, R. B. (2000). The vertical distribution of soil organic carbon and its relation to climate and vegetation. Ecol. Appl. 10, 423–436. doi: 10.1890/1051-0761(2000)010[0423:TVDOSO]2.0.CO;2
Karhu, K., Auffret, M. D., Dungait, J. A. J., Hopkins, D. W., Prosser, J. I., Singh, B. K., et al. (2014). Temperature sensitivity of soil respiration rates enhanced by microbial community response. Nature 513:81. doi: 10.1038/nature13604
Kumar, P., Le, P. V. V., Papanicolaou, A. N. T., Rhoads, B. L., Anders, A. M., Stumpf, A., et al. (2018). Critical transition in critical zone of intensively managed landscapes. Anthropocene 22, 10–19. doi: 10.1016/j.ancene.2018.04.002
Lehmann, J., and Kleber, M. (2015). The contentious nature of soil organic matter. Nature 528, 60–68. doi: 10.1038/nature16069
Maier, M., Schack-Kirchner, H., Hildebrand, E. E., and Schindler, D. (2011). Soil CO2 efflux vs. soil respiration: implications for flux models. Agric. Forest Meteorol. 151, 1723–1730. doi: 10.1016/j.agrformet.2011.07.006
Martel, Y. A., and Paul, E. A. (1974). The use of radiocarbon dating of organic matter in the study of soil genesis. Soil Sci. Soc. Am. J. 38:501–506. doi: 10.2136/sssaj1974.03615995003800030033x
O'dorico, P., Laio, F., Porporato, A., and Rodriguez-Iturbe, I. (2003). Hydrologic controls on soil carbon and nitrogen cycles II. A case study. Adv. Water Resour. 26, 59–70. doi: 10.1016/S0309-1708(02)00095-7
Papanicolaou, A., Wacha, K. M., Abban, B. K., Wilson, C. G., Hatfield, J. L., Stanier, C. O., et al. (2015). From soilscapes to landscapes: a landscape-oriented approach to simulate soil organic carbon dynamics in intensively managed landscapes. J. Geophys. Res. Biogeosci. 120, 979–988. doi: 10.1002/2015JG003078
Porporato, A., D'Odorico, P., Laio, F., and Rodriguez-Iturbe, I. (2003). Hydrologic controls on soil carbon and nitrogen cycles. I. Modeling scheme. Adv. Water Resour. 26, 45–58. doi: 10.1016/S0309-1708(02)00094-5
Prescott, C. E. (2010). Litter decomposition: what controls it and how can we alter it to sequester more carbon in forest soils? Biogeochemistry 101, 133–149. doi: 10.1007/s10533-010-9439-0
Quijano, J. C., Kumar, P., and Drewry, D. T. (2013). Passive regulation of soil biogeochemical cycling by root water transport. Water Resour. Res. 49:3729–3746. doi: 10.1002/wrcr.20310
Quinton, J. N., Govers, G., Oost, K. V., and Bardgett, R. D. (2010). The impact of agricultural soil erosion on biogeochemical cycling. Nat. Geosci. 3, 311–314. doi: 10.1038/ngeo838
Raich, J. W., and Potter, C. S. (1995). Global patterns of carbon dioxide emissions from soils. Glob. Biogeochem. Cycles 9, 23–36. doi: 10.1029/94GB02723
Raich, J. W., and Tufekcioglu, A. (2000). Vegetation and soil respiration: correlations and controls. Biogeochemistry 48, 71–90. doi: 10.1023/A:1006112000616
Risk, D., Kellman, L., and Beltrami, H. (2002). Carbon dioxide in soil profiles: Production and temperature dependence. Geophys. Res. Lett. 29, 1–4. doi: 10.1029/2001GL014002
Rosenbloom, N. A., Harden, J. W., Neff, J. C., and Schimel, D. S. (2006). Geomorphic control of landscape carbon accumulation. J. Geophys. Res. Biogeosci. 111, 1–10. doi: 10.1029/2005JG000077
Rumpel, C., Kögel-Knabner, I., and Bruhn, F. (2002). Vertical distribution, age, and chemical composition of organic carbon in two forest soils of different pedogenesis. Org. Geochem. 33, 1131–1142. doi: 10.1016/S0146-6380(02)00088-8
Schimel, D. S. (1995). Terrestrial ecosystems and the carbon cycle. Glob. Chang Biol. 1, 77–91. doi: 10.1111/j.1365-2486.1995.tb00008.x
Schöning, I., and Kögel-Knabner, I. (2006). Chemical composition of young and old carbon pools throughout Cambisol and Luvisol profiles under forests. Soil Biol. Biochem. 38, 2411–2424. doi: 10.1016/j.soilbio.2006.03.005
Sierra, C. A., Malghani, S., and Loescher, H. W. (2017). Interactions among temperature, moisture, and oxygen concentrations in controlling decomposition rates in a boreal forest soil. Biogeosciences 14, 703–710. doi: 10.5194/bg-14-703-2017
Stockmann, U., Adams, M. A., Crawford, J. W., Field, D. J., Henakaarchchi, N, Jenkins, M., et al. (2013). The knowns, known unknowns and unknowns of sequestration of soil organic carbon. Agric. Ecosyst. Environ. 164, 80–99. doi: 10.1016/j.agee.2012.10.001
Sun, T., Wang, Y., Lucas-Borja, M. E., Jing, X., and Feng, W. (2021). Divergent vertical distributions of microbial biomass with soil depth among groups and land uses. J. Environ. Manage. 292:112755. doi: 10.1016/j.jenvman.2021.112755
Tufekcioglu, A., Raich, J., Isenhart, T., and Schultz, R. (2001). Soil respiration within riparian buffers and adjacent crop fields. Plant Soil. 229, 117–124. doi: 10.1023/A:1004818422908
Van Oost, K., Quine, T. A., Govers, G., De Gryze, S., Six, J., Harden, J. W., et al. (2007). The impact of agricultural soil erosion on the global carbon cycle. Science 318, 626–629. doi: 10.1126/science.1145724
von Haden, A. C., Marín-Spiotta, E., Jackson, R. D., and Kucharik, C. J. (2019). Soil microclimates influence annual carbon loss via heterotrophic soil respiration in maize and switchgrass bioenergy cropping systems. Agric. For. Meteorol. 279:107731. doi: 10.1016/j.agrformet.2019.107731
Wang, X., Cammeraat, E. L. H., Romeijn, P., and Kalbitz, K. (2014). Soil organic carbon redistribution by water erosion—the role of CO2 emissions for the carbon budget. PLoS ONE 9:e96299. doi: 10.1371/journal.pone.0096299
Wei, H., Xiao, G., Guenet, B., Janssens, I. A., and Shen, W. (2015). Soil microbial community composition does not predominantly determine the variance of heterotrophic soil respiration across four subtropical forests. Sci. Rep. 5, 1–6. doi: 10.1038/srep07854
Wiaux, F., Cornelis, J., Cao, W., Vanclooster, M., and Oost, K. V. (2014). Combined effect of geomorphic and pedogenic processes on the distribution of soil organic carbon quality along an eroding hillslope on loess soil. Geoderma 216, 36–47. doi: 10.1016/j.geoderma.2013.10.013
Wilson, C. G., Abban, B., Keefer, L. L., Wacha, K., Dermisis, D., Giannopoulos, C., et al. (2018). The intensively managed landscape critical zone observatory: a scientific testbed for understanding critical zone processes in agroecosystems. Vadose Zone J. 17, 1–21. doi: 10.2136/vzj2018.04.0088
Wilson, C. G., Papanicolaou, A. N. T., and Abaci, O. (2009). SOM dynamics and erosion in an agricultural test field of the Clear Creek, IA watershed. Hydrol. Earth Syst. Sci. Discuss. 6, 1581–1619. doi: 10.5194/hessd-6-1581-2009
Wynn, J. G., Harden, J. W., and Fries, T. L. (2006). Stable carbon isotope depth profiles and soil organic carbon dynamics in the lower Mississippi Basin. Geoderma 131, 89–109. doi: 10.1016/j.geoderma.2005.03.005
Xu, X., Shi, Z., Li, D., Rey, A., Ruan, H., Craine, J. M., et al. (2016). Soil properties control decomposition of soil organic carbon: results from data-assimilation analysis. Geoderma 262, 235–242. doi: 10.1016/j.geoderma.2015.08.038
Yan, Q., Iwasaki, T., Stumpf, A., Belmont, P., Parker, G., and Kumar, P. (2017). Hydrogeomorphological differentiation between floodplains and terraces. Earth Surf. Process. Landforms 43, 218–228. doi: 10.1002/esp.4234
Yan, Q., Kumar, P., Wang, Y., Zhao, Y., Lin, H., and Ran, Q. (2020). Sustainability of soil organic carbon in consolidated gully land in China's Loess Plateau. Sci. Rep. 10, 1–12. doi: 10.1038/s41598-020-73910-7
Yan, Q., Le, P. V. V., Woo, D. K., Hou, T., Filley, T., and Kumar, P. (2019). Three-dimensional modeling of the co-evolution of landscape and soil organic carbon. Water Resour. Res. 55, 1218–1241. doi: 10.1029/2018WR023634
Yan, Q., Wainwright, H., Dafflon, B., Uhlemann, S., Steefel, C. I., Falco, N., et al. (2021). Hybrid data-model-based mapping of soil thickness in a mountainous watershed. Earth Surf. Dynam. Discuss. 2021, 1–23. doi: 10.5194/esurf-2020-110
Yergeau, E., Bokhorst, S., Kang, S., Zhou, J., Greer, C. W., Aerts, R., et al. (2011). Shifts in soil microorganisms in response to warming are consistent across a range of Antarctic environments. ISME J. 6:692. doi: 10.1038/ismej.2011.124
Keywords: heterotrophic carbon loss, soil organic carbon, landscape evolution, soil erosion, soil deposition, soil respiration, atmospheric carbon dioxide
Citation: Yan Q and Kumar P (2021) Impacts of Landscape Evolution on Heterotrophic Carbon Loss in Intensively Managed Landscapes. Front. Water 3:666278. doi: 10.3389/frwa.2021.666278
Received: 10 February 2021; Accepted: 22 October 2021;
Published: 16 November 2021.
Edited by:
Alexis Navarre-Sitchler, Colorado School of Mines, United StatesReviewed by:
Corey R. Lawrence, United States Geological Survey (USGS), United StatesKalyana Babu Nakshatrala, University of Houston, United States
John Mallard, University of North Carolina at Chapel Hill, United States
Copyright © 2021 Yan and Kumar. This is an open-access article distributed under the terms of the Creative Commons Attribution License (CC BY). The use, distribution or reproduction in other forums is permitted, provided the original author(s) and the copyright owner(s) are credited and that the original publication in this journal is cited, in accordance with accepted academic practice. No use, distribution or reproduction is permitted which does not comply with these terms.
*Correspondence: Qina Yan, cWluYXlhbkBsYmwuZ292
†Present Address: Qina Yan, Lawrence Berkeley National Laboratory, Berkeley, CA, United States