 Jessica A. Eisma
 Siddharth Saksena
 Venkatesh Merwade
- 1Department of Civil Engineering, University of Texas at Arlington, Arlington, TX, United States
- 2The Charles E. Via, Jr. Department of Civil & Environmental Engineering, Virginia Tech, Blacksburg, VA, United States
- 3Lyles School of Civil Engineering, Purdue University, West Lafayette, IN, United States
Sand dams, a water-harvesting structure employed by rural communities in drylands have an inconsistent record of effectiveness. While many sand dams are highly functioning, improper siting, siltation, seepage, and high rates of evaporation from shallow sand reservoirs inhibit the water storage capacity of some sand dams. This study examines large-scale drivers of sand dam storage potential through analysis of an integrated surface and subsurface flow model. Multiple simulations were run, and comparative simulation analyses consider the effect of geomorphological factors, intraseasonal rainfall variability, and future climate conditions on sand dam performance criteria. The analyses revealed that a watershed highly cultivated with low water crops actually reduces evapotranspiration below that of natural vegetation and supports higher groundwater recharge. Additionally, intraseasonal variation and volume of rainfall impact sand dam performance less than the prevailing pattern and duration of dry and rainy seasons. Sand dams constructed in watersheds with sandier soils may experience greater connectivity with the stream margins and thus provide additional groundwater recharge. Lastly, climate change may improve some conditions desirable for sand dam performance, such as extending the duration of the rainy season and reducing overall evapotranspiration. However, the interactions between the expected climate change conditions and other geomorphological factors may result in a net decline in sand dam performance. The results of this study may help identify watersheds that are likely to support a sand dam with high potential for capturing and storing water throughout the dry season.
1. Introduction
Billions of dollars are invested into international development projects in Africa every year (Rhode and Stitteneder, 2020), and yet many donor-funded projects fail—up to 64% by some estimates (Hekala, 2012; Miković et al., 2020). Many challenging circumstances contribute to the high failure rate (Ika, 2012), but improved design procedure and decision-making may avert problems related to geographical mismatch in international development projects (Youker, 2003). Sand dams, a water-harvesting technology, offer an excellent example of an international development initiative in sub-Saharan Africa with an inconsistent record of success (de Trincheria et al., 2015; Viducich, 2015; Ngugi et al., 2020; Neufeld et al., 2021). Sand dams are small dams built across an ephemeral stream with an impermeable streambed in a dryland. Over time, sand builds up behind the dam wall, creating a sand reservoir. The sand reservoir fills with water during subsequent high-intensity rains and flash floods (Borst and de Haas, 2006; Hut et al., 2008). Rural communities draw water from the sand dam for domestic and agricultural use (Lasage et al., 2008; Eisma and Merwade, 2020). Because the water is stored below the ground surface, it is protected from evaporation, and communities use the stored water well into the dry season. Sand dams are essentially a type of artificial perched aquifer (Lasage et al., 2008) that may occasionally become connected to groundwater via leakage from the sand reservoir or lateral seepage into the sand reservoir (Quinn et al., 2019).
Sand dams can be highly effective and have provided many communities with the means to thrive (Pauw et al., 2008). However, sand dams are estimated to fail in 23–50% of cases (de Trincheria et al., 2015; Viducich, 2015; Ngugi et al., 2020). Sand dams can fail for many reasons, including poor siting, siltation, erosion, and leakage and evapotranspiration (ET) losses from the sand reservoir (Eisma and Merwade, 2020). Site selection is the focus of this study examining how vegetation, soil, and climate factors relate to sand dam performance. Current site selection practices are detailed in two sand dam manuals (Maddrell and Neal, 2012; RAIN Foundation, 2012). A total of 44 site selection criteria are included in the manuals with only 11 criteria common to both manuals. Most of the site selection criteria are related to surface hydrology, geology, and community-based factors. While some criteria are quantitative with thresholds provided, most are vague and left to interpretation (Beswetherick et al., 2018). Only two of the 44 site selection criteria reference groundwater, specifically water table depth and baseflow in the streambanks and riverbed.
Sand dam site selection guidelines are based on field experience, but their high failure rate indicates that the current guidelines, or at least their application, are problematic. A field study of 116 sand dams in southeastern Kenya found that nearly all of the indicators used for selecting sand dam sites are not useful in predicting sand dam success (Ngugi et al., 2020). However, functioning and non-functioning sand dams are clustered geographically, indicating that their effectiveness is likely dependent upon local physiographic features (Ngugi et al., 2020). A field study of nine sand dams in Zimbabwe and Kenya examined the relationship between various watershed-scale factors and the composition of soil impounded by the sand dams but similarly failed to identify any consistent relationships (Beswetherick et al., 2018). Field studies have been unable to resolve the interdependencies between watershed and climate characteristics and sand dam performance. This may be due, in part, to confounding factors (e.g., bedrock fractures, water usage, etc.) that have not been adequately controlled for during the field studies. To overcome this issue, the study presented here employs multiple scenario tests of an integrated groundwater and surface water flow model of a watershed with three sand dams. The simulation results are expected to contribute to the scientific development of better site selection guidelines. Thus, the objective of this study is to examine how land cover, soil texture, and climate characteristics impact the capture and storage potential of a sand dam.
Among the most important criteria for the selection of suitable sites for water-harvesting projects are land cover, soil texture, and rainfall (Ammar et al., 2016), which align well with current site selection guidelines for sand dams. Land cover has been changing rapidly in recent decades as populations boom and transportation development improves access to rural areas (Lambin et al., 2003; Zewdie et al., 2018). Land cover change, a major factor in global environmental change, has a paramount impact on the hydrologic cycle (Guzha et al., 2018). Land cover affects evapotranspiration rates and surface runoff, which in turn affect infiltration and stream discharge (Guzha et al., 2018). Thus, land cover affects both how quickly a sand dam will reach its storage capacity and how quickly that storage will be depleted. Soil texture may be impacted by land cover changes through erosion of topsoils and streambanks (Aneseyee et al., 2020; Wu et al., 2020), affecting the hydraulic conductivity, porosity, and specific yield of the soil (Chow et al., 1988). Higher hydraulic conductivity increases the connectivity between a sand dam and the riparian zone, which drives more recharge from the sand dam to the groundwater and vice versa (Quinn et al., 2019). Well sorted, fine grained soils have higher porosity and can store more water. However, they have lower specific yield and higher matric potential, which negatively impacts abstraction potential (Chow et al., 1988). A watershed with fine grained or poorly sorted soils may not support a sand dam that provides high rates of recharge or abstractable water.
Rainfall has a fairly direct relationship with sand dam storage, but some uncertainty remains regarding the impact of rainfall depth and interseasonal rainfall pattern on sand dam performance (Eisma and Merwade, 2020; Ngugi et al., 2020). Sand dams have been built in regions with a bimodal rainfall regime (Kenya, northern Tanzania and Uganda, etc.) and with a unimodal rainfall regime (southern Tanzania and Uganda, Mozambique, Zimbabwe, etc.) (Luhunga and Djolov, 2017; Beswetherick et al., 2018; Quinn et al., 2019; Eisma and Merwade, 2020; Ngugi et al., 2020). The region with unimodal rainfall also generally has different intraseasonal rainfall variability and lower overall rainfall depths compared with the bimodal rainfall regime (Eisma and Merwade, 2020). Sand dam water storage will obviously benefit from higher rainfall depths, but a rainfall threshold for performance has not yet been identified (Ngugi et al., 2020). Longer or more frequent rainy seasons mean that sand dams store water for a larger portion of the year, but the duration of dry period storage may be affected by intraseasonal rainfall variability and/or annual rainfall depth. Climate change will have a similar impact on sand dam performance, with higher temperatures and higher intraseasonal rainfall variability affecting the water storage potential of a sand dam.
The study presented here constructs a model of the Chididimo watershed, home to three cascading sand dams using the integrated surface and groundwater flow model, Interconnected Channel and Pond Routing (ICPR). ICPR was selected for this study, because it is a physically based distributed hydraulic and hydrologic model that is capable of calculating water balances with a flexible spatiotemporal structure, enabling high resolution calculations in areas of particular interest with a manageable computation time (Saksena et al., 2019, 2020). Five 6-month simulations are run: (1) a control, (2) with increased cropland, (3) with increased rainfall and reduced ET, (4) with sandier soils, and (5) with climate change. Trends in local groundwater elevation and in surface and groundwater flow parameters are analyzed to determine which simulation produces the most beneficial conditions for sand dam success. The study concludes with a discussion of watershed and climate characteristics that will likely support a successful sand dam. Note that research-based efforts to improve sand dam siting is nascent. The findings of this study should not be used to make policy or management decisions without first assessing the remaining gaps in understanding and analyzing the implications of such decisions in the context of the human political economy.
2. Model Description
An overview of the Interconnected Channel and Pond Routing (ICPR) model framework is presented here. See Saksena et al. (2019) and Saksena et al. (2020) for a detailed model description and related equations and capabilities. An ICPR model consists of overland flow elements and saturated groundwater elements that are connected by flow through the vadose zone (Saksena et al., 2019).
ICPR connects 1D and/or 2D surface water flow with 2D groundwater flow using variable-resolution meshes that allow areas of interest to be simulated at a higher resolution than less critical parts of the study area, saving computational time and power. This capability is ideal for simulating sand dams, because, sand dams have a relatively small area of influence. The area of influence for a sand dam is at most 2 km2 in the channel and riparian zone upstream of the dam structure (Ryan and Elsner, 2016) but is oftentimes much smaller (Quilis et al., 2009). Furthermore, sand dams are essentially a sub-surface sand reservoir in an ephemeral stream, making both surface and groundwater flows vital for understanding sand dam hydrology. Until now, ICPR has primarily been used for studies of urban flooding in the conterminous United States. The application of this modeling software to a rural, ungauged watershed with a semi-arid climate is unique. As a physics-based modeling system with options for specifying ET rates that vary according to crop types and growing seasons, rainfall, and a highly discretized vadose zone, ICPR is appropriate for rural and semi-arid applications. Published research on ICPR has largely been completed by Saksena et al. (2019) and Saksena et al. (2020), where they, respectively, studied the performance of different ICPR model compositions and applied ICPR to an unprecedented flood event in Hurricane Harvey.
2.1. Overland Flow Region
The structure of the overland flow region determines how the model routes surface flow and transfers excess rainfall to the vadose zone. Elements of the overland flow region are derived from the gridded DEM and gridded land cover (see Figure 1), but can be manipulated and refined by the user to ensure that unique features and areas of particular interest are represented in the model.
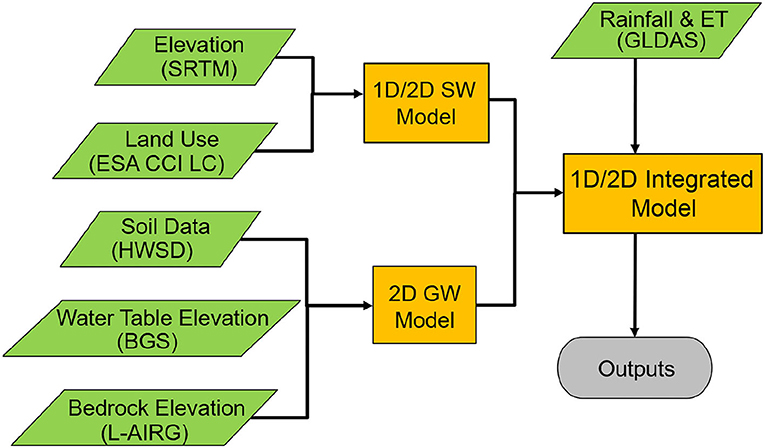
Figure 1. ICPR model process with input data specified (adapted from Saksena et al., 2019).
2.1.1. Overland Flow Computational Mesh Generation
The basis of all flow routing in ICPR is the flexible mesh that defines individual control volumes and linkages between the control volumes. The flexible mesh is unique, because it allows the user to specify variable resolution of model calculations based on the objectives of the model. For example, in this study, high-resolution mesh is described in the areas near sand dams but low-resolution mesh is maintained elsewhere, reserving computational power for the most important model features. To define the resolution of the mesh, the user places a pattern of breakpoints throughout the overland flow region. Using the Delaunay method of triangulation, ICPR then automatically generates a flexible triangular mesh where each breakpoint is a triangle vertex (Streamline Technologies, 2018). Flow directions are then assigned to each edge of the triangular mesh based on DEM-derived land slopes.
The honeycomb mesh is generated and intersected with the soil, land cover, rainfall, and ET zones. The honeycomb polygons serve as the control volumes, or catchments, of the ICPR calculations. ICPR calculates a mass balance for each honeycomb catchment polygon to determine the amount of excess rainfall, after accounting for losses due to infiltration and ET. Excess rainfall results in ponded surface water that first satisfies potential ET, and then may flow to an adjacent surface node along the triangular mesh or be infiltrated to the vadose zone.
The last mesh ICPR generates for the overland flow region is the diamond mesh. The diamonds in the diamond mesh serve as the links between each catchment polygon, transferring flow from one catchment to the next. The diamond mesh is intersected with, and further refined by, surface roughness zones.
2.1.2. Overland Flow Calculations
Surface flow calculations are performed via the finite volume method for each catchment, and the transfer of flow from one catchment to the next is defined by the St. Venant, or momentum, equations (Streamline Technologies, 2018). The momentum equation employed by ICPR is:
where Q is the flow rate during time, t, over surface area, A, x is the flow distance, Sf is the energy slope, and g is acceleration due to gravity.
2.1.2.1. Roughness Zones
Roughness zones define Manning's n value for different land cover types. ICPR further delineates this variable Manning's n value into shallow and deep conditions, where Manning's n is decreased when water is ponded on the land surface. Manning's n decays exponentially from the shallow Manning's n to the deep Manning's n based on the surface depth, as explained in the following equation:
where nd is Manning's roughness at flow depth, d, nshallow is Manning's n at the ground surface, ndeep is Manning's n at depth dmax, and dmax is the user specified depth at which ndeep occurs, usually 1 m (Streamline Technologies, 2018).
2.2. Vadose Zone
The vadose zone is the unsaturated zone in the soil column between the ground surface and the water table (Nimmo, 2009). As the water table falls and rises, it exposes more or less of the vadose zone. ICPR has three options for soil moisture accounting and tracking vadose zone water movement/rainfall excess computations: (1) an unrefined Green-Ampt method that has homogeneous soil with root zone and transmission zone layers for use in shallow water table conditions, (2) a refined Green-Ampt method that has homogeneous soil with user-defined layers for use in deep water table conditions, and (3) a vertical layers method that allows the user to specify the properties of variable soil layers. The vadose zone interacts with the groundwater region via recharge from the last soil layer (Streamline Technologies, 2018).
Vadose zone soil cylinders are created by intersecting overland flow and groundwater honeycomb meshes with soil and land cover grids. Rainfall excess from the surface honeycomb is transferred to the soil cylinder, and groundwater recharge from the soil cylinder is transferred to the associated groundwater honeycomb. The transfer of water from one layer to the next occurs at the rate of saturated hydraulic conductivity, as defined by the Brooks-Corey soil water retention-hydraulic conductivity relationship (Rawls and Brakensiek, 1982; Rawls et al., 1982):
where K is the unsaturated vertical conductivity at the current moisture content, θ, Ks is the saturated vertical conductivity, θr is the residual moisture content, ϕ is the saturated moisture content, and λ is the pore size index. The recharge rate delivered to the groundwater is the area-weighted sum of the unsaturated hydraulic conductivity for all soil cylinders in a single groundwater honeycomb polygon, accounting for the available fillable porosity (Streamline Technologies, 2018).
When the vadose zone is discretized into multiple layers with multiple cells, as with the refined Green-Ampt and vertical layers methods, fluxes between cells are calculated based on the moisture content and unsaturated vertical conductivity of each cell. The groundwater recharge rate is equal to the calculated flux across the cell just above the saturated water table. As the water table rises and falls, cells in the vadose zone are merged and unmerged with the water table. If the groundwater table inundates 75% of a cell, that cell is merged with the saturated groundwater surface. As the water table falls, cells are unmerged from the saturated groundwater surface when more than 25% of the cell is exposed (Streamline Technologies, 2018).
2.2.1. Infiltration and ET
Rainfall and ponded water in excess of potential ET are available for infiltration from the overland flow region to the vadose zone. The infiltration rate is determined from the Green-Ampt equation and cannot exceed the saturated vertical conductivity. While calculating infiltration, ICPR conducts two passes over each cell. The first pass transfers water from the surface down to the last cell above the saturated groundwater level, calculating mass balances at each cell. The flux through the last cell is added to the groundwater surface. The second pass rebalances the moisture content of each cell to ensure that the saturation level is not exceeded. Water in excess of saturation is transferred upward through the soil cylinder, until no cells have water in excess of saturation or until the excess water reaches the overland flow surface (Saksena et al., 2019).
Potential ET in ICPR is calculated from reference ET, which is either supplied to ICPR directly by the user or calculated using the Penman-Montieth equation. The potential ET is modified by crop coefficients unique to crop-types, soil-types, and time of year (Allen et al., 1998; Saksena et al., 2019). When rainfall and ponded water are insufficient to meet the potential ET, the deficit is extracted from the soil moisture in the polygon soil cylinders above the root depth.
2.3. Saturated Groundwater Region
The groundwater region consists of a saturated surficial aquifer underlain by a confining layer. If desired, leakage through the confining layer can be defined. The groundwater region is connected to the vadose zone by recharge from the lowest active cell of the associated soil cylinder.
The groundwater region in ICPR uses a flexible triangular mesh as the computational framework, similar to that used in the overland flow region. The groundwater triangular mesh is refined by soil zones to determine the average weighted porosity and conductivity for each triangle. Nodes in the triangular mesh are assigned elevation values for the ground surface, confining layer, initial water table. The groundwater honeycomb mesh can be refined with leakage zones when leakage through the confining layer is allowed (Streamline Technologies, 2018).
The groundwater region calculates saturated horizontal flow in the surficial aquifer above the confining layer. Water table elevations are calculated at the triangle vertices and midpoint nodes. Calculations for horizontal flow are based on finite element analysis and use the Mart́ınez (1989) approach to solve the continuity equation (Streamline Technologies, 2018; Saksena et al., 2019).
2.4. Time-Marching Scheme
ICPR contains two options for defining the time marching of simulations: the Successive Approximation technique with Over-Relaxation (SAOR) method and the “FIREBALL” method. The SAOR method is commonly used in water resources applications and allows time steps that vary in time but are uniform spatially. This can result in long runtimes due to small mesh elements (Saksena et al., 2020). This study employs the unique FIREBALL method that allows time marching to be variable in both space and time. In the FIREBALL application used here, groundwater calculations are at 1 h time steps (3,600 s), hydrologic time steps are 5 min (300 s), and the surface hydraulics calculations are performed at 10 time steps varying between 0.01 and 5.121 s (Streamline Technologies, 2018; Saksena et al., 2020).
3. Study Area
Simulations of three cascading sand dams near Chididimo, a village 20 km west of Dodoma, were included in this study (see Figure 2). The Chididimo sand dams were constructed by the Mennonite Central Committee of Tanzania. The most upstream sand dam, Umoja Ni Nguvu (hereafter, Umoja), was constructed in 2010 and is the smallest with a spillway of approximately 4.5 m. Next in the system is the Seje Seje dam, also constructed in 2010. The Seje Seje dam has a spillway width of 7.5 m and is the most productive of the three dams. Community members near the Seje Seje dam are still able to access water from the hand pump 6 months into the dry season. The most downstream dam in the system, the Chijendelele Na Mlimo (hereafter, Chijendelele) sand dam, was constructed in 2011 with a spillway width of 9.6 m.
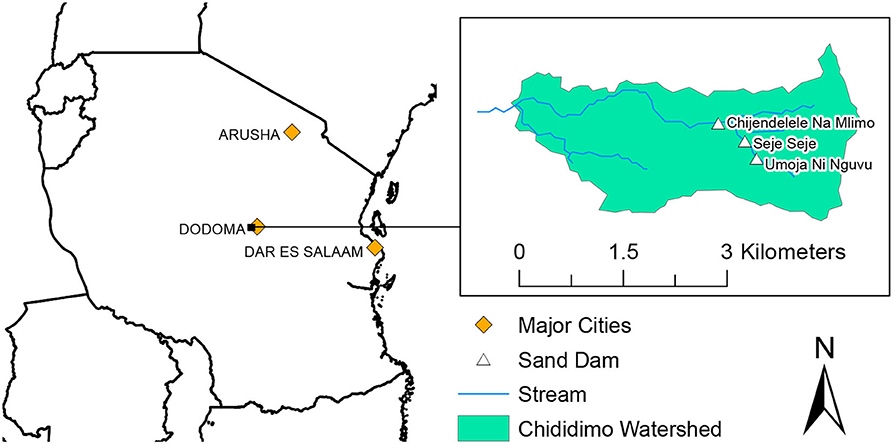
Figure 2. Chididimo watershed near Dodoma, Tanzania with three cascading sand dams.
The three sand dams are in the Chididimo watershed. The Chididimo watershed is 7.5 km2 and is sparsely populated. The dominant land cover in the watershed is shrub cover at 60% land cover, followed by cropland at 39% land cover (ESA CCI land cover). The Chididimo watershed has a hot semi-arid climate, receiving only 601 mm of rainfall during the year in one rainy season lasting from October to April (Peel et al., 2007; Platts et al., 2015; Luhunga and Djolov, 2017). The potential ET in Dodoma is 1800 mm, and the average annual temperature 23°C (Platts et al., 2015). Loam is the primary soil type in the Chididimo watershed (Fischer et al., 2008). The water table is typically 10 m below the ground surface, and, on average, crystalline bedrock is 50 m below the water table (Nkotagu, 1996). Thus, sand dam reservoirs, which form on the streambed, are likely not recharged by baseflow from the water table in Chididimo. Stored water from the sand dam reservoirs may leak through the streambanks and stream bed and percolate down to recharge the groundwater (Quinn et al., 2019).
4. Data
Initially designed for applications in United States urban areas, where high resolution, high quality data is widely available, ICPR is data intensive. ICPR requires the following data: elevation, soil, land cover, bedrock depth, water table depth, ET, and rainfall. High resolution data is rarely freely available for sub-Saharan Africa, so the best data available was used to construct the model. Elevation data at a resolution of 30 m was obtained from the Shuttle Radar Tomography Mission (SRTM) (NASA JPL, 2013). Soil texture and drainage properties were obtained from the Harmonized World Soil Database (HWSD), which combines national and regional soil information in a world soil map with a resolution of 30 arc-s (almost 1 km) (Fischer et al., 2008). Elevation and land use data together inform the 1D/2D surface water model. The depth of the water table below the ground surface was obtained from the British Geological Survey (BGS) (MacDonald et al., 2012). BGS modeled groundwater depth for the African continent based on rainfall, aquifer type, and proximity to rivers (MacDonald et al., 2012). Finally, the depth of bedrock below the ground surface was obtained from research conducted by the Land-Atmosphere Interaction Research Group (L-AIRG) at Sun Yat-Sen University (Shangguan et al., 2017). The L-AIRG depth to bedrock dataset was developed using machine learning techniques trained with soil profile and borehole data to produce a world map at a resolution of 250 m (Shangguan et al., 2017). The soil data, water table elevation, and bedrock elevation data were used to design the 2D groundwater portion of the model. As forcing data for the model, 3 h, 1.0° resolution ET and rainfall data from the Global Land Data Assimilation System (GLDAS) was used (Rodell et al., 2004; Beaudoing and Rodell, 2016). While 1.0° resolution forcing data is coarse relative to the study site, the event variability is consistent with what is expected.
5. Methodology
5.1. Sand Dam-Specific Assumptions
The three sand dams in the Chididimo watershed were modeled using the integrated 1D/2D surface and groundwater model, ICPR. Pre-construction survey information is not available for the sand dams, requiring many assumptions to be made about the sand dam subsurface. The primary assumptions defining the representation of sand dams in the model are:
1. The length of each sand reservoir upstream of a sand dam can be determined through site knowledge coupled with visual analysis of aerial imagery. The terminus of a sand reservoir can be identified in aerial imagery by the re-surfacing of bedrock and/or the narrowing of the visible stream bed.
2. The depth of each sand reservoir is assumed to be a maximum of two meters above the SRTM land surface plus one meter below the SRTM land surface.
3. The surface slope of the upstream sand reservoir is assumed to be uniform, at a rate of two meters divided by the length of the sand reservoir.
4. The sand reservoir is underlain by a nearly impervious layer, adequately represented by a 2-meter thick clay layer.
5. The sand dam structure blocks most subsurface flow within the stream valley at the location of the sand dam. The sand dam structure allows some throughflow as seepage, represented by a hydraulic conductivity value of 0.05 m/day, a value equivalent to that of the clay layer underlying the sand reservoir.
5.2. Building the Chididimo ICPR Model
A description of the basic methodology for creating an ICPR model of the Chididimo watershed follows. The Chididimo model contains an overland flow region and a groundwater region, as described in Section 2. The overland flow region contains 2D elements outside of the stream channels, 2D elements within the stream channel in the vicinity of the sand dams, and 1D elements elsewhere in the stream channel. The groundwater region contains only 2D flow elements, as is the case for all ICPR groundwater regions.
5.2.1. Overland Flow Region
The Chididimo watershed and stream network were defined from 30-m resolution DEM using hydrology geoprocessing tools. An up-catchment flow aggregation limit of 0.45 km2 was used in stream delineation, because only at this aggregation limit were the sand dam streams defined. The width of the streams was determined by manual measurement of aerial imagery. Surface runoff is influenced by the roughness of the land surface through the application of Manning's n. Manning's n is set to 0.048 in the channels and 0.08 on the land surface (Chow, 1959; Liu et al., 2019). A value of 0.08 for Manning's n on the land surface was calculated by an area-weighted average of the primary land cover types: shrubs and cropland (Liu et al., 2019; Saksena et al., 2019).
Maize, millet, and sorghum are the most common crop in Dodoma (Yohan et al., 2006; Msongaleli et al., 2017), so therefore, all cropland was assigned crop coefficients that represented an average of the dominant three crop types. Crop coefficients were set to 1.00 for natural land cover. Crop coefficients for natural ecosystems have not been widely studied (Corbari et al., 2017), so there is little evidence to support crop coefficients other than 1.00. The crop coefficients and growing season can be seen in Table 1. While ICPR allows for gridded rainfall, the model incorporates uniform rainfall across the study area. The amount of rainfall that infiltrates into the ground is determined by the vertical layers method, which has multiple soil horizons described below.
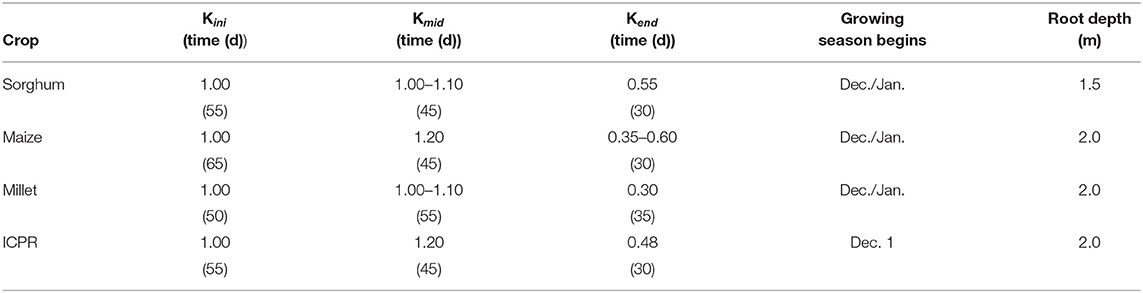
Table 1. Crop coefficients and growing season in the Chididimo watershed.
The vadose zone in the Chididimo model was described by three soil types: sand, clay, and loam (see Table 2). The watershed beyond the streambanks was entirely represented by a thick layer of loam per HWSD (Fischer et al., 2008). Within the stream channel, the vadose zone is described by a 1-m thick layer of sand, underlain by 2 m of clay, and a thick layer of loam. The vadose zone within the sand reservoir upstream of the sand dam required a detailed representation to capture the varying depth of the sand reservoir (see Figures 3B,C).

Table 2. ICPR vadose zone soil parameters.
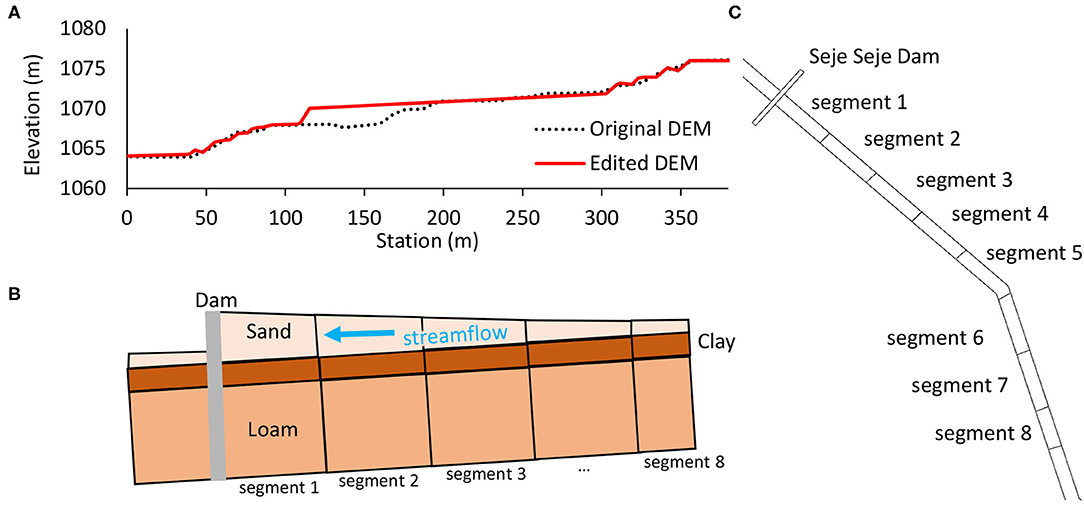
Figure 3. (A) Original elevation profile down the centerline of the stream at the location of the Seje Seje sand dam from the SRTM DEM compared to the edited elevation profile with the sand dam and sand reservoir “built” into the DEM. (B) Representation of the vertical layers design for sand dams. The sand reservoir upstream of the dam structure was represented by sand underlain by a thick clay layer and loam, the primary soil type of the Chididimo watershed. The dam structures are represented by a deep, nearly impervious soil layer. (C) Plan view of the vertical layers design for the Seje Seje sand dam.
5.2.1.1. Incorporation of Sand Dams in Overland Flow Region and Vadose Zone
The sand dams were simulated within the ICPR framework by building the sand dams into the DEM and by assigning the soil parameters in the vertical layers loss method to describe the physical structure of a sand dam. To build the sand dam into the DEM, the surface of each sand dam was assumed to be at most two meters above the SRTM land surface. Furthermore, the DEM was smoothed at a constant slope in the sand reservoir upstream of the sand dam for the length of the sand dam, as determined via aerial imagery. Figures 3A,C provide a profile and plan view, respectively, of the final smoothed DEM at the Seje Seje sand dam. Building the sand dam into the DEM ensured that the model would accurately account for flow over and through the sand dam and sand reservoir.
In addition to building the sand dams into the DEM, the vertical layers infiltration parameters were designed to account for the unique structure of sand dams (see Figures 3B,C). Each sand reservoir was split into eight segments, and different vertical layer infiltration parameters were assigned to each segment to account for the gradually tapered sand reservoir depth.
5.2.2. Groundwater Region
To determine the depth of the water table below the land surface, the BGS water table was set as the initial water table elevation, and a 1-month simulation was performed. The water table was assumed to be essentially at equilibrium after a 1-month simulation with no rainfall. The water table elevation grid at the end of the simulation was exported, compared with the DEM, and set to a minimum of 1.5 m below the land surface. Enforcing a minimum depth to the water table ensures that there is not excessive seepage from the water table to the overland flow region given the semi-arid climate of the Chididimo watershed. The depth of the bedrock was then set to at least 30 m below the water table elevation. Finally, the fillable porosity and conductivities of the groundwater region were set to the porosity and vertical hydraulic conductivity, respectively, of the associated soil types, as described in Table 2.
5.3. Model Simulations
A total of 5, 6-month simulations were performed to identify the impact of rainfall variability, vegetation, and soils on the ability of sand dams to capture and store rainwater throughout the dry season. The rainfall, vegetation, and soils in southeastern Kenya were used for alternative scenarios. Southeastern Kenya is home to thousands of sand dams, many of which store water throughout the dry season. A climate change scenario was also developed using fixed land cover and climate data from the Coupled Model Intercomparison Project 5 (CMIP5), which has been validated for the study area (Luhunga et al., 2018). All simulations were performed using rainfall and ET data from 2/13/2017 to 8/13/2017. This 6-month time period was chosen, because it provides a 1-month spin up period and 1 month of heavy rainfall before the dry season begins. The middle of August was selected as the end of the simulation time, because the Dodoma sand dams have usually lost their abstractable water by then (Chijendelele Na Mlimo Group, personal communication, November 14, 2016; Vumilia Group, personal communication, November 15, 2016).
The model was not calibrated prior to performing simulations. The Chididimo watershed is ungauged, and physically-based ICPR has been shown to perform well with minimal calibration in various watersheds (Saksena et al., 2019, 2020), albeit not yet in a dryland watershed. Short test simulations were performed to verify surface and groundwater flow patterns in and around the sand dam reservoirs match literature and experience-based expectations (Borst and de Haas, 2006; Hut et al., 2008; Quilis et al., 2009; Quinn et al., 2019).
5.3.1. Simulation 1 (S1) – the Base Case
The first simulation (S1) is the base case for comparison with the other three simulations. S1 utilizes Dodoma rainfall and ET and the actual soil texture and land cover in the Chididimo watershed.
5.3.2. Simulation 2 (S2) – Heavily Cultivated
The second simulation (S2) maintains Dodoma rainfall and ET as the forcing data and uses the Chididimo watershed soil texture. However, the land cover types have been replaced with those representative of southeastern Kenya. Southeastern Kenya is much more heavily cultivated than the Chididimo watershed. The sample of land cover from southeastern Kenya is 94% cropland compared to Chididimo watershed's 39% cropland. However, both the Dodoma region and southeastern Kenya have maize, millet, and sorghum as their primary crops, so the same crop coefficients are used in both S1 and S2. Only the area where the crop coefficients are applied has been changed for S2 compared to S1. S2 was performed to determine the magnitude of impact that land cover has on the performance of sand dams.
5.3.3. Simulation 3 (S3) – Different Rainfall Variability
The third simulation (S3) maintains the Chididimo soil textures and land cover, while using southeastern Kenya rainfall and ET as forcing data. Southeastern Kenya, where most sand dams have been built experiences a bi-modal rainfall regime that provides approximately 100 mm more annual rainfall than the unimodal rainfall in Dodoma. In addition, annual potential ET is lower in southeastern Kenya compared to Dodoma. During the 6-month study duration, Kenya's rainy season not only provides 58 mm more rainfall, but the rainy season lasts about three weeks longer than in Dodoma (see Figure 4). In addition, Figure 4 shows that the Kenya rainfall variability tends to provide larger, more infrequent rain events compared to frequent, smaller magnitude rain events in Dodoma. S3 was performed to determine the degree of impact that rainfall and ET variability has on the performance of sand dams.
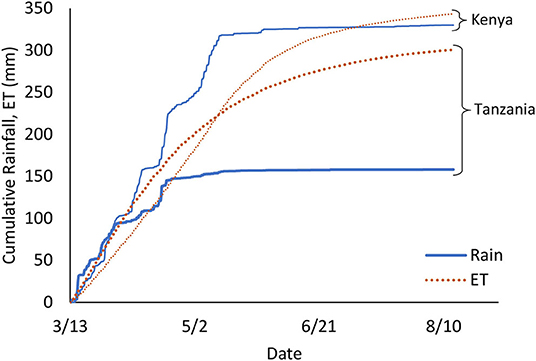
Figure 4. Kenya receives more rainfall in two rainy seasons each year and experiences less ET throughout the year than Dodoma. For the study duration, Kenya receives an additional 172 mm of rainfall and experiences 43 mm more ET. Also, note that Kenya's rainy seasons ends about 3 weeks after the end of Tanzania's rainy season. Kenya's intraseasonal rainfall variability involves high-volume rain events spaced out, whereas Dodoma is likely to have more frequent, smaller volume rain events.
5.3.4. Simulation 4 (S4) – Sandier Soils
The fourth simulation utilized Dodoma rainfall and ET with land cover from the Chididimo watershed. However, S4 replaced Chididimo's loam soil with sandy clay loams, which have a higher sand content (see Table 3). The sandy clay loams allow greater connectivity between the sand dam and the stream margins. This allows more water to seep from the sand dam into the streambanks and riparian zone. Furthermore, the sandy clay loams have a higher conductivity and lower moisture content at saturation, or porosity (see Table 3), affecting the maximum infiltration rate. S4 was performed to determine the extent to which watershed soil types may influence sand dam performance.
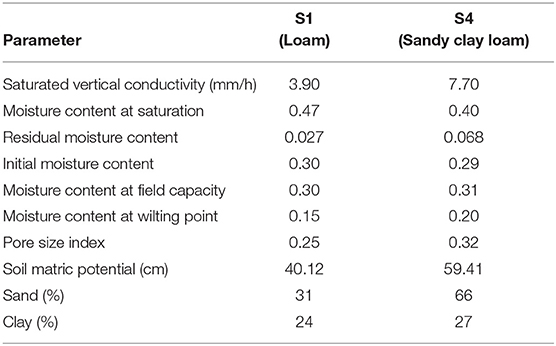
Table 3. Comparison of soil types for S1 and S4.
5.3.5. Simulation 5 (S5) – Climate Change
The fifth simulation (S5) maintains the Chididimo soil textures and land cover, while projected rainfall and ET from CMIP5 was used as forcing data. Historical and year 2100 rainfall and ET projections for Representative Concentration Pathway (RCP) 4.5 were obtained from CMIP5 Coordinated Regional Downscaling Experiment (CORDEX) for the Africa domain at a resolution of 0.44° (AFR-44). RCP 4.5 was selected, because it is considered an intermediate climate change scenario wherein carbon emissions will peak in the year 2040. CORDEX data is already downscaled. The climate projections were additionally bias corrected using the linear scaling technique detailed in Lenderink et al. (2007). Year 2100 climate projections indicate that Dodoma will experience fewer, but higher volume rainfall events over a slightly longer rainy season (see Figure 5). Also of note, ET is expected to be lower in the future. This is somewhat unexpected given the projected rise in temperature. However, it can likely be attributed to higher intensity rainfall events leading to higher runoff rates and thus lower infiltration, which decreases the water available for ET. S5 was performed to determine the impact that climate change might have on the performance of sand dams.
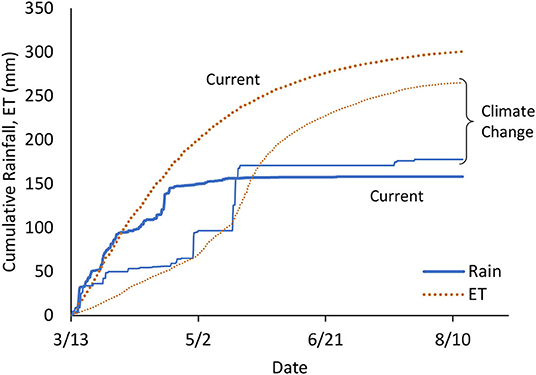
Figure 5. In year 2100 climate change projections, Dodoma will receive 19 mm more rainfall and 35 mm less ET during the simulation period than current conditions. Also, with climate change, the rainy season will end about 1 month later, and Dodoma will experience more infrequent, higher intensity rainfall events.
5.4. Assessment Criteria
The difference between S1 and S2-S4 overland flow and groundwater parameters was examined to determine which simulation arrangement produces preferable conditions for sand dam performance. The performance of sand dams was primarily assessed based on the following four parameters:
1. High recharge: A high performing sand dam will help raise the local groundwater table, as indicated by the transfer of water from the vadose zone to the surficial aquifer.
2. Low ET: A high performing sand dam will store water long into the dry season. To do so, the actual amount of water lost to ET should be minimized.
3. High vadose zone storage: Minimizing ET and maximizing recharge will be achieved through high levels of vadose zone storage. When the vadose zone has a high moisture content, the infiltration rate will be reduced. However, ET will occur from the existing water in the vadose zone before suctioning water from the surficial aquifer to the vadose zone to then be lost to ET. Further, recharge occurs from the vadose zone. Therefore, high vadose zone storage will result in more recharge flowing to the surficial aquifer. Vadose zone storage essentially protects groundwater from ET while also increasing the rate of recharge to the groundwater.
4. High rainfall excess: Most sand dams are filled by flash floods (Hut et al., 2008). High levels of rainfall excess will result in more surficial ponding and inundation that can fill a sand dam. For each honeycomb polygon at each time step, ICPR calculates rainfall excess as:
Therefore, if infiltration and ET are greater than the rainfall for the time step, the rainfall excess amount will be negative. As shown in Figure 4, the ET rate is generally greater than the rainfall rate in both Tanzania and Kenya. Therefore, negative rainfall excess values are expected. Note that the irrigation value for this model is zero.
Minor consideration was also given to lateral seepage. Lateral seepage represents a loss of stored water from the surficial aquifer. A highly performing sand dam should exhibit low levels of seepage.
6. Results and Discussion
6.1. The Base Case
The base case, S1, provides a starting point for exploring how overland flow parameters influence water capture and storage in sand dams. Here, the modeled Chididimo watershed simulates reality as closely as possible, given data and model framework limitations.
Over the course of the study, the Chididimo watershed loses almost 300 mm of water to ET, water from vadose zone storage recharges the groundwater, contributing to significant drying of the vadose zone, and infiltration and ET rates consistently outpace rainfall rates, resulting in negative rainfall excess (see Figure 6). The rainfall rate and available vadose zone water are sufficient to meet and exceed potential ET in the watershed. The actual rate of ET is slightly higher than the potential ET, due to the transpiration of maize, sorghum, and millet cultivated in the Chididimo watershed. Water that remains in the vadose zone after ET requirements are met, is percolated to the groundwater as recharge at a rate based on the moisture content, suction head, and depth of the vadose zone (Streamline Technologies, 2018; Saksena et al., 2019). As expected, vadose zone storage steadily declines during the end of the rainy season and throughout the dry season (see Figure 6). Further simulations identify overland flow features relative to this base case that are likely to either improve or reduce the performance of sand dams in the Chididimo watershed.
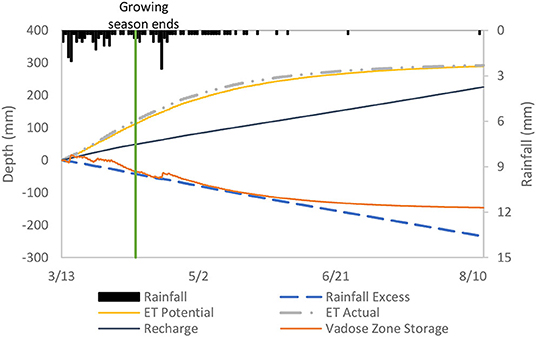
Figure 6. Cumulative overland flow quantities for the Chididimo watershed during S1, the base case.
6.2. Impact of Land Cover
Increasing the cropland cover in the Chididimo watershed results in significant changes for all overland flow and groundwater region quantities considered. Figure 7 provides an overview of which simulation produces flow parameter values that are beneficial to sand dam performance. Based on the commentary in Section 5.4, the line is above y = 0 if the S1 result is more beneficial for sand dams than the S2 result.
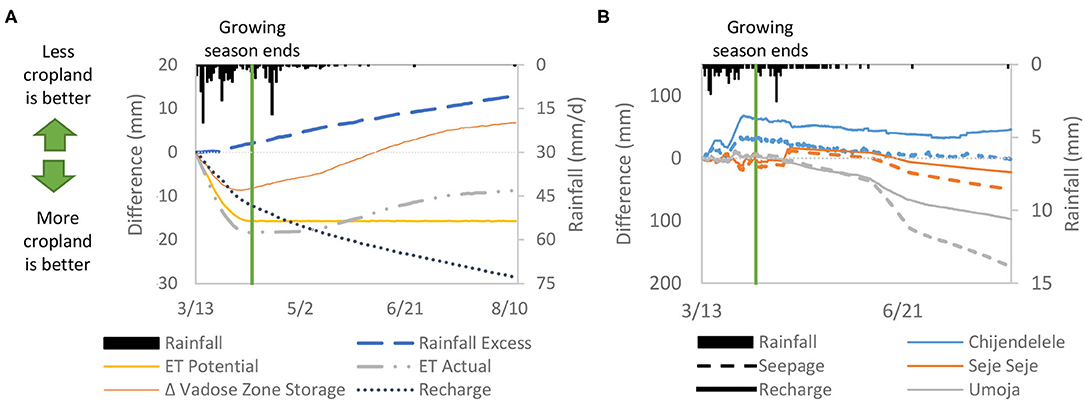
Figure 7. (A) Comparative trends in aggregate overland flow quantities for the Chididimo watershed after increasing cropland. (B) Comparative trends in groundwater flow parameters for each of the three sand dams after increasing cropland. For both (A,B), a quantity above the y = 0 line indicates that S1 (less cropland) produced values more beneficial to water storage in sand dams than S2. The converse also applies with quantities below the y = 0 line indicating S2 is more beneficial.
Interestingly, during the growing season, the high cultivation simulation, S2, provides a greater increase in vadose zone storage than the base simulation, S1, but this trend begins to reverse after the growing season ends (see Figure 7A). Within a few weeks after the end of the rainy season, more water is stored in the vadose zone in S1 compared with S2. Despite these differences in vadose zone storage, S1 consistently provides more excess rainfall to satisfy potential ET and infiltration compared with S2. It follows then, that S1 results in greater potential and actual ET than S2, which is seen in Figure 7A. Lower ET is desirable for a sustainable sand dam, and therefore Figure 7A shows the potential and actual ET lines in the more cropland is better portion of the plot. Overall, higher rates of cultivation are better for sand dam success when considering ET and rainy season vadose zone storage. Conversely, lower rates of cultivation are better for sand dam success when examining rainfall excess and dry season vadose zone storage.
In S1, land cover is dominated by natural vegetation, which is simulated with a constant crop coefficient of 1.00 (see Table 1). Conversely, most of the land cover in S2 is cropland, which has a 55-day period of increased ET followed by a 30-day period of reduced ET before the growing season ends on 4/9 (see Table 1). The vadose zone is drier in S2 at the start of the study period, because its large area of cropland experiences increased ET during the simulation spin up. The drier S2 vadose zone can then infiltrate more rainfall, resulting in a greater increase in vadose zone storage and less rainfall excess than occurs in S1. Furthermore, S2 has a larger area of reduced ET during the end of the growing season, resulting in more water retained by the vadose zone. Due to variable ET during the growing season, S2 is more beneficial for vadose zone storage than S1 during the rainy season. However, this trend reverses at the end of the growing season, when all landcover has the same crop coefficient of 1.00.
Actual ET and vadose zone storage are linked. Actual ET results from potential ET that is limited by rainfall excess and vadose zone moisture content. ET in S1 is initially higher than S2, because higher rainfall excess increases the water available for ET. However, as the rainy season ends and S2 has higher vadose zone storage, the rate of actual ET in S2 increases. This increased ET begins to deplete S2 vadose zone storage faster than in S1. Thus, S1 has a greater positive change in vadose zone storage at the end of the simulation time than S2.
In ICPR, water storage is added to the vadose zone vertically through infiltration and horizontally through subsurface flow driven by the gradient of the groundwater table (Streamline Technologies, 2018). These two inflows impact the saturation level of the vadose zone and may affect its unsaturated thickness (see section 2.2). While the vadose zone receives vertical infiltration and horizontal subsurface flow, recharge as defined in ICPR refers only to the volume of water that percolates from the vadose zone to the groundwater. Figures 7A,B shows that the Chijendelele and Umoja dams generate a larger difference between S1 and S2 recharge than the Chididimo watershed as a whole. As the most downstream and upstream dams in the cascading system, the Chijendelele and Umoja sand dams may be more influenced by the riparian land cover than Seje Seje. S1 has less vadose zone storage, thus it is unsurprising that S1 also has less recharge than S2 overall (see Figures 7A,B). While this is true for the entire Chididimo watershed, the trend varies somewhat for the individual sand dams. S2 produces greater recharge at the Umoja sand dam for the entire study and at the Seje Seje sand dam until the end of the rainy season. The Chijendelele sand dam always has greater recharge in S1 compared with S2. Chijendelele likely does not follow the overall recharge trend, because it is immediately downstream of two confluences that are near locations of frequent inundation. The frequent local flooding likely contributes to greater vadose zone storage and thus greater recharge at the Chijendelele sand dam compared to the rest of the Chididimo watershed.
6.3. Impact of Intraseasonal Rainfall Variability
Changing the rainfall and ET variability in the Chididimo watershed significantly impacted most of the overland flow and groundwater parameters studied (see Figures 8A,B). However, the increased rainfall volume, higher frequency of large rainfall events, and lower ET in S3 did not significantly affect the amount of rainfall excess or recharge for the entire watershed (see Figure 8A). Also, recharge and seepage at the Chijendele sand dam were largely unaffected by the change in rainfall and ET (see Figure 8B).
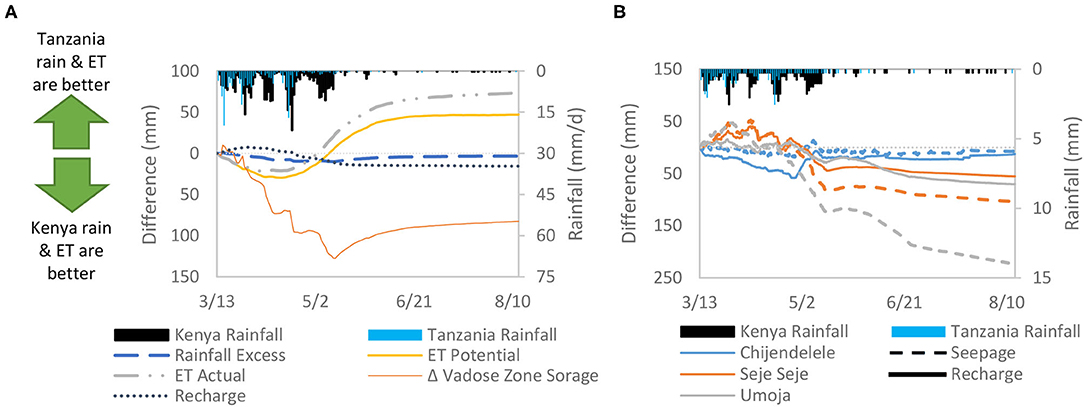
Figure 8. (A) Comparative trends in aggregate overland flow quantities for the Chididimo watershed after changing the rainfall variability and ET. (B) Comparative trends in groundwater flow parameters for each of the three sand dams after changing the rainfall variability and ET. For both (A,B), a quantity above the y = 0 line indicates that S1 (Tanzania climate) produced values more beneficial to water storage in sand dams than S3 (Kenya climate). The converse also applies with quantities below the y = 0 line indicating S3 is more beneficial.
S3 (Kenya) results in lower potential and actual ET during the rainy season compared to S1 (Tanzania), as is expected based on the forcing data (see Figure 4). However, the S1 potential and actual ET rates are lower than in S3 after the S1 rainy season ends. This lasts for approximately 1 month before the S3 rainy season also ends (see Figure 8A). The extended rainy season in S3 briefly causes higher S3 ET, but the benefits of the additional rain and the shorter dry season that follows likely outweigh any potential negative impacts. For example, Figure 8A shows that the vadose zone in S3 stores nearly 100 mm more water compared with S1 at the end of the rainy season. This additional vadose zone storage can be used to support vegetation or for groundwater recharge. Most of the increased rainfall in S3 immediately fulfills ET requirements or infiltrates into the vadose zone, as evidenced by the minimal difference between S1 and S3 rainfall excess and recharge. S3 vadose zone water, however, is no more likely to recharge groundwater than in S1. While S3 results in greater vadose zone storage than S1, the additional water is not enough to saturate the vadose zone and drive increased groundwater recharge.
The difference in S1 and S3 recharge is minimal over the entire Chididimo watershed, but the trends in groundwater recharge vary somewhat at the three sand dams (see Figure 8B). While there is some difference in Chijendelele recharge and seepage during the rainy season for S1 and S3, this difference is minimized during the subsequent dry season. The additional rain that falls at Chijendelele in S3 is likely just rainfall excess that ends up as surface runoff. As mentioned previously, the Chijendelele sand dam is immediately downstream of two small confluences, which transport up-catchment excess rainfall to Chijendelele. Therefore, the maximum infiltration rate at Chijendelele is likely already met by S1-levels of rainfall. The Seje Seje and Umoja sand dams provide slightly more recharge than the Chijendelele sand dam during S3, indicating that the vadose zone storage at these sand dams are benefitting from the additional rainfall.
The most striking result of the S3 groundwater analysis is the significantly lower seepage at the Umoja sand dam compared with S1, especially after the end of the S1 rainy season (see Figure 8B). Analysis of S2 also indicated that the Umoja sand dam has significantly less seepage than both Chijendelele and Seje Seje relative to S1 seepage rates (see Figure 7B). S2 produced 175 mm less lateral seepage compared to S1, while S3 produced about 225 mm less lateral seepage. It is also important to note that seepage at the Umoja sand dam generally occurs from the surficial aquifer to the overland flow system. Taken together, these trends indicate that groundwater elevation at the Umoja sand dam is highly responsive to changes in the overland flow region. The groundwater at Umoja may release water to the surface due to topography that produces small surface reservoirs just upstream of the sand dam. These reservoirs capture and store surface runoff until it is lost via ET or to groundwater recharge. Lateral flow within the surficial aquifer from these reservoirs may resurface at the Umoja sand dam in the form of seepage, similar to the cycle of sand dam leakage and recharge (seepage) described in Quinn et al. (2019).
6.4. Impact of Watershed Soil Texture
Simulating the Chididimo watershed with sandier soils significantly impacted most of the overland flow and groundwater parameters studied (see Figures 9A,B). However, the sandier soils of S4 did not significantly affect the rate of potential ET or vadose zone storage (see Figure 9A). Also, seepage at the Chijendelele sand dam was largely unaffected by the change in soils (see Figure 9B).
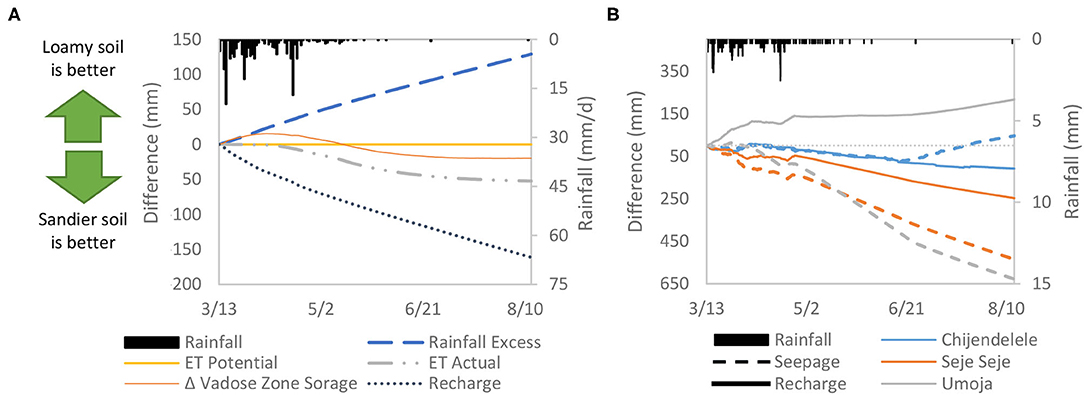
Figure 9. (A) Comparative trends in aggregate overland flow quantities for the Chididimo watershed after increasing the sand fraction. (B) Comparative trends in groundwater flow parameters for each of the three sand dams after increasing sand fraction. For both (A,B), a quantity above the y = 0 line indicates that S1 (loam) produced values more beneficial to water storage in sand dams than S4 (sandy clay loam). The converse also applies with quantities below the y = 0 line indicating S4 is more beneficial.
S4 results in less rainfall excess, and more groundwater recharge than S1. The rate of rainfall excess is greater in S1, because once the soil becomes saturated, infiltration occurs at the saturated vertical conductivity of the soil. The saturated vertical conductivity of S1 (3.90 mm/h) is less than that of S4 (7.70 mm/h). Thus, the minimum rate of infiltration and the rate of recharge from the vadose zone to the groundwater is higher in S4. S4 infiltrates more rainwater than S1, and this infiltrated water percolates through the vadose zone to the groundwater as recharge. Some of this additional infiltrated water remains in the vadose zone as storage. More water is retained in the S4 vadose zone, because S4 has a higher residual moisture content than S1 (see Table 3).
S4 has a lower rate of actual ET than S1, due to the differences in soil matric potential and the moisture content at wilting point. The soil matric potential of S4 (59.41 cm) is greater than that of S1 (40.12 cm). Soils with a higher matric potential hold onto water with greater force, making it harder for plants to remove the water during transpiration. In semi-arid regions where transpiration accounts for 85% of ET (Nagler et al., 2007), matric potential can greatly influence overall ET. The relative rates of ET are also influenced by the difference in plant available water between the two simulations. Plant available water is defined as water stored between the field capacity and wilting point moisture contents. The plant available water for S1 is 0.15 and is 0.11 for S4 (see Table 3). S1 has more plant available water, and therefore will lose more water to ET.
When considering the entire Chididimo watershed, S4 always produces greater cumulative recharge than S1. However, this is not always the case when considering the sand dams individually. Unlike the Chijendelele and Seje Seje sand dams, the Umoja sand dam produces more recharge in S1 compared with S4. This may be due to the topography near the Umoja sand dam that creates small surface reservoirs, as mentioned in the previous section. S1 has a lower minimum rate of infiltration, but a higher saturated moisture content. If given the necessary time to achieve infiltration, the vadose zone storage and resultant recharge would likely be greater for S1 than for S4. The unique topography at Umoja provides this opportunity in S1.
6.4.1. Connectivity With the Riparian Zone
Overall, S4 provides for much greater connectivity between the stream channel and the riparian zone than S1 (see Figure 10). Sandier soils with higher hydraulic conductivity permit subsurface water to flow more freely from the channel and sand dams to the riparian zone. Beyond the channel banks, S4 groundwater elevations increase by as much as 2 m more than in S1. Connectivity between the stream channel and the riparian zone permits subsurface flow from the channel into the banks, where it can further recharge the groundwater or be taken up for use by vegetation. A sand dam that is well-connected to its channel margins may be recharged by subsurface flow and store water for much longer into the dry season (Quinn et al., 2019). While there are examples of sand dams recharged by subsurface flow, this is likely not the case in the Chididimo watershed. Within the channel, there is little difference between the S1 and S4 change in groundwater elevation over the course of the study, which indicates that increased connectivity in S4 does not lead to subsurface flows recharging the sand dam reservoir. Further, Eisma and Merwade (2020) tracked the depletion of water storage at the Chijendelele sand dam and noted that the water storage rapidly decreased over a period of 10 weeks immediately following the rainy season. They presented no evidence that subsurface flows increased water storage at the Chijendelele sand dam.
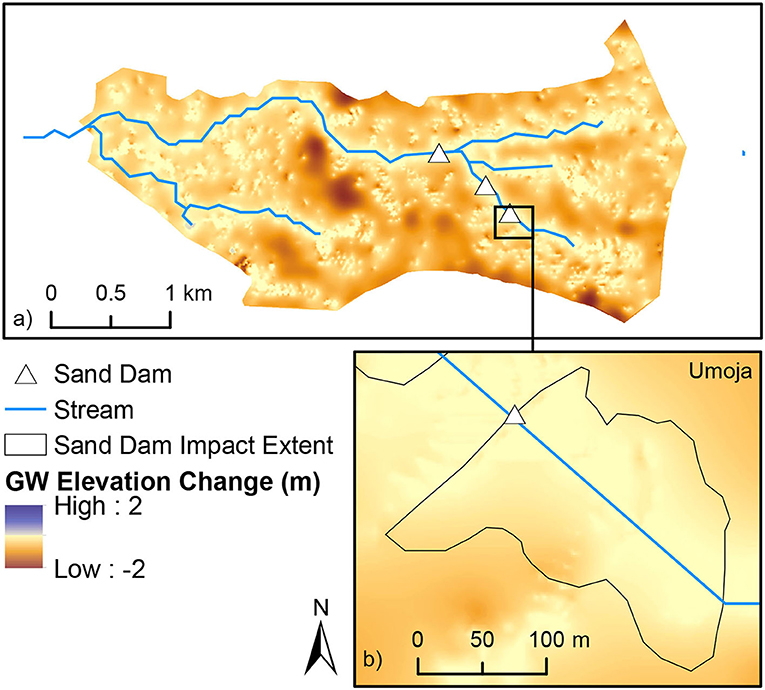
Figure 10. The difference between S1 and S4 groundwater (GW) elevation change at the end of the simulation period for (a) the Chididimo watershed and (b) the Umoja sand dam. A positive value indicates S1 produced a more desirable change in GW elevation relative to S4.
6.5. Impact of Climate Change
Climate change will, in many respects, improve the effectiveness of sand dams. While S5 showed that climate change will have a negative impact on rainfall excess, it will positively impact recharge and ET (see Figure 11A). Vadose zone storage is generally higher in the current climate scenario, S1, however, S5 vadose zone storage is briefly higher following a large, late season rain event. All three sand dams exhibit greater recharge and seepage in the climate change scenario compared with the base case, S1 (see Figure 11B).
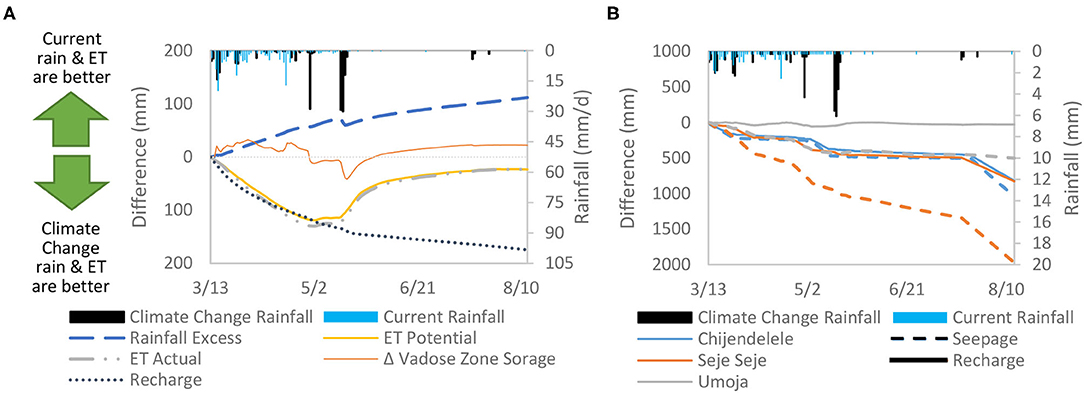
Figure 11. (A) Comparative trends in aggregate overland flow quantities for the Chididimo watershed when using predicted rainfall and ET for the year 2100. (B) Comparative trends in groundwater flow parameters for each of the three sand dams after using year 2100 predicted rainfall and ET. For both (A,B), a quantity above the y = 0 line indicates that S1 (year 2017) produced values more beneficial to water storage in sand dams than S5 (year 2100). The converse also applies with quantities below the y = 0 line indicating S5 is more beneficial.
S5 rainfall excess is much lower than S1 rainfall excess (see Figure 11A). According to Equation 4 and given similar S1 and S5 rainfall rates (see Figure 8), lower rainfall excess in S5 means that either S5 infiltration or ET are significantly higher than their S1 counterparts (Streamline Technologies, 2018). However, S5 ET is less than S1 ET (see Figure 5), thus lower rainfall excess in S5 cannot be attributed to ET. Therefore, lower rainfall excess in the climate change scenario must be caused by higher rates of S5 infiltration, which is corroborated by the higher S5 recharge seen in Figure 11A. Higher infiltration is expected to result in higher recharge, because water that infiltrates into the ground surface and percolates through the vadose zone ends up as groundwater recharge (Freeze, 1969; Viswanathan, 1983; Chow et al., 1988).
High intensity rainfall often increases rainfall excess rather than increasing infiltration, because high intensity rainfall may exceed the infiltration capacity of the soil (Chow et al., 1988). Thus, it is somewhat surprising to see that infiltration in S5 is higher than S1, but this can be attributed to the relationship between moisture content, suction head, and infiltration (Nimmo, 2009). Figure 5 shows that current rainfall has frequent, small events, causing the soil to be frequently wetted and supporting a relatively uniform soil moisture content. However, with climate change, rainfall events will occur infrequently but be very high intensity (World Bank, 2013). The creates a situation where the rain will fall on dry soil, because many weeks will pass between rainfall events. Therefore, with climate change, soil moisture content will be reduced, increasing the soil suction head and thus increasing the infiltration rate (Chow et al., 1988; Nimmo, 2009). So, the moisture content in S1 is, on average, higher than in S5, a conclusion supported by the higher S1 vadose zone storage (see Figure 11A).
High rates of infiltration with the infrequent, high intensity rainfall that will occur with climate change quickly saturate the vadose zone, triggering recharge, and raising the groundwater table. Thus, rain that infiltrates into the soil in S5 does not contribute much to vadose zone storage, rather it becomes groundwater recharge. Thus, S5 produces higher recharge than S1 (see Figure 11A). This is also seen in Figure 12, where the groundwater table in S5 rises much higher than the S1 groundwater table during the simulation period.
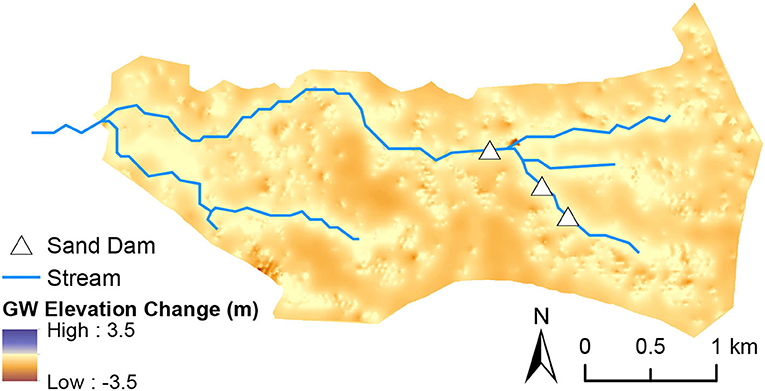
Figure 12. The difference between S1 and S5 groundwater (GW) elevation change at the end of the simulation period for the Chididimo watershed. A positive value indicates S1 produced a greater increase in GW elevation relative to S5.
Following the trend for the entire Chididimo watershed, S5 produces more recharge at each of three sand dams compared with S1 (see Figure 11B). Seepage at each of the three sand dams is also greater in S5 than in S1. This is likely the result of a raised groundwater table that releases water to the ground surface at points of intersection. While Umoja and Chijendelele exhibit similar levels of seepage, the Seje Seje sand dam has much higher seepage rates. Interestingly, of the three sand dams, Seje Seje retains abstractable water latest in the dry season (Chijendelele na Mlimo Group, personal communication, 14 November 2016). Physiographic features near the Seje Seje sand dam likely contribute to its increased seepage and increased ability to store water for a long time.
Rainfall excess, ET, vadose zone storage, recharge, and seepage trends in the Chididimo watershed and around the three cascading sand dams indicate that climate change will likely improve the effectiveness of sand dams in capturing and storing water. With climate change, the rainy season will last longer (see Figure 5), providing more opportunities for the sand dam to re-fill with water. The high intensity rainfall events with climate change only minimally impact vadose zone storage, but significantly increase groundwater recharge. High rates of groundwater recharge, as opposed to surface or vadose zone storage, mean that stored water is less susceptible to ET (Quinn et al., 2018; Eisma and Merwade, 2020). Despite higher temperatures expected with climate change, sand dams will still be an effective solution to water security in rural, dryland communities.
7. General Discussion and Considerations
The model of the Chididimo watershed and the five simulations provide some guidance on watershed-scale characteristics and climate features that will increase the performance of a sand dam. The Chididimo watershed only contains three sand dams that are in a cascading arrangement, so the general discussion included here is not conclusive. However, this study is the first attempt to use modeling to explore how watershed-scale and climate characteristics impact sand dam storage potential, thus this study provides new insights to the sand dam and wider water-harvesting community. The simulation results for the base case (S1) provided the basis against which to compare the impact of various watershed and climate features, so the commentary here is provided relative to S1.
Somewhat unexpectedly, S2 revealed that sand dams should likely be built in a watershed that is highly cultivated with low-water demand crops due to lower actual ET. However, the ET rate in cropland may be lower than in undisturbed land, due to lower soil moisture content associated with the soil compaction that occurs during the cultivation process (Lu et al., 2011). Further, actual ET is significantly reduced for crops during the initial and final stages of the growing season relative to the reference ET (Allen et al., 1998). While crop coefficients have not been well-studied for ecosystems with natural vegetation, most studies indicate that natural vegetation ET is nearly equal to reference ET (Nagler et al., 2007; Corbari et al., 2017). Thus, the extended periods of reduced ET in areas that are heavily cropped may allow for greater vadose zone storage and recharge during the growing season, and low-water demand crops have been shown to maintain higher soil moisture content than native vegetation (Bai et al., 2020). These benefits outweigh the negative affects of the limited period of increased ET during the middle of the growing season. Therefore, sand dams constructed in areas that are cultivated with low-water stress crops may store water longer into the dry season than a sand dam constructed in an area with primarily natural vegetation. This relationship may be strengthened by climate change, because as Figure 5 shows, ET may decrease with climate change despite increased temperatures.
The additional rainfall concentrated in fewer large events over a longer rainy season in S3 did not result in greater sand dam performance beyond increased vadose zone storage (see Figure 8A). Additional vadose zone storage provides more water for plants to use in transpiration but would not increase the water available for abstraction (Nimmo, 2009). The additional vadose zone storage in S3 results in greater actual ET losses in S3 compared to S1, despite lower potential ET in S3. S3 reveals that the prevailing cycle of rainy and dry seasons in Kenya has a greater impact on sand dam performance than rainfall depth or intraseasonal rainfall variability. At the end of the study period, recharge in S1 (Tanzanian rainfall) and in S3 (Kenyan rainfall) were similar. However, in Kenya, another rainy season would begin within a couple of weeks. In Dodoma, Tanzania, the next rainy season would not begin for at least another 3–4 months (Luhunga and Djolov, 2017). Thus, Kenya's dry seasons are much shorter than those in Dodoma, and many sand dams can store water for the entire duration of a Kenyan dry season (Borst and de Haas, 2006; Hut et al., 2008). Sand dams constructed in areas with 3–4 month-long dry seasons may store water for the entire dry season (Eisma and Merwade, 2020). Conversely, sand dams in locations with extended dry seasons will likely exhaust their stored water before the subsequent rainy season. This relationship is not expected to be affected by climate change, because the overall pattern of rainy and dry seasons is not expected to change significantly (Seneviratne et al., 2012). However, rainfall variability will increase (Trenberth et al., 2007; Seneviratne et al., 2012), and the chance of a rainy season producing less rainfall or occurring later than expected will also increase. These conditions have already been observed in Tanzania, for example, where the northern part of the country saw a minimal October/November rainy season in 2016 (Kimokouwa Group, personal communication, November 24, 2016), and the rainy season in Dodoma started 2 months later than expected (Chijendelele Na Mlimo Group and Vumilia Group, personal communication, February 21, 2017).
Sandier soils resulted in more groundwater recharge and greater connectivity between the sand dam and channel margins. The additional recharge raises the local groundwater table, which helps to rejuvenate the ecosystem by making water available to vegetation for transpiration (Eisma and Merwade, 2020). As a result of this interaction, sand dams often have more vegetation in their vicinity than other nearby land (Manzi and Kuria, 2011; Ryan and Elsner, 2016; Eisma and Merwade, 2020). Increased connectivity with the riparian zone also increases the area of impact for a sand dam by permitting subsurface flow from the sand dam reservoir to travel through a horizontal soil layer with relatively high hydraulic conductivity, thus increasing the horizontal extent of the local groundwater mound that may form beneath a sand dam (Quinn et al., 2019). A sand dam that is well-connected to its channel margins will have a greater positive impact on the vitality of the surrounding land. Sand dams may perform better in a watershed where the soil textures in the riparian zone permit high connectivity with the sand dam reservoir. With climate change, watershed soil texture may change. High intensity rainfall events will likely increase the rate of soil erosion in East Africa (Maeda et al., 2010), which may lead to decreased connectivity between sand dams and the riparian zone. However, the magnitude of this impact is uncertain and likely depends on the local soil profile.
With climate change, the Chididimo watershed will experience a significant decrease in rainfall excess and a significant increase in recharge, part of which can be attributed to an overall reduction in ET. Despite these changes, climate change will have a minimal impact on vadose zone storage. Many of these changes are likely due to the shift in rainfall variability to infrequent, high intensity events. In the Chididimo watershed, year 2100 rainfall is minimal after March 28 with most of the rain falling in two large events of about 30 and 75 mm (see Figure 5). Despite the high intensity rainfall, the vadose zone infiltrates most of the rainfall and becomes saturated, effectively raising the groundwater table. Climate change is largely viewed as inevitable (Fawzy et al., 2020; Turner et al., 2020), and climate change may make sand dams more effective as a solution to water scarcity in rural drylands. However, with the increased rainfall variability climate change brings, sand dams may have an increasingly negative impact on downstream flows (Aerts et al., 2007; Lasage and Verburg, 2015). Nonetheless, S5 showed that rainfall excess in the Chididimo watershed would decrease with climate change, so downstream flows may be negatively impacted with climate change regardless of sand dam presence.
In summary, climate change will largely have a positive impact on the water capture and storage potential of sand dams, given the assumptions made in this study. Cultivated watersheds are highly suited to sand dams, because the growing cycle of most crops has a period of lower ET requirement relative to natural vegetation. This period of low ET improves conditions for vadose zone storage and groundwater recharge. Sand dams will be more able to retain water throughout the dry season, if they are built in regions with a bi-modal rainfall regime, and this is not expected to change with the climate. Watersheds with sandy soils support sand dam functions better than silty or clayey watersheds, because sand has higher infiltration potential and connectivity with the riparian zone. However, climate change may cause increased erosion in sandy watersheds, which may increase the proportion of fine soil impounded by the sand dams and thus limit their ability to store water. By consciously considering large-scale watershed features and climate in addition to community needs, sand dams can selectively be built where they can best support the water needs of the local community.
8. Limitations and Future Work
The study presented here includes limitations that may restrict the utility of the findings. First, the DEM used to define the overland flow region was the best available but had quality issues (e.g., unusual undulations) that may have affected simulation of overland flow. Second, the Chididimo model was not calibrated due to the lack of streamflow data in the watershed. Calibrating the model with streamflow data available from a nearby watershed would improve confidence in the validity of the findings. Third, only one watershed with three cascading sand dams were modeled, inherently limiting the generalization of study results. Modeling a larger variety of sand dams in additional watersheds would strengthen the study findings. Lastly, the simulation results were analyzed at the watershed scale. While this was motivated by commentary in existing studies (see Ngugi et al., 2020), physiographic factors within a watershed may vary greatly and thus variably impact sand dam performance.
The work developed here will be expanded and refined to develop local-scale siting guidelines for sand dams. Five additional sand dams in the nearby Soweto watershed will be modeled in ICPR, bringing the total number of modeled sand dams to eight. Six of the modeled sand dams will be in two different cascading systems, and two will be isolated, thus increasing the diversity and quantity of dams studied. Multiple simulations will be performed and the results analyzed to determine relationships between local physiographic factors and sand dam performance. This analysis will produce local-scale site selection guidelines to complement the discussion of watershed-scale factors presented here.
Data Availability Statement
The datasets used to develop the models in this study are freely available for download, and their citation information has been included in Section 3: Data and the References.
Author Contributions
JE conceived the project, developed the methodology, built the models, analyzed the simulation results, and wrote the manuscript. SS assisted in the conceptual model development, improved the model build at critical moments, and oversaw the model simulations. VM oversaw the project and contributed expert knowledge. All authors contributed to the article and approved the submitted version.
Funding
JE was supported in part by USAID (grant no. A1134) and the NSF (grant no. DGE-1333468).
Conflict of Interest
The authors declare that the research was conducted in the absence of any commercial or financial relationships that could be construed as a potential conflict of interest.
Acknowledgments
We would like to thank the two peer reviewers for their comments and constructive criticisms that helped improve the quality of the manuscript.
References
Aerts, J., Lasage, R., Beets, W., de Moel, H., Mutiso, G., Mutiso, S., et al. (2007). Robustness of sand storage dams under climate change. Vadose Zone J. 6:572. doi: 10.2136/vzj2006.0097
Allen, R. G., Pereira, L. S., Raes, D., and Smith, M. (1998). Crop evapotranspiration-guidelines for computing crop water requirements-FAO irrigation and drainage paper 56. FAO 300, D05109.
Ammar, A., Riksen, M., Ouessar, M., and Ritsema, C. (2016). Identification of suitable sites for rainwater harvesting structures in arid and semi-arid regions: a review. Int. Water Conserv. Res. 4, 108–120. doi: 10.1016/j.iswcr.2016.03.001
Aneseyee, A. B., Elias, E., Soromessa, T., and Feyisa, G. L. (2020). Land use/land cover change effect on soil erosion and sediment delivery in the winike watershed, Omo Gibe Basin, Ethiopia. Sci. Total Environ. 728:138776. doi: 10.1016/j.scitotenv.2020.138776
Bai, X., Jia, X., Jia, Y., and Hu, W. (2020). Modeling long-term soil water dynamics in response to land-use change in a semi-arid area. J. Hydrol. 585:124824. doi: 10.1016/j.jhydrol.2020.124824
Beaudoing, H., and Rodell, M. (2016). Nasa/gsfc/hsl. GLDAS Noah Land Surface Model L4 monthly 0.25 x 0.25 degree 2.
Beswetherick, S., Carrire, M., Legendre, V., Mather, W., Perpes, T., and Saunier, B. (2018). Guidelines for the siting of sand dams. Master's thesis, Cranfield University, Cranfield, UK.
Borst, L., and de Haas, S. (2006). Hydrology of sand storage dams: a case study in the Kiindu catchment, Kitui District Kenya. Master's thesis, Vrije Universiteit Amsterdam, Amsterdam, Netherlands.
Chow, V. T., Maidment, D. R., and Mays, L. W. (1988). Applied Hydrology. New York, NY: McGraw-Hill, 572.
Corbari, C., Ravazzani, G., Galvagno, M., Cremonese, E., and Mancini, M. (2017). Assessing crop coefficients for natural vegetated areas using satellite data and eddy covariance stations. Sensors 17:2664 doi: 10.3390/s17112664
de Trincheria, J., Nissen-Petersen, E., Filho, W., and Otterphol, R. (2015). “Factors affecting the performance and cost-efficiency of sand storage dams in south-eastern Kenya,” in Deltas of the Future and What Happens Upstream, 36th IAHR World Congress (The Hague).
Eisma, J. A., and Merwade, V. M. (2020). Investigating the environmental response to water harvesting structures: a field study in Tanzania. Hydrol. Earth Syst. Sci. 24, 1891–1906. doi: 10.5194/hess-24-1891-2020
Fawzy, S., Osman, A. I., Doran, J., and Rooney, D. W. (2020). Strategies for mitigation of climate change: a review. Environ. Chem. Lett. 18, 2069–2094. doi: 10.1007/s10311-020-01059-w
Fischer, G., Nachtergaele, F., Prieler, S., van Velthuizen, H., Verelst, L., and Wiberg, D. (2008). Global Agro-Ecological Zones Assessment for Agriculture (GAEZ 2008). Laxenburg; Rome: FAO; IIASA.
Freeze, R. A. (1969). The mechanism of natural ground-water recharge and discharge: 1. one-dimensional, vertical, unsteady, unsaturated flow above a recharging or discharging ground-water flow system. Water Resour. Res. 5, 153–171. doi: 10.1029/WR005i001p00153
Guzha, A., Rufino, M. C., Okoth, S., Jacobs, S., and Nóbrega, R. (2018). Impacts of land use and land cover change on surface runoff, discharge and low flows: evidence from East Africa. J Hydrol. Reg. Stud. 15, 49–67. doi: 10.1016/j.ejrh.2017.11.005
Hekala, W. (2012). Why Donors Should Care More About Project Management. Devex. Retrieved from: http://www.devex.com/en/news/why-donors-shouldcare-more-about-project/77595
Hut, R., Ertsen, M., Joeman, N., Vergeer, N., Winsemius, H., and van de Giesen, N. (2008). Effects of sand storage dams on groundwater levels with examples from Kenya. Phys. Chem. Earth Parts A/B/C 33, 56–66. doi: 10.1016/j.pce.2007.04.006
Ika, L. A. (2012). Project management for development in Africa: why projects are failing and what can be done about it. Project Manag. J. 43, 27–41. doi: 10.1002/pmj.21281
Lambin, E. F., Geist, H. J., and Lepers, E. (2003). Dynamics of land-use and land-cover change in tropical regions. Ann. Rev. Environ. Resour. 28, 205–241. doi: 10.1146/annurev.energy.28.050302.105459
Lasage, R., Aerts, J., Mutiso, G.-C., and de Vries, A. (2008). Potential for community based adaptation to droughts: sand dams in Kitui Kenya. Phys. Chem. Earth Parts A/B/C, 33, 67–73. doi: 10.1016/j.pce.2007.04.009
Lasage, R., and Verburg, P. H. (2015). Evaluation of small scale water harvesting techniques for semi-arid environments. J. Arid Environ. 118, 48–57. doi: 10.1016/j.jaridenv.2015.02.019
Lenderink, G., Buishand, A., and Deursen, W. v. (2007). Estimates of future discharges of the river rhine using two scenario methodologies: direct versus delta approach. Hydrol. Earth Syst. Sci. 11, 1145–1159. doi: 10.5194/hess-11-1145-2007
Liu, Z., Merwade, V., and Jafarzadegan, K. (2019). Investigating the role of model structure and surface roughness in generating flood inundation extents using one-and two-dimensional hydraulic models. J. Flood Risk Manag. 12:e12347. doi: 10.1111/jfr3.12347
Lu, N., Chen, S., Wilske, B., Sun, G., and Chen, J. (2011). Evapotranspiration and soil water relationships in a range of disturbed and undisturbed ecosystems in the semi-arid Inner Mongolia, China. J. Plant Ecol. 4, 49–60. doi: 10.1093/jpe/rtq035
Luhunga, P. M., and Djolov, G. (2017). Evaluation of the use of moist potential vorticity and moist potential vorticity vector in describing annual cycles of rainfall over different regions in Tanzania. Front. Earth Sci. 5:7. doi: 10.3389/feart.2017.00007
Luhunga, P. M., Kijazi, A. L., Chang'a, L., Kondowe, A., Ng'ongolo, H., and Mtongori, H. (2018). Climate change projections for Tanzania based on high-resolution regional climate models from the coordinated regional climate downscaling experiment (CORDEX)-Africa. Front. Environ. Sci. 6:122. doi: 10.3389/fenvs.2018.00122
MacDonald, A. M., Bonsor, H. C., Dochartaigh, B. É. Ó., and Taylor, R. G. (2012). Quantitative maps of groundwater resources in Africa. Environ. Res. Lett. 7:024009. doi: 10.1088/1748-9326/7/2/024009
Maeda, E. E., Pellikka, P. K., Siljander, M., and Clark, B. J. (2010). Potential impacts of agricultural expansion and climate change on soil erosion in the eastern arc mountains of Kenya. Geomorphology 123, 279–289. doi: 10.1016/j.geomorph.2010.07.019
Manzi, H., and Kuria, D. (2011). The use of satellite images to monitor the effect of sand dams on stream bank land cover changes in Kitui District. J. Agric. Sci. Technol. 13, 133–150.
Martínez, J. (1989). “Simulación matemática de cuencas subterráneas: flujo impermanente bidimensional,” in Monografía, Facultad de Ingeniería Civil, Instituto Superior Politécnico José Antonio Echeverría (Ciudad de la Habana, Cuba).
Miković, R, Petrović, D, Mihić M Obradović, V, and Todorović, M. (2020). The integration of social capital and knowledge management–the key challenge for international development and cooperation projects of nonprofit organizations. Int. J. Project Manag. 38, 515–533. doi: 10.1016/j.ijproman.2020.07.006
Msongaleli, B. M., Tumbo, S. D., Kihupi, N. I., and Rwehumbiza, F. B. (2017). Performance of sorghum varieties under variable rainfall in Central Tanzania. Int. Sch. Res. Notices 2017, 1–10. doi: 10.1155/2017/2506946
Nagler, P., Glenn, E., Kim, H., Emmerich, W., Scott, R., Huxman, T., et al. (2007). Relationship between evapotranspiration and precipitation pulses in a semiarid rangeland estimated by moisture flux towers and modis vegetation indices. J. Arid Environ. 70, 443–462. doi: 10.1016/j.jaridenv.2006.12.026
NASA JPL (2013). NASA Shuttle Radar Topography Mission Global 1 Arc Second [Data set]. NASA EOSDIS Land Processes DAAC. doi: 10.5067/MEaSUREs/SRTM/SRTMGL1.003
Neufeld, D. G., Muli, J., Muendo, B., and Kanyari, J. (2021). Assessment of water presence and use at sand dams in Kenya. J. Arid Environ. 188:104472. doi: 10.1016/j.jaridenv.2021.104472
Ngugi, K. K., Gichaba, C. M., Kathumo, V. V., and Ertsen, M. M. (2020). Back to the drawing board: assessing siting guidelines for sand dams in Kenya. Sustain. Water Resour. Manag. 6, 1–28. doi: 10.1007/s40899-020-00417-4
Nimmo, J. (2009). “Vadose zone,” in Encyclopedia of Inland Waters, ed G. E. Likens (New York, NY: Elsevier), 766–777.
Nkotagu, H. (1996). The groundwater geochemistry in a semi-arid, fractured crystalline basement area of Dodoma, Tanzania. J. Afr. Earth Sci. 23, 593–605. doi: 10.1016/S0899-5362(97)00021-3
Pauw, W., Mutiso, S., Mutiso, G., Manzi, H., Lasage, R., Aerts, J., et al. (2008). An Assessment of the Social and Economic Effects of the Kitui Sand Dams. SASOL & Institute for Environmental Studies.
Peel, M. C., Finlayson, B. L., and McMahon, T. A. (2007). Updated world map of the Kpen-Geiger climate classification. Hydrol. Earth Syst. Sci. 11, 1633–1644. doi: 10.5194/hess-11-1633-2007
Platts, P. J., Omeny, P. A., and Marchant, R. (2015). AFRICLIM: high-resolution climate projections for ecological applications in Africa. Afr. J. Ecol. 53, 103–108. doi: 10.1111/aje.12180
Quilis, R. O., Hoogmoed, M., Ertsen, M., Foppen, J. W., Hut, R., and de Vries, A. (2009). Measuring and modeling hydrological processes of sand-storage dams on different spatial scales. Phys. Chem. Earth Parts A/B/C 34, 289–298. doi: 10.1016/j.pce.2008.06.057
Quinn, R., Parker, A., and Rushton, K. (2018). Evaporation from bare soil: lysimeter experiments in sand dams interpreted using conceptual and numerical models. J. Hydrol. 564, 909–915. doi: 10.1016/j.jhydrol.2018.07.011
Quinn, R., Rushton, K., and Parker, A. (2019). An examination of the hydrological system of a sand dam during the dry season leading to water balances. J. Hydrol. X 4:100035. doi: 10.1016/j.hydroa.2019.100035
RAIN Foundation (2012). A Practical Guide to Sand Dam Implementation. Amsterdam: Rain Foundation. Available online at: http://www.samsamwater.com/library/Sand_dam_manual_FINAL.pdf (accessed April 21, 2018).
Rawls, W. J., and Brakensiek, D. L. (1982). Estimating soil water retention from soil properties. J. Irrigat. Drainage Div. 108, 166–171. doi: 10.1061/JRCEA4.0001383
Rawls, W. J., Brakensiek, D. L., and Saxton, K. E. (1982). Estimation of soil water properties. Trans. ASAE 25, 1316–1320. doi: 10.13031/2013.33720
Rawls, W. J., Gimenez, D., and Grossman, R. (1998). Use of soil texture, bulk density, and slope of the water retention curve to predict saturated hydraulic conductivity. Trans. ASAE 41, 983–988. doi: 10.13031/2013.17270
Rhode, C., and Stitteneder, T. (2020). “Creating sustainable cooperation strategies with Africa: a glance at development aid and fdi,” in CESifo Forum Vol. 21, (München: ifo Institut-Leibniz-Institut für Wirtschaftsforschung an der .), 53–57.
Rodell, M., Houser, P., Jambor, U., Gottschalck, J., Mitchell, K., Meng, C.-J., et al. (2004). The global land data assimilation system. Bull. Am. Meteorol. Soc. 85, 381–394. doi: 10.1175/BAMS-85-3-381
Ryan, C., and Elsner, P. (2016). The potential for sand dams to increase the adaptive capacity of East African drylands to climate change. Reg. Environ. Change 16, 2087–2096. doi: 10.1007/s10113-016-0938-y
Saksena, S., Dey, S., Merwade, V., and Singhofen, P. J. (2020). A computationally efficient and physically based approach for urban flood modeling using a flexible spatiotemporal structure. Water Resour. Res. 56:e2019WR025769. doi: 10.1029/2019WR025769
Saksena, S., Merwade, V., and Singhofen, P. J. (2019). Flood inundation modeling and mapping by integrating surface and subsurface hydrology with river hydrodynamics. J. Hydrol. 575, 1155–1177. doi: 10.1016/j.jhydrol.2019.06.024
Seneviratne, S., Nicholls, N., Easterling, D., Goodess, C., Kanae, S., Kossin, J., et al. (2012). “Changes in climate extremes and their impacts on the natural physical environment,” in Managing the Risks of Extreme Events and Disasters to Advance Climate Change Adaptation, eds C. Field, V. Barros, T. Stocker, D. Qin, D. Dokken, K. Ebi, M. Mastrandrea, K. Mach, G.-K. Plattner, S. Allen, M. Tignor and P. Midgley (Cambridge, UK; New York, NY: Cambridge University Press), 109–230.
Shangguan, W., Hengl, T., Mendes de Jesus, J., Yuan, H., and Dai, Y. (2017). Mapping the global depth to bedrock for land surface modeling: Global map of depth to bedrock. J. Adv. Model. Earth Syst. 9, 65–88. doi: 10.1002/2016MS000686
Streamline Technologies (2018). ICPR4 Technical Reference Manual. Streamline Technol. Inc., Winter Springs, Florida.
Trenberth, K. E., Jones, P. D., Ambenje, P., Bojariu, R., Easterling, D., Klein Tank, A., et al. (2007). “Observations. surface and atmospheric climate change. Chapter 3,” in Climate Change 2007: The Physical Science Basis. Contribution of Working Group I to the Fourth Assessment Report of the Intergovernmental Panel on Climate Change, eds S. Solomon, D. Qin, M. Manning, Z. Chen, M. Marquis, K. Averyt, M. Tignor, and H. Miller (Cambridge, UK; New York, NY: Cambridge University Press), 235–336.
Turner, M. G., Calder, W. J., Cumming, G. S., Hughes, T. P., Jentsch, A., LaDeau, S. L., et al. (2020). Climate change, ecosystems and abrupt change: Science priorities. Philos. Trans. Royal Soc. B 375:20190105. doi: 10.1098/rstb.2019.0105
Viducich, J. (2015). Spillway staging and selective sediment deposition in sand storage dams. Master's thesis, Oregon State University, Corvallis, OR.
Viswanathan, M. (1983). The rainfall/water-table level relationship of an unconfined aquifer. Groundwater 21, 49–56. doi: 10.1111/j.1745-6584.1983.tb00704.x
World Bank (2013). Turn Down the Heat: Climate Extremes, Regional Impacts, and the Case for Resilience. A Report for the World Bank by the Potsdam Institute for Climate Impact Research and Climate Analytics.
Wu, G.-L., Liu, Y.-F., Cui, Z., Liu, Y., Shi, Z.-H., Yin, R., et al. (2020). Trade-off between vegetation type, soil erosion control and surface water in global semi-arid regions: a meta-analysis. J. Appl. Ecol. 57, 875–885. doi: 10.1111/1365-2664.13597
Yohan, I., Oteng'i, S., and Lukorito, C. (2006). Assessment of the growing season over the unimodal rainfall regime region of Tanzania. Tanzania J. Agric. Sci. 7, 16–26.
Youker, R. (2003). “The nature of international development projects,” in Proceedings of PMI Global Congress 2003 North America Baltimore, MD.
Keywords: arid, semi-arid, sub-Saharan Africa, hydrologic modeling, climate change, evapotranspiration, vegetation, soil texture
Citation: Eisma JA, Saksena S and Merwade V (2021) Assessing the Impact of Land Cover, Soil, and Climate on the Storage Potential of Dryland Sand Dams. Front. Water 3:671455. doi: 10.3389/frwa.2021.671455
Received: 23 February 2021; Accepted: 25 May 2021;
Published: 02 July 2021.
Edited by:
Daniel Olago, University of Nairobi, KenyaReviewed by:
Seifu Admassu Tilahun, Bahir Dar University, EthiopiaDelali Benjamin Dovie, University of Ghana, Ghana
Copyright © 2021 Eisma, Saksena and Merwade. This is an open-access article distributed under the terms of the Creative Commons Attribution License (CC BY). The use, distribution or reproduction in other forums is permitted, provided the original author(s) and the copyright owner(s) are credited and that the original publication in this journal is cited, in accordance with accepted academic practice. No use, distribution or reproduction is permitted which does not comply with these terms.
*Correspondence: Jessica A. Eisma, amVzc2ljYS5laXNtYUB1dGEuZWR1