 Zhihua He
- Centre for Hydrology, University of Saskatchewan, Saskatoon, SK, Canada
This study used the WASA (Water Availability in Semi-Arid Environments) hydrological model to simulate runoff generation processes and glacier evolution in the Ala-Archa basin in Central Asia. Model parameters were calibrated by observations of streamflow, satellite snow cover area (SCA) and annual glacier mass balance (GMB). Temperature and precipitation change scenarios were set up by perturbations of the reference measurements in a 20-year period of 1997 to 2016. Seven temperature warming scenarios with an increment of +1°C and six precipitation change scenarios ranging from 70 to 130% of the reference precipitation were used to investigate the sensitivities of hydrological processes to climate changes in the study basin. Results indicate that: (1) Annual runoff increased with rising temperature (T) and precipitation (P) at rates of 76 mm/+1°C and 62 mm/+10%P, respectively. Glacier area was more sensitive to T changes than to P changes. The total glacier area in the basin decreased with T warming at a rate of −0.47 km2/+1°C, whilst increasing with rising P at a rate of 0.16 km2/+10%P. (2) The basin runoff switched from rainfall and groundwater-dominated to ice melt-dominated with warming T, while the dominance of rainfall and groundwater were strongly enhanced by rising P. Proportion of rainfall in the total water input for runoff generation decreased with T warming at a rate of −0.5%/+1°C, while increasing with P increases at a rate of 1.2%/+10% P. Ice melt proportion changed with T and P increases at rates of 4.2%/+1°C and −1.8%/+10%P, respectively. Groundwater contribution to total runoff decreased by −2.8% per T warming of 1°C, but increased by 1.5% per P increase of 10%. (3) The maximum P changes (±30%) could only compensate the effects of T warming of 0.5 to 2.5°C. Increase of annual runoff forced by T warming lower than 2.2°C could be compensated by decrease caused by the maximum P decrease of −30%. Decrease of glacier area caused by 1°C warming cannot be compensated by the maximum P increase of +30%. The combined input of 20% increase of P and T warming of 6°C resulted in 90% increase of annual runoff, and 8% reduction of glacier area. The results inform understandings of the hydrological responses to potential climate changes in glacierized basins in Central Asia.
Introduction
Glaciers in Central Asia high mountains store large volumes of freshwater and provide important meltwater sources for downstream water supply, especially in dry years (Chen et al., 2019). Agricultural irrigation and local economies rely heavily on seasonal melting water from snowpack and exposed ices, due to the semi-arid to arid climate in Central Asia (Unger-Shayesteh et al., 2013). The strong dependence of runoff on melting water makes water resource in Central Asia highly vulnerable to climate changes (Shahgedanova et al., 2018). Previous studies have demonstrated that the current climate warming is accelerating glacier retreat in Central Asia and re-shaping both inter-annual and intra-annual variabilities of runoff in the glacierized basins (e.g., Sorg et al., 2012, 2014; Xu et al., 2015). However, responses of glacier retreat to climate warming show strong variances across the mountains in Central Asia, partly due to the different precipitation inputs (Luo et al., 2018). For better understandings of future dynamics of water resource in Central Asia, it is important to know how runoff and glacier area in glacierized basins are sensitive to changes of temperature and precipitation.
Physically-based hydrological models that simulated the spatial distributions of rainfall, snow accumulation and melt, and glacier melting water have been widely used to evaluate the responses of hydrological processes to climate changes in glacierized basins (e.g., Xu et al., 2015; Zhang et al., 2016; Li et al., 2019; Ismail et al., 2020). Considering the strong dynamics of glacier mass balance and glacier area under changing climate in these basins, glacio-hydrological models that physically represent the evolutions of glacier thickness and area are highly suggested to be used to project the future hydrology changes (Huss et al., 2014; Luo et al., 2018). Projections of future runoff changes forced by outputs from regional climate models (RCMs) or general circulation models (GCMs) have demonstrated runoff increases by the near future (2040–2050) but decreases by the end of twenty first century in many of the Central Asian glacierized basins (e.g., Fang et al., 2015b; Gan et al., 2015; Duethmann et al., 2016). However, thus runoff projections depended strongly on the used climate models and RCP scenarios (Lutz et al., 2012; Luo et al., 2018). Uncertainties of the projected runoff changes were apparently related to the differences of different climate models and emission scenarios (Duethmann et al., 2016). Moreover, spatial resolutions of RCMs and GCMs are relatively coarse (Chen et al., 2017), leading to low capability to capture the complex spatial precipitation in the Central Asian mountains, despite that many downscaling methods have been used to refine the climate outputs (Liu et al., 2011; Fang et al., 2015a; Luo et al., 2018). Therefore, projecting future runoff changes in small glacierized basins which provide critical water supply in local regions is still much challenging.
Another option to investigate the hydrological responses to climate changes in glacierized basins is using the incremental climate scenarios (e.g., Singh and Kumar, 1997; Nepal et al., 2014), in which hypothetical temperature and precipitation change scenarios were set up by adding random or linear increments to the baseline climate inputs measured in a reference period. The increment ranges of temperature and precipitation in basins that are of interest were informed from projections of assembles of climate models (Rasouli et al., 2014). Advantages of using the incremental climate scenarios include to test how specific hydrological processes are sensitive to changes of temperature and precipitation (Aygün et al., 2020), and to reveal to what extent the effects of temperature changes on specific hydrological characteristics can be compensated by the effects of precipitation changes. This method is suitable to the investigation of hydrological responses to climate changes in small basins (Rasouli et al., 2015). Assemble outputs of the Sixth Phase of Coupled Model Inter-comparison Project (CMIP6) suggested increases of annual precipitation ranging from 2 to 22% in Central Asia by the end of twenty first century in comparison to the present period of 1995–2014 (Jiang et al., 2020). However, Huang et al. (2014) found decreases of mean annual precipitation of around 3 mm/decade in some regions in Central Asia (based on the inter-comparisons of two periods of 2011–2100 and 1911–2000) when using outputs from the CMIP5 under the RCP 2.6 emission scenario. Temperature projections from the CMIP5 outputs indicate increases of 3 to 7°C over Central Asia by the end of this century compared to the past period of 1971–2000 (Ozturk et al., 2017). These results informed the potential increment ranges of temperature and precipitation in the Central Asian glacierized basins.
In light of those, this study used the physically-based hydrological model WASA (Water Availability in Semi-Arid Environments, Güntner and Bronstert, 2004) to quantify the hydrological responses to climate changes in the Ala-Archa basin in Kyrgyzstan. The basin extends an area of 233 km2, around 16% of which is covered by glacier, providing an important water source for livelihoods in the downstream capital city Bishkek and agricultural irrigation. Evolutions of glacier thickness and area were simulated by a Δh-parameterization approach in the WASA model. Incremental change scenarios of temperature and precipitation were set up to force the model. The objectives are (1) to evaluate the sensitivities of runoff processes and glacier area to changes of temperature and precipitation in the study basin, and (2) to assess to what extents the changes of runoff and glacier area caused by temperature warming can be compensated by gains from precipitation increments. Results of the analysis are expected to provide ensemble estimation of hydrology change under potential future climate in the Central Asian glacierized head watersheds, showing lights on the responses of hydrological behaviors to change gradients of T and P and informing climate adaptation strategies for sustainable water resource management.
Study Area And Data
The Ala-Archa basin is located in the Northern Tienshan mountain, ~40 km south of the city Bishkek, capital of Kyrgyzstan (Figure 1). The basin elevation extends from 1,560 to 4,900 m above sea level (a.s.l.) with an average of around 3,200 m a.s.l. Glacier area in the basin was around 36 km2 in 1980s (Aizen et al., 1995), around 76% of which is located in the elevation range of 3,700 to 4,100 m a.s.l. (He et al., 2020). The long term mean annual precipitation and temperature measured in 1970–2000 on the Alplager station (Figure 1) were around 560 mm and 2.6°C, respectively (He et al., 2019). Mean annual runoff observed at the basin outlet in 2012–2017 was ~850 mm. Snow and glacier meltwater fed the river mainly in the melting season from March to September. Around 20% of the annual precipitation occurred in the form of snowfall in winter.
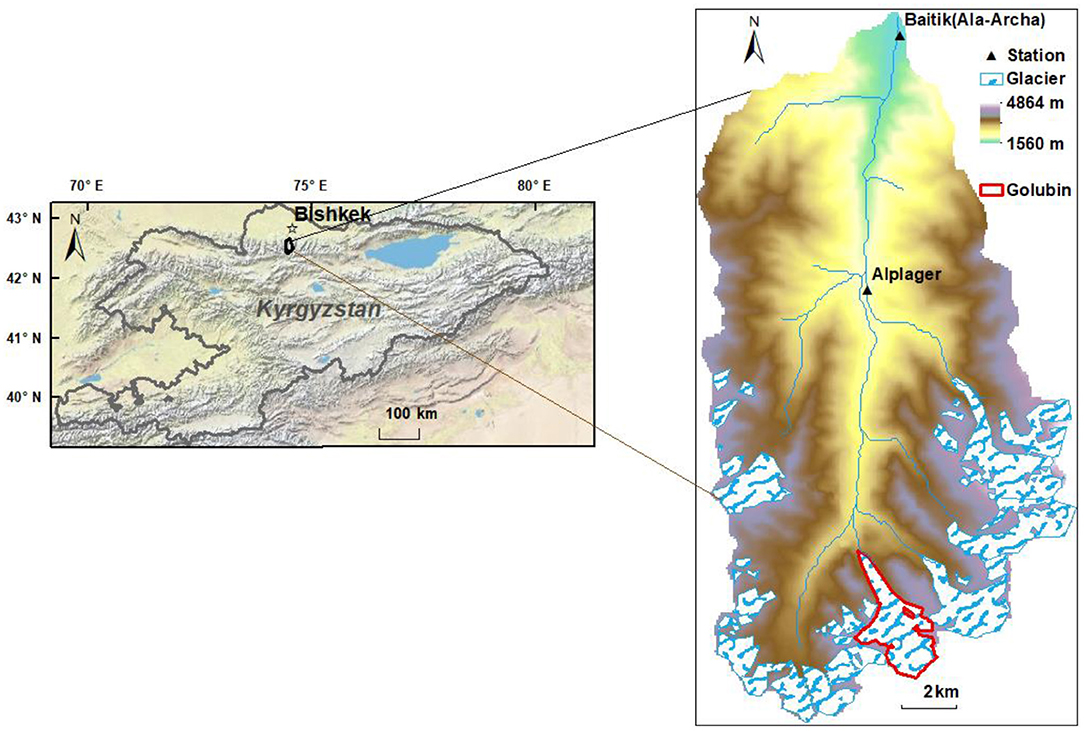
Figure 1. Location of the Ala-Archa glacierized basin in Kyrgyzstan (derived from the World Topographic Map by © ESR, similarly to He et al., 2018, 2019, 2020).
Daily meteorological variables of precipitation, air temperature, humidity, and solar radiation have been measured on the Baitik and Alplager stations (Figure 1) since 1970s, which are under the operation of Kyrgyz Hydromet Service. Monthly lapse rates of precipitation and temperature calculated from the measurements on the two stations were used to estimate spatial precipitation and temperature at different elevation bands. Mean daily streamflow at the basin outlet (named as Ala-Archa hydrologic station, Figure 1) has been recorded since 1960s. Distributions of glacier delineated from Landsat satellite images in 1970s were used to initialize the glacier area in the basin. Annual glacier mass balance of the Golubin glacier (Figure 1) which extends an area of around 6 km2 in the elevation bands ranging from 3,300 m to 4,400 m a.s.l. has been measured in summer field campaigns during 1973–1993 and 2011–2016. The Golubin glacier covers the full altitudinal range of glaciers in the basin. Previous study demonstrated that snow and ice melt on different glaciers with similar altitudes are rather similar in the Ala-Archa basin (Aizen et al., 1995), which allows using measurement from the single Golubin glacier to evaluate the model performance on simulating melt runoff from the entire glacier area. Daily satellite snow cover images from the Advanced Very High Resolution Radiometer (AVHRR) products with a spatial resolution of 1.1 km in the period of 1987–2001 were processed for the hydrological model calibration and evaluation (Dietz et al., 2014); whilst daily snow cover products with a finer resolution of 500 m from Moderate Resolution Imaging Spectroradiometer (MODIS) processed by a cloud-removal approach proposed in Gafurov et al. (2016) were used to evaluate the model performance in the period of 2002–2016.
Hydrological Modeling Approach
WASA Hydrological Model
The WASA (Model of Water Availability in Semi-Arid Environments) hydrological model was originally developed by Güntner and Bronstert (2004) for runoff simulations in semi-arid regions, and was subsequently extended by Duethmann et al. (2013, 2015) to represent snow and glacier melt runoff processes in the Central Asian glacierized basins. Spatial discretization of the model is based on terrain units characterized by specified soil properties, land cover, and elevation. The soil properties were extracted from a digitized map from the Kyrgyz At-las (Academy of Science of the KyrgyzSSR). Land covers were derived from the MODIS land cover product of MCD12Q1. A temperature threshold of 2.0°C was used in the model to separate rainfall and snowfall in the total precipitation. Two different degree-day factors were used to calculate snowmelt and ice melt runoff in a temperature-index approach (He et al., 2018). Snow cover area (SCA) in each terrain unit was calculated by a function of the fraction between the simulated snow water equivalent (SWE) and the assumed maximum SWE storage (He et al., 2018). Annual glacier mass balance (GMB) on each terrain unit was updated by the difference between snow accumulation and ice melt. A Δh-parameterization approach developed by Huss et al. (2010) was adopted to consider potential ice flow and the changes of glacier area and thickness. More details of the WASA hydrological model can be found in the Supplement File.
The model parameters were automatically calibrated by the ε-NSGAII algorithm using three different observations including streamflow measured at the basin outlet, satellite daily SCA in the melting period from March to August, and observed annual GMB of the Golubin glacier. More details of the model parameter calibration can be found in He et al. (2018). Metrics that were used to evaluate the model performance are listed in Equations 1–4.
where Sobs refer to the observations of streamflow, SCA or GMB, while Ssim are for the model simulations. n is the total daily SCA images that were used for the model calibration, and m stands for the number of annual GMB that was available for the model calibration. The model was calibrated by observations in the period of 1987–1993, and validated in the period of 1997–2016.
Sensitivities of Hydrological Processes to Climate Changes
Considering the large uncertainty of climate change projections from multiple climate models and emission scenarios, seven temperature (T) changes scenarios by linearly perturbing the observed time series of T in the reference period of 1997–2016 by up to 7°C were set up to represent the potential T warming in the study basin by the end of this century. Similarly, six precipitation change scenarios by linearly perturbing the observed time series of P in the reference period from 70 to 130% were used to reflect the potential future decreases and increases of annual P in the study basin. Sensitivities of hydrological processes to T or P changes were quantified by comparing the model simulations forced by the reference climate inputs and those driven by the T or P change scenarios. Compensation effects of the T and P changes on specific hydrological processes were investigated by forcing the model in the 20-year period (1997–2016) using combinations of each of the eight T input scenarios (one reference T input scenario and seven T change scenarios) with the seven P input scenarios (one reference P input scenario and six P change scenarios).
Hydrological variables that were involved in the investigation include annual runoff, runoff coefficient (the ratio between annual runoff and annual precipitation), glacier area, annual glacier mass balance, and contributions of rainfall, snowmelt and ice melt to runoff. The contributions of rainfall and meltwater were calculated using two definitions: definition one is based on the concepts of water inputs, in which the contributions were calculated as the proportions of rainfall, snowmelt and ice melt to the total water input; definition two is based on the different flow pathways, in which groundwater was subtracted from the total simulated runoff first, and contributions of rainfall and melt runoff refer to the contributions of direct surface runoff induced by net rainfall, snowmelt and ice melt. To calculate the net water sources generating surface runoff, the simulated actual evapotranspiration (ET) were subtracted from the simulated rainfall first. In cases that rainfall could not satisfy the simulated ET, the difference between ET and rainfall were subsequently subtracted from snowmelt and ice melt.
Results
Model Performance
The model showed high performance on simulating streamflow, SCA and GMB in the calibration period of 1987–1993 which has been presented in He et al. (2018). Hereby, model performance in the evaluation period of 1997 to 2016 are presented in Figure 2. The simulated runoff agreed well with observation in the modeling period (Figure 2A), indicated by the NSE and lnNSE values of 0.73 and 0.85, despite that summer peak flows in years such as 2010–2013 and 2015–2016 were underestimated. Simulated SCA in the melting months from March to August matched the satellite SCA in most of the years with a SE value of 0.83 (Figure 2B), while showed visible deviations from the satellite SCA in years of 2011–2015. Uncertainty of the satellite SCA should be one of the reasons for those deviations, when looking on the sharp increases of satellite SCA in the melting season. Beyond that, large uncertainty of the precipitation inputs which are often difficult to measure in high mountains, could cause the overestimations or underestimations of SCA. The model performed well on reproducing the glacier mass balance of Golubin in the evaluation period (Figure 2C), apart from the year of 2014. A largely negative mass balance of around −1.5 m were measured in this year, while the simulated loss of glacier mass was only around −0.8 m. The overestimation of GMB should be attributed to the overestimated precipitation forcing. Despite the overestimated GMB in 2014, the modeled GMB aligned well with observations in years of 2011, 2012, and 2016. In general, the model produced acceptable performance on simultaneously simulating streamflow, SCA and GMB in the evaluation period, informing as an effective tool to investigate the sensitivities of hydrological processes to climate changes.
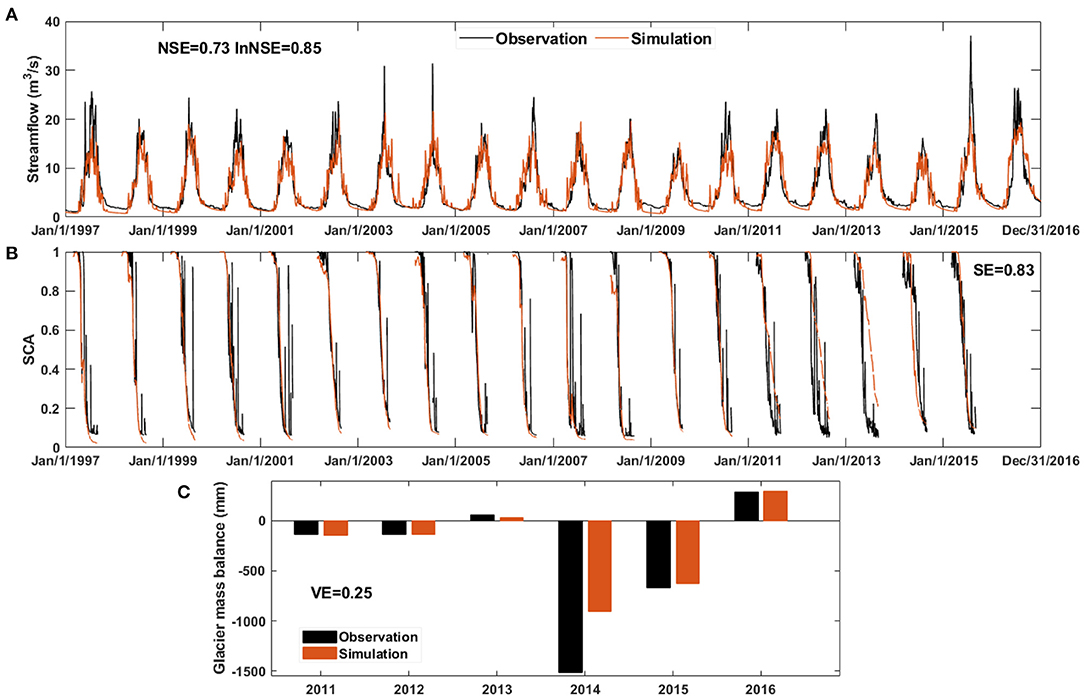
Figure 2. Model performance for the simulations of streamflow (A), snow cover area (B), and annual glacier mass balance (C) in the evaluation period of 1997–2016.
Sensitivities to Temperature Changes
Table 1 and Figure 3 compare the sensitivities of hydrological variables to temperature warming. Annual runoff (Figure 3a) and runoff coefficient (Figure 3c) showed linearly increases with T warming at rates of around 76 mm/+1°C and 8.6%/+1°C, respectively. In contrast, glacier area and mass balance declined with T warming at rates of −0.47 km2/+1°C and −495 mm/+1°C, respectively. The annual glacier mass balance responded near linearly to T warming (Figure 3d), while reduction of glacier area caused by 1°C warming tended to be smaller when T is higher (Figure 3b). Boxplots represent the inter-annual variabilities of the hydrological variables in the 20-year modeling period. It is noted that the inter-annual variabilities of annual runoff and runoff coefficient increased with T warming, which could be explained by that the higher T resulted in more glacier melt water in the later years of the modeling period. On contrary, the glacier mass balance showed reduced inter-annual variability with higher T (Figure 3d), because glacier mass balance is more dominated by T than by annual precipitation when T is higher. The increased inter-annual variability of glacier area should be attributed to the accumulated retreat in the modeling period caused by the negative glacier mass balance.
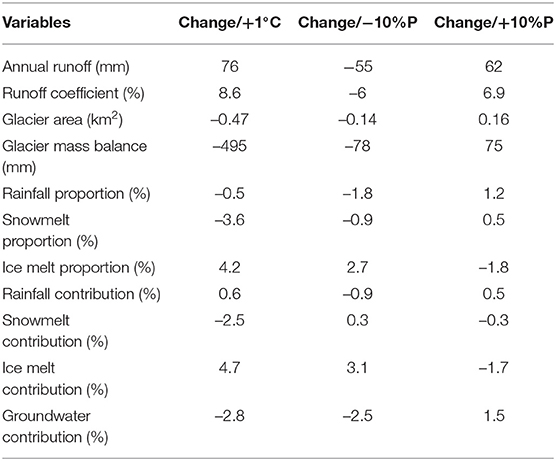
Table 1. Sensitivities of hydrological variables to precipitation and temperature changes.
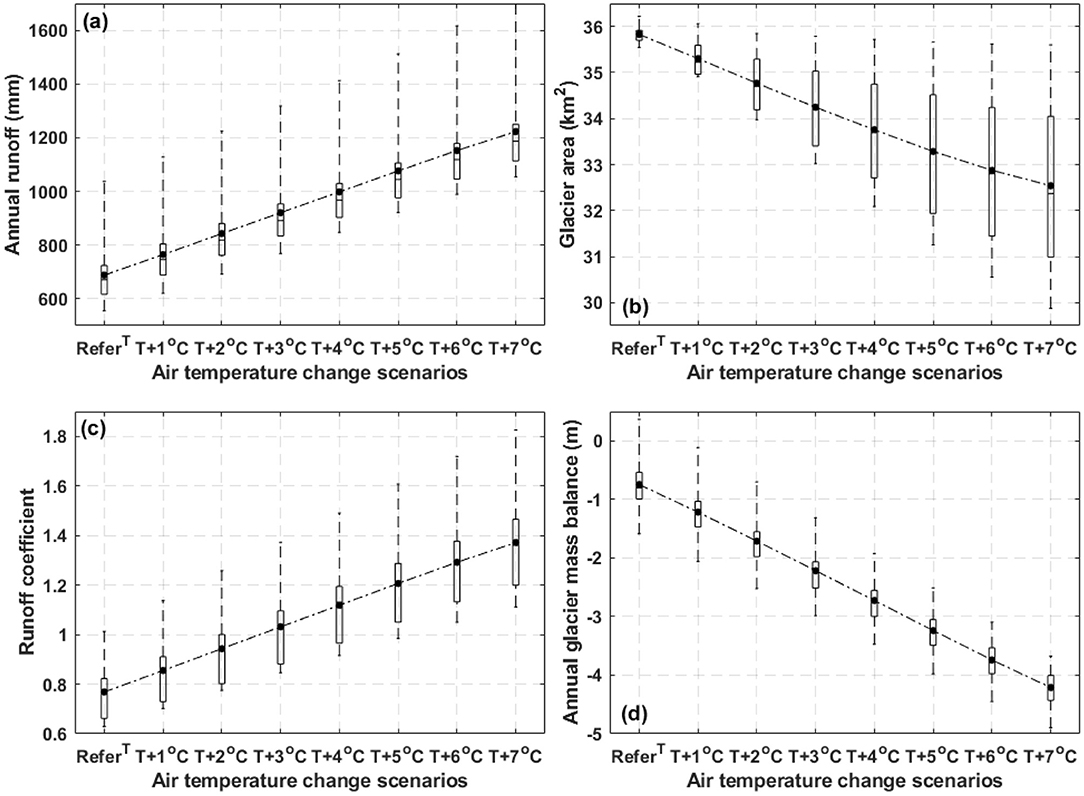
Figure 3. Sensitivities of hydrological variables to temperature warming. Boxplots indicate the inter-annual variabilities of hydrological variables during the 20-year modeling period, and dots indicate mean values during the modeling period. (a) for the sensitivity of annual runoff, (b) for glacier area, (c) for runoff coefficient, and (d) for annual glacier mass balance.
Figure 4a presents the monthly runoff forced by the reference climate input and two T warming scenarios. It is shown that runoff in the months of April to October were considerably increased by the 1°C warming scenario; the increases were additionally visible on runoff in March and November when forced by the 6°C warming scenario. Runoff in winter from December to February (DJF) were less sensitive to T warming, as ice melt from glacier in this season is relatively small. Figures 4b–d compare the monthly proportions of water sources in the total input driven by the three T input scenarios. In terms of the mean values, the rainfall proportions in April and May increased with T warming because of the largely reduced proportions of snowmelt. Rainfall proportions in the summer to winter months tended to decrease with T warming, while snowmelt proportions in winter months was increased by T warming because of the enhanced snowmelt. Reductions of rainfall and snowmelt proportions in months from June to November should be attributed to the strongly enhanced ice melt proportions by T warming. It is worth noting that the ice melt period in the 1°C warming scenario was advanced by 1 month from May to April in comparison to the reference scenario; whilst ice melt occurred in 12 months throughout the water year in the 6°C warming scenario. When looking on the boxplots, T warming enhanced the inter-annual variability of ice melt proportions in winter and spring months but reduced the inter-annual variabilities of rainfall and snowmelt proportions in almost every month, which should be caused by the increased ice meltwater in higher T input scenarios.
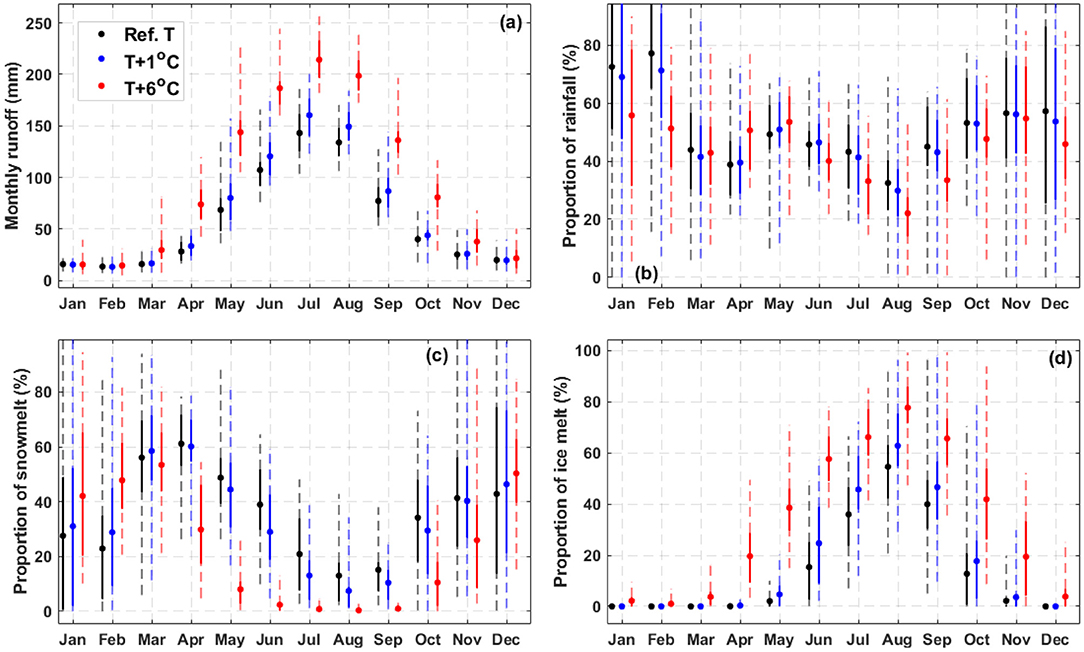
Figure 4. Responses of monthly runoff and proportions of water inputs to the temperature warming. Boxplots indicate the inter-annual variabilities during the 20-year modeling period, and dots indicate mean values during the modeling period. (a) for the comparisons of monthly runoff simulations, (b–d) for proportions of rainfall, snowmelt and ice melt in the total water input.
The sensitivities of annual water proportions and runoff components' contributions to T warming are compared in Figure 5. As expected, the annual proportions of rainfall and snowmelt decreased with T warming, while proportion of ice melt increased (Figure 5a). The proportions of snowmelt and ice melt presented reduced sensitivities to T increments when T is higher, but the opposite holds true for rainfall proportion. In the present reference period, the annual proportions of rainfall, snowmelt and ice melt in the total water input are around 45, 36, and 19%, respectively; whilst their proportions will be 42, 10, and 48% in the 7°C warming scenario. Change rates of the rainfall, snowmelt and ice melt proportions to T warming were −0.5%/+1°C, −3.6%/+1°C, and 4.2%/+1°C, respectively. When calculating the contributions of runoff components to total runoff based on flow pathways of groundwater and direct surface runoff, the contribution of rainfall induced surface runoff increased at a rate of around 0.6%/+1°C, because of the reduced contributions of snowmelt and groundwater. Change rates of the groundwater contribution and contributions of snowmelt and ice melt induced surface runoff were −2.8%/+1°C, −2.5%/+1°C, and 4.7%/+1°C, respectively. The decrease of groundwater contribution should be partly caused by the enhanced evapotranspiration of subsurface water. In the present reference period, contributions of surface runoff triggered by rainfall, snowmelt and ice melt, and groundwater are around 25, 27, 15, and 33%, respectively; whilst contributions of the four runoff components forced by the 7°C warming scenario will be around 28, 10, 49, 13%, respectively.
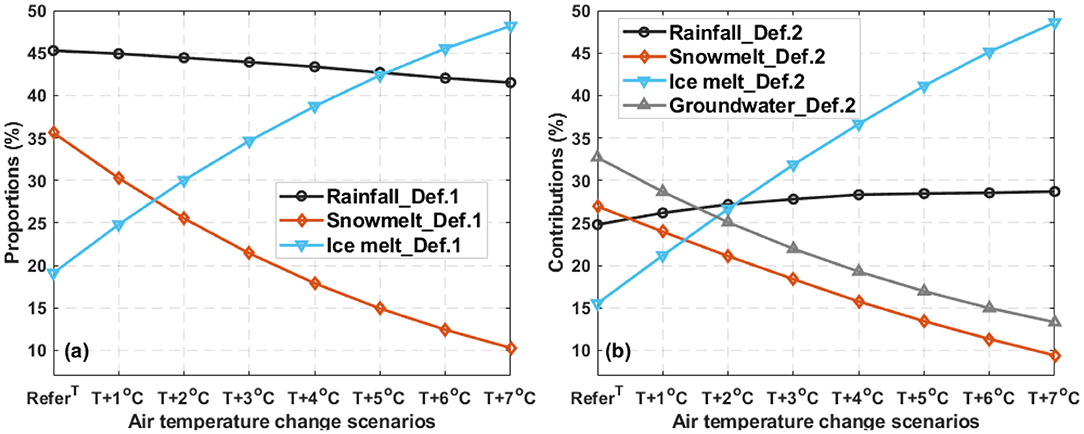
Figure 5. Changes of annual proportions of water inputs and contributions of runoff components, in response to temperature warming. “Def. 1” is for the definition of water input source, and “Def. 2” refers to the definition of runoff components based on flow pathway. Dots indicate mean values during the 20-year modeling period.
Sensitivities to Precipitation Changes
Figure 6 compares the sensitivities of hydrological variables to precipitation (P) changes. We can see increases of the four variables of annual runoff, runoff coefficient, glacier area and glacier mass balance with the increases of annual P. In terms of the mean values in the 20-year modeling period, increase of the four variables forced by 10% increment of P were around 62 mm, 6.9%, 0.16 km2 and 75 mm, respectively; while the decreases caused by 10% reduction of P were around −55 mm, −6%, −0.14 km2, and −78 mm, respectively. The increased P enhanced the inter-annual variability of annual runoff (Figure 6a), partly due to the enhanced inter-annual variabilities of P inputs in higher P scenarios. On converse, the inter-annual variability of glacier area increased with the reduced P (Figure 6b), because of the increased ice melt in lower P input scenarios. Inter-annual variabilities of runoff coefficient and glacier mass balance showed relatively smaller responses to P changes (Figures 6c,d).
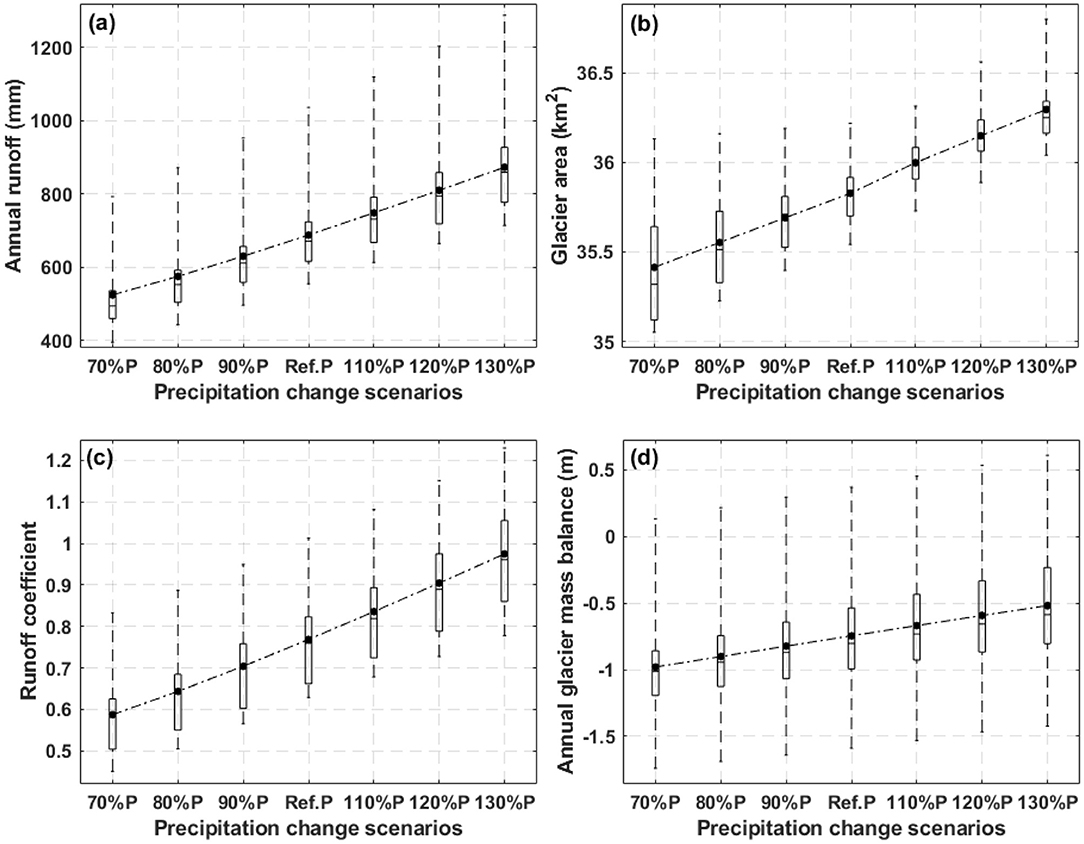
Figure 6. Sensitivities of hydrological variables to precipitation changes. Boxplots indicate the inter-annual variabilities of hydrological variables during the 20-year modeling period, and dots indicate mean values during the modeling period. (a) for the sensitivity of annual runoff, (b) for glacier area, (c) for runoff coefficient, and (d) for annual glacier mass balance.
Results in Figure 7a indicate increased monthly runoff throughout the year caused by P increases and enhanced inter-annual variabilities of runoff in the relatively cold months of September–December and January–April. Rainfall proportion in the total water input was enhanced by P increases in all the months (Figure 7b), while snowmelt proportions in October-April were reduced because of the delayed snowmelt from snowpack (Figure 7c). Both rainfall and snowmelt proportions in June-September were enhanced in the higher P input scenarios, due to reduced ice melt in this season. The reduced ice melt could be attributed to more snow accumulation on glaciers in the melting season (Figure 7d) brought from larger P inputs. It is noteworthy that the changes of P had small effects on the duration of ice melting; in all the three P input scenarios, ice melt started in May and stopped in November.
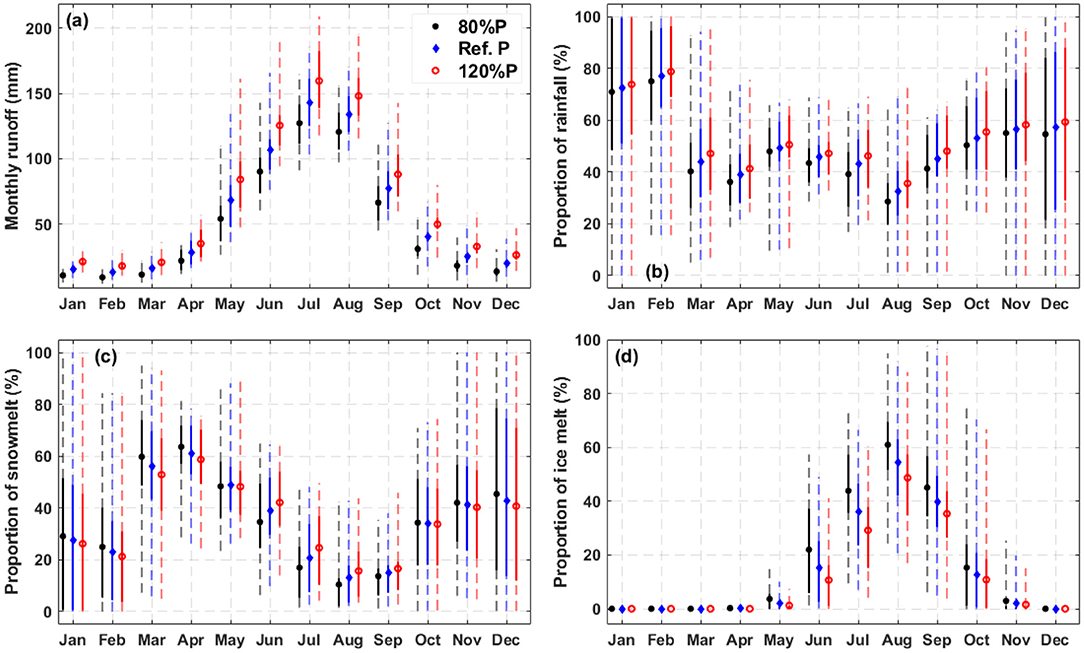
Figure 7. Responses of monthly runoff and proportions of water inputs to precipitation changes. Boxplots indicate the inter-annual variabilities during the 20-year modeling period, and dots indicate mean values during the modeling period. (a) for the comparisons of monthly runoff simulations, (b–d) for proportions of rainfall, snowmelt and ice melt in the total water input.
Figure 8 and Table 1 show the responses of mean annual water source proportions and contributions of runoff components to P changes. The proportions of rainfall and snowmelt increased with rising P at the rates of 1.2%/+10%P and 0.5%/+10%P, respectively; whilst proportion of ice meltwater decreased at a rate of −1.8%/+10%P (Figure 8a). In contrast, proportions of rainfall and snowmelt that were forced by a 10% reduction of annual P declined by −1.8 and −0.9%, respectively. Ice melt proportion increased more rapidly with reduced P than its response to increased P, indicated by a rate of 2.7%/−10%P. In the scenario that annual P is 30% higher (lower) than the reference observation, the mean annual proportions of rainfall, snowmelt and ice melt in the total water input were around 49% (40%), 37% (33%), and 14% (27%), respectively.
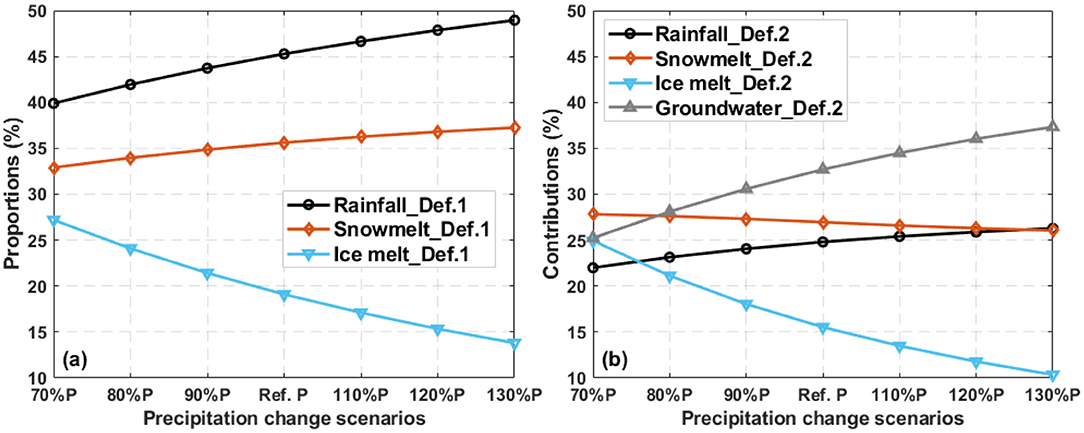
Figure 8. Changes of mean annual proportions of water inputs and contributions of runoff components, in response to precipitation changes. “Def. 1” is for the definition of water input, and “Def. 2” refers to the definition of runoff components based on flow pathway. Dots indicate mean values during the 20-year modeling period.
As expected, the contributions of rainfall induced surface runoff and groundwater increased with raised P; whilst contributions of snowmelt and ice melt induced surface runoff declined with the enhanced P input. The reduced contribution of snowmelt induced surface runoff could be attributed to the offset by increased groundwater contribution originating from the enhanced infiltration of surface water by higher P input; the reduced contribution of ice melt runoff was caused by the decreased ice melt volume due to more snow accumulation on the glacier surface. The increasing rates of rainfall runoff and groundwater contributions in response to increased P were around 0.5%/+10%P and 1.5%/+10%P (Table 1); whist the declining rates of snowmelt and ice melt runoff contributions were around −0.3%/+10%P and −1.7%/+10%P. In scenarios that annual P is smaller than the reference observation, the contributions of rainfall runoff and groundwater declined at rates of −0.9%/−10%P and −2.5%/−10%P. On contrary, the contributions of snowmelt and ice melt responded to decreased P at rates of 0.3%/−10%P and 3.1%/−10%P, respectively. In scenario that annual P decreased (increased) by 30%, contributions of surface runoff induced by rainfall, snowmelt and ice melt, and groundwater were around 23% (26%), 27% (26%), 25% (11%), and 25% (37%), respectively.
Compensation Effects of Temperature and Precipitation Changes
Some of the hydrological variables showed contrasting responses to increases of Temperature and precipitation. It is thus interesting to know to what extents the effects of T warming can be compensated by the effects of P changes. Figure 9a indicates that annual runoff increase caused by 1°C warming could be offset by the decrease forced by around 12% decrease of annual P. Meanwhile, the combined effects of 20% increase of annual P and 6°C T warming resulted in 90% increase of annual runoff. Annul runoff reduction caused by the maximum decrease (−30%) of P can be compensated by the enhanced ice melt runoff forced by around T warming of 2.1°C. There are small compensate effects of the T and P changes for runoff coefficient (Figure 9b). The combined input of 20% decrease of annual P and 6°C T warming enhanced runoff coefficient by around 90%. Glacier area increase benefited from the maximum increase (30%) of P could only compensate the area reduction caused by T warming of around 0.9°C (Figure 9c). The combined effects of 20% decrease of annual P and 6°C T warming led to a 8% decrease of glacier area. Similarly, the maximum increase (30%) of P could only compensate the glacier mass balance reduction caused by T warming of around 0.5°C. The combined input of 20% decrease of annual P and 6°C T warming caused glacier mass balance reduction of around 3.1 m (Figure 9d).
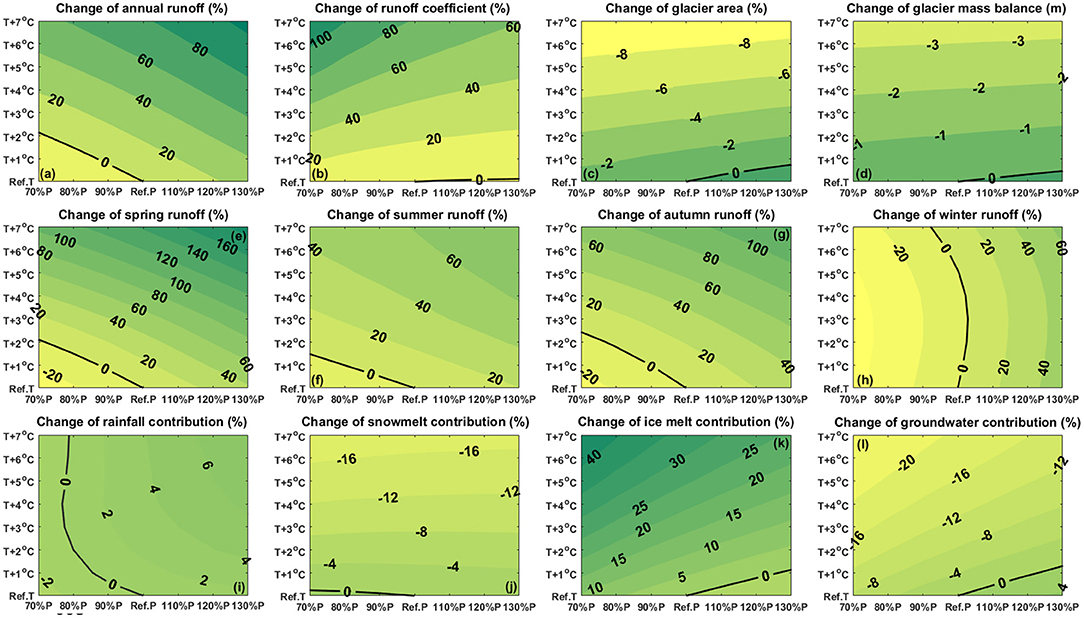
Figure 9. Compensation effects of temperature warming and precipitation changes on hydrological variables.
Decreases of runoff in the seasons of spring (March–May), summer (June–August), and autumn (September–November) caused by the maximum decrease (−30%) of annual P could be compensated by the increases forced by T warming scenarios of around 2, 1.5, and 2.3°C, respectively (Figures 9e–g). the combined input of 20% increase of reference P and T warming by 6°C resulted in increases of runoff in the three seasons by 150, 70, and 100%, respectively. Temperature warming had much smaller effects on winter (December–February) runoff than precipitation changes when T warming was lower than 5°C (Figure 9h). The combined input of 20% increase of reference P and T warming by 6°C resulted in 30% increases of winter runoff, while the combined input of 20% decrease of reference P and T warming of 6°C led to 30% reduction of winter runoff.
The combined effects of P and T changes on the contributions of surface runoff induced by rainfall, snowmelt and ice melt, and groundwater are presented in Figures 9i–l. It is noteworthy that the reduction of rainfall runoff contribution caused by P decreases of 30% cannot be compensated by the increase forced by the maximum T warming of 7°C (Figure 9i); whilst its reductions caused by P decreases ranging from 10 to 20% were compensated by the increases driven by T warming scenarios of 0.5 to 2°C. The combined input of P increase of 20% and T warming of 6°C raised the rainfall runoff contribution by around 6%. Decrease of snowmelt runoff contribution caused by the maximum P decrease of 30% can be easily compensated by increase originated from T warming of around 0.2°C (Figure 9j). The combined input of increased P by 20% and T warming of 6°C reduced the snowmelt runoff contribution by around 16%. Increase of ice melt runoff contribution caused by 1°C warming can be compensated by the effect of P increase of around 29% (Figure 9k). The combined effects of P decreased by 20% and T warming of 6°C enhanced the ice melt runoff contribution by around 38%. On converse, the combined effects of P decreased by 20% and T warming of 6°C resulted in decrease of groundwater contribution of around 22% (Figure 9l). The reduction of groundwater contribution caused by 1°C warming can be compensated by the increase benefited from P increase of around 25%.
Discussions
Uncertainty of Hydrological Modeling
Glacio-hydrological models additionally integrated the simulations of snow/ice melt runoff and the evolution of glacier area into the estimation of rainfall-runoff process, thus resulting in a large parameter space. Uncertainty of parameter calibration is one of the major sources of the hydrological modeling uncertainty in glacierized basins (van Tiel et al., 2020). A lot of efforts have been put to improve the parameter calibration in glacierized basins, including exploring the values of multiple hydrograph signatures on constraining model parameters (Hingray et al., 2010), using multiple-objective functions to improve the identifiability of model parameters (Tarasova et al., 2016), and adopting multiple observation data to reduce the calibration uncertainty (Finger et al., 2015). It is widely accepted that including snow and glacier cover data in the parameter calibration procedure helped to reduce the parameter uncertainty in glacierized basins (e.g., Naz et al., 2014; Frans et al., 2015; Valentin et al., 2018; Mimeau et al., 2019). Figure 10 compares uncertainties of the model performance and the simulations of glacier mass balance used 100 best parameter sets calibrated by streamflow observation solely (abbreviated as Q-calibration) and a combination of observations of streamflow, satellite SCA and GMB (abbreviated as QSM-calibration) in the study basin. The average of NSE and lnNSE (avNSE) of streamflow simulation forced by parameter sets of the QSM-calibration ranged from 0.78 to 0.8, while the avNSE values simulated by parameter sets of the Q-calibration ranged from 0.77 to 0.81. Meanwhile, parameter sets of the Q-calibration produced lower performance for simulation of SCA and GMB (Figures 10b,c). Metric objectives of SE and VE simulated by parameter sets of the QSM-calibration fell in small value ranges of 0.830–0.835 and 0.25–0.36, respectively. Similarly, uncertainties of the proportions of water sources and glacier mass balance simulated by parameter sets of the Q-calibration were much larger than those simulated by parameter sets of the QSM-calibration. Uncertainty range (difference between the maximum and minimum) of the mean annual glacier mass balance simulated by parameter sets of the QSM-calibration was smaller than 100 mm (Figure 10d). Uncertainty ranges of the proportions of rainfall, snowmelt and ice melt simulated by the QSM-calibration approach were only around 0.5, 1, and 1%, respectively. These results deliver good confidence that uncertainty of hydrological modeling originated from parameter calibration is acceptably small when using the QSM-calibration approach. However, obtaining accurate climate inputs in high mountains for hydrological modeling is a big challenge (Duethmann et al., 2013), especially for the spatial precipitation input. Strong spatial variability of precipitation and temperature have been found in the Ala-Archa basin (He et al., 2018, 2020). Although monthly lapse rates of precipitation and temperature derived from two meteorological stations located at the elevation bands of 1,580 and 2,100 m a.s.l. have been used to estimate spatial climate inputs, there are still large uncertainty in the forcing data which resulted in low model performance on simulating summer peak flows, SCA and GMB in some years during the modeling period (Figure 2).
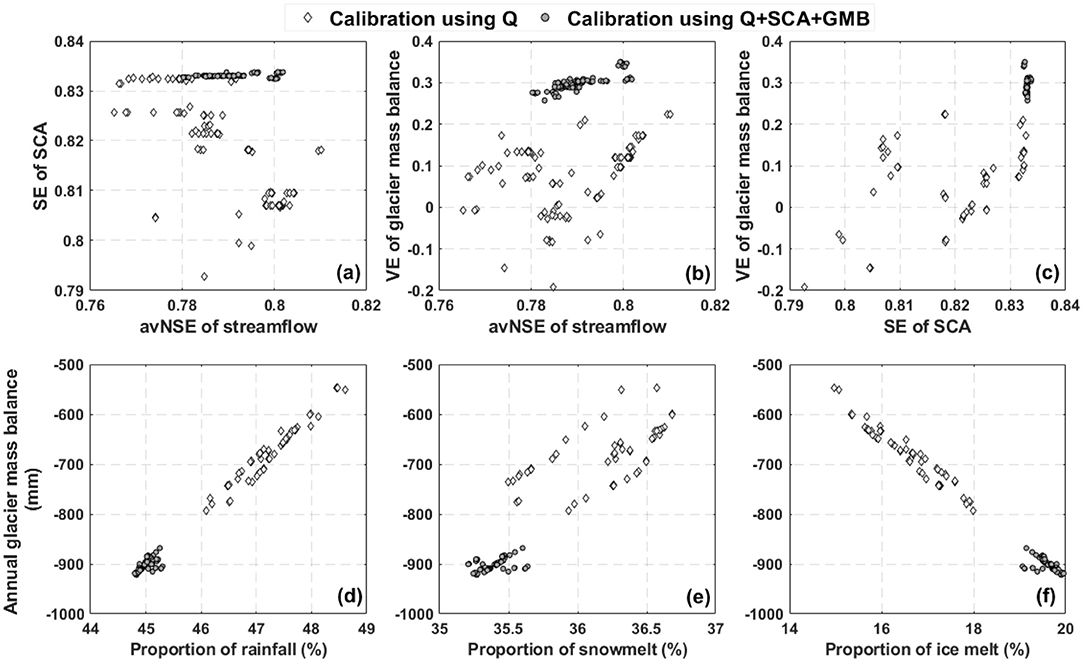
Figure 10. Uncertainties of the model performance (a–c), and the simulations of water input sources and glacier mass balance (d–f).
Limitations
Precipitation and temperature change scenarios were set up by perturbing the reference observations in a 20-year period from 1997 to 2016, assuming inter-annual variabilities of precipitation and temperature in the future 20-year periods are similar. That means climate changes within the 20-year period was not considered in the hydrological modeling experiment. Moreover, gradual changes of glacier area caused by temperature warming from 1 to 7°C (or precipitation changes from 70 to 130% of reference P) were not considered. All climate change scenarios runs started from the same glacier coverage, focusing on the quantification of hydrological sensitivities to climate changes. Using the same initial glacier coverage was to avoid the effects of glacier cover changes on hydrological response to climate changes. Moreover, land cover changes in response to changes of P and T were not taken into account in the model experiments. Values of model parameters delineating the soil and land cover attributes were fixed in the varied P and T input scenarios. The Ala-Archa basin is a high altitude head watershed, in which deep valleys are prevailing and hillslopes are dominated by rock with thin soil cover (see details in the Supplement File). Grass and shrubs are the main land cover types in the non-glacierized areas, which respond slowly to climate changes. Relatively, changes of glacier and snow coverage are the major land cover changes under changing climate in the study basin. It is therefore reasonable to assume that fixed model parameters for soil have small effects on the analysis. Results of the hydrological variables sensitivities to climate changes were estimated based on the time scale of 20-years. Cautions must be taken when transferring the findings of hydrological sensitivities to a longer or shorter time scale. The most recently 20-year period was used as the reference period to represent the benchmark current climate, which ends in 2016 because the station measurements of meteorological data are unavailable after 2016. The length of 20-years (including dry years and wet years, see the Supplement File) was chosen to avoid the systematic bias caused by extremely dry and wet years. Meanwhile, changes of land covers of grassland and shrub land in the study basin are likely small in a period duration of 20-years, making it reasonable to use the same land coverages of grassland, shrub land and bare soil throughout the modeling period.
Conclusions
This study used the WASA glacio-hydrological model to simulate the runoff generation processes and the evolution of glacier area in the Ala-Archa basin in Central Asia. Model parameters were calibrated using observations of streamflow, satellite snow cover area (SCA) and annual glacier mass balance (GMB) of the Golubin glacier. Good model performance on simultaneously simulating streamflow, SCA and GMB indicated high confidence for using the model as a tool to investigate the sensitivities of hydrological processes to climate changes in the study basin. Seven temperature change scenarios and six precipitation change scenarios which were set up by incrementally perturbing the observed climate in the reference period of 1997–2016 up to the potential change ranges derived from ensemble outputs of climate models were used to force the model. The main findings are summarized as follows.
Annual runoff increased with the rising temperature (T) and precipitation (P) at rates of 76 mm/+1°C and 62 mm/+10%P, respectively. Glacier area and mass balance were more sensitive to T changes than to P changes. Total glacier area in the basin decreased with T warming at a rate of −0.47 km2/+1°C, whilst increasing with rising P at a rate of 0.16 km2/+10%P. Annual glacier mass balance in the basin increased with rising P at a rate of 75 mm/+10%P, while decreasing rapidly with T warming at a rate of −495 mm/+1°C.
The basin runoff switched from rainfall and groundwater-dominated to ice melt-dominated with warming T, while the dominance of rainfall and groundwater were strongly enhanced by rising P. Proportions of rainfall and snowmelt in the total water input for runoff generation decreased with T warming at rates of −0.5%/+1°C and −3.6%/+1°C, but increased with P increases at rates of 1.2%/+10% P and 0.5%/+10% P, respectively. Ice melt proportion changed with T and P increases at rates of 4.2%/+1°C and −1.8%/+10% P, respectively. Contributions of surface runoff induced by rainfall and ice melt to the total runoff increased with T warming at rates of 0.6%/+1°C and 4.7%/+1°C, while ice melt runoff contribution decreased with rising P at rate of −1.7%/+10%P. Groundwater contribution decreased by −2.8% with 1°C warming, but increased by 1.5% with P increase of 10%.
The maximum P changes (±30%) could only compensate the effects of T warming of 0.5°C to 2.5°C. Decreases of glacier area and mass balance caused by 1°C warming cannot be compensated by the maximum P increase of 30%. Increases of annual and season runoff forced by T warming lower than 2.5°C can be compensated by the decreases caused by the maximum P decrease of −30%. Increase (decrease) of the ice melt runoff (groundwater) contribution to total runoff caused by T warming of 1°C can be compensated by the decrease (increase) forced by P increase of around 29% (25%). The combined input of 20% increase of P and T warming of 6°C resulted in 90% increase of annual runoff, and 8% reduction of glacier area.
Small glacierized basins in Central Asia, such as Ala-Archa, provide important water source for downstream irrigation and livelihoods. However, projecting future hydrology changes in these basins is of big challenging, because of the large uncertainties of RCM and GCM outputs on small spatial scales. Results of this work provided ensemble estimation of hydrology change under potential future climate in the study basin to reveal the responses of hydrological behaviors to change gradients of T and P, and informed climate adaptation strategies for sustainable water resource management in Central Asian glacierized head watersheds.
Data Availability Statement
The datasets presented in this study can be found in online repositories. The names of the repository/repositories and accession number(s) can be found at: http://doi.org/10.5281/zenodo.4624443.
Author Contributions
ZH conceptualized this research and contributed to writing the paper.
Funding
This work was supported by the GlaSCA (grant 01DK15002A) and GlaSCA-V (grant 88 501) projects funded by the German Federal Ministry for Science and Education (BMBF) and Volkswagen Foundation, respectively. The data analysis and manuscript writing were supported by the Canada First Research Excellence Fund's Global Water Futures program.
Conflict of Interest
The author declares that the research was conducted in the absence of any commercial or financial relationships that could be construed as a potential conflict of interest.
Acknowledgments
The author gratefully acknowledge all the researchers who have helped to set up the WASA hydrological model in the study basin, including Dr. Sergiy Vorogushyn, Dr. Doris Duethmann, Dr. Andreas Güntner and Dr. Bruno Merz, and researchers that contributed to data collection in the Ala-Archa basin, including Katy Unger-Shayesteh, Dr. Abror Gafurov, Olga Kalashnikova, and Martina Barandun.
Supplementary Material
The Supplementary Material for this article can be found online at: https://doi.org/10.6084/m9.figshare.14470995.v1
References
Aizen, V., Aizen, E., and Melack, J. (1995). Characteristics of runoff formation at the Kirgizskiy Alatoo, characteristics of runoff formation at the Kirgizskiy Alatoo, Tien Shan. IAHS Publ. 228, 413–430.
Aygün, O., Kinnard, C., Campeau, S., and Krogh, S. A. (2020). Shifting hydrological processes in a Canadian agroforested catchment due to a warmer and wetter climate. Water 12:739. doi: 10.3390/w12030739
Chen, H., Chen, Y., Li, W., and Li, Z. (2019). Quantifying the contributions of snow/glacier meltwater to river runoff in the Tianshan Mountains, Central Asia. Glob. Planet. Change 174, 47–57. doi: 10.1016/j.gloplacha.2019.01.002
Chen, Y., Li, W., Fang, G., and Li, Z. (2017). Review article: hydrological modeling in glacierized catchments of central Asia-status and challenges. Hydrol. Earth Syst. Sci. 21, 669–684. doi: 10.5194/hess-21-669-2017
Dietz, A. J., Conrad, C., Kuenzer, C., Gesell, G., and Dech, S. (2014). Identifying changing snow cover characteristics in Central Asia between 1986 and 2014 from Remote Sensing Data. Remote Sens. 6, 12752–12775. doi: 10.3390/rs61212752
Duethmann, D., Bolch, T., Farinotti, D., Kriegel, D., Vorogushyn, S., Merz, B., et al. (2015). Attribution of streamflow trends in snow and glacier melt-dominated catchments of the Tarim River, Central Asia. Water Resour. Res. 51, 4727–4750. doi: 10.1002/2014WR016716
Duethmann, D., Menz, C., Jiang, T., and Vorogushyn, S. (2016). Projections for headwater catchments of the Tarim River reveal glacier retreat and decreasing surface water availability but uncertainties are large. Environ. Res. Lett. 11:054024. doi: 10.1088/1748-9326/11/5/054024
Duethmann, D., Zimmer, J., Gafurov, A., Güntner, A., Kriegel, D., Merz, B., et al. (2013). Evaluation of areal precipitation estimates based on downscaled reanalysis and station data by hydrological modelling. Hydrol. Earth Syst. Sci. 17, 2415–2434. doi: 10.5194/hess-17-2415-2013
Fang, G., Yang, J., Chen, Y., Zhang, S., Deng, H., Liu, H., et al. (2015b). Climate change impact on the hydrology of a typical watershed in the Tianshan Mountains. Adv. Meteorol. 2015, 1–10. doi: 10.1155/2015/960471
Fang, G. H., Yang, J., Chen, Y. N., and Zammit, C. (2015a). Comparing bias correction methods in downscaling meteorological variables for a hydrologic impact study in an arid area in China. Hydrol. Earth Syst. Sci. 19, 2547–2559. doi: 10.5194/hess-19-2547-2015
Finger, D., Vis, M., Huss, M., and Seibert, J. (2015). The value of multiple data set calibration versus model complexity for improving the performance of hydrological models in mountain catchments. Water Resour. Res. 51, 1939–1958. doi: 10.1002/2014WR015712
Frans, C., Istanbulluoglu, E., Lettenmaier, D. P., Naz, B., Clarke, G., Condom, T., et al. (2015). Predicting glacio-hydrologic change in the headwaters of the Zongo River, Cordillera Real, Bolivia. Water Resour. Res. 51, 9029–9052. doi: 10.1002/2014WR016728
Gafurov, A., Lüdtke, S., Unger-Shayesteh, K., Vorogushyn, S., Scheone, T., Schmidt, S., et al. (2016). MODSNOW-Tool: an operational tool for daily snow cover monitoring using MODIS data. Environ. Earth Sci. 75:1078. doi: 10.1007/s12665-016-5869-x
Gan, R., Luo, Y., Zuo, Q., and Sun, L. (2015). Effects of projected climate change on the glacier and runoff generation in the Naryn River Basin, Central Asia. J. Hydrol. 523, 240–251. doi: 10.1016/j.jhydrol.2015.01.057
Güntner, A., and Bronstert, A. (2004). Representation of landscape variability and lateral redistribution processes for large-scale hydrological modelling in semi-arid areas. J. Hydrol. 297, 136–161. doi: 10.1016/j.jhydrol.2004.04.008
He, Z., Unger-Shayesteh, K., Vorogushyn, S., Weise, S., Duethmann, D., Kalashnikova, O., et al. (2020). Comparing Bayesian and traditional end-member mixing approaches for hydrograph separation in a glacierized basin. Hydrol. Earth Syst. Sci. 24, 3289–3309. doi: 10.5194/hess-24-3289-2020
He, Z., Unger-Shayesteh, K., Vorogushyn, S., Weise, S. M., Kalashnikova, O., Gafurov, A., et al. (2019). Constraining hydrological model parameters using water isotopic compositions in a glacierized basin, Central Asia. J. Hydrol. 571, 332–348. doi: 10.1016/j.jhydrol.2019.01.048
He, Z., Vorogushyn, S., Unger-Shayesteh, K., Gafurov, A., Kalashnikova, O., Omorova, E., et al. (2018). The value of hydrograph partitioning curves for calibrating hydrological models in Glacierized Basins. Water Resour. Res. 54, 2336–2361. doi: 10.1002/2017WR021966
Hingray, B., Schaefli, B., Mezghani, A., and Hamdi, Y. (2010). Signature-based model calibration for hydrological prediction in mesoscale alpine catchments. Hydrol. Sci. J. 55, 1002–1016. doi: 10.1080/02626667.2010.505572
Huang, A., Zhou, Y., Zhang, Y., Huang, D., Zhao, Y., and Wu, H. (2014). Changes of the annual precipitation over central Asia in the twenty-first century projected by multimodels of CMIP5. J. Clim. 27, 6627–6646. doi: 10.1175/JCLI-D-14-00070.1
Huss, M., Jouvet, G., Farinotti, D., and Bauder, A. (2010). Future high-mountain hydrology: a new parameterization of glacier retreat. Hydrol. Earth Syst. Sci. 14, 815–829. doi: 10.5194/hess-14-815-2010
Huss, M., Zemp, M., Joerg, P. C., and Salzmann, N. (2014). High uncertainty in 21st century runoff projections from glacierized basins. J. Hydrol. 510, 35–48. doi: 10.1016/j.jhydrol.2013.12.017
Ismail, M. F., Naz, B. S., Wortmann, M., Disse, M., Bowling, L. C., and Bogacki, W. (2020). Comparison of two model calibration approaches and their influence on future projections under climate change in the Upper Indus Basin. Clim. Change 163, 1227–1246. doi: 10.1007/s10584-020-02902-3
Jiang, J., Zhou, T., Chen, X., and Zhang, L. (2020). Future changes in precipitation over Central Asia based on CMIP6 projections. Environ. Res. Lett. 15:054009. doi: 10.1088/1748-9326/ab7d03
Li, L., Shen, M., Hou, Y., Xu, C. Y., Lutz, A. F., Chen, J., et al. (2019). Twenty-first-century glacio-hydrological changes in the Himalayan headwater Beas River basin. Hydrol. Earth Syst. Sci. 23, 1483–1503. doi: 10.5194/hess-23-1483-2019
Liu, T., Willems, P., Pan, X. L., Bao, A. M., Chen, X., Veroustraete, F., et al. (2011). Climate change impact on water resource extremes in a headwater region of the Tarim basin in China. Hydrol. Earth Syst. Sci. 15, 3511–3527. doi: 10.5194/hess-15-3511-2011
Luo, Y., Wang, X., Piao, S., Sun, L., Ciais, P., Zhang, Y., et al. (2018). Contrasting streamflow regimes induced by melting glaciers across the Tien Shan – Pamir – North Karakoram. Sci. Rep. 8, 2–10. doi: 10.1038/s41598-018-34829-2
Lutz, A., Droogers, P., and Immerzeel, W. (2012). Climate Change Impact and Adaptation on the Water Resources in the Amu Darya and Syr Darya River Basins. Technical Report, FutureWater. Available online at: http://www.futurewater.eu/wp-content/uploads/2013/01/CC_Downstream_Report_V51.pdf
Mimeau, L., Esteves, M., Zin, I., Jacobi, H., Brun, F., and Wagnon, P. (2019). Quantification of different flow components in a high-altitude glacierized catchment (Dudh Koshi, Himalaya): some cryospheric-related issues. Hydrol. Earth Syst. Sci. 23, 3969–3996. doi: 10.5194/hess-23-3969-2019
Naz, B. S., Frans, C. D., Clarke, G. K. C., Burns, P., and Lettenmaier, D. P. (2014). Modeling the effect of glacier recession on streamflow response using a coupled glacio-hydrological model. Hydrol. Earth Syst. Sci. 18, 787–802. doi: 10.5194/hess-18-787-2014
Nepal, S., Krause, P., Flügel, W., Fink, M., and Fischer, C. (2014). Understanding the hydrological system dynamics of a glaciated alpine catchment in the Himalayan region using the J2000 hydrological model. Hydrol. Process. 28, 1329–1344. doi: 10.1002/hyp.9627
Ozturk, T., Turp, M. T., Türkeş, M., and Kurnaz, M. L. (2017). Projected changes in temperature and precipitation climatology of Central Asia CORDEX Region 8 by using RegCM4.3.5. Atmos. Res. 183, 296–307. doi: 10.1016/j.atmosres.2016.09.008
Rasouli, K., Pomeroy, J. W., Janowicz, J. R., Carey, S. K., and Williams, T. J. (2014). Hydrological sensitivity of a northern mountain basin to climate change. Hydrol. Process. 28, 4191–4208. doi: 10.1002/hyp.10244
Rasouli, K., Pomeroy, J. W., and Marks, D. G. (2015). Snowpack sensitivity to perturbed climate in a cool mid-latitude mountain catchment. Hydrol. Process. 29, 3925–3940. doi: 10.1002/hyp.10587
Shahgedanova, M., Afzal, M., Severskiy, I., Usmanova, Z., Saidaliyeva, Z., and Kapitsa, V. (2018). Changes in the mountain river discharge in the northern Tien Shan since the mid-20th Century : results from the analysis of a homogeneous daily stream flow data set from seven catchments. J. Hydrol. 564, 1133–1152. doi: 10.1016/j.jhydrol.2018.08.001
Singh, P., and Kumar, N. (1997). Impact assessment of climate change on the hydrological response of a snow and glacier melt runoff dominated Himalayan river. J. Hydrol. 193, 316–350. doi: 10.1016/S0022-1694(96)03142-3
Sorg, A., Bolch, T., Stoffel, M., Solomina, O., and Beniston, M. (2012). Climate change impacts on glaciers and runoff in Tien Shan (Central Asia). Nat. Clim. Chang. 2, 725–731. doi: 10.1038/nclimate1592
Sorg, A., Huss, M., Rohrer, M., and Stoffel, M. (2014). The days of plenty might soon be over in glacierized Central Asian catchments. Environ. Res. Lett. 9:104018. doi: 10.1088/1748-9326/9/10/104018
Tarasova, K. M., Dietrich, J., and Merz, R. (2016). Effects of input discretization, model complexity, and calibration strategy on model performance in a data-scarce glacierized catchment in Central Asia. Water Resour. Res. 52, 4674–4699. doi: 10.1002/2015WR018551
Unger-Shayesteh, K., Vorogushyn, S., Farinotti, D., Gafurov, A., Duethmann, D., Mandychev, A., et al. (2013). What do we know about past changes in the water cycle of Central Asian headwaters? A review. Glob. Planet. Change 110, 4–25. doi: 10.1016/j.gloplacha.2013.02.004
Valentin, M. M., Viger, R. J., Van Beusekom, A. E., Hay, L. E., Hogue, T. S., and Foks, N. L. (2018). Enhancement of a Parsimonious water balance model to simulate surface hydrology in a glacierized watershed. J. Geophys. Res. Earth Surf. 123, 1116–1132. doi: 10.1029/2017JF004482
van Tiel, M., Stahl, K., Freudiger, D., and Seibert, J. (2020). Glaciohydrological model calibration and evaluation. WIREs Water. 7:e1483. doi: 10.1002/wat2.1483
Xu, B., Lu, Z., Liu, S., Li, J., Xie, J., Long, A., et al. (2015). Glacier changes and their impacts on the discharge in the past half-century in Tekes watershed, Central Asia. Phys. Chem. Earth 89–90, 96–103. doi: 10.1016/j.pce.2015.03.003
Keywords: glacierized basin, climate changes, runoff, glacier evolution, sensitivities
Citation: He Z (2021) Sensitivities of Hydrological Processes to Climate Changes in a Central Asian Glacierized Basin. Front. Water 3:683146. doi: 10.3389/frwa.2021.683146
Received: 19 March 2021; Accepted: 26 April 2021;
Published: 26 May 2021.
Edited by:
Dadiyorto Wendi, German Research Centre for Geosciences, Helmholtz Centre Potsdam, GermanyReviewed by:
Iulii Didovets, Potsdam Institute for Climate Impact Research (PIK), GermanyZe Jiang, University of New South Wales, Australia
Copyright © 2021 He. This is an open-access article distributed under the terms of the Creative Commons Attribution License (CC BY). The use, distribution or reproduction in other forums is permitted, provided the original author(s) and the copyright owner(s) are credited and that the original publication in this journal is cited, in accordance with accepted academic practice. No use, distribution or reproduction is permitted which does not comply with these terms.
*Correspondence: Zhihua He, emhoNjI0QG1haWwudXNhc2suY2E=