 Akhilesh S. Nair
 Nitish Kumar
 J. Indu
 B. Vivek
- 1Department of Civil Engineering, Indian Institute of Technology Bombay, Mumbai, India
- 2Interdisciplinary Programme in Climate Studies, Indian Institute of Technology Bombay, Mumbai, India
- 3Land and Water Management Research Group, Centre for Water Resources Development and Management (CWRDM), Kozhikode, India
Lakes are an essential component of biogeochemical processes, and variations in lake level are regarded as indicators of climate change. For more than a decade, satellite altimetry has successfully monitored variation in water levels over inland seas, lakes, rivers, and wetlands. Through altimetry, the surface water levels are measured at varying temporal scales depending on the orbit cycle of the satellite. The futuristic mission of Surface Water and Ocean Topography (SWOT) scheduled to be launched in year 2022 shall offer the spatial coverage and resolution suitable for water level estimation and volume calculation in small water bodies like lakes worldwide. With a radar interferometer in Ka-band, SWOT proposes to provide two-dimensional maps of water heights 21 days repeat orbit configuration. Cycle average SWOT datasets for land will be developed with higher temporal resolution, with temporal resolution varying geographically. This work assesses the potential of SWOT for monitoring water volumes over a case study lake by analyzing SWOT like synthetic data produced using the SWOT simulator developed by the Centre National d'Etudes Spatiales (CNES). With SWOT relying on a novel technology, the initial 90 days of this mission after launch shall focus on an extensive calibration and validation. Firsthand results of SWOT-simulated water levels and volumes are presented over a case study region in the tropical band, namely, Pookode Lake, in the ecologically fragile district of Wayanad, Kerala, India. It is the second-largest freshwater lake in Kerala that is being affected by anthropogenic activities, causing huge depletion in lake water storage in the last four decades. Our analysis indicated that the lake region is subjected to a rise in temperature of 0.018°C per year. We further assess the potential of remote sensing and SWOT data to monitor water storage of Pookode Lake, which is undergoing a rapid change. Results show that the proxy water surface elevations have immense potential in scientific studies pertaining to lake monitoring across the world. Overall, the study shows the potential of SWOT for monitoring the variability of water levels and volumes in this region.
Introduction
Surface water bodies are important sources of water for civilization, and they have a direct impact on ecosystems (Dudgeon et al., 2006; Palmer et al., 2015). Changes in terrestrial water storage have a substantial impact on the hydrological cycle. Among these, lake system embodies a complex interaction between atmosphere, surface, and underground water, which responds strongly to climatic conditions. Changes in stored volume of surface water have geodynamical implications for Earth's rotation and have been shown to be proxy indicators of local and regional climate (Raymond et al., 2013; Seekell et al., 2014). Lake monitoring is one of the main objectives of the World Meteorological Organization (WMO) and the Global Climate Observing System (GCOS) because lakes are primary indicators of climate change (Adrian et al., 2009; Schindler, 2009). Climate change-related changes in precipitation and air temperature have an immediate impact on lake water storage (Wit and Stankiewicz, 2006). This makes monitoring temporal shifts in lake water volumes critical (Rahman and Di, 2017; Bonsal et al., 2019). While hydrometric stations provide the most reliable information on water levels, there exists a dearth of dense gauging stations for global lake monitoring (Pavelsky et al., 2014). This is particularly a concern for developing countries like India, where the primary focus is on monitoring of major rivers and large reservoirs using hydrometric stations (Gleason and Hamdan, 2017). For more than one decade, satellite altimetry missions (Topex-Poseidon, ERS-1, ERS-2, Jason-1, Envisat) have successfully monitored water levels from space (da Silva et al., 2014) using a plethora of sensors operating in visible region (Jiang et al., 2014; Nair and Indu, 2020), microwave region like Synthetic Aperture Radar (SAR) (Zeng et al., 2017; Nair and Indu, 2020), and a combination of both sensors (Crétaux and Birkett, 2006; da Silva et al., 2014; Bioresita et al., 2019; Grippa et al., 2019).
Existing studies by da Silva et al. (2014) demonstrated the ability of Envisat altimeter data to assess water storage in Amazon basins; in another study by Duan and Bastiaanssen (2013), variation in lake volume was evaluated using various altimetry databases and laser altimeters for different lakes in the United States, Ethiopia, and the Netherlands. Similarly, Crétaux et al. (2016) used altimetry measurements to observe the effect of climate change on variation in lake water storage over the Tibetan plateau. Despite the high potential of altimetry measurements, a main drawback is the narrow swath of altimeters leading to low spatial sampling and data acquisition problems for small and medium lakes (Grippa et al., 2019). This shortcoming can be overcome by using Interferometric SAR (InSAR), which uses SAR data to determine relative water level changes in lakes. Siles et al. (2020) used this method to measure water level changes in lakes and wetlands across Canada. Despite these measures, maintaining a continuous lake monitoring inventory is daunting due to the difficulty in obtaining optical imagery, radar, and altimetry measurements for a particular lake body within a specific temporal window.
The future Surface Water and Ocean Topography (SWOT) mission, which is set to launch in 2022, will be the first of its kind to have a bistatic SAR interferometric wide swath altimeter. SWOT mission is a collaborative effort between NASA and the Centre National d'Études Spatiales (CNES), along with support from the Canadian Space Agency (CSA) and the United Kingdom Space Agency (Biancamaria et al., 2016). The SWOT satellite will have an onboard Ka-band SAR, which has a great potential for detecting water surface elevation and slope for rivers and lakes (Biancamaria et al., 2016). It will benefit from both radar altimeters for water level detection and SAR imagery for high spatial resolution. The SWOT will capture water surfaces of rivers (width more than 100 m) and lakes (surface area more than 0.0625 m2), with a revisit period of 21 days, globally between 78°S and 78°N (Pavelsky et al., 2014).
Previous studies on SWOT characteristics have concentrated on river hydrology, such as the ability to estimate streamflow (Frasson et al., 2017), streamflow assimilation (Oubanas et al., 2018), and bathymetry (Yoon et al., 2012). Very few studies have examined the contribution of SWOT in lake hydrology: Grippa et al. (2019) demonstrated SWOT capabilities to monitor lakes in Sahel in Africa, and Bergeron et al. (2020) indicated SWOT capabilities for measuring lakes in Canada. Many of these studies are mostly focused on the United States and South America. Temporally, SWOT mission shall sample each location at least twice every month with the exact timing depending mostly on the latitude. With SWOT relying on a novel technology, this mission shall require an in-depth calibration and validation (CalVal). In the year 2022, SWOT mission is known to fly a specific orbit dedicated to the CalVal activities, which is expected to last for 90 days upon launch. CalVal orbit is designed in such a manner that the satellite will follow the same track every day. Keeping these factors in mind, our research looks at Pookode Lake in Kerala's Wayanad area to evaluate the efficacy of synthetic SWOT data. This is due to the fact that SWOT will capture Pookode Lake in CalVal orbit, giving daily data for the lake during the CalVal phase.
With the high potential in SWOT for hydrological studies of reservoirs and rivers, it is crucial to check the efficiency of the SWOT dataset before its launch. Previous studies have tried to simulate SWOT-like data using different ways such as by corrupting errors into merged observations from satellite altimetry, satellite images, and gauges (Lee et al., 2010); a different approach is to use simulators to generate data using orbit pass plan and expected errors (Rodriguez and Moller, 2004; Solander et al., 2016). SWOT hydrology simulator is available from both the collaborators of the mission, i.e., from Jet Propulsion Laboratory (JPL) and CNES.
In the present study, we utilize the CNES Large-Scale SWOT Hydrology Simulator to simulate data over Pookode Lake. Furthermore, the difference in water storage is first computed using interferometric SAR for Pookode Lake. In the second step, synthetic SWOT data are generated for this lake and evaluated for its ability to compute lake volume. This is the first research to demonstrate the capabilities of remote sensing to detect lake volume fluctuations and the potential of future SWOT mission for lake hydrology in India.
Study Region
This research work has been carried out on the second largest lake in Kerala, a state in southern India (Figure 1). Pookode Lake is a fresh water body encompassing an area of 0.085 sq. km. It is situated at an altitude of 770 m above mean sea level, and the main source of water is precipitation from the southwest monsoon (during June, July, August, and September) and the northeast monsoon (during October, November, and December). The lake region receives a mean annual rainfall of 4,000 mm (Sandeep et al., 2012) and is subjected to a maximum temperature of 35°C in summer to 7°C in winter. Along with the major source of water from precipitation, the lake is also fed by two streams of the Kabini river. Because of its primary source of precipitation, it is critical to track fluctuations in lake volume, as Kerala has experienced two extreme floods in a row in 2018 and 2019.
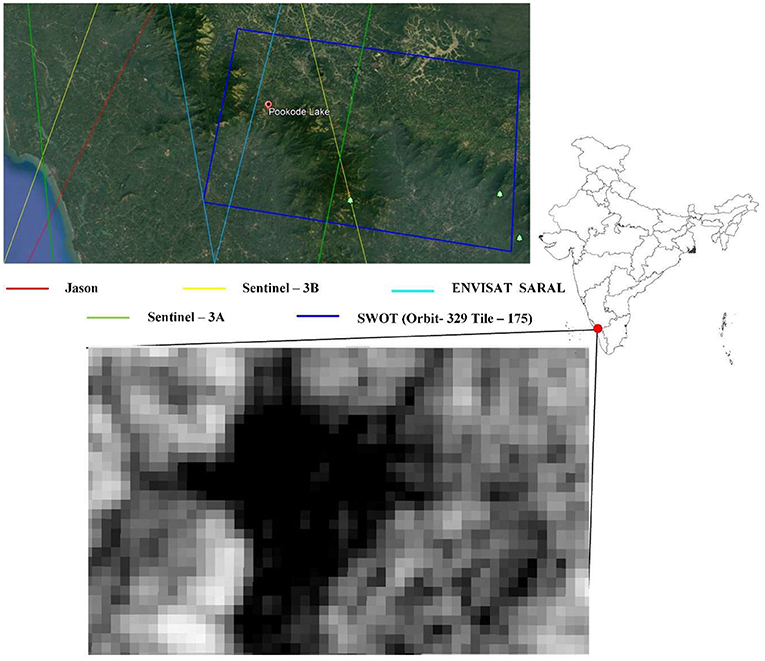
Figure 1. Location of Pookode Lake with backscatter image of lake observed by Sentinel-1. Along with orbit tracks of altimetry missions and SWOT footprint over lake.
SWOT Hydrology Simulator
The aim of the SWOT satellite is to provide hydrologists with unprecedented observations of terrestrial water bodies in order to track changes in water volume. These data are crucial for determining surface water availability and preparing for major water-related disasters like floods and droughts. Readers are recommended to the SWOT mission page for further information on the SWOT satellite's goal pertaining to hydrology (https://swot.jpl.nasa.gov/science/hydrology/). Except for a few places in Greenland's interiors and portions of the Sahara Desert, SWOT will catch inland water bodies worldwide. Users will have access to three types of SWOT datasets: pixel cloud, raster, and vector. The pixel cloud will contain geolocated heights, backscatter, geophysical fields, and flags over tile of 64 × 64 km2. Raster products will provide water surface height, area, water fraction, backscatter, and geophysical information at 100 and 250-m resolution. The vector shapefiles will include information such as water surface elevation, slope, width, and calculated discharge. The further section provides details on how proxy SWOT point cloud data is generated for Pookode Lake.
In this study, CNES SWOT large-scale hydrology simulator (CNES, 2020) is used to generate synthetic SWOT data. The Water Surface Elevation (WSE) is corrupted with SWOT measurement errors and spatial sampling based on SWOT orbital configuration to produce synthetic SWOT results. White noise, dark water effect, satellite positioning error, geolocation error, and errors attributable to atmospheric attenuation are all factors that are taken into account by the SWOT simulator. The measurement noise of the SWOT interferometric phase difference is a prime example of random errors. The system SNR (Signal-to-Noise Ratio), the duration of the interferometric baseline, and the processing algorithm all play a role in the random error contribution. The dark water effect uncertainty refers to the inaccuracy that occurs when a water pixel is incorrectly categorized as land because of dark radar returns. Satellite positing errors are caused by a lack of knowledge about the spacecraft's roll angle, changes in the baseline due to thermal contraction or expansion, system timing mistakes, and phase errors produced by the antennas or electronics. Geolocation errors occur in satellite images when pixels are incorrectly georeferenced. Layover effects incurred to near-nadir instruments are ignored in SWOT simulator used for present study. However, due to the strong contrast between water and land observed in Ka-band, the SWOT mission is anticipated to have a low contribution of error from layover (Elmer et al., 2020). Despite its limitations in representing the complete SWOT error budget, the large-scale SWOT simulator is a reliable platform for generating synthetic SWOT data for this study. To generate synthetic SWOT observations, the SWOT simulator uses a lake water extent shapefile with true WSE (details provided in Extraction of Water Level Using Interferometric SAR section) as one of the attributes (CNES, 2020).
To generate SWOT data for time corresponding to before (2015) and after (2020) flood events in Kerala, lake water extent shapefiles are created using Sentinel-1 dataset in Google Earth Engine (GEE). To generate water extent shapefiles, Sentinel-1 SAR imagery for Pookode Lake is selected for the study period. The SAR datasets are processed for noise filtering using speckle filtering algorithm. After noise correction, the images are classified for water using a binary thresholding technique, thereby generating a water mask raster. In this process, pixels with VV polarization backscatter less than −16 decibels are considered as containing water, and the corresponding pixel values are set to one, and the remaining pixels are set to zero (Bonnema and Hossain, 2019). This classified raster files are used to generate water extent shapefile. The shapefile created by GEE is pre-processed with Quantum Geographic Information System (QGIS, 2020) to add reference WSE as an attribute. Further section summarizes some of the most important steps in configuring and running the SWOT simulator in this study.
(a) In addition to WSE, the input shapefile is added with attributes such as river flag (RIV_FLAG) that is set to 0 for lakes and 1 for rivers. Two water extent shapefiles (pre-flood, 2015 and post-flood, 2020) are prepared and preprocessed for compatibility with SWOT simulator.
(b) Following the generation of input water extent files, a SWOT satellite pass plan is generated based on its orbit configuration. Synthetic SWOT data are produced using the SWOT simulator based on this SWOT plan. The SWOT simulator creates WSE in the form of a point cloud, taking into account all pixel size inconsistencies and errors in the SWOT swath. The point cloud offers high-quality observations for study.
Extraction of Water Level Using Interferometric SAR
In this study, we used SAR from Sentinel-1 data to compute difference in lake volume. The interferometric large swath mode collects data over a 250-km swath with a spatial resolution of 5 m by 20 m. To estimate variation in water level using SAR imagery, it is required to obtain short temporal baselines and broad perpendicular baselines. Sentinel-1 was introduced primarily to detect deformations (DInSAR), not to extract water levels.
For this study, two sets of imageries that met the criteria over the study region were separated into master and slave images and co-registered to extract information of phase differences. The details of SAR dataset are provided in Table 1. The first series of SAR images shows the water level in the lake in 2015 before two flood occurrences (2019, 2018), while the second set shows the water level after the flood in 2020. The main steps adopted for generating water level change using interferometry is described. The key steps of process are shown in the flowchart in Figure 2.
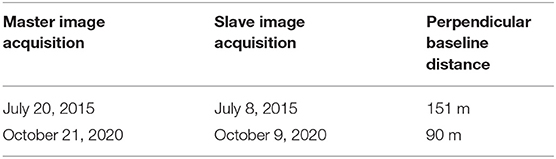
Table 1. Summary of SAR image characteristics.
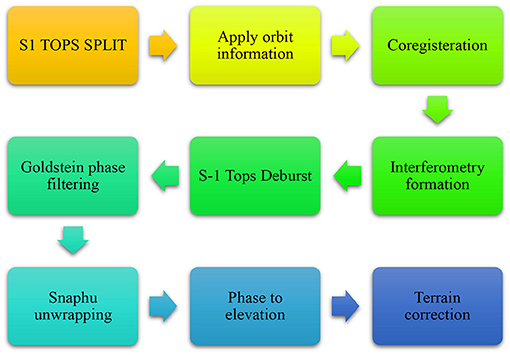
Figure 2. Flowchart of methodology adopted to extract water level using interferometry.
Initial interferogram was developed with phase difference between two images using Equation 1.
Where ∅DEM refers to topographic effects, ∅disp denotes displacement, ∅flat indicates earth curvature error, ∅atm refers to atmospheric effects, and ∅noise denotes noise effects (Ferretti et al., 2001).
After this, de-burst algorithm (Esposito et al., 2020) was applied to interferogram to process the individual bursts from one sub swath together into a single sub-swath (Moran, 2006). Later, Goldstein filtering was applied to the image to remove noise and speckles and to enhance the signal-to-noise ratio of the image. In the interferogram, the interferometric phase is ambiguous and only known within the scale of 2π. To be able to relate the interferometric phase to the topographic height, the phase must first be unwrapped using Equation 2.
Where λ is the wavelength of the SAR signal, ϕ is the unwrapped interferometric phase (surface displacement), θ is the incidence angle, n is the noise, and ΔZ is displacement.
After phase unwrapping, the data are processed for terrain correction. It is to be noted that terrain correction shall geocode the image by correcting SAR geometric distortions using the SRTM digital elevation model (DEM). Geocoding converts an image from slant range or ground range geometry into a map coordinate system. Terrain geocoding is used for correction of inherent geometric distortions, such as foreshortening, layover, and shadow. In this study, the shape of lake was assumed as pyramidal frustrum to calculate change in volume from year 2015 to 2020. For master images, surface area extent was computed from masked water bodies of sentinel photos. Using this information, the change in volume (Δv) for Pookode Lake after flood events was computed using Equation 3.
Where h1 is the high water level in the lake (during the study period, i.e., 2020), h2 is the low water level (2015), A1 is lake surface area during 2020, and A2 is lake surface area during 2015.
Results
Storage of lake water is highly susceptible to temperature changes. As a first step, we use NOAA temperature measurements (https://www.climate.gov/maps-data/datasets) to assess the temperature anomaly (with respect to 1981 to 2010 average) over Pookode Lake. The lake temperatures were evaluated for two decades, from 2000 to 2020. The annual temperature anomaly is depicted in Figure 3. In this study, the increasing surface temperature is clearly evident. Over the lake, temperatures are found to be rising at a rate of 0.018°C per year. To compute this, we applied Mann-Kendall test on temperature data and results indicated a significant trend at 95% confidence interval with a p-value of 0.0217. The trend in temperature time series was computed based on Sen's slope indicator. If the temperature rises, evapotranspiration increases, resulting in low runoff into the lakes.
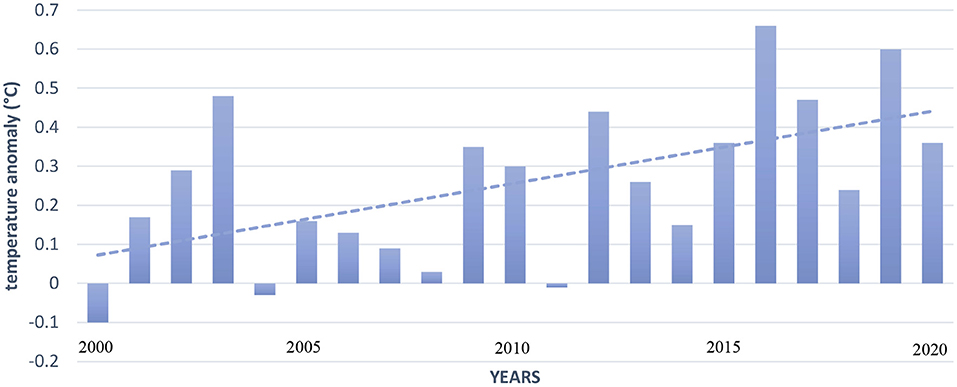
Figure 3. Variation in temperature anomaly over a lake for a period of two decades from 2000 to 2020. The trend line indicates an increase in temperature of 0.018°C per year.
Precipitation is a significant element that underpins the maintenance of lake's water balance. Precipitation has varied considerably in the study area. To evaluate this, we examined precipitation data from the Global Precipitation Mission (GPM) IMERG pixel over the study region. Figure 4 represents the variation in daily precipitation over a 20-year period, from 2000 to 2020. In 2018 and 2019, the study area experienced significant floods. In 2019, the region received a rainfall of more than 170 mm in a single day. Figure 4 also represents the annual precipitation variation across the study area. During 2018 and 2019, the area received a high amount of rain.
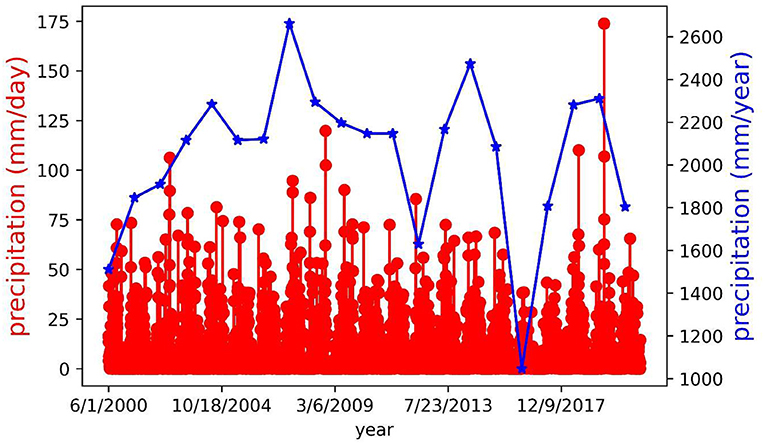
Figure 4. Variation in daily precipitation from GPM IMERG over Pookode Lake over a period of 20 years from 2000 to 2020 along with variation in annual precipitation.
We compared high-resolution optical images of the lake from Google Earth to visually examine lake water storage after two floods. Figure 5 depicts changes in the lake that happened prior to the flood (February, 2016) (Figure 5A) and after the flood (February, 2021) (Figure 5B). This figure shows the rise in lake water storage after successive flood events. This is because precipitation is the lake's primary source of fresh water. To measure this rise in lake water, we used an interferometric method (explained in section 4) to calculate water level increases. We chose interferometry for this challenge because there was no overpass of altimetry missions around the lake.
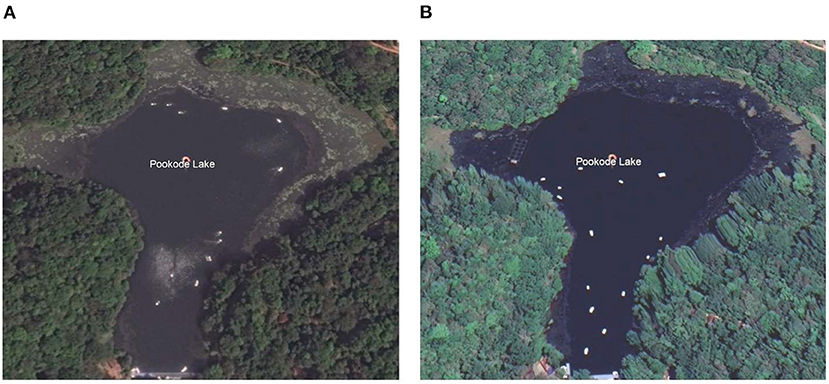
Figure 5. Variation in water extent in Pookode Lake for (A) February 2016 and (B) February 2021.
Figure 6 depicts the interferometry-derived water level estimates. Figure 6A illustrates the water level in 2015 before the flood, while Figure 6B illustrates the water level after the flood. The increase in lake water storage is distinctly evident, as the mean water elevation in Figure 6A is 687.9 m, while the lake water level after flooding is 691.2 m (Figure 6B). During this time, the lake's water level increased by about 3 m. We then used the technique described in section 4 to quantify the increase in lake volume. After analysis, the change in volume was observed as 63,739 m3.
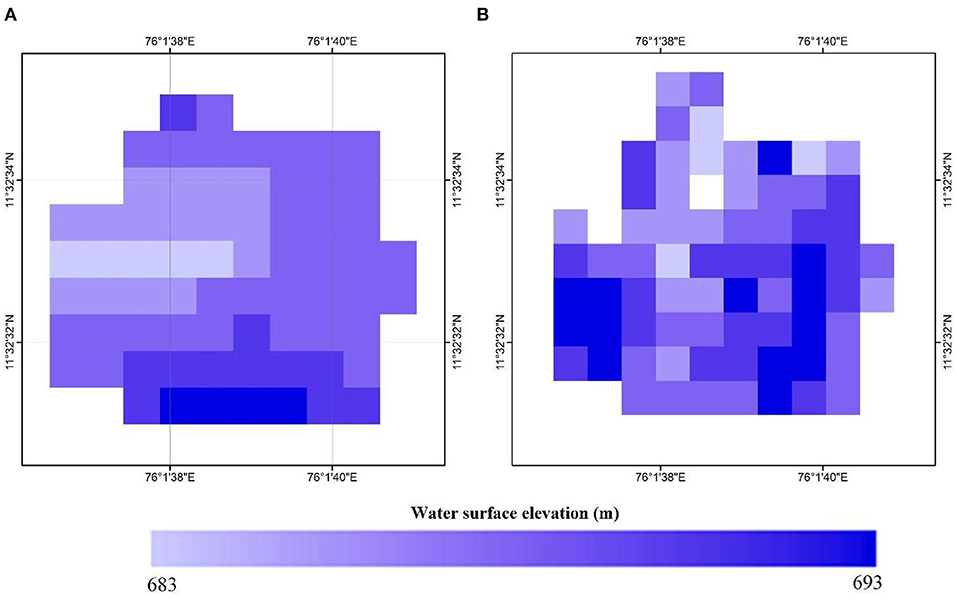
Figure 6. Variation in water level in Pookode Lake extracted using interferometric SAR before and after flood in (A) 2015 and (B) 2020.
Figure 7 represents synthetic SWOT point cloud over the Pookode Lake during pre-flood (2015) and post-flood (2020). Each point observation in point cloud comprises information on location, water surface elevation, and other attributes. Figure 7A represents point cloud observed by future SWOT mission when water storage was low in lake. The crucial thing to remember is that over Pookode Lake, there was no measurement error from SWOT. As there are no overpasses of altimetry missions over Pookode Lake (as shown in Figure 1), the SWOT mission will be a promising source to monitor its water balance. The altimetry missions checked for overpass include Jason, Sentinel-3A, Sentinel-3B, and Envisat SARAL. These dense point cloud observations will have high potential in calculating change in lake volume. For the current study, reference height used for the SWOT simulator is obtained from DInSAR. The volume change exactly matches the volume computed from a previous step as mentioned above.
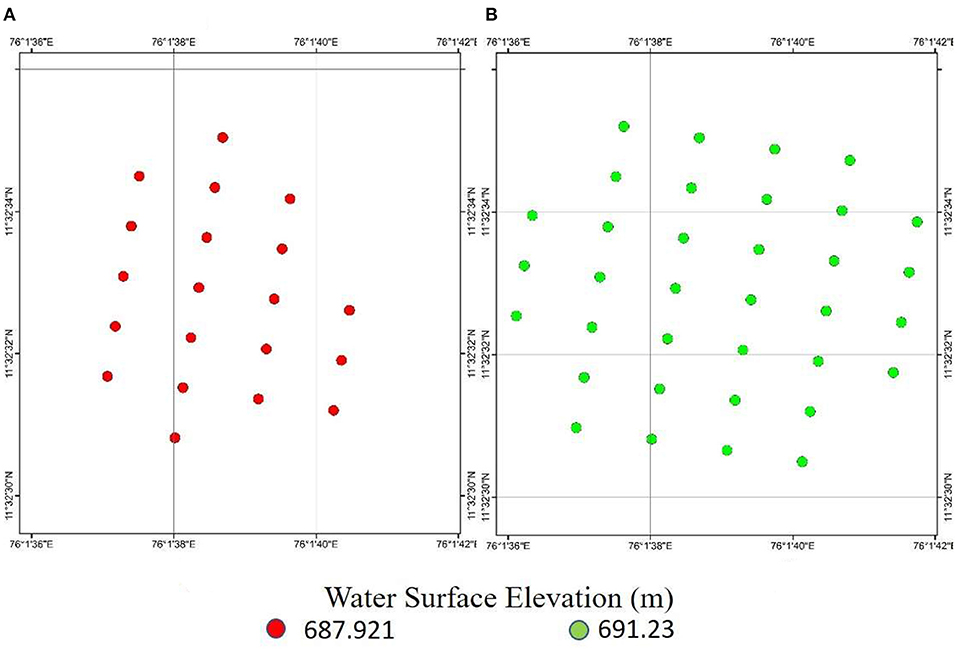
Figure 7. Variation in water level in Pookode Lake as observed by synthetic SWOT data before and after flood in (A) 2015 and (B) 2020.
Conclusion
This study presents firsthand the results of the SWOT hydrology simulator to small lakes in India. The SWOT simulator used in this study does not account for layover impacts; however, given the location of Pookode Lake, the layover impact can be neglected. The synthetic observations demonstrated high accuracy in monitoring water level for the lake. The lake is subjected to climate change with a rise in temperature of 0.018°C per year and frequent heavy rainfall. Monitoring lake storage is crucial for water balance analysis and mitigates for future sustainable water for society and recreational purpose. Our study indicated an increase of 63,739 m3 in water in 2020 as compared to 2015. The heavy precipitation in 2018 and 2019 contributed to the increase in lake volume. However, our analysis shows that the temperature in Pookode Lake is rising at a pace of 0.018°C each year. This rise in temperature will result in a large amount of evaporation from the lake. As a result, it is critical to focus on such lakes in order to reduce the risk of climate change.
The SWOT mission has the potential to provide an unparalleled capacity to monitor geographically diverse lakes and wetland WSE like Pookode Lake; therefore, continued scientific advancement is required. The capacity to address water balance components that have previously depended on limited ground-based monitoring would be enhanced by a revolutionary SWOT satellite-based surface water monitoring methodology. Following the launch of SWOT, constructing hypsometric curves for all lakes using SWOT will be tremendously helpful in building a lake inventory. This will also improve our understanding on impact of climate and climate change on lake water balance on a global scale.
Data Availability Statement
Publicly available datasets were analyzed in this study. This data can be found at: https://scihub.copernicus.eu/.
Author Contributions
AN and NK: conducting the study, reporting results, and drafting manuscript. JI: conceptualizing study and drafting manuscript. BV: editing manuscript. All authors contributed to the article and approved the submitted version.
Funding
The authors acknowledge the support by the DST CNRS project through IFC/4126/DST-CNRS/2018-19/1/1726 and the DST-Center of Excellence in Climate studies, IIT Bombay under project DST/CCP/CoE/140/2018 (G).
Conflict of Interest
The authors declare that the research was conducted in the absence of any commercial or financial relationships that could be construed as a potential conflict of interest.
Publisher's Note
All claims expressed in this article are solely those of the authors and do not necessarily represent those of their affiliated organizations, or those of the publisher, the editors and the reviewers. Any product that may be evaluated in this article, or claim that may be made by its manufacturer, is not guaranteed or endorsed by the publisher.
Acknowledgments
The authors are grateful to Prof. Faisal Hossain, University of Washington through the NASA SWOT Early Adopter project from IIT Bombay. The authors acknowledge the collaboration through CWRDM, Kerala through the NASA SWOT Early Adopter project. The authors wish to thank the support of DST Centre of Excellence in climate studies, IIT Bombay under project DST/CCP/CoE/140/2018 (G). The authors thank the SWOT Early Adopter Program supported by NASA Applied Science Program.
References
Adrian, R., O'Reilly, C. M., and Zagarese, H. (2009). Lakes as sentinels of climate change. Limnol. Oceanogr. 54, 2283–2297. doi: 10.4319/lo.2009.54.6_part_2.2283
Bergeron, J., Siles, G., Leconte, R., Trudel, M., Desroches, D., and Peters, D. L. (2020). Assessing the capabilities of the Surface Water and Ocean Topography (SWOT) mission for large lake water surface elevation monitoring under different wind conditions. Hydrol. Earth Syst. Sci. 24, 5985–6000. doi: 10.5194/hess-24-5985-2020
Biancamaria, S., Lettenmaier, D. P., and Pavelsky, T. M. (2016). The SWOT mission and its capabilities for land hydrology. Surv. Geophys. 37, 307–337. doi: 10.1007/s10712-015-9346-y
Bioresita, F., Puissant, A., Stumpf, A., and Malet, J-. P. (2019). Fusion of Sentinel-1 and Sentinel-2 image time series for permanent and temporary surface water mapping. Int. J. Remote Sens. 40, 1–24. doi: 10.1080/01431161.2019.1624869
Bonnema, M., and Hossain, F. (2019). Assessing the potential of the surface water and ocean topography mission for reservoir monitoring in the Mekong River Basin. Water Resour. Res. 55. doi: 10.1029/2018WR023743
Bonsal, B. R., Peters, D. L., Seglenieks, F., Rivera, A., and Berg, A. (2019). “Changes in freshwater availability across Canada,” in E. Bush and D. S. Lemmen (eds.) Canada's changing climate report. Ottawa, ON: Government of Canada, Ottawa, pp. 261–342.
CNES (2020) SWOT Hydrology Toolbox. Available online at: https://github.com/CNES/swot-hydrology-toolbox
Crétaux, J. F., and Birkett, C. (2006). Lake studies from satellite radar altimetry. Comptes Rendus-Geosci. 338, 1098–1112. doi: 10.1016/j.crte.2006.08.002
Crétaux, J. F. Abarca-del-Río, R., Bergé-Nguyen, M., Arsen, A., Drolon, V., Clos, G., and Maisongrande, P. (2016). Lake volume monitoring from space. Surv. Geophys. 37, 269–305. doi: 10.1007/s10712-016-9362-6
da Silva, D. A., Calmant, J. S., Seyler, S., Moreira, F., Oliveira, D. M. D., and Monteiro, A. (2014). Radar altimetry aids managing gauge networks. Water Resour. Manag. 28, 587–603. doi: 10.1007/s11269-013-0484-z
Duan, Z., and Bastiaanssen, W. G. M. (2013). Estimating water volume variations in lakes and reservoirs from four operational satellite altimetry databases and satellite imagery data. Remote Sens. Environ. 134, 403–416. doi: 10.1016/j.rse.2013.03.010
Dudgeon, D., Arthington, A. H., Gessner, M. O., Kawabata, Z. I., Knowler, D. J., Lévêque, C., et al. (2006). Freshwater biodiversity: importance, threats, status and conservation challenges. Biol. Rev. 81, 163–182. doi: 10.1017/S1464793105006950
Elmer, N. J., Hain, C., Hossain, F., Desroches, D., and Pottier, C. (2020). Generating proxy SWOT water surface elevations using WRF-Hydro and the CNES SWOT Hydrology Simulator. Water Resour. Res. 56:e2020WR. https://doi.org/10.1029/2020WR027464[doi: 10.1029/2020WR027464
Esposito, G., Marchesini, I., Mondini, A., Reichenbach, P., Rossi, M., and Sterlacchini, S. (2020). A spaceborne SAR-based procedure to support the detection of landslides. Nat. Hazards Earth Syst. Sci. 20, 2379–2395. doi: 10.5194/nhess-20-2379-2020
Ferretti, A., Prati, C., and Rocca, F. (2001). Permanent scatterers in SAR interferometry. IEEE Trans. Geosci. Remote Sens. 39, 8–20. doi: 10.1109/36.898661
Frasson, R. P. D. M., Wei, R., Durand, M., Minear, J. T., Domeneghetti, A., Schumann, G., et al. (2017). Automated river reach definition strategies: applications for the surface water and ocean topography mission. Water Resour. Res. 53, 8164–8186. doi: 10.1002/2017WR020887
Gleason, C. J., and Hamdan, A. N. (2017). Crossing the (watershed) divide: satellite data and the changing politics of international river basins. Geogr. J. 183, 2–15. doi: 10.1111/geoj.12155
Grippa, M., Rouzies, C., Biancamaria, S., Blumstein, D., Cretaux, J. F., Gal, L., et al. (2019). Potential of SWOT for monitoring water volumes in sahelian ponds and lakes. IEEE J. Sel. Top. Appl. Earth Obs. Remote Sens. 12, 2541–2549. doi: 10.1109/JSTARS.2019.2901434
Jiang, H., Feng, M., Zhu, Y., Lu, N., Huang, J., and Xiao, T. (2014). An automated method for extracting rivers and lakes from landsat imagery. Remote Sens. 6, 5067–5089. doi: 10.3390/rs6065067
Lee, H., Durand, M., Jung, H. C., Alsdorf, D., Shum, C. K., and Sheng, Y. (2010). Characterization of surface water storage changes in Arctic lakes using simulated SWOT measurements. Int. J. Remote Sens. 31, 3931–3953. doi: 10.1080/01431161.2010.483494
Moran, M. S., McElroy, S., Watts, J. M., and Peters-Lidard, C. D. (2006). Radar remote sensing for estimation of surface soil moisture at the watershed scale. Model Remote Sens. Appl. Agric. Model Remote Sens. Appl. Agric. 91–106.
Nair, A. S., and Indu, J. (2020). “Reservoir water surface area detection using satellite observations for synthetic SWOT data simulation,” in 2020 International Conference on Smart Innovations in Design, Environment, Management, Planning and Computing (ICSIDEMPC), 2020, 160–163.
Oubanas, H., Gejadze, I., Malaterre, P-. O., Durand, M., Wei, R., Frasson, R. P. M., et al. (2018). Discharge estimation in ungauged basins through variational data assimilation: the potential of the SWOT mission. Water Resour. Res. 54, 2405–2423. doi: 10.1002/2017WR021735
Palmer, S. C. J., Kutser, T., and Hunter, P. D. (2015). Remote sensing of inland waters: challenges, progress and future directions. Remote Sens. Environ. 157, 1–8. doi: 10.1016/j.rse.2014.09.021
Pavelsky, T. M., Durand, M. T., Andreadis, K. M., Beighley, R. E., Paiva, R. C. D., Allen, G. H., et al. (2014). Assessing the potential global extent of SWOT river discharge observations. J. Hydrol. 519, 1516–1525. doi: 10.1016/j.jhydrol.2014.08.044
QGIS (2020). Available online at: https://qgis.org/en/site
Rahman, M. S., and Di, L. (2017). The state of the art of spaceborne remote sensing in flood management. Nat. Hazards 85, 1223–1248. doi: 10.1007/s11069-016-2601-9
Raymond, P. A., Hartmann, J., and Lauerwald, R. (2013). Global carbon dioxide emissions from inland waters. Nature 503, 355–359. doi: 10.1038/nature12760
Rodriguez, E., and Moller, D. (2004). “Measuring surface water from space,” in AGU Fall Meeting Abstracts, Vol. 2004, pp. H22C-08.
Sandeep, K., Warrier, A., Harshavardhana, B., and Shankar, R. (2012). Rock Magnetic Investigations of Surface and sub-surface soil samples from five Lake Catchments in Tropical Southern India. Int. J. Environ. Res. 6, 1–18. doi: 10.22059/ijer.2011.467
Schindler, D. W. (2009). Lakes as sentinels and integrators for the effects of climate change on watersheds, airsheds, and landscapes. Limnol. Oceanogr. 54, 2349–2358. doi: 10.4319/lo.2009.54.6_part_2.2349
Seekell, D. A., Carr, J. A., Gudasz, C., and Karlsson, J. (2014). Upscaling carbon dioxide emissions from lakes. Geophys. Res. Lett. 41:7555. doi: 10.1002/2014GL061824
Siles, G., Trudel, M., Peters, D. L., and Leconte, R. (2020). Hydrological monitoring of high-latitude shallow water bodies from highresolution space-borne D-InSAR. Remote Sens. Environ. 236:111444. doi: 10.1016/j.rse.2019.111444
Solander, K. C., Reager, J. T., and Famiglietti, J. S. (2016). How well will the Surface Water and Ocean Topography (SWOT) mission observe global reservoirs? Water Resour. Res. 52, 2123–2140. doi: 10.1002/2015WR017952
Wit, D. E., and Stankiewicz, M. (2006). Changes in surface water supply across Africa with predicted climate change. Science 311, 1917–1921. doi: 10.1126/science.1119929
Yoon, Y., Durand, M., Merry, C. J., Clark, E. A., Andreadis, K. M., and Alsdorf, D. E. (2012). Estimating river bathymetry from data assimilation of synthetic SWOT measurements. J. Hydrol. 464/465, 363–375. doi: 10.1016/j.jhydrol.2012.07.028
Keywords: SWOT, interferometry, climate change, lakes, water levels
Citation: Nair AS, Kumar N, Indu J and Vivek B (2021) Monitoring Lake Levels From Space: Preliminary Analysis With SWOT. Front. Water 3:717852. doi: 10.3389/frwa.2021.717852
Received: 31 May 2021; Accepted: 01 November 2021;
Published: 16 December 2021.
Edited by:
Auroop Ratan Ganguly, Northeastern University, United StatesReviewed by:
Sumit Purohit, Pacific Northwest National Laboratory (DOE), United StatesRamakrishna Tipireddy, Pacific Northwest National Laboratory (DOE), United States
Copyright © 2021 Nair, Kumar, Indu and Vivek. This is an open-access article distributed under the terms of the Creative Commons Attribution License (CC BY). The use, distribution or reproduction in other forums is permitted, provided the original author(s) and the copyright owner(s) are credited and that the original publication in this journal is cited, in accordance with accepted academic practice. No use, distribution or reproduction is permitted which does not comply with these terms.
*Correspondence: J. Indu, aW5kdXNqQGNpdmlsLmlpdGIuYWMuaW4=