 Claire M. Murphy1
 Laura K. Strawn1
 Travis K. Chapin2
 Rachel McEgan2Sweeya Gopidi3Loretta Friedrich2
 Lawrence D. Goodridge4
 Daniel L. Weller5
 Keith R. Schneider3
 Michelle D. Danyluk2,3*
- 1Department of Food Science and Technology, Virginia Tech, Blacksburg, VA, United States
- 2Citrus Research and Education Center, University of Florida, Lake Alfred, FL, United States
- 3Food Science and Human Nutrition Department, University of Florida, Gainesville, FL, United States
- 4Canadian Research Institute for Food Safety, University of Guelph, Guelph, ON, Canada
- 5Department of Environmental and Forest Biology, SUNY College of Environmental Sciences and Forestry, Syracuse, NY, United States
The microbial quality of agricultural water is often assessed using fecal indicator bacteria (FIB) and physicochemical parameters. The presence, direction, and strength of associations between microbial and physicochemical parameters, and the presence of human pathogens in surface water vary across space (e.g., region) and time. This study was undertaken to understand these associations in two produce-growing regions in Florida, USA, and to examine the pathogen ecology in waterways used for produce production. The relationship between Salmonella presence, and microbial and physicochemical water quality; as well as weather and land use factors were evaluated. Water samples were collected from six sites in North Florida (N = 72 samples) and eight sites in South Florida (N = 96 samples) over 12 sampling months. Land use around each sampling site was characterized, and weather and water quality data were collected at each sampling. Salmonella, generic Escherichia coli, total coliform, and aerobic plate count bacteria populations were enumerated in each sample. Univariable and multivariable regression models were then developed to characterize associations between microbial water quality (i.e., E. coli levels and Salmonella presence), and water quality, weather, and land use factors separately for North and South Florida. The E. coli and total coliforms mean concentrations (log10 MPN/100 mL) were 1.8 ± 0.6 and >3.0 ± 0.4 in North and 1.3 ± 0.6 and >3.3 ± 0.2 in South Florida waterways, respectively. While Salmonella was detected in 23.6% (17/72) of North Florida and 28.1% (27/96) of South Florida samples, the concentration ranged between <0.48 and 1.4 log10 MPN/100 mL in North Florida, and <0.48 and 3.0 log10 MPN/100 mL in South Florida. Regression analyses showed no evidence of a correlation between either log10 total coliforms or E. coli levels, and if a sample was Salmonella-positive. The factors associated with Salmonella presence and log10 E. coli levels in North Florida differed from those in South Florida; no factors retrained in multivariable regression models were the same for the North and South Florida models. The differences in associations between regions highlight the complexity of understanding pathogen ecology in freshwater environments and suggest substantial differences between intra-state regions in risk factors for Salmonella contamination of agricultural water.
Introduction
Agricultural water used in produce production environments has been identified as a probable route of contamination in past produce outbreaks (Greene et al., 2008; Klontz et al., 2010; Park et al., 2012; Rodrigues et al., 2020). When agricultural water comes into contact with the harvestable portion of a plant during production (e.g., during foliar irrigation, frost protection) or farm environment (e.g., through splash from contaminated soil and feces) fresh produce can become contaminated by human pathogens present in the water (Miles et al., 2009; Erickson et al., 2010; Fatica and Schneider, 2011; Ijabadeniyi et al., 2011; Atwill et al., 2015; Jeamsripong et al., 2019; Lee et al., 2019). Understanding pathogen ecology in freshwater environments used for produce production is critical for ensuring safety and assessing the risk of potential contamination events.
The Produce Safety Rule (PSR), part of the 2011 Food Safety Modernization Act (FSMA), defines requirements for pre- and post-harvest agricultural water quality, including the frequency of testing for Escherichia coli (as an indicator of probable fecal contamination), and criteria for E. coli limits. While under review at the time this manuscript was written (US Food Drug Administration, 2015), the final PSR (i) required that agricultural surface water used during produce production establish a microbial water quality profile (MWQP) using 20 samples collected over 2–4 years on a rolling basis, and (ii) that the geometric mean (GM) and statistical threshold value (STV) of E. coli in this sample be ≤ 126 and ≤ 410 CFUs/100 mL, respectively. Water that exceeds these requirements is to be re-tested, not used, or treated to reduce the potential contamination risk of produce (US Food Drug Administration, 2015). While the PSR relies on the use of E. coli, an indicator of potential fecal contamination, there is conflicting data within the scientific literature on the efficacy of E. coli as a fecal indicator (Ishii and Sadowsky, 2008; Jang et al., 2017), and the association between E. coli and the presence of food safety hazards in agricultural waters (McEgan et al., 2013; Luo et al., 2015; Topalcengiz et al., 2017; Truitt et al., 2018). Past studies have shown that meeting the PSR standard may not be indicative of the presence of food safety hazards at the time of water use.
Physicochemical water quality (e.g., turbidity, pH), weather (e.g., rainfall, relative humidity), and land-use factors (e.g., proximity to forest and wetland, elevation) are well-established in the literature as being associated with microbial water quality (Strawn et al., 2013b; Chapin et al., 2014; Weller et al., 2015, 2020a,b; Liu et al., 2018; Truitt et al., 2018; Gu et al., 2019). Multiple studies have discussed using physicochemical water quality monitoring as alternatives or supplements to E. coli monitoring; others have shown that models that use these environmental factors as features can accurately predict microbial water quality for agricultural waterways (Topalcengiz et al., 2017; Weller et al., 2021). Prior research (McEgan et al., 2013; Strawn et al., 2013a, 2014; Weller et al., 2015; Gu et al., 2018; Truitt et al., 2018) has also shown that microbial water quality is associated with spatial (e.g., within and between waterways, regions) and temporal (e.g., over a day, year) factors. For example, one study observed markedly different Salmonella prevalence rates, 9.4 and 37.5% in agricultural water (250 mL sample), collected from New York and South Florida produce farms, respectively (Strawn et al., 2014). Luo et al. (2015) found that Salmonella concentrations (MPN/L) in Florida and Georgia ponds were seasonally driven and were significantly correlated with temperature and rainfall. The researchers in this study also noted that generic E. coli levels were significantly associated with the likelihood of Salmonella detection (Luo et al., 2015). McEgan et al. (2013) found no consistent correlation between Salmonella presence or E. coli levels, and multiple environmental factors (e.g., water and air temperature, pH, ORP, turbidity, conductivity) when samples from multiple sites were aggregated into a single dataset for analysis. However, when the correlation was assessed separately for each site, McEgan et al. (2013) found evidence of weak correlations between microbial water quality and environmental factors, including log10 MPN Salmonella/100 mL being correlated with the air temperature at one and turbidity at two out of 18 sites. The relationship between microbial water quality and environmental factors appears complex and varies by study and over space (e.g., between waterway/site) and time (e.g., season). Additional studies on pathogen ecology in agricultural waterways are important to better characterize this variability and to understand conditions favorable to pathogen contamination of surface water. This data is key for the development of risk management strategies for agricultural water used in preharvest applications. The objectives of this study were to characterize and compare (1) the associations between microbial water quality, including pathogen presence, and environmental factors (e.g., water quality, weather, land use) in North and South Florida waterways; and (2) Salmonella diversity in North and South Florida waterways.
Methods
Water Sampling
Surface water samples were collected from both North and South Florida. The surface water in North Florida was collected from rivers (n = 5) and a lake (n = 1). The surface water in South Florida was collected from canals (n = 8). The North Florida samples were collected from each site monthly over 12 consecutive months beginning in November 2011. The South Florida samples were collected 12 times between May 2015 and November 2016. All samples were collected as previously described by McEgan et al. (2013). Briefly, a sterile carboy (Nalgene, Rochester, NY) was fitted with 4 kg lead weights, attached to a rope, and lowered 20 cm below the water surface at least 3 m from the shore. Carboys were filled with at least 1 L of water, transported to the lab at 4°C, and processed within 24 h of collection. Sampling always occurred before solar noon.
Physicochemical Water Quality, Weather, and Adjacent Land Use Factors
At each sampling physicochemical water quality, including turbidity, water temperature, pH, conductivity, colorimetric reading, and oxidation-reduction potential (ORP), was assessed. Each physicochemical parameter was measured in triplicate, and the value averaged. Turbidity was measured using a portable colorimeter (DR/850; Hach Company, Loveland, CO, USA) according to the manufacturer's instructions. Water and air temperatures were measured with a portable temperature probe (SH66A; Cooper Instrument Corporation, Middlefield, CT, USA). The ORP and pH were measured with a portable ORP/pH meter (pH 6 Acorn series: Oakton, Vernon Hills, IL, USA). Conductivity was measured with a portable conductivity tester (HI98304 DIST1 4 EC, HANNA Instruments, Woonsocket, RI, USA).
The weather data, including air temperature, relative humidity, and rainfall, were obtained for each sampling from the Florida Automated Weather Network (https://fawn.ifas.ufl.edu/) using the closest weather station to the sampling site. To characterize the land use around each sampling site, land cover data were downloaded from the National Land Cover dataset (https://www.mrlc.gov/national-land-cover-database-nlcd-2016). The proportion of land within 122,366 and 1,098 m of each site under pasture-hay, cropland, forest-wetland, and developed (>20% impervious) cover was then calculated using the code developed by D. Weller (https://github.com/wellerd2/Calculating-land-use-land-cover-and-landscape-structure-parameters) as previously described (Liao et al., 2021). Buffer distances (122,366 and 1,098 m) were selected based on the recommendations from the Leafy Green Marketing Agreement on how far pre-harvest agricultural water sources should be from land uses that may contaminate the water with human pathogens (Table 7 Crop Land and Water Sources Adjacent Land Uses in California Leafy Greens Marketing Agreement, 2020). For example, the recommended distance from a crop land to a concentrated animal feeding operation (CAFO) with >1,000 animals is 1,200 feet (~366 m); this buffer (366 m), and buffers 1/3 smaller (122 m) and 1/3 larger (1,098 m) were used here. The elevation was obtained from the United States Geological Survey (https://apps.nationalmap.gov/elevation/#/%23bottom) for each water collection site.
Enumeration of Aerobic Plate Count, Total Coliform, and E. coli Levels
The aerobic plate count (APC) (CFU/100 mL), total coliform (MPN/100 mL), and E. coli (MPN/100 mL) levels were enumerated in each sample as previously described (McEgan et al., 2013). Briefly, for APC, water samples were serially diluted in 0.1% peptone water (Difco, Sparks, MD), and 100 μL aliquots were spread plated in duplicate on a tryptic soy agar (TSA) (Difco, Sparks, MD, USA). The TSA plates were incubated at 35 ± 2°C for 24 h. Colonies were enumerated by hand and CFU/100 mL calculated. Colisure presence/absence snap packs (IDEXX Laboratories, Inc., Westbrook, ME, USA) were used to determine the coliform and E. coli most probable numbers (MPN) in a five-by-three MPN configuration (10-, 1-, and 0.1 mL dilutions). The tubes were incubated at 35 ± 2°C for 24 h. The yellow color indicated coliforms, and E. coli was identified by observing fluorescence using a 6-watt fluorescent, 365 nm long-wave UV lamp with bulb from IDEXX Laboratories, Inc., Westbrook, ME. The MPN/100 mL was determined from the table in Standard Methods for the Examination of Water and Wastewater, 18th ed (American Public Health Association, 1992).
Salmonella Enumeration and Characterization
The methods for the MPN estimation of Salmonella in each water sample were based on the US Food and Drug Administration (FDA) Bacteriological Analytical Manual (BAM) (Andrews et al., 2011). Briefly, a three-by-three MPN method using dilutions (i) 10 mL of water sample in 10 mL double-strength lactose broth, (ii) 1 mL of water sample in 9 mL single-strength lactose broth, and (iii) 0.1 mL of water sample in 9 mL single-strength lactose broth were done. The MPN tubes were incubated at 35 ± 2°C for 24 h. Selective enrichment was performed by transferring 1.0- and 0.1 mL aliquots of each tube to tetrathionate (TT) broth (Difco) and Rappaport-Vassiliadis (RV) broth (Difco), respectively. The TT and RV broths were incubated at 35 ± 2°C and 41 ± 2°C for 24 and 48 h, respectively. A 10-μL aliquot from each TT and RV broth were streaked onto xylose lysine Tergitol 4 (XLT-4) (Difco) and CHROMagar Salmonella Plus (DRG International, Inc., Springfield, NJ, USA), and incubated at 35 ± 2°C for 24 h. Presumptive Salmonella colonies were streaked on lysine iron agar slants (LIA) (Difco) and triple sugar iron agar slants (TSI) (Difco). The slants were incubated at 35 ± 2°C for 24 h.
Further confirmation was performed using PCR for the invA and oriC genes, as previously described (Malorny et al., 2003). PCR confirmed Salmonella isolates were preserved at −80°C in 15% glycerol. One Salmonella isolate per sample enrichment scheme (e.g., TT-XLT-4, RV-XLT-4) was sent to the National Veterinary Services Laboratory (Ames, Iowa, US) for serotyping.
Samples that were below the limit of detection (LOD) for Salmonella (LOD; <0.48 log10 MPN/100 mL) were considered Salmonella-negative. Samples yielding an MPN value, above the LOD (with an upper limit of detection of 3.3 log10 MPN/100 mL), were considered positive for Salmonella (volume of water tested was 33.3 mL).
Statistical Analysis
All analyses were performed in R version 3.3.5 (R Foundation for Statistical Computing, Vienna, Austria). Initial descriptive analysis was performed, and summary statistics were calculated separately for all continuous factors (e.g., microbial levels, weather conditions) in North and South Florida. Using the vegan package, Simpson's Index of Diversity was calculated to quantify and compare the Salmonella serotype diversity in the North and South Florida water samples. Multiple samples had total coliform levels above the upper LOD, and the upper LOD times 1.5 were used for the total coliform value for these samples in the regression and tree analyses.
Bayesian mixed models were implemented to characterize the differences in microbial concentration, and the presence-absence of Salmonella between regions, seasons, and water types. The outcomes considered are listed in Tables 1, 2. Due to the number of samples below the detection limit for Salmonella and above the limit for total coliforms, hurdle models were implemented. Briefly, logistic regression was used to characterize the associations if a sample was Salmonella positive or negative, or if the total coliform levels were above or below the limit of detection. Then for those samples where Salmonella or total coliforms were enumerable, a separate log-linear model was fit. For models where the outcome was binary, a Bernoulli distribution with a logit link function was used. All models included a random effect of site and fixed effect of the season to account for pseudo-replication and temporal autocorrelation. Separate models were fit for each outcome with either water type (canal, lake, or river) or region (North or South Florida) as the covariates. Separate models were also used to characterize the relationship between Salmonella contamination and log10 E. coli levels (both as a continuous concentration variable, and as two binary variables indicating if E. coli levels in the sample were above or below the geometric mean and STV cut-offs prescribed in the PSR). Models were fit using the brms package for Bayesian Regression Models using 'Stan', uninformative priors, 3 chains, and thinning set to 10 (Bürkner, 2017a,b). While the number of iterations per chain was set to 5,000 (burn-in of 2,500) for most models. The maximum a posteriori (MAP) and 95% credibility interval (CI) for the effect estimates were calculated using the bayestestR package (Makowski et al., 2019a,b). The method of interpreting the MAP and 95% CI estimates is described in the footnotes for Tables 1, 2 as the interpretation of the probability of direction (PD), practical significance (PS), and regional of practical equivalence (ROPE) indices, which were quantified and used to determine if the (i) given factor had a substantial effect on the outcome, and (ii) if a positive or negative effect exists regardless of if that effect is negligible or non-negligible.
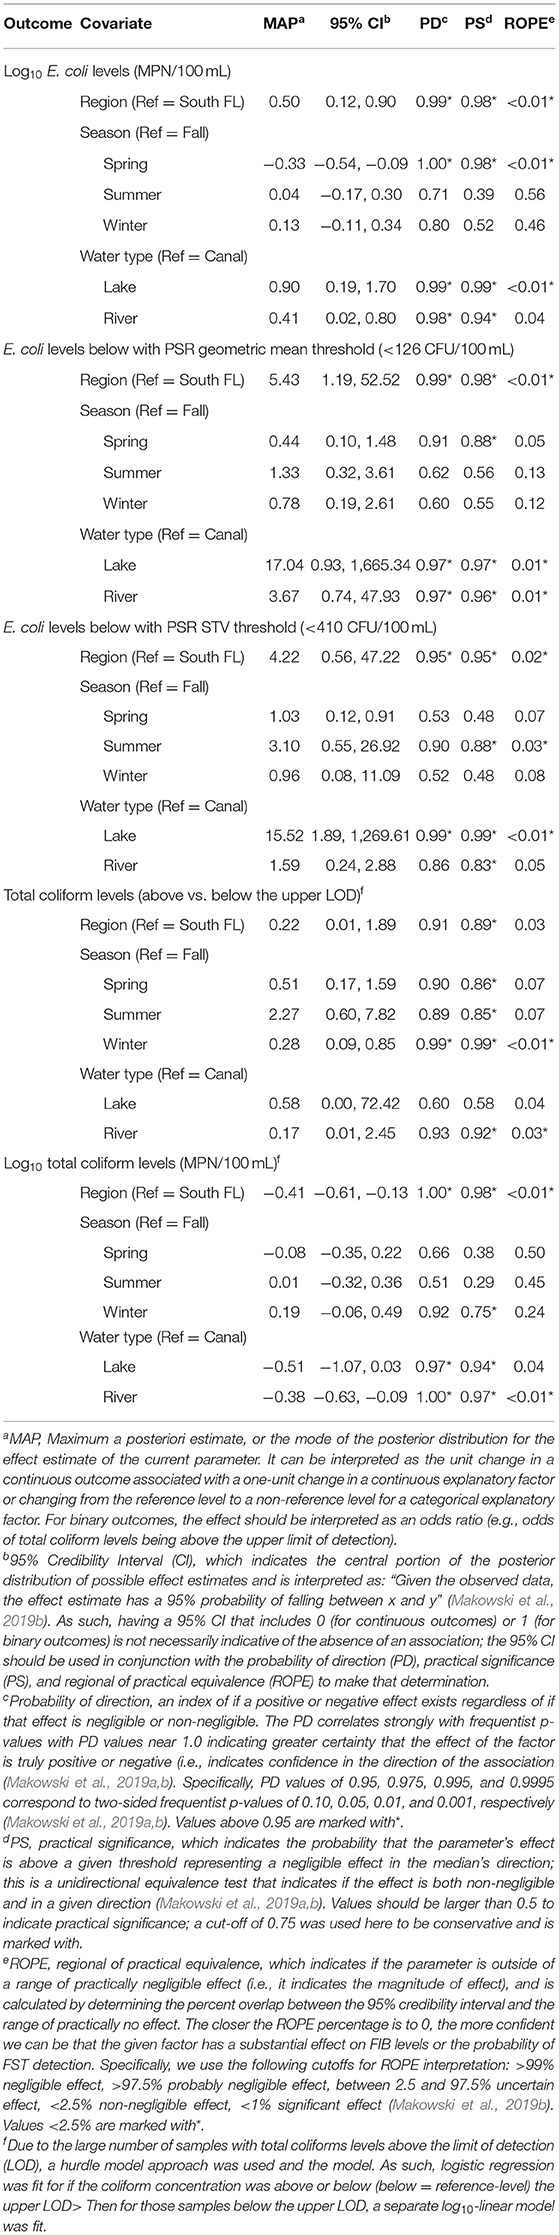
Table 1. Results of the Bayesian mixed models used to characterize differences in E. coli and total coliform levels between regions, water types; REF, reference-level for categorical factors.
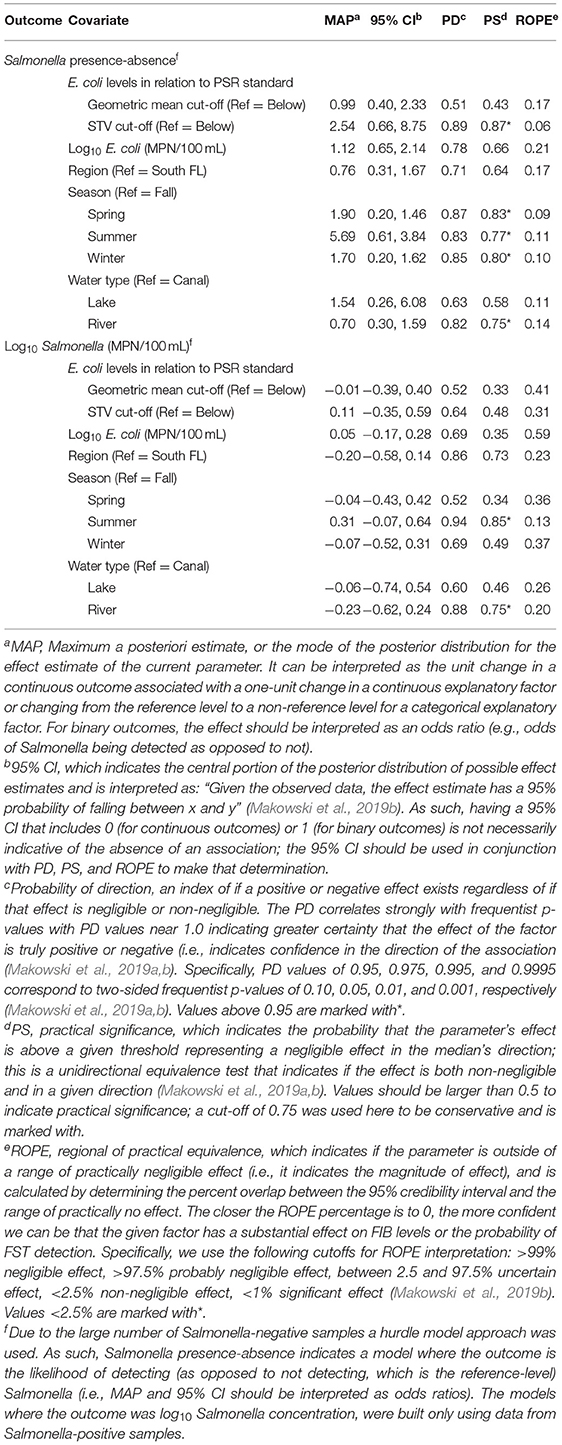
Table 2. Results of the Bayesian mixed models used to characterize differences in Salmonella between regions and water types.
Separately from the Bayesian regression, conditional inference trees were implemented using the partykit package and the defaults recommended by the package authors. Trees were used to determine if there were differences between regions in environmental factors associated with log10 E. coli, total coliform, Salmonella levels, and Salmonella presence-absence. For the model where the outcome was log10 Salmonella levels, only samples positive for Salmonella were used. For the total coliform model, coliform values for samples where coliform levels were above the upper LOD were set to 1.5*LOD. Conditional trees were used since they are robust to collinearity and correlation between explanatory factors, can handle missing data, can handle hierarchical relationships (and account for all possible interactions), and can be easily interpreted (Weller et al., 2020a,c). In interpreting the results, it is important to note that region and water type are collinear, with all South Florida sites being canals, and North Florida sites being either lakes or rivers.
Results and Discussion
The goals of the study were to characterize and compare (1) the associations between microbial water quality, including pathogen presence, and environmental factors (e.g., water quality, weather, land use) in North and South Florida waterways; and (2) Salmonella diversity in North and South Florida waterways. Samples were collected at six North Florida and eight South Florida sites, each representing a separate waterway. All six sites in North Florida were natural waterways (e.g., rivers, lakes) while the eight South Florida sites were all canals. Each site was visited 12 times during the study, yielding 168 water samples (72 North and 96 South Florida samples). Physicochemical water quality, weather, and land use data for each sample and site are summarized in Supplementary Tables 1, 2.
Microbial Water Quality in Two Florida Growing Regions
Of the 168 samples, total coliform levels in 112 (40 from North and 72 from South) were above the upper limit of detection (log10 > 3.3 MPN/100 mL); no samples fell below the lower limit of detection. For the 112 counts that fell above the limit of detection, the value of 3.3 log10 MPN/100 mL was used. The mean and median log10 MPN/100 mL of total coliforms was >3.0 (Range = 1.7, >3.3) and >3.2 (IQR = >2.7, >3.3) in North Florida, and >3.3 (Range = 2.4, >3.3) and >3.3 (IQR = >3.3, >3.3) in South Florida (Table 3), respectively. Unlike total coliforms, no sample had E. coli levels below the lower limit or above the upper limit of detection. For North Florida samples the mean was 1.8 log10 MPN/100 mL (Range = 0.6, 3.2) and the median was 1.7 log10 MPN/100 mL (IQR = 1.4, 2.2), while in South Florida samples the mean was 1.3 (Range = 0.0, 2.8) and the median was 1.3 (IQR = 0.9, 1.6; Table 3). While only 9% of the samples collected in South Florida exceed the PSR GM standard for E. coli (126 CFU/100 mL), 32% of samples collected in North Florida exceeded this cut-off. Similarly, 3% of South Florida samples and 11% of North Florida samples had E. coli levels that exceeded the PSR STV standard (410 MPN/100 mL). Multiple sources show that the difference between CFU and MPN is not significant to change the interpretation of the findings or conclusions (Cowburn et al., 1994; Hargett and Goyn, 2004; Gronewold and Wolpert, 2008; Fricker et al., 2010).
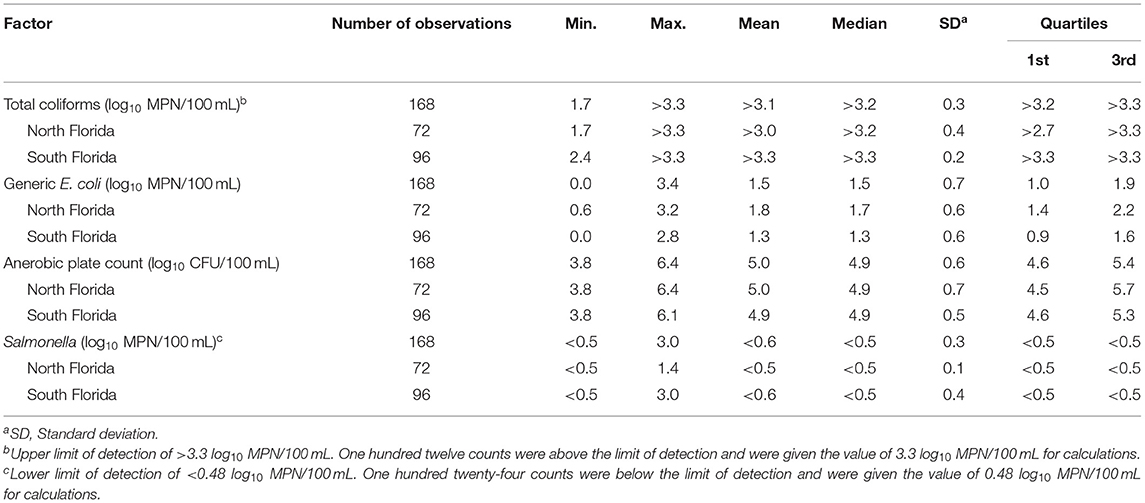
Table 3. Summary statistics for total coliforms, generic E. coli, anerobic plate count, and Salmonella for North and South Florida waterways.
Salmonella was detected in 26% (44/168) of water samples (Table 4; 124 samples were below the limit of detection, <0.48 MPN/100 mL). More Salmonella was detected in South Florida (27/96; 28%), than in North Florida (17/72; 24%). For the 124 counts that fell below the limit of detection, the value of.48 log10 MPN/100 mL was used. The mean and median log10 MPN/100 mL of Salmonella was <0.5 (Range ≤ 0.5, 1.4) and <0.5 (IQR ≤ 0.5, <0.5) in North Florida, and <0.6 (Range ≤ 0.5, 3.0) and <0.5 (IQR ≤ 0.5, <0.5) in South Florida (Table 3). Figure 1 describes the distribution of total coliforms, E. coli, and Salmonella by region, season, and water type. The Salmonella prevalence fell within the wide range reported by past Florida studies (McEgan et al., 2013; Luo et al., 2015; Topalcengiz et al., 2017). A Central Florida study reported a Salmonella prevalence of 4.8% (26/540) in 250 mL pond samples (Topalcengiz et al., 2017), while an independent Central Florida study detected Salmonella in all 202 10-L samples collected from multiple surface water types (e.g., ponds, canals) (McEgan et al., 2013). The Salmonella prevalence reported here is also within the range reported by studies conducted in other states, including North Carolina [e.g., 54.7% (47/86) of 25 mL water samples; (Patchanee et al., 2010)], and Georgia [e.g., 11.9% (34/285) of 222 mL water samples (Antaki et al., 2016); 79.2% (57/72) of 111 mL water samples (Haley et al., 2009)]. One reason likely responsible for the wide range in Salmonella prevalence reported by previous studies is the methodological differences between these studies. The study that reported the highest Salmonella prevalence (McEgan et al., 2013) collected 10 L samples, 5 to 40 times larger than the samples collected in the other studies discussed here (Haley et al., 2009; Patchanee et al., 2010; Antaki et al., 2016; Topalcengiz et al., 2017), and were 30 times larger than the samples collected in the present study. The likelihood of detecting Salmonella is higher for larger volumes of water, as increasing the volume tested decreases the lower limit of detection. Methodological differences between studies confound the comparison of results and reduce the ability to determine if the observed prevalence is consistent within and between studies. Development of standardized practices, including standard volumes for studies focused on agricultural water used for produce production may be appropriate. Alternatively, it may be possible to develop a statistical model, that accounts for sample volume, to enable the comparison of results between studies.
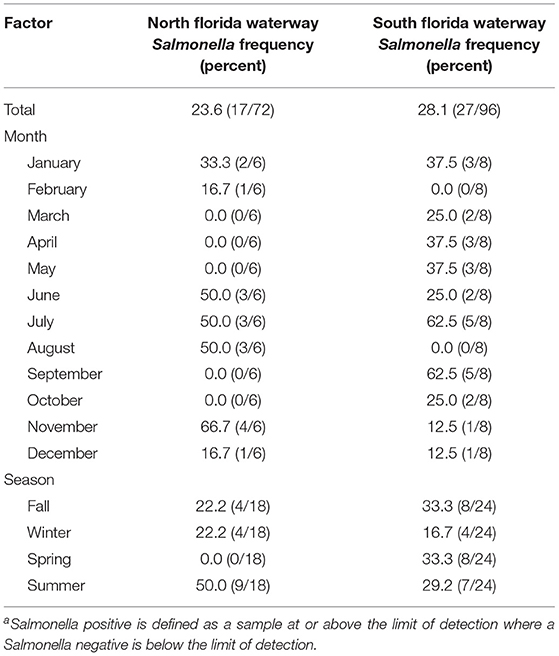
Table 4. Effect of factors season and month on the frequency of Salmonella-positivea water samples in North and South Florida waterways.
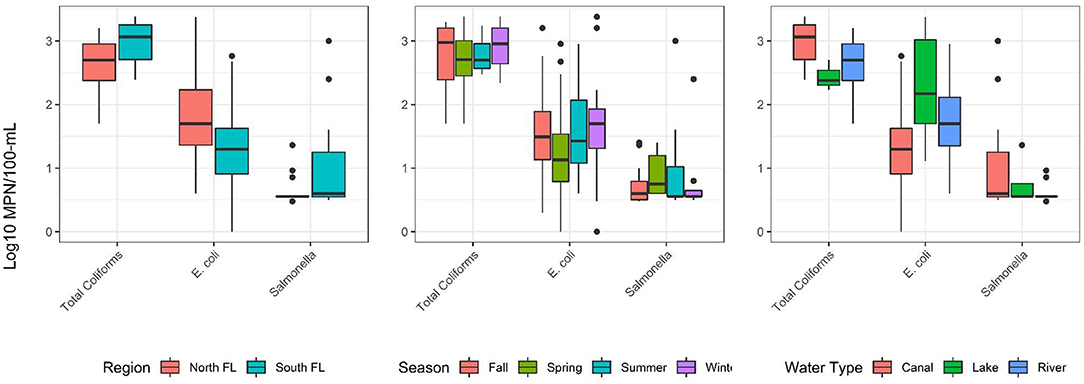
Figure 1. Distribution of log10 total coliform, E. coli, and Salmonella levels (MPN/100 mL) in each regiona, seasonb, and water typec. aN = 72 and 96 samples for North and South FL, respectively. bN = 42 samples for fall, spring, summer, and winter. cN = 96, 12, and 60 samples for canal, lake, and river, respectively.
Microbial Water Quality Varied Between Regions and Water Types
The total coliform and Salmonella levels reported are higher in South Florida than North Florida; the opposite is reported for E. coli (Figure 1). Total coliform and Salmonella levels reported are highest in canals, with total coliform levels higher in rivers, than lakes, and Salmonella levels were higher in lakes than rivers; for E. coli levels appeared lowest in canals, followed by rivers and lakes (Figure 1).
In the Bayesian mixed models, the log10 E. coli levels (measured as both a continuous factor, and as a binary factor representing if samples were above or below the PSR cut-offs of 126 and 410 CFU/100 mL) and log10 total coliform levels (measured as both a continuous factor, and a binary factor representing if samples were above or below the upper LOD) differed substantially between North and South Florida, and between water types (Table 1). The E. coli levels were ~0.50 log10 MPN/100 mL higher in North Florida than in South Florida (MAP = 0.50; 95% CI = 0.12,0.90). The results of the conditional inference trees were generally consistent with the regression models. However, given collinearity between the region and water type (i.e., that canals were only sampled in South Florida, and lakes and rivers in North Florida), it is difficult to determine if differences are driven by water type or region. To assist in overcoming this difficulty (i.e., collinearity), and probe if differences are driven more by water type or region, future studies should include a variety of water types within each region. The different surface water sampling locations reflect the different, and complex, watersheds in the state, resulting from disjointed drainage systems and atypical elevation gradients. In North Florida a karst topography results in numerous rivers, streams, lakes, and springs; in South Florida, canal systems were developed to divert the water that historically flowed as a sheet of water to allow for agricultural production (Purdum et al., 2002). The findings, in light of these geographical differences, highlight the heterogeneity inherent to freshwater environments, and the need for improved understanding of pathogen ecology for specific, intrastate produce growing regions.
Collinearity between the region and water type is not a factor for Salmonella result interpretation since neither Salmonella levels nor the odds of Salmonella detection differed substantially between regions. The Salmonella levels and the odds of Salmonella detection did differ between water types (e.g., canals, rivers, lakes) (Table 2). Specifically, the odds of Salmonella detection (OR = 0.70; 95% CI = 0.30, 1.59), and Salmonella levels (Effect Estimate = −0.23; 95% CI = −0.62, 0.24) were lower for river samples, compared with canal samples (Table 2) based on the practical significance (PS) index being ≥0.75, indicating the observed effect is both non-negligible and, in the direction indicated by maximum a posteriori estimate (MAP) (Table 2). The Salmonella tree (Figure 2) found evidence of a significant regional difference. However, this difference was dependent on environmental conditions (i.e., when temperatures were high, Salmonella levels were higher, regardless of region, but at lower water temperatures, Salmonella levels were higher in South Florida than in North Florida). These findings indicate that microbial water quality varied both between regions and between water types. This finding was not surprising, as past studies that compared microbial quality between growing regions have also found evidence of regional differences (Strawn et al., 2013a, 2014; Chapin et al., 2014; Weller et al., 2020b). Weller et al. (2020b) sampled Arizona canals and New York streams and reported higher E. coli levels and a higher prevalence of Listeria monocytogenes, pathogenic E. coli markers, and Salmonella in New York streams. Additionally, Strawn et al. (2014) found a higher prevalence of Salmonella positive overall environmental samples and water samples in south Florida (35 and 38%, respectively), compared with New York (5 and 9%, respectively). The findings reported here, coupled with previous studies (Strawn et al., 2013a, 2014; Chapin et al., 2014; Weller et al., 2020b) highlight the differences in microbial water quality between water sources and growing regions, and underscores the challenges of developing a one-size-fits-all approach for managing microbial hazards in agricultural water. The findings reported here, identify the differences in microbial water quality, and subsequent resulting challenges with recommendations for managing microbial hazards, even within a single state. These findings suggest that risk management approaches may need to be tailored to specific water types within localized (e.g., intra-state) regions.
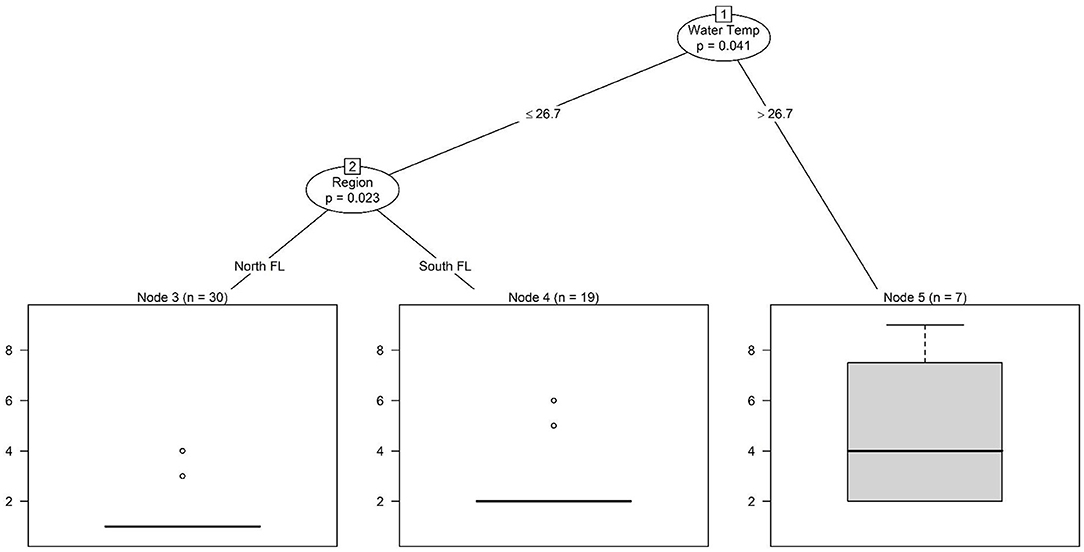
Figure 2. Conditional inference tree showing hierarchical associations between environmental factors and log10 Salmonella levels (MPN/100 mL) in samples that were Salmonella positive. A separate tree was fit for if a sample was Salmonella positive or negative, the only split in this tree was based on if air temperature at time of sample collection was ≤ 28.2°C (expected Salmonella prevalence of ~22%) and >28.2 C (expected Salmonella prevalence ~50%).
Salmonella Serovars Were Diverse and Differed Between Regions
Serotyping was performed on one representative Salmonella isolate per isolation scheme (up to 4 isolates per sample) and yielded 45 Salmonella isolates from the 44 positive samples (Supplementary Table 3). One of the 44 positive samples yielded two serovars: S. enterica subspecies enterica Invernes and Muenchen (in North Florida waterways) (Supplementary Table 3). The remaining 43 Salmonella-positive samples represented one serovar including Anatum (1), Florida (3), Hartford (1), Inverness (4), Muenchen (4), Saintpaul (3) and IV 40:z4,z24 (2) in North Florida; and Agona (1), Baildon (1), Braenderup (2), Enteritidis (2), Javiana (1), Litchfield (1), Muenchen (1), Rough (1), Rubislaw (2), Tennessee (4), Typhimurium (1), III 60:r:z (1), and IV 53:z4.z23 (9) in South Florida waterways (Supplementary Table 3). Overall serotype richness was higher in South Florida (13 serotypes) than North Florida (7 serotypes), as was Simpson's Index of Diversity (0.67 in South Florida;0.58 in North Florida). Salmonella serotype IV 53:z4.z23 was isolated most frequently from water samples in South Florida waterways, consisting of approximately 33% (9/27). While no one serotype was predominant among the Salmonella isolates from North Florida waterways, four serotypes (Florida, Inverness, Muenchen, and Saintpaul) represented 78% (14/18). A previous study in central Florida identified 33 Salmonella enterica serotypes from 165 surface water samples with the most frequent serotypes being Muenchen, Rubislaw, Anatum, Gaminara, and IV_50:z4,z23:- (McEgan et al., 2014). When Strawn et al. (2014) looked at the Salmonella diversity between two growing regions (South Florida and New York), it was identified that a high PFGE type diversity (Simpson's diversity index,0.90,0.02) was observed among Salmonella isolates across both regions and only three Pulsed-field gel electrophoresis (PFGE) types were shared between the two regions. Similarly, prior research has shown that specific Salmonella serovars may be associated with certain regions, such as Salmonella Newport repeatedly being isolated from the eastern shore of Virginia (Greene et al., 2008; Truitt et al., 2018) while several Salmonella strains, all with the same PFGE type, have been repeatedly isolated from the surface water in the same region in California (Gorski et al., 2013). These previous findings demonstrate that the diversity of Salmonella varies by space and sub-regions. These findings indicate that not only did Salmonella levels (under specific weather conditions) differ significantly between Florida regions, but that the composition and diversity of the Salmonella populations also differed substantially.
Weather Was an Important Driver Across All Three Microbial Targets
Bayesian regression indicates that microbial targets considered showed evidence of seasonal patterns (Figure 1, Tables 1, 2). The E. coli levels were 0.33 (95% CI = −0.54, −0.09) log10 MPN/100 mL lower in spring than in fall; the differences between summer and fall, and winter and fall were negligible and of indeterminate direction based on PD and ROPE. Odds of total coliform levels being above the upper LOD was higher in summer (OR = 2.27; 95% CI = 0.60, 7.82), and lower in spring (OR = 0.51; 95% CI = 0.17, 1.59) and winter (OR = 0.28; 95% CI = 0.09, 0.85) based on the PS (probability of significance) index being ≥0.75, indicating the observed effect is both non-negligible and in the direction indicated by MAP. Based on the PS from the Bayesian regression, the likelihood of Salmonella detection was higher in spring, summer, and winter compared with fall, but that Salmonella levels (in Salmonella positive samples) were only higher in summer compared with fall (Table 2). Overall, the identification of seasonal patterns in water quality is consistent with the literature (Carter et al., 1987; Haley et al., 2009; Gorski et al., 2011; Cooley et al., 2014). For example, Haley et al. (2009) found that Salmonella concentrations in Georgia surface waters were significantly higher in the summer months compared with other seasons (P < 0.05). While other Florida studies either did not sample in Summer due to fewer crops or found no association with summer, the results from this and previous studies suggest an elevated risk during the summer months and therefore, future work will need to test this hypothesis.
Conditional inference tree analysis indicates that water temperature may drive seasonal trends in total coliform and Salmonella concentrations, and Salmonella detection (Figures 2, 3). Across all three trees, warmer water temperatures were associated with elevated levels or an increased likelihood of detecting the target (Figures 2, 3). This is consistent with past studies reporting seasonal trends in microbial water quality and linked elevated temperatures with an increased likelihood of detecting foodborne pathogens (Polo et al., 1999; Martinez-Urtaza et al., 2004; Haley et al., 2009; Huang et al., 2014; Antaki et al., 2016; Liu et al., 2018). Haley et al. (2009) and Antaki et al. (2016) both note higher Salmonella concentrations when water temperatures are warmer in Georgia, USA. Higher Salmonella detection in water samples collected seasonally from 34 locations along the Puzih River in Taiwan rates in the summer coincided with higher air and water temperatures (Huang et al., 2014). Since conditional trees can visualize hierarchical relationships, it is of interest that in the present study, the primary split for indicator organisms like total coliforms and generic E. coli were based on region and water type (Figures 3, 4), while the primary split for Salmonella was based on weather (Figure 2). Across all three microbial targets, splits for land use are below those for region and water type, which indicates that the land-use relationships identified here were based on region and or water type-specific (Figures 2–4). The tree analysis indicates that E. coli levels were highest in North Florida (lakes and rivers), and lowest in South Florida (canal) sites, with more than ~3% of the land (in a 366 m buffer) under developed cover. Conversely, when water temperatures were higher, Salmonella levels were higher regardless of region, and only at lower water temperatures did Salmonella levels begin to differ between regions (with levels in samples from South Florida being higher, compared with levels from North Florida; Figure 2). According to the tree analysis, the likelihood of Salmonella detection was only dependent on on-air temperature, with no differences between regions (air and water temperature are correlated). The relationships identified in the total coliform tree are more complex, with the highest levels being observed in South Florida (canals) when samples were collected with developed cover (in a 1,098 m buffer) above ~6% and the water temperature was above ~27°C; and in North Florida (river, lake) when samples were collected from water temperature above ~24°C and forest-wetland cover (in a 1,098 m buffer) was above ~63% (Figure 3). Overall, the fact that the first split in the Salmonella tree was based on weather indicates a stronger effect of weather than of region or water type on microbial water quality. The opposite conclusion can be made about land use in the present study, since (i) land use variables were all lower in the trees and thus dependent on specific weather and either region/water type conditions being met. These findings suggest that, for Florida, weather conditions may be useful for monitoring when food safety hazards are more likely to be present in agricultural waterways. Additional research is needed to confirm this finding as previous studies, have found varying pathogen-temperature relationships, and that those relationships are complex based on spatiotemporal factors (e.g., year or site of sample collection) (McEgan et al., 2013; Topalcengiz et al., 2017; Weller et al., 2020b). Weller et al. (2020b) compared pathogen levels between Arizona and New York found a positive relationship between temperature and likelihood of detecting Salmonella in Arizona, but a complex, polynomial relationship in New York.
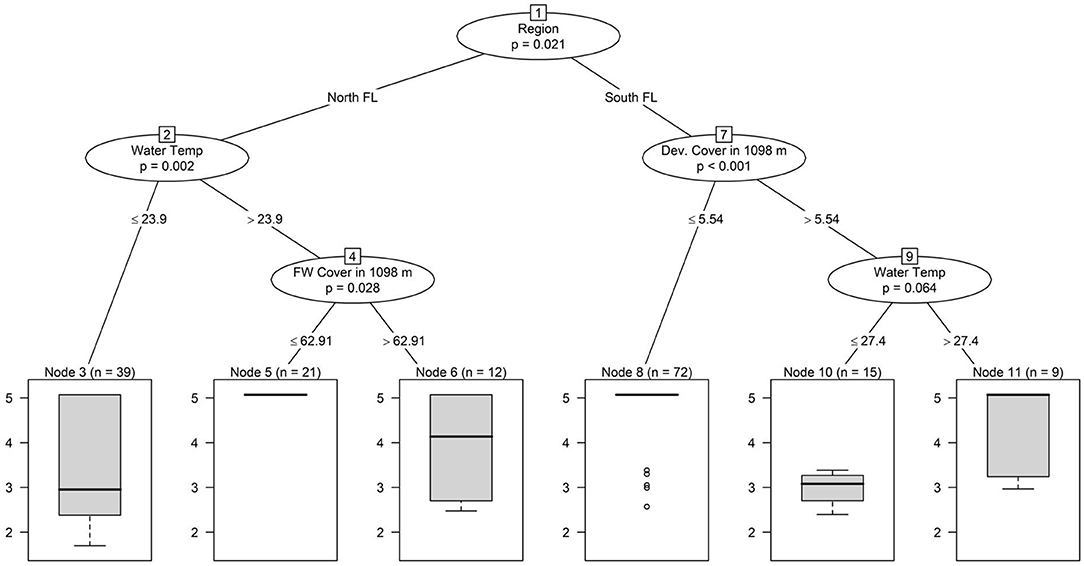
Figure 3. Conditional inference tree showing hierarchical associations between environmental factors and log10 total coliform levels (MPN/100 mL); for samples above the upper limit of detection (LOD) a value of 1.5*LOD was used.
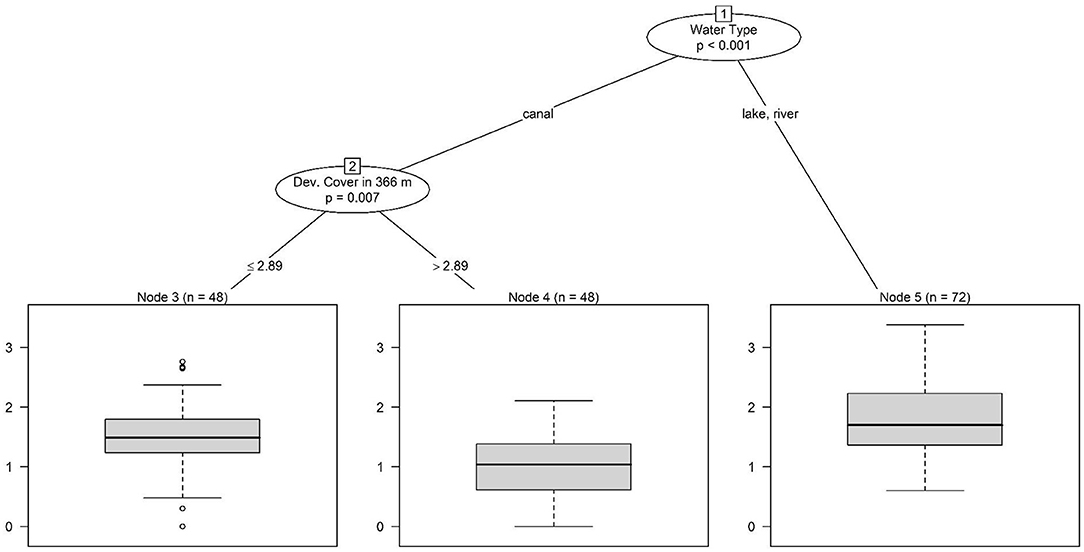
Figure 4. Conditional inference tree showing hierarchical associations between environmental factors and log10 E. coli levels (MPN/100 mL); note since lakes and rivers were samples in North Florida and canals in South Florida, region, and water type are interchangeable as the first split.
Salmonella Levels Were Not Associated With E. coli Levels in the Present Study
The PSR proposed microbial standards for pre-harvest agricultural water and are under review at the time of writing this manuscript. Currently, the PSR standards require (i) that agricultural surface water used during production establish a microbial water quality profile (MWQP) using 20 samples collected over 2 to 4 years on a rolling basis, and (ii) that geometric mean (GM) and statistical threshold value (STV) of E. coli in this sample be ≤ 126 and ≤ 410 CFUs/100 mL, respectively (US Food Drug Administration, 2015). An MWQP for each site could not be created in the present study as we did not collect 20 samples over 2–4 years, we were able to compare the likelihood of Salmonella detection and Salmonella concentration in Salmonella-positive samples to E. coli levels in the same samples. E. coli levels in individual samples were more likely to exceed both PSR mean (OR = 5.43; 95% CI = 1.19, 52.52) and STV (OR = 4.22; 95% CI = 0.56, 47.22) cut-offs in North Florida than South Florida (Table 1). Salmonella levels in Salmonella positive samples were not associated with log10 E. coli levels (as a continuous factor) or if the E. coli levels exceeded (or failed to exceed) the PSR cut-offs (Table 1). Odds of Salmonella detection was not associated with log10 E. coli levels or if the levels exceeded the PSR mean cut-off; odds of Salmonella detection was 2.54 higher (95% CI = 0.66, 8.75) in samples that exceeded the PSR STV cut-off than in samples that met the cut-off. The association between E. coli levels and foodborne pathogen presence in agricultural water is consistent with some studies reporting an association and others failing to detect an association (Harwood et al., 2005; McEgan et al., 2013; Pachepsky et al., 2016; Truitt et al., 2018). McEgan et al. (2013) found that the presence and strength of the E. coli and Salmonella relationship differed between sites in the same region of Central Florida. E. coli was an adequate predictor of the presence of Salmonella in 150 mL samples in West Central Florida ponds; when E. coli populations were higher, Salmonella presence was more likely, but the relationship between populations differed between ponds (Havelaar et al., 2017; Topalcengiz et al., 2017). The results presented here support the conclusion from earlier studies that E. coli levels are unreliable as an indicator for the presence and concentration of microbial hazards in agricultural water. As E. coli is an indicator of fecal contamination and not an index for pathogen presence, this aligns with traditional convention.
Conclusion
The goals of the study were to characterize and compare (1) the associations between microbial water quality, including pathogen presence and environmental factors (e.g., water quality, weather, land use) in North and South Florida waterways; and (2) Salmonella diversity in North and South Florida waterways. While drivers of microbial water quality can differ between intrastate growing regions (e.g., North versus South Florida); this conclusion must be interpreted cautiously as reported differences may also be due to the fact that the predominant water sources used in North (i.e., river, lake) and South (i.e., canals) Florida differ. Despite this limitation, this study highlights the heterogeneity inherent to freshwater environments, and the need for the improved understanding of pathogen ecology for specific, intrastate produce growing regions. Future studies are needed to untangle the relative contribution of the intrastate growing region and water type to the type of differences reported here. This understanding will help with the development of evidence-based risk management strategies for producing safety risks associated with pre-harvest surface water use. This study also highlights the need for alternative approaches for assessing the presence of potential food safety hazards in agricultural water.
Data Availability Statement
The raw data supporting the conclusions of this article will be made available by the authors, without undue reservation.
Author Contributions
CM, DW, and LS: data analysis and manuscript writing. TC: sample collection, laboratory analysis, and manuscript writing. RM and LG: experimental design. SG: sample collection and laboratory analysis. LF: laboratory analysis. KS: experimental design and manuscript writing. MD: experimental design, data analysis, and manuscript writing. All authors contributed to the article and approved the submitted version.
Funding
This work was supported by the Specialty Crops Research Initiative projects 2008-51180-04846, 2011-51181-30767, and 2019-51181-30016 from the US Department of Agriculture National Institute of Food and Agriculture.
Author Disclaimer
Any opinions, findings, conclusions, or recommendations expressed in this publication are those of the author(s) and do not necessarily reflect the view of the US Department of Agriculture.
Conflict of Interest
The authors declare that the research was conducted in the absence of any commercial or financial relationships that could be construed as a potential conflict of interest.
Publisher's Note
All claims expressed in this article are solely those of the authors and do not necessarily represent those of their affiliated organizations, or those of the publisher, the editors and the reviewers. Any product that may be evaluated in this article, or claim that may be made by its manufacturer, is not guaranteed or endorsed by the publisher.
Acknowledgments
We are grateful for the technical assistance of Ashwathy Sreedharan, Alina Balaguero, Susanna Richardson, and Lorraine Rodriguez-Rivera, for the North Florida sample collection and laboratory analysis, and to Gwen Lundy, Luis Martinez, and Karen Plant for the South Florida sample collection and laboratory analysis.
Supplementary Material
The Supplementary Material for this article can be found online at: https://www.frontiersin.org/articles/10.3389/frwa.2021.750673/full#supplementary-material
References
American Public Health Association (1992). Water Environment Federation: Standard Methods for the Examination of Water and Wastewater, 18th Edn, eds A. E. Clesceri, L. S. Eaton, AD. Washington, DC: APHA.
Andrews, W. H., Acobson, A., and Hammack, T. (2011). Bacteriological Analytical Manual (BAM). Chapter 5 Salmonella. Available online at: https://www.fda.gov/food/laboratory-methods-food/bacteriological-analytical-manual-bam-chapter-5-salmonella (accessed April 20, 2020).
Antaki, E. M., Vellidis, G., Harris, C., Aminabadi, P., Levy, K., and Jay-Russell, M. T. (2016). Low concentration of Salmonella enterica and generic Escherichia coli in farm ponds and irrigation distribution systems used for mixed produce production in southern Georgia. Foodborne Pathog Dis. 13, 551–558. doi: 10.1089/fpd.2016.2117
Atwill, E. R., Chase, J. A., Oryang, D., Bond, R. F., Koike, S. T., Cahn, M. D., et al. (2015). Transfer of Escherichia coli O157:H7 from simulated wildlife scat onto romaine lettuce during foliar irrigation. J. Food Protect. 78, 240–247. doi: 10.4315/0362-028X.JFP-14-277
Bürkner, P. C. (2017a). Advanced bayesian multilevel modeling with the R package brms. arXiv [Preprint] arXiv:1705.11123. doi: 10.32614/RJ-2018-017
Bürkner, P. C. (2017b). brms: an R package for Bayesian multilevel models using Stan. J. Stat. Softw. 80, 1–28. doi: 10.18637/jss.v080.i01
California Leafy Greens Marketing Agreement (2020). California LGMA Commodity Specific Food Safety Guidelines. California Leafy Greens Marketing Agreement. Available online at: https://lgmatech.com/wp-content/uploads/2020/08/CA-LGMA-Metrics-August-2020_Final_Clean_9-18-20.pdf
Carter, A., Pacha, R. E., Clark, G. W., and Williams, E. (1987). Seasonal occurrence of Campylobacter spp. in surface waters and their correlation with standard indicator bacteria. Appl. Environ. Microbiol. 53, 523–526. doi: 10.1128/aem.53.3.523-526.1987
Chapin, T. K., Nightingale, K. K., Worobo, R. W., Wiedmann, M., and Strawn, L. K. (2014). Geographical and meteorological factors associated with isolation of Listeria species in New York State produce production and natural environments. J. Food Protect. 77, 1919–1928. doi: 10.4315/0362-028X.JFP-14-132
Cooley, M. B., Quiñones, B., Oryang, D., Mandrell, R. E., and Gorski, L. (2014). Prevalence of shiga toxin producing Escherichia coli, Salmonella enterica, and Listeria monocytogenes at public access watershed sites in a California Central Coast agricultural region. Front. Cell. Infect. Microbial. 4:30. doi: 10.3389/fcimb.2014.00030
Cowburn, J., Goodall, T., Fricker, E., Walter, K., and Fricker, C. (1994). A preliminary study of the use of colilert for water quality monitoring. Lett. Appl. Microbiol. 19, 50–52. doi: 10.1111/j.1472-765X.1994.tb00902.x
Erickson, M. C., Webb, C. C., Diaz-Perez, J. C., Phatak, S. C., Silvoy, J. J., Davey, L., et al. (2010). Surface and internalized Escherichia coli O157:H7 on field-grown spinach and lettuce treated with spray-contaminated irrigation water. J. Food Protect. 73, 1023–1029. doi: 10.4315/0362-028X-73.6.1023
Fatica, M. K., and Schneider, K. R. (2011). Salmonella and produce: survival in the plant environment and implications in food safety. Virulence 2, 573–579. doi: 10.4161/viru.2.6.17880
Fricker, C., Warden, P., Desarno, M., and Eldred, B. (2010). Significance of Methods and Sample Volumes for E. coli and Total Coliform Measurements. Available online at: http://www.waterrf.org/publicreportlibrary/4024.pdf (accessed April 25, 2020).
Gorski, L., Jay-Russell, M. T., Liang, A. S., Walker, S., Bengson, Y., Govoni, J., et al. (2013). Diversity of pulsed-field gel electrophoresis pulsotypes, serovars, and antibiotic resistance among Salmonella isolates from wild amphibians and reptiles in the California central coast. Foodborne Pathog. Dis. 10, 540–548. doi: 10.1089/fpd.2012.1372
Gorski, L., Parker, C. T., Liang, A., Cooley, M. B., Jay-Russell, M. T., Gordus, A. G., et al. (2011). Prevalence, distribution, and diversity of Salmonella enterica in a major produce region of California. Appl. Environ. Microbiol. 77, 2734–2748. doi: 10.1128/AEM.02321-10
Greene, S., Daly, E., Talbot, E., Demma, L., Holzbauer, S., Patel, N., et al. (2008). Recurrent multistate outbreak of Salmonella newport associated with tomatoes from contaminated fields, 2005. Epidemiology. Infect. 136, 157–165. doi: 10.1017/S095026880700859X
Gronewold, A. D., and Wolpert, R. L. (2008). Modeling the relationship between most probable number (MPN) and colony-forming unit (CFU) estimates of fecal coliform concentration. Water Res. 42, 3327–3334. doi: 10.1016/j.watres.2008.04.011
Gu, G., Strawn, L. K., Oryang, D. O., Zheng, J., Reed, E. A., Ottesen, A. R., et al. (2018). Agricultural practices influence Salmonella contamination and survival in pre-harvest tomato production. Front. Microbiol. 9:2451. doi: 10.3389/fmicb.2018.02451
Gu, G., Strawn, L. K., Zheng, J., Reed, E. A., and Rideout, S. L. (2019). Diversity and dynamics of Salmonella enterica in water sources, poultry litters, and field soils amended with poultry litter in a major agricultural area of Virginia. Front. Microbiol. 10:2868. doi: 10.3389/fmicb.2019.02868
Haley, B. J., Cole, D. J., and Lipp, E. K. (2009). Distribution, diversity, and seasonality of waterborne Salmonellae in a rural watershed. Appl. Environ. Microbiol. 75, 1248–1255. doi: 10.1128/AEM.01648-08
Hargett, E., and Goyn, L. (2004). Modified mTEC agar, Colilert®, and M-FC Agar–Field Trial Comparison of Bacteria Enumeration Methods in Surface Waters of Eastern Wyoming. Available online at: http://deq.wyoming.gov/media/attachments/Water%20Quality/Surface%20Water%20Monitoring/Publications/wqd-wpp-monitoring_comp_study_e.coli_final2.pdf (accessed April 25, 2020).
Harwood, V. J., Levine, A. D., Scott, T. M., Chivukula, V., Lukasik, J., Farrah, S. R., et al. (2005). Validity of the indicator organism paradigm for pathogen reduction in reclaimed water and public health protection. Appl. Environ. Microbiol. 71, 3163–3170. doi: 10.1128/AEM.71.6.3163-3170.2005
Havelaar, A. H., Vazquez, K. M., Topalcengiz, Z., Muñoz-Carpena, R., and Danyluk, M. D. (2017). Evaluating the US food safety modernization act produce safety rule standard for microbial quality of agricultural water for growing produce. J. Food Prot. 80, 1832–1841. doi: 10.4315/0362-028X.JFP-17-122
Huang, K.-H., Hsu, B.-M., Chou, M.-Y., Tsai, H.-L., Kao, P.-M., Wang, H.-J., et al. (2014). Application of molecular biological techniques to analyze Salmonella seasonal distribution in stream water. FEMS Microbiol. Lett. 352, 87–96. doi: 10.1111/1574-6968.12381
Ijabadeniyi, O. A., Debusho, L. K., Vanderlinde, M., and Buys, E. M. (2011). Irrigation water as a potential preharvest source of bacterial contamination of vegetables. J. Food Saf. 31, 452–461. doi: 10.1111/j.1745-4565.2011.00321.x
Ishii, S., and Sadowsky, M. J. (2008). Escherichia coli in the environment: implications for water quality and human health. Microb. Environ. 23, 101–108. doi: 10.1264/jsme2.23.101
Jang, J., Hur, H. G., Sadowsky, M. J., Byappanahalli, M., Yan, T., and Ishii, S. (2017). Environmental Escherichia coli: ecology and public health implications—a review. J. Appl. Microbiol. 123, 570–581. doi: 10.1111/jam.13468
Jeamsripong, S., Chase, J. A., Jay-Russell, M. T., Buchanan, R. L., and Atwill, E. R. (2019). Experimental in-field transfer and survival of Escherichia coli from animal feces to romaine lettuce in Salinas Valley, California. Microorganisms 7:408. doi: 10.3390/microorganisms7100408
Klontz, K. C., Klontz, J. C., Mody, R. K., and Hoekstra, R. M. (2010). Analysis of tomato and jalapeño and serrano pepper imports into the United States from Mexico before and during a national outbreakof Salmonella serotype saintpaul infections in 2008. J. Food Protect. 73, 1967–1974. doi: 10.4315/0362-028X-73.11.1967
Lee, D., Tertuliano, M., Harris, C., Vellidis, G., Levy, K., and Coolong, T. (2019). Salmonella survival in soil and transfer onto produce via splash events. J. Food Protect. 82, 2023–2037. doi: 10.4315/0362-028X.JFP-19-066
Liao, J., Guo, X., Weller, D. L., Pollak, S., Buckley, D. H., Wiedmann, M., et al. (2021). Nationwide genomic atlas of soil-dwelling Listeria reveals effects of selection and population ecology on pangenome evolution. Nat. Microbiol. 6, 1021–1030. doi: 10.1038/s41564-021-00935-7
Liu, H., Whitehouse, C. A., and Li, B. (2018). Presence and persistence of Salmonella in water: the impact on microbial quality of water and food safety. Front. Public Health 6:159. doi: 10.3389/fpubh.2018.00159
Luo, Z., Gu, G., Ginn, A., Giurcanu, M. C., Adams, P., Vellidis, G., et al. (2015). Distribution and characterization of Salmonella enterica isolates from irrigation ponds in the southeastern United States. Appl. Environ. Microbiol. 81, 4376–4387. doi: 10.1128/AEM.04086-14
Makowski, D., Ben-Shachar, M. S., Chen, S., and Lüdecke, D. (2019a). Indices of effect existence and significance in the bayesian framework. Front. Psychol. 10:2767. doi: 10.3389/fpsyg.2019.02767
Makowski, D., Ben-Shachar, M. S., and Lüdecke, D. (2019b). bayestestR: describing effects and their uncertainty, existence and significance within the bayesian framework. J. Open Source Softw. 4:1541. doi: 10.21105/joss.01541
Malorny, B., Hoorfar, J., Bunge, C., and Helmuth, R. (2003). Multicenter validation of the analytical accuracy of Salmonella PCR: towards an international standard. Appl. Environ. Microbiol. 69, 290–296. doi: 10.1128/AEM.69.1.290-296.2003
Martinez-Urtaza, J., Saco, M., De Novoa, J., Perez-Piñeiro, P., Peiteado, J., Lozano-Leon, A., et al. (2004). Influence of environmental factors and human activity on the presence of Salmonella serovars in a marine environment. Appl. Environ. Microbiol. 70, 2089–2097. doi: 10.1128/AEM.70.4.2089-2097.2004
McEgan, R., Chandler, J. C., Goodridge, L. D., and Danyluk, M. D. (2014). Diversity of Salmonella isolates from central Florida surface waters. Appl. Environ. Microbiol. 80, 6819–6827. doi: 10.1128/AEM.02191-14
McEgan, R., Mootian, G., Goodridge, L. D., Schaffner, D. W., and Danyluk, M. D. (2013). Predicting Salmonella populations from biological, chemical, and physical indicators in Florida surface waters. Appl. Environ. Microbiol. 79, 4094–4105. doi: 10.1128/AEM.00777-13
Miles, J. M., Sumner, S. S., Boyer, R. R., Williams, R. C., Latimer, J. G., and Mckinney, J. M. (2009). Internalization of Salmonella enterica serovar montevideo into greenhouse tomato plants through contaminated irrigation water or seed stock. J. Food Protect. 72, 849–852. doi: 10.4315/0362-028X-72.4.849
Pachepsky, Y., Shelton, D., Dorner, S., and Whelan, G. (2016). Can E. coli or thermotolerant coliform concentrations predict pathogen presence or prevalence in irrigation waters? Crit. Rev. Microbiol. 42, 384–393. doi: 10.3109/1040841X.2014.954524
Park, S., Szonyi, B., Gautam, R., Nightingale, K., Anciso, J., and Ivanek, R. (2012). Risk factors for microbial contamination in fruits and vegetables at the preharvest level: a systematic review. J. Food Protect. 75, 2055–2081. doi: 10.4315/0362-028X.JFP-12-160
Patchanee, P., Molla, B., White, N., Line, D. E., and Gebreyes, W. A. (2010). Tracking Salmonella contamination in various watersheds and phenotypic and genotypic diversity. Foodborne Pathog. Dis. 7, 1113–1120. doi: 10.1089/fpd.2010.0572
Polo, F., Figueras, M., Inza, I., Sala, J., Fleisher, J. M., and Guarro, J. (1999). Prevalence of Salmonella serotypes in environmental waters and their relationships with indicator organisms. Antonie Van Leeuwenhoek 75, 285–292. doi: 10.1023/A:1001817305779
Purdum, E. D., Krafft, P. A., Anderson, J., Bartos, B., McPherson, S., Penson, G., et al. (2002). Florida Water: A Water Resources Manual From Florida's Water Managemnet District. Available online at: https://www.sfwmd.gov/sites/default/files/documents/florida_waters.pdf (accessed November 9, 2021).
Rodrigues, C., Da Silva, A. L. B. R., and Dunn, L. L. (2020). Factors impacting the prevalence of foodborne pathogens in agricultural water sources in the southeastern United States. Water 12:51. doi: 10.3390/w12010051
Strawn, L. K., Danyluk, M. D., Worobo, R. W., and Wiedmann, M. (2014). Distributions of Salmonella subtypes differ between two US produce-growing regions. Appl. Environ. Microbiol. 80, 3982–3991. doi: 10.1128/AEM.00348-14
Strawn, L. K., Fortes, E. D., Bihn, E. A., Nightingale, K. K., Gröhn, Y. T., Worobo, R. W., et al. (2013a). Landscape and meteorological factors affecting prevalence of three food-borne pathogens in fruit and vegetable farms. Appl. Environ. Microbiol. 79, 588–600. doi: 10.1128/AEM.02491-12
Strawn, L. K., Gröhn, Y. T., Warchocki, S., Worobo, R. W., Bihn, E. A., and Wiedmann, M. (2013b). Risk factors associated with Salmonella and Listeria monocytogenes contamination of produce fields. Appl. Environ. Microbiol. 79, 7618–7627. doi: 10.1128/AEM.02831-13
Topalcengiz, Z., Strawn, L. K., and Danyluk, M. D. (2017). Microbial quality of agricultural water in Central Florida. PLoS ONE 12:e0174889. doi: 10.1371/journal.pone.0174889
Truitt, L. N., Vazquez, K. M., Pfuntner, R. C., Rideout, S. L., Havelaar, A. H., and Strawn, L. K. (2018). Microbial quality of agricultural water used in produce preharvest production on the eastern shore of Virginia. J. Food Protect. 81, 1661–1672. doi: 10.4315/0362-028X.JFP-18-185
US Food Drug Administration (2015). Standards for the growing, harvesting, packing, and holding of produce for human consumption. Fed. Regist. 80, 74353–74642. Available online at: https://www.govinfo.gov/content/pkg/FR-2015-11-27/pdf/2015-28159.pdf (accessed September 11, 2020).
Weller, D., Belias, A., Green, H., Roof, S., and Wiedmann, M. (2020a). Landscape, water quality, and weather factors associated with an increased likelihood of foodborne pathogen contamination of New York streams used to source water for produce production. Front. Sust. Food Syst. 3:124. doi: 10.3389/fsufs.2019.00124
Weller, D., Brassill, N., Rock, C., Ivanek, R., Mudrak, E., Roof, S., et al. (2020b). Complex interactions between weather, and microbial and physicochemical water quality impact the likelihood of detecting foodborne pathogens in agricultural water. Front. Microbiol. 11:134. doi: 10.3389/fmicb.2020.00134
Weller, D., Wiedmann, M., and Strawn, L. K. (2015). Spatial and temporal factors associated with an increased prevalence of Listeria monocytogenes in spinach fields in New York State. Appl. Environ. Microbiol. 81, 6059–6069. doi: 10.1128/AEM.01286-15
Weller, D. L., Love, T. M., Belias, A., and Wiedmann, M. (2020c). Predictive models may complement or provide an alternative to existing strategies for assessing the enteric pathogen contamination status of northeastern streams used to provide water for produce production. Front. Sust. Food Syst. 4:151. doi: 10.3389/fsufs.2020.561517
Weller, D. L., Love, T. M., and Wiedmann, M. (2021). Interpretability versus accuracy: a comparison of machine learning models built using different algorithms, performance measures, and features to predict E. coli levels in agricultural water. Front. Artif. Intell. 4:628441. doi: 10.3389/frai.2021.628441
Keywords: Salmonella, E. coli, surface water, fecal indicator bacteria, food safety, produce safety
Citation: Murphy CM, Strawn LK, Chapin TK, McEgan R, Gopidi S, Friedrich L, Goodridge LD, Weller DL, Schneider KR and Danyluk MD (2022) Factors Associated With E. coli Levels in and Salmonella Contamination of Agricultural Water Differed Between North and South Florida Waterways. Front. Water 3:750673. doi: 10.3389/frwa.2021.750673
Received: 31 July 2021; Accepted: 16 November 2021;
Published: 02 February 2022.
Edited by:
Stefanie Lutz, Utrecht University, NetherlandsReviewed by:
Vasiliki Syngouna, University of Patras, GreeceCamila Rodrigues, Auburn University, United States
Copyright © 2022 Murphy, Strawn, Chapin, McEgan, Gopidi, Friedrich, Goodridge, Weller, Schneider and Danyluk. This is an open-access article distributed under the terms of the Creative Commons Attribution License (CC BY). The use, distribution or reproduction in other forums is permitted, provided the original author(s) and the copyright owner(s) are credited and that the original publication in this journal is cited, in accordance with accepted academic practice. No use, distribution or reproduction is permitted which does not comply with these terms.
*Correspondence: Michelle D. Danyluk, bWRkYW55bHVrQHVmbC5lZHU=