 Carola Bänziger
 Ariane Schertenleib1
 Sara J. Marks
- 1EAWAG, Swiss Federal Institute of Aquatic Science and Technology, Dübendorf, Switzerland
- 2Helvetas Swiss Intercooperation, Kathmandu, Nepal
Risk-based water safety interventions are one approach to improve drinking water quality and consequently reduce the number of people consuming faecally contaminated water. Despite broad acceptance of water safety planning approaches globally, there is a lack of evidence of their effectiveness for community-managed piped water supplies in rural areas of developing countries. Our research, in the form of a cluster-based controlled pre-post intervention analysis, investigated the impact of a combined water safety intervention on outcomes of microbial water quality, users' perceptions and piped system functionality in rural Nepal. The study enrolled 21 treatment systems and 12 control systems across five districts of the Karnali and Sudurpaschim provinces. Treatment group interventions included field laboratories for microbial analysis, regular monitoring of water quality including sanitary inspections, targeted treatment and infrastructure improvements, household hygiene and water filter promotion, and community training. In certain systems, regular system-level chlorination was implemented. Before and after the interventions, the microbial water quality was measured at multiple points within the water system. This information was complemented by household interviews and sanitary inspections. The main result to emerge from this study is that chlorination is the only identified intervention that led to a significant reduction in E. coli concentration at the point of consumption. Secondly, the effectiveness of other interventions was presumably reduced due to higher contamination at endline in general, brought about by the monsoon. All the interventions had a positive impact on users' perceptions about their water system, as measured by expectations for future functionality, satisfaction with the services received, and awareness of the potential health risks of drinking contaminated water. For future applications we would recommend the more broadly applied use of chlorination methods at system level as a key component of the package of risk-based water safety interventions.
Introduction
Access to safe drinking water is a basic human right still denied to many. In 2017, 93% of the global population had access to an improved drinking water source, while 579 million people still used unimproved sources such as unprotected springs, open wells and surface water (WHO/UNICEF Joint Monitoring Programme, 2019). However, an improved water source does not always ensure adequate drinking water quality (Bain et al., 2014a; Shaheed et al., 2014). Although improved sources such as piped supplies or protected point sources have the potential to deliver safe water by nature of their design and construction (WHO/UNICEF Joint Monitoring Programme, 2019), this alone does not guarantee safe water.
In order to reliably assess the safety of drinking water, data on its microbial quality is necessary (Baum et al., 2014). However, many countries lack representative data on drinking water quality (WHO/UNICEF Joint Monitoring Programme, 2019). It has been estimated that around 10% of improved water sources are heavily faecally contaminated, with >100 Escherichia coli (E. coli) colony forming units (CFU)/100 mL (Bain et al., 2014b). This corresponds to 1.8 billion people globally using a faecally contaminated drinking water source (Bain et al., 2014b). These studies suggest that having access to an improved source is not enough to ensure safe drinking water and meet the global target 6.1 of the Sustainable Development Goals (SDGs) to “achieve universal and equitable access to safe and affordable drinking water for all” by 2030. To meet the criteria, households must use an improved water source that is accessible on premises, available when needed, and free from fecal and priority chemical contamination (WHO/UNICEF Joint Monitoring Programme, 2019).
This study focuses on rural communities in Karnali and Sudurpaschim provinces, in Western Nepal, where the majority of the population relies on a faecally contaminated drinking water source (WHO/UNICEF Joint Monitoring Programme, 2019). Nepal had 29.3 million inhabitants in 2017, of which 81% were living in rural areas (WHO/UNICEF Joint Monitoring Programme, 2019). The Human Development Index ranks Nepal 147th out of 189 countries and territories (UNDP, 2019). Although the majority of people in Nepal have water on premises (65%) and available when needed (82%), only 29% of the population had access to a water source free from E. coli contamination at the point of collection in 2014 (WHO/UNICEF Joint Monitoring Programme, 2019). Water quality deteriorates further at point of consumption, leaving only 18% of the population with safe water (WHO/UNICEF Joint Monitoring Programme, 2019).
10% of the country's population are children under the age of 5 years (Government of Nepal, 2017). Diarrhea is one of the most common illnesses among children in Nepal and continues to be a major cause of childhood morbidity and mortality (Government of Nepal, 2018). The diarrhea prevalence among children under the age of 5 was 8% in 2016 (Government of Nepal, 2017), with the highest incidence in the Karnali province (Government of Nepal, 2018). It is difficult to obtain precise data on childhood mortality due to diarrhoeal diseases in Nepal. However, it has been estimated that around 25% of all child deaths are associated with acute diarrhea (Bista, 2001).
To confront the health risks due to compromised water quality, risk assessment and risk management approaches have been applied to rural drinking water systems in a variety of ways and with varying degrees of success. The establishment of a water safety plan (WSP) is one mean to reduce risks of contamination (Mahmud et al., 2007) and comprises all steps of a water supply system from the catchment to the consumer (WHO, 2017a). Experience on the implementation of WSPs is mostly documented for water distribution systems managed by water utilities in high income contexts. The implementation of WSPs for small piped systems and in the context of rural areas in low- and middle-income countries (LMICs) is less described (Mahmud et al., 2007). The few existing studies showed contrasting results. While String et al. (2020) found more E. coli contamination in the WSP communities than in the non-WSP communities, Mahmud et al. (2007) observed improvements in microbial water quality related to the WSPs; however, such improvements were not uniform. Other studies mostly focused on the set-up of WSPs and how they can be adapted to rural community-managed systems (Barrington et al., 2013), or on how their impact can be measured (Kumpel et al., 2018), rather than on systematically assessing the actual impact. These studies highlighted the need for more robust and standardized methods and indicators to assess WSP outcomes and impacts (Kumpel et al., 2018).
The development literature also identified prerequisites and challenges for the implementation of WSPs in LMICs. For implementation of WSPs to be successful, community education, behavior change, and the distribution of simplified documentation are essential (Barrington et al., 2013). Capacity building, according to Ferrero et al. (2019), is a crucial factor for the successful implementation of a WSP (Ferrero et al., 2019). Others have found that financial constraints often pose challenges to the implementation of WSPs (Kumpel et al., 2018), despite WSPs being relatively inexpensive, adaptable, and requiring minimal water quality testing (Barrington et al., 2013).
The present study is motivated by the aforementioned evidence gaps regarding the requisite enabling conditions and potential benefits of risk-based water safety strategies for water supplies in remote rural areas. In the frame of this research, a combination of water safety interventions, informed by risk assessment and risk management practices with Helvetas-Nepal's Integrated Water Resource Management (IWRM) Programme, were adapted to the local context and implemented in 21 water supply systems in rural Nepal. We use a cluster-based controlled pre-post intervention design to assess the impact of this package of water safety interventions on multiple outcomes: microbial water quality, users' perception of their water services and the functionality of the water system.
Study Site And Methods
The Integrated Water Resource Management Programme
This study was conducted across five districts (Achham, Kalikot, Jajarkot, Dailekh, and Surkhet) in Sudurpaschim and Karnali provinces, in the hilly region of Nepal (see Figure 1). Between the years 2011 and 2017 Helvetas Swiss Intercooperation-Nepal (hereafter referred to as Helvetas) constructed drinking water systems (DWS) and implemented total sanitation interventions across these districts in the frame of their Integrated Water Resource Management (IWRM) Programme. In all districts, the construction of the DWS was followed by a series of interventions targeted at improving the water, sanitation and hygiene (WASH) conditions locally. Specifically, this consisted of the establishment of a water and sanitation users' committee, the promotion of improved household hygiene practices, the use of ceramic candle filters for household water treatment and safe storage, and the training of a female community health volunteer on a total sanitation approach and a village maintenance worker to operate the DWS (Marks and Shrestha, 2020). Some systems provide continuous (24 h) service, while others provide intermittent service with variable opening times and service durations throughout the year. The systems all have similar branched design layouts, consisting of a spring source connected to a reservoir tank by a distribution line, with water then flowing to private or public taps as described by Tosi Robinson et al. (2018) (Figure 2).
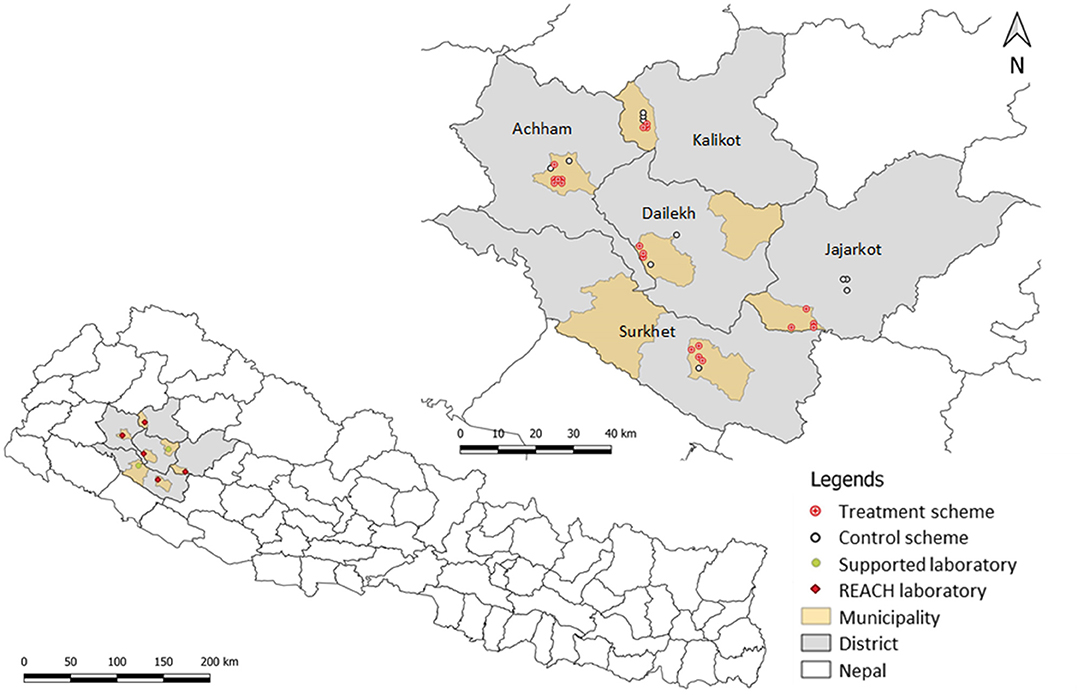
Figure 1. Map of Nepal with the five districts involved in the Integrated Water Resource Management (IWRM) Programme, showing the locations of the treatment and control drinking water systems (DWS) and the laboratories implemented for this study (REACH laboratories).
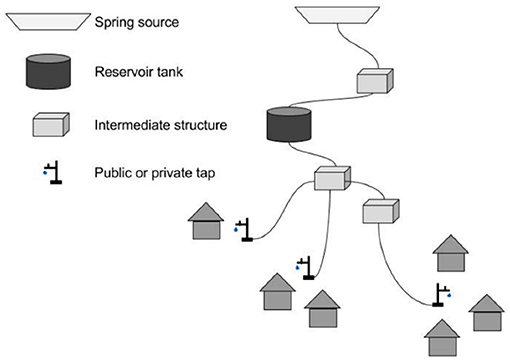
Figure 2. Sketch of a typical gravity-fed piped water system or sub-system in the study area. A water source can feed one or several reservoir tanks that distribute water to different taps. The intermediate structures can be distribution, collection, purge valve, air valve or interruption chambers, or break pressure tanks (Image source: Tosi Robinson et al., 2018).
Community Selection and Intervention Package
Within the five districts, 33 communities were selected based on the existence of a functioning DWS and the agreement of the community to participate. Within these, 21 were defined as treatment systems and 12 as control systems. System selection occurred in parallel to the planning and selection of the locations of the field laboratories. A criterion for the choice of treatment systems was the access to the nearest laboratory within 2 h ours for the furthest sampling point. Control systems were selected in such a way that they would not be affected by the interventions from treatment systems, nor influence the treatment systems themselves.
In the treatment systems, different interventions took place between pre- and post-treatment data collection. The interventions included the setting up of field laboratories for microbial analysis, regular monitoring of water quality including sanitary inspections and standard questionnaires, centralized data management, targeted infrastructure improvements such as source protection, installation of roughing sand filters in front of the reservoir tanks, chlorination of reservoir tanks, pipeline improvement and maintenance, and local watershed restoration. Further, training of community water safety task forces and laboratory technicians as well as promotion of household hygiene and ceramic candle filters for point-of-use water treatments were part of the interventions. The regular monitoring involved monthly water quality analysis of E. coli and total coliform concentrations, visual turbidity, pH and free residual chlorine at one reservoir tank, one tap and one corresponding household per system. Quarterly sanitary inspections were collected at the protected spring, reservoir tank, tap and household, and brief household surveys were conducted during each inspection round. A subset of six systems, minimum one per district, were selected to receive regular system-level chlorination, either delivered manually in reservoir tanks or automatically using passive chlorinator devices. In the control systems, none of the interventions described above was implemented.
Data Collection
The study included data collection at both pre-treatment (April–June 2018) and post-treatment time points (August–October 2019), hereafter referred to as baseline and endline. The study design was akin to that of Tosi Robinson et al., 2018. The field teams were composed of staff members of Eawag, Helvetas, and local non-governmental organizations (NGOs). The teams conducted household and key informant interviews, collected a water sample (100 mL) in each of the interviewed households at the point of consumption, and performed sanitary inspections. The sanitary inspections were carried out in each system of the reservoir tank(s), the pipelines, taps, and if present, structures like roughing sand filter, break pressure tank, distribution chamber and intake. Water samples were collected during the sanitary inspections at the inlet of all reservoir tanks, six randomly selected taps, and from other structures (for example, inlet of roughing sand filter and distribution chamber) if present and accessible.
Household Surveys
From each of the 33 water systems, a random selection of 15 households was enrolled resulting in a total of 493 surveys (in one system it was not possible to reach 15). All the questionnaires were translated to and conducted in Nepali using tablets (Samsung Galaxy Tab A, Seoul, Korea) with ODK software (open data kit, https://www.opendatakit.org/). Only households using the IWRM Programme drinking water system were interviewed. Eligible households were selected randomly from the village's household list and enrolled following informed consent about the Programme's purpose and anonymity of the questionnaire. At the study baseline, if the household declined to participate in the study or if no adult was available at the time of the visit, another household was selected randomly as a replacement. During the endline period, enumerators requested to interview the same person as during baseline. If this person was not available, another person from the same household was interviewed. If nobody within the same household was present (e.g., due to migration of the entire household), a neighboring household was interviewed. The survey questions probed the households' drinking water supply characteristics, sanitation and hygiene practices, socio-economic statuses, users' perception, and sense of ownership for their water system.
Drinking Water Quality
Sample Collection
The method for water sampling and processing corresponds to the one described by Tosi Robinson et al. (2018). Briefly, in each household that participated in the survey, a 100 mL drinking water sample was collected as if study participants were providing a cup of water to drink. Water samples at the reservoir tanks were collected directly from the inlet, which is the closest point to the water source accessible for sampling; therefore, the sample collected is representative of the water entering but not of the water stored at the reservoir tank. For systems with a roughing sand filter installed upstream of the reservoir, the sample was collected at the inlet of the filter. At the taps, water was run for 30 s before sampling to wash out any deposited residue and ensure a representative sample from the piped system. All the water samples from a single system were collected on the same day in sterile 100 mL Whirl-Pak Thio-bags (Nasco, Fort Atkinson, USA) containing sodium thiosulfate to inactivate any residual chlorine.
Membrane Filtration
The samples were processed within 2 h after collection using the membrane filtration method, as described by Tosi Robinson et al. (2018). Briefly, each water sample was filtered through a sterilized filter funnel (DelAgua, UK) with a 0.45 μm Millipore cellulose membrane filter (Merck, Germany). The membrane was placed on Nissui EC Compact Dry plates (Nissui Pharmaceuticals, Japan) pre-moistened with sterile water (Nissui, 2009). The plates were incubated for 24 h at 35 +/– 2°C. The incubators used during this study were constructed as described in Schertenleib et al. (2019).
Colony Enumeration
After incubation of the EC Compact Dry plates, blue colonies were counted as E. coli colony forming units per 100 mL (CFU/100 mL) and the sum of purple and blue colonies as total coliform according to the manufacturer's instructions. Counts higher than 300 colonies per plate were reported as too numerous to count (TNTC). To estimate variation in the assay, one duplicate was performed for every seven household water samples, resulting in two household duplicates per system. In addition, a duplicate was collected from one randomly chosen scheme-level site (source, roughing sand filter, reservoir tank or tap) at each system. Positive and negative controls were processed daily.
pH and Free Residual Chlorine
Water testing included free residual chlorine (FRC) concentration and pH measurements using the Lovibond® Three-Chamber-Tester Chlorine LR-pH (Lovibond® Tintometer Group, England), following the manufacturer's instruction) for using DPD and Phenol Red. The visual test indicates pH values between 6.8 and 8.2 and chlorine concentration between 0.1 and 3.0 mg/L. Every tenth sample was processed in duplicate.
Data Analysis
Water quality, sanitary inspection and survey data were compiled and cleaned using Microsoft Excel 10 (Microsoft, Redmond, WA, USA). Coding and statistical tests of intervention effects were performed using IBM SPSS Statistics 25 (IBM, New York, NY, USA). For the bivariate analysis, microbial data were log-transformed after non-detect samples were set to half of the lower limit of detection (0.5 CFU/100 mL) and TNTC values were set to 300 CFU/100 mL. The central tendency of microbial concentrations and other variables are reported in terms of mean, standard deviation, and median values. Non-parametric tests (Wilcoxon signed-rank test, Mann-Whitney test and Spearman's correlation) were used for bivariate comparisons because most variables were not normally distributed based on the Shapiro-Wilk test. The Wilcoxon signed-rank test was used for comparison between baseline and endline and the Mann-Whitney test for comparison between the different systems at one time point.
In order to identify factors associated with fecal contamination of the drinking water, an ordinal logistic regression model was estimated with E. coli risk categories as dependent variable. Based on the results of the bivariate comparisons described above, we ran the ordinal logistic regression model with a reduced selection of the independent variables and the E. coli concentration at endline in ordinal risk categories, with risk tiers from lowest to highest as follows: <1 CFU/100 mL, 1–10 CFU/100 mL, 11–100 CFU/100 mL, and >100 CFU/100 mL. The likelihood ratio Pearson chi-square test and the deviance test were both used to conduct the Goodness-of-Fit analysis.
Ethics Statement
All participants gave their oral and written informed consent before the interviews. The research was conducted in accordance with the Declaration of Helsinki, and the protocol was approved by the Eawag ethics committee (protocol 16_09_022018). The study received approval in Nepal as part of Helvetas-Nepal's IWRM research program.
Results
Description of Study Population
The 33 water systems within this study served 29–250 households [Mean (M) = 67.4, Standard Deviation (SD) = 44.0], of which we interviewed 15 each. The respondents were 67% female and on average 38.4 years old (SD = 14.2). Mean household size was 6.4 people (SD = 2.5), of which 2.7 (SD = 1.6) were children under 18 years old, and 0.82 (SD = 0.87) under 5 years old. Less than half of the study participants (44%) completed primary or higher-level education, and 16% were illiterate. In almost all households (97%) there was at least one person working in the agricultural sector. The mean monthly regular expenditures per household were 10'861 NPR (SD = 7981) [equivalent to 96 USD (SD = 74) in October 2019], ranging from 1'000 to 80'000 NPR (9–704 USD). The houses were predominantly made of stone and mud (95%) with an earth floor (95%), and a stone slate roof (56%). The majority of households had access to electricity, either through their own solar panel (83%) or through connection to an electrical grid (15%), while 6% did not have access to electricity. Water supply (34%) was the biggest concern mentioned by people living in the village at baseline, followed by transportation and roads (23%). More details about the households' characteristics are described in Supplementary Table S1 and Supplementary Table S2 in Supplementary Material.
Water Supply and Sanitation Access
Most respondents had piped water connections and access to improved sanitation. For all study systems, Helvetas had previously implemented drinking water systems and total sanitation in the frame of their IWRM Programme between the years 2011 and 2017. In all 33 study communities the water system had a branched design, with 10 having private taps and 23 having public taps shared by multiple households. The total number of taps per system ranged from 5 to 250 (M = 30.8, SD = 43.1). The water originated from 1 to 5 different sources per system. There was at least 1 and up to 6 reservoir tanks per system (see Supplementary Table S3 for more details). Households most commonly reported their main drinking water source to be piped village connections (71%) and piped household connections (26%). Other sources included protected sources, unmanaged piped waters, open sources, rainwater or river water (see Supplementary Table S2 for additional information on main drinking water sources used). The average round trip time for gathering water was 10.7 min (SD = 8.5), with extremes ranging from 1 to 65 min, including time required for queuing and filling the containers. In addition to the main system, some respondents (21%) reported also using other sources for drinking water. Among these households, their main reasons for source switching were intermittent supply (52%), seasonal unavailability (33%), and closer proximity to another source (12%).
Most of the households had their own ventilated improved pit latrine (80%) and only one interviewed household indicated practicing open defecation at endline. About half of all interviewed households reported keeping their animals overnight in the same house where they lived (see Supplementary Table S4 for more information).
Baseline to Endline Comparison
Water Quality
Point of Consumption
The visually assessed turbidity at the point of consumption at endline was clear in 98.2% of the samples and somewhat turbid in 1.8% of samples. In 7.2% of the samples debris was present. The pH was on average 7.3 (SD = 0.2), ranging from 6.8 to 8.2 with a median of 7.4. With 96.3% and 99.2% of the water samples at baseline and endline having a pH lower than 8, respectively, the vast majority was within the preferable pH for effective disinfection with chlorine (WHO, 2017b).
Among all treatment systems, there was no significant difference between baseline and post-treatment E. coli concentrations at the point of consumption (Table 1). Control systems exhibited an increasing contamination trend from baseline to endline, although the difference was also not statistically significant (Figure 3). When comparing between all treatment systems and the control systems at endline, we saw significantly less E. coli in treatment systems (Z = −3.982, p < 0.001). At baseline, there was no significant difference in E. coli in treatment systems as compared to control systems (Z = −1.061, p = 0.289).
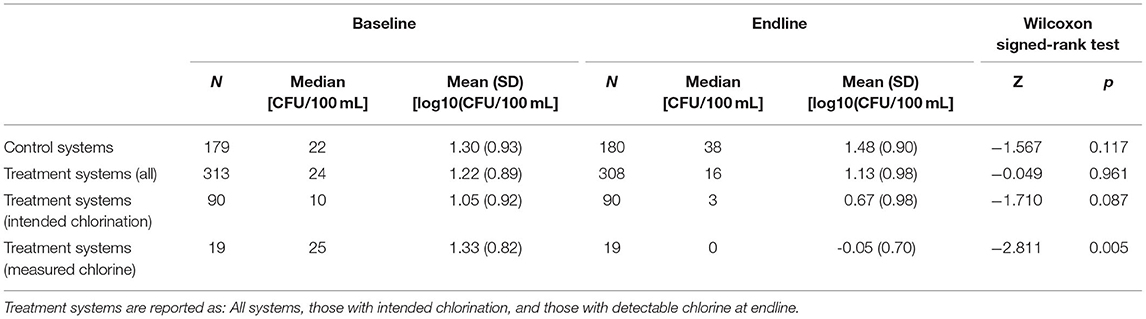
Table 1. E. coli concentration at the point of consumption at baseline and endline in control and treatment systems, including comparison from baseline to endline with the Wilcoxon signed-rank test.
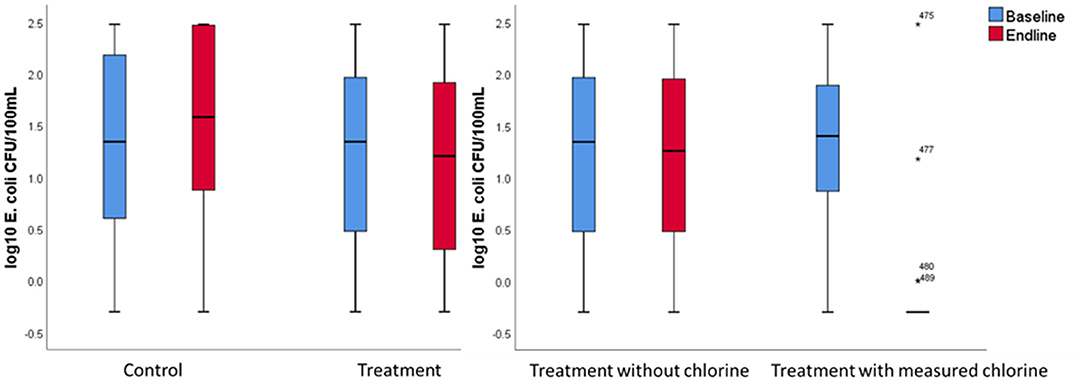
Figure 3. Log10 E. coli concentration in CFU/100 mL at the point of consumption at baseline and endline in the control and treatment systems (left) and in treatment systems with and without measured chlorine at endline (right). Outlier values are represented by asterisks (*), with sample numbers shown.
The percentage of households that met the WHO drinking water quality guideline of <1 E. coli CFU/100 mL was about the same at baseline in the control and treatment systems at around 10% (see green category in Figure 4 and Supplementary Table S5 in the Supplemental Material). By endline in the treatment systems, the share of households with no detectable E. coli in their stored water containers increased significantly (Z = −3.130; p = 0.002) to 19.8%. By contrast, there was a decrease in the share of control systems' samples without detectable E. coli to 7.8%, but the difference from baseline was not statistically significant (Z = −0.784; p = 0.433). With an increase from 5.3% of the households with no detected E. coli at baseline to 78.9% at endline, the households with measurable chlorine showed the largest improvement in microbial water quality (Z = −3.500; p < 0.001) (Figure 4).
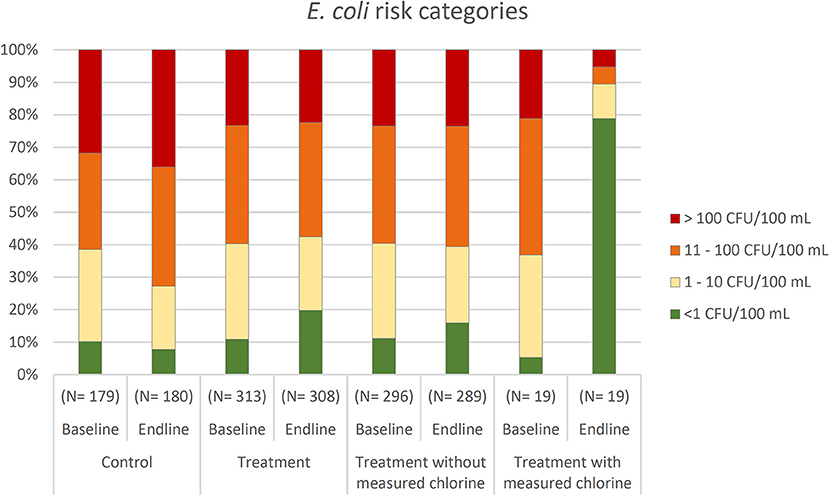
Figure 4. Percentage of households within the different E. coli risk categories of low risk (<1 CFU/100 mL), intermediate risk (1–10 CFU/100 mL), high risk (11–100 CFU/100 mL), and very high risk (>100 CFU/100 mL) at baseline and endline in the control and treatment systems, including treatment systems with and without detectable chlorine at endline.
Point of Collection
Generally speaking, by study endline the mean E. coli concentrations were lower at the taps than at the point of consumption (Table 2). Taps with measurable chlorine concentration showed a significant decrease in E. coli concentration from baseline to endline (Z = −2.185, p = 0.029). However, for other comparisons, such as the changes in fecal contamination levels from baseline to endline among both control systems and in the treatment systems, as well as the differences in E. coli concentration at the tap between the control and treatment systems, were not statistically significant.
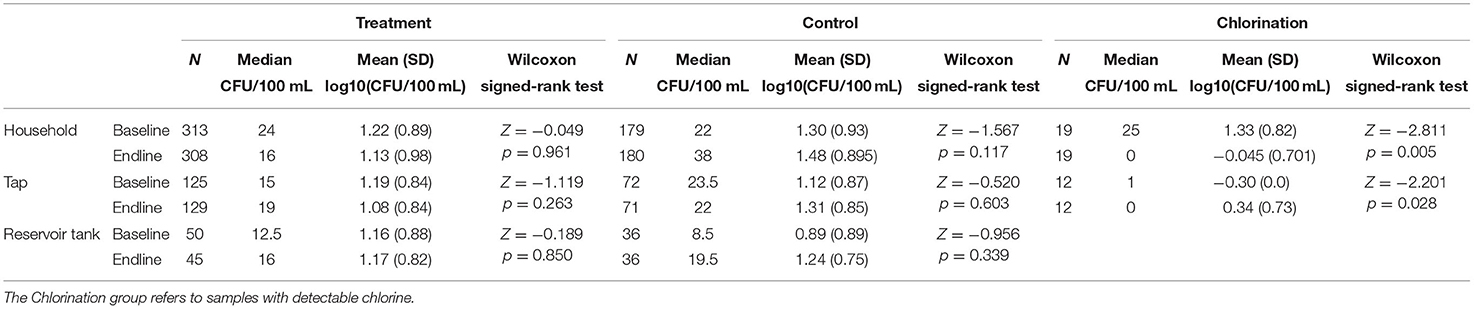
Table 2. E. coli concentrations at each sample location for the intervention and control systems, with bivariate comparisons of baseline and endline measurements.
In the treatment systems there were significantly more taps that met the WHO standards of <1 E. coli CFU/100 mL at endline (15.9%) than at baseline (9.8%) (Z = −2.000, p = 0.046). Among the control systems, 6.9% had no detectable E. coli at endline and 13.9% at baseline. This decrease in households meeting the E. coli target was not statistically significant (Z = −1.155, p = 0.248). At all taps where free residual chlorine was measured at endline, samples had no detectable E. coli and hence 100% met the WHO guideline for microbial water safety.
Quality Control
We processed duplicates for one out of every seven samples to estimate variation in the assay, resulting in two duplicates per 15 household water samples. The log10 difference between the duplicates of the household water samples showed low variation in water quality as indicated by a mean of 0.05 (SD = 0.3; Median = 0.0) difference, corresponding to 5.4 CFU/100 mL (SD = 42.9; Median = 0.0). Negative controls were processed daily through the same filtration funnel as was a preceding positive control. All negative control samples processed had no detectable E. coli.
System Functionality
Sanitary Inspections
At the time of the research team's visits the water systems were generally functioning well. According to the sanitary inspections, on average 79.2% of the taps per system were working at the endline visit (SD = 22.0), 7.5% were leaking (SD = 17.0), 8.2% broken (SD = 11.9) and 5.2% not functioning (SD = 8.1). The share of taps functioning, leaking or being broken did not differ significantly between control and treatment systems at endline. However, the control systems had a significantly higher share of taps not functioning than the treatment systems (p = 0.036).
Households' Perceptions of Functionality
In addition to the sanitary inspection, enumerators asked households for their opinion on the current functionality of their main drinking water source. Most respondents rated the water system as functioning well and only a few as not functioning (Table 3). In the treatment systems, there was a significant improvement in the functionality rating from baseline to endline, while no such difference was observed among control systems. At endline the rating of the system's functionality in the treatment group was significantly better than in the control group (Z = −3.777, p < 0.001), whereas at baseline there was no significant difference (Z = −0.815, p = 0.415).
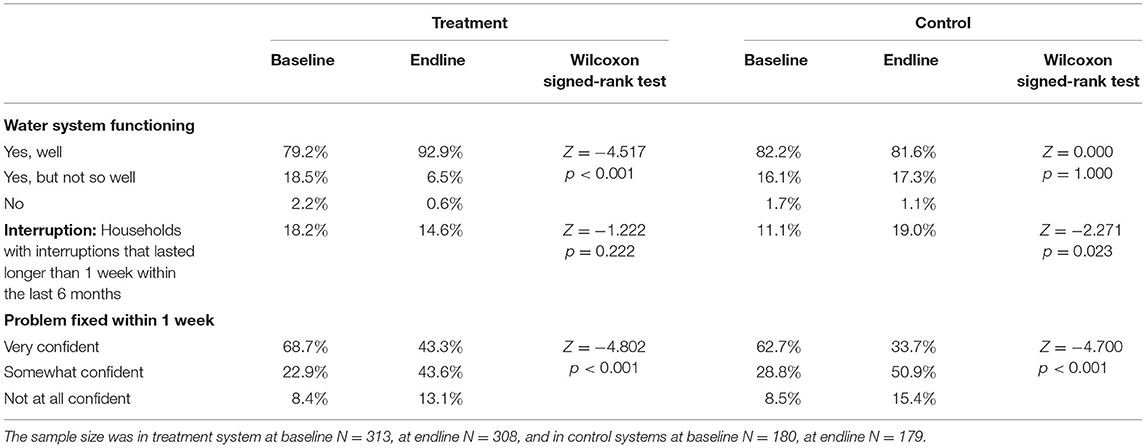
Table 3. System functionality as measured by the percentage of households that reported the corresponding answer in treatment and control systems at baseline and endline, including comparison from baseline to endline with the Wilcoxon signed-rank test.
In the control systems, significantly more households reported interruptions of water services for more than a week at endline compared to baseline, whereas no such change was observed among treatment systems (Table 3). The percentage of households that reported interruptions at endline did not differ significantly between treatment and control systems (Z = −1.264, p = 0.206). Yet, there were more reported interruptions in the treatment systems at baseline than in the control systems (Z = −2.089, p = 0.037). The most commonly mentioned reasons for interruptions at endline were broken or burst pipes (49.3%), lack of water (27.8%), intake problems (19.0%) and landslides (17.7%). Households' confidence that repairs to the system could be performed within 1 week decreased from baseline to endline among both treatment and control systems (Table 3). At endline, the confidence that problems would be fixed within 1 week was significantly higher in the treatment than in the control group (Z = −2.122, p = 0.034). Whereas, at baseline, they did not differ significantly (Z = −1.345, p = 0.179).
At endline we asked the interviewees how confident they were that their water system would be functional 1 year later using a 5-dot scale, with the largest dot being the highest confidence level (see Supplementary Figure S1 for the 5-dot scale). Households served by treatment systems were significantly more confident (M = 3.8, SD = 1.0) that the system would be functional in 1 year than people in the control systems (M = 3.4, SD = 1.1) (Z = −3.897, p < 0.001). There was no significant difference in the confidence that the system will be functional 1 year later between treatment and control schemes at baseline (Z = −1.222, p = 0.222).
Water Availability
The endline survey also probed the duration of water availability at the tap. The distribution of the hours of water availability per day reported at endline is bimodal with around one third of respondents (38%) having water services available for 12 h a day or less, which we defined as intermittent supply, and two thirds (62%) for more than 12 h, which was defined as continuous water supply. The cut-off at 12 h was linked to the JMP definition of water availability when needed (WHO/UNICEF Joint Monitoring Programme, 2019). Most of the households with more than 12 h water supply had water for a full 24 h (61.2%). Among the control systems, more households (69.8%) had continuous water supply than in the treatment systems (57.3%) (Z = −2.748, p = 0.006). In the control systems, water services were available for an average of 18 h daily (SD = 9.2), which were significantly more hours than in the treatment systems (M = 15.8 h, SD = 9.6) (Z = −2.145, p = 0.032). The hours of water availability showed a small and marginally significant negative correlation with the E. coli concentration at the point of consumption (rs = −0.087, p = 0.055). Hence, having less hours of water availability at the tap was associated with higher E. coli concentration.
Users' Experience
Satisfaction, Taste, and Perceived Safety
According to the interviews at endline, people served by the treatment systems were significantly more satisfied with their main drinking water source than households served by the control systems (Z = −2.255, p = 0.024). Further, in the treatment systems, significantly more respondents indicated that the source is available when needed than in control systems (Z = −3.568, p < 0.001). At endline the tests revealed no significant difference in the perception of taste between control and treatment (Z = −1.470, p = 0.142), nor whether or not chlorine was detected in the household storage containers (Z = −1.559, p = 0.119). Better functioning sources were associated with the availability of the source when needed, and both were associated with higher users' satisfaction (see text in Supplemental Material and Supplementary Table S6 for further details on the relationship between users' satisfaction and system functionality metrics).
There was no significant difference in households' perception of water safety at baseline among treatment and control systems (Z = −1.529, p = 0.126). When looking at the evolution of the perception of safety from baseline to endline, the change was not significant in the control (Z = −1.262, p = 0.207) nor in the treatment systems (Z = −0.653, p = 0.513). However, contrary to expectations, at endline households in control systems perceived their water as significantly safer than households in treatment systems (Z = −2.361, p = 0.018). The perception of water safety was significantly correlated with people treating their water at household level (rs = 0.184, p < 0.001). The riskier people perceived the water to be, the higher the likelihood that they would treat it.
Household Water Treatment and Hand Hygiene
While the percentage of households treating their water increased significantly in the treatment systems from baseline to endline, it decreased in the control systems (Table 4). At endline, significantly more people reported treating their water at household level within the treatment systems compared to the control systems. Whereas, at baseline, there was no significant difference. 93% of the households treating their water used a filter and 9% boiled their water. 70% of the people treating their water indicated to do this always, 18% most of the times, 9% rarely and 3% never.
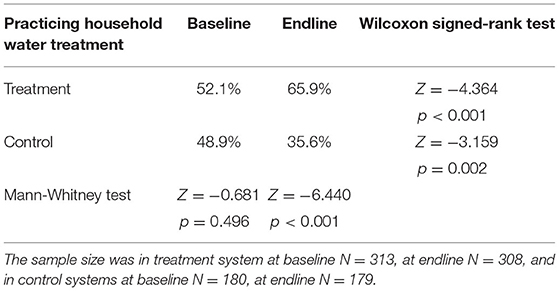
Table 4. Percentage of households that reported practicing household water treatment in the treatment and control systems at baseline and endline, including comparison from baseline to endline with the Wilcoxon signed-rank test and at baseline and endline with the Mann-Whitney test.
Microbial water quality was correlated with indicators for safe storage. The presence of a lid on the storage container correlated negatively with the E. coli concentration at the point of consumption (rs = −0.103, p = 0.023). Further, the cleanliness of the storage container correlated negatively with the E. coli concentration (rs = −0.177, p = 0.035). Meaning that the presence of a lid and the cleanliness of the storage container were both associated with lower E. coli concentrations (more details about water storage in Supplementary Table S7).
We observed at endline that hand hygiene practices were also improved by the interventions. Besides more households having access to hand washing facilities in the treatment systems at endline (82.7% compared to 70.0% in control systems), the state of the handwashing facilities was better (87.0% of the handwashing facilities being in good and clean condition) than in the control systems (68.8%) (Z = −4.243, p < 0.001). Additionally, more households served by the treatment systems (80.3%) had soap available as compared to the control systems, where less than half of the households (48.0%) had soap at endline (Z = −6.425, p < 0.001). Furthermore, the number of times respondents in the treatment group washed their hands daily (Median = 7) was significantly greater than respondents in the control group (Median = 6) (Z = −2.097, p = 0.036).
Identifying the Factors Explaining Fecal Contamination of Drinking Water in the Household: Regression Analysis
An ordinal logistic regression model was estimated in order to identify factors associated with fecal contamination of stored drinking water. The dependent variable was the E. coli concentration at the point of consumption at endline, split into ordered risk categories, taking the value of 0 for samples that were <1 E. coli CFU/100 mL (non-detect), 1 for 1–10 E. coli CFU/100 mL, 2 for 11–100 E. coli CFU/100 mL and 3 for >100 E. coli CFU/100 mL. Bivariate comparisons (Spearman's correlation for continuous data and Mann-Whitney test in case of binary data) between the dependent variable and its hypothesized explanatory variables were made to identify significant associations and inform the construction of a parsimonious model (bivariate test results shown in Supplementary Table S8). The reduced model is presented in Table 5 and the full model shown in Supplementary Table S9. The assumption of no multicollinearity was satisfied. To check for the assumption for an ordinal logistic regression of proportional odds, we conducted the test of parallel lines. With the test being non-significant [χ2(38) = 44.065, p = 0.230], the assumption of proportional odds was satisfied. The likelihood ratio chi-square test revealed a significant improvement in fit of the final model relative to the intercept only model [χ2(19) = 81.719, p < 0.001]. In the Goodness-of-Fit analysis, the Pearson chi-square test [χ2(1412) = 1448.68, p = 0.243] and the deviance test [χ2(1412) = 1200.52, p = 1.000] were both non-significant, which suggested a good model fit.
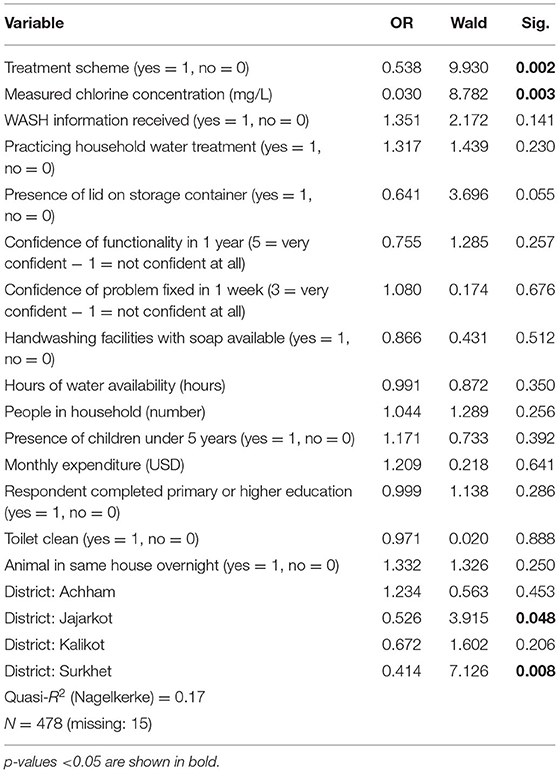
Table 5. Ordinal logistic regression model of the factors explaining risk of fecal contamination of stored drinking water (0 for <1 E. coli CFU/100 mL, 1 for 1–10 E. coli CFU/100 mL, 2 for 11–100 E. coli CFU/100 mL, 3 for >100 E. coli CFU/100 mL) at endline, with the odds ratio (OR), Wald statistic, and the level of significance reported.
All else constant, belonging to the treatment scheme, measured chlorine concentration and the presence of a lid on the storage container were significant predictors and positively affected the microbial safety of drinking water at the point of consumption. The odds ratio (OR) indicated that treatment systems were associated with decreased odds in E. coli risk category. Meaning that all else constant, for households receiving the treatment intervention package, the odds of having unsafe water are multiplied by 0.538 as compared to those receiving no intervention (p = 0.002). For those with detectable chlorine, the odds of having unsafe water are greatly decreased, i.e., multiplied by 0.030 as compared to those without chlorine (p = 0.003). Safe storage, as measured by the presence of a lid on the storage container, was associated with decreased odds in E. coli risk category, although the association was only marginally significant in the model (p = 0.055). All else constant, for households having safe water storage, the odds of having unsafe water are multiplied by 0.641 as compared to those without safe storage.
Many of the project-associated independent variables were non-significant predictors of E. coli contamination risk in this model, such as the reception of WASH information (p = 0.141), the use of household water treatment (p = 0.230), the confidence that the water system will be functional in one year (p = 0.257), the confidence that in case of a problem it will be fixed within 1 week (p = 0.676), the presence of handwashing facilities with soap (p = 0.512), and the hours of water availability (p = 0.350).
Contrary to expectations, the majority of the confounders (i.e., contextual factors and non-project-related factors) were not significantly associated with E. coli contamination risk. Solely, being in Surkhet (OR = 0.414, p = 0.008) or in Jajarkot (OR = 0.526, p = 0.048) were associated with decreased odds in E. coli risk category, everything else held constant. Meaning that the odds of having unsafe water are multiplied by 0.414 for households situated in Surkhet and multiplied by 0.526 for households situated in Jajarkot as compared to those among the other districts.
Discussion
This research provides new evidence of the effectiveness of a combined risk-based water safety intervention for piped supplies in rural Nepal. It builds on and expands findings from prior studies by incorporating a broader geographic region to capture increased variability in households' and water systems' characteristics as compared with a previous study at the same field site (Tosi Robinson et al., 2018). The novel aspect of this work is the expanded set of outcome measures, in particular on users' perceptions and system functionality. Furthermore, the present study included a longer study period to improve understanding of intervention longevity and quarterly tracking of performance indicators using basic sanitary inspections to assess temporal changes. We followed control communities alongside the intervention communities to account for potential variation in study outcomes due to external factors.
Microbial Quality
Our study reveals that chlorination is the only component of the combined intervention package that leads to a major improvement in the microbial water quality of collection taps and household stored water. The E. coli concentration in stored water containers decreased significantly from baseline to endline solely among households in treatment communities where free residual chlorine was detected at the point of consumption. The effectiveness of other interventions to provide safe water was relatively lower, possibly due to seasonal effects of the monsoon causing higher contamination in general. For example, among all treatment systems, the share of household storage containers meeting WHO guidelines for microbial safety (<1 CFU/100 mL) increased modestly from 11% at baseline to 20% at endline. In the control systems, by contrast, we observed an increasing trend in the E. coli contamination of drinking water supplies over time. It's notable that during the rainy season fecal contamination can be mobilized and therefore cause degradation of the microbial water quality of surface and groundwater (Johnson et al., 2010). Therefore, it is plausible that the broader intervention package, while not dramatically improving water quality from baseline levels if chlorination was absent, still prevented increased contamination due to the seasonal monsoon. However, water safety interventions should ensure year-round availability of safe water.
Collection taps with measurable chlorine concentration had no detectable E. coli. Despite chlorination successfully improving microbial water quality at the tap, a general trend among all systems of water quality deteriorating from the tap to the point of consumption was observed. This deterioration is in line with previous studies (Kumpel and Nelson, 2013; Shields et al., 2015), which conclude that unsafe storage and handling practices can lead to recontamination of the drinking water (Shields et al., 2015).
Finally, we found a negative correlation between the hours of water availability and the E. coli concentration. Hence, more hours of water availability were associated with lower E. coli concentration. Previous studies have shown that intermittent water supply systems have higher E. coli concentrations, with greater frequency, at the tap compared to continuous water supply (Kumpel and Nelson, 2013). Although water storage can be reduced through continuous water supply, households served by continuous systems in our study site still did not avoid all storage, which is in line with previous studies (Kumpel and Nelson, 2013). Consequently, a continuous water supply system does not guarantee prevention of recontamination due to unsafe storage. This further supports the use of chlorination as it reduces recontamination.
Chlorination
Chlorination is only effective when applied in appropriate doses (WHO, 2017b). The number of systems that manual chlorination was successfully implemented within was lower than planned by the research team. This underlines that proper implementation of chlorination in remote rural settings includes various technical and capacity challenges. Besides the substantial time burden of manual chlorination, correct dosing in order to reach the appropriate chlorine concentration at the point of consumption, with minimal disinfection by-products, requires technical skills and regular verification monitoring. The lack of proper equipment, insufficient chlorine supply, and limited operator training might have been additional hindering factors for the uptake of regular manual chlorination at system scale among the systems included in this study. To amend this capacity shortage, we recommend closer or more continuous supervision of village maintenance workers, including regular training opportunities (Ferrero et al., 2019) and strengthening of local laboratories for operational monitoring (Diener et al., 2017; Peletz et al., 2018).
This study has not confirmed previous research on people refusing chlorination as a water treatment method due to the taste (Crider et al., 2018). Taste and odor have been shown to be key factors influencing the acceptance of drinking water (Francis et al., 2015). In contrast to the results of similar studies carried out in this area (Crider et al., 2018), the perception of taste of the drinking water did not differ significantly between the systems with and without chlorination. However, according to the WHO drinking water quality guidelines, people are able to taste or smell chlorine at levels as low as 0.3 mg/L (WHO, 2017b) and in other studies people detected the taste at levels of 0.7 mg/L (Crider et al., 2018). In our measurements, we did not have many samples above these thresholds, potentially explaining the general acceptance of chlorinated water among households receiving this intervention.
Users' Perception
Our results indicate that the study interventions had a considerable and counterintuitive influence on users' perceptions of the safety of their drinking water. Water in the control systems was perceived as safer than in the treatment systems, despite measured fecal contamination levels indicating the opposite. This might be due to the fact that among the treatment systems people received more information on water treatment and hygiene, which potentially increased the awareness of risks linked to water contamination. In addition, regular monitoring among the treatment systems may have had an impact on the perception of water safety. According to Trent et al. (2018), providing a household with specific information about drinking water quality can cause behavior change and improve microbial drinking water quality (Trent et al., 2018).
Our study also reveals a positive correlation between the perception of water safety and the use of household water treatment technologies. As mentioned above, greater awareness the water contamination could have been a reason for people perceiving the water as more potentially harmful. This might have led them to treat their water in their household. The aforementioned is in line with previous studies, which showed that households' perception of their own water quality being low, and therefore presenting a health risk, is the most important precursor for the adoption of household water treatment (Daniel et al., 2018). However, household water treatment does not necessarily improve water quality, due to inadequate handling practice or the treatment products being of bad quality (Meierhofer et al., 2018). Therefore, interventions may have caused an increase in the perception of water safety associated with the use of household water treatment, which did not necessarily translate into a positive impact on water quality.
The interventions were correlated with higher user satisfaction with the water system and the water source being more available when needed. However, this stands in contrast to the reported hours of water availability, which was higher in the control systems than in the treatment systems. But, as the hours of water availability were not assessed at baseline, we do not know how many hours of water availability they had prior to the interventions. It is possible that the interventions may have led operators to be more prudent about opening hours, resulting in lower but more targeted availability. At the same time, there were less reported interruptions in the treatment systems. This is another possible explanation for the higher satisfaction and availability when needed among the treatment systems.
System Functionality
This study reveals that the interventions presumably increased households' rated current functionality of the system and their confidence that the system will be functional in 1 year. Apart from the sanitary inspections indicating more dysfunctional taps in the control systems, the systems with interventions showed a better rated functionality of the water system. Furthermore, we observed an increase in people reporting that the source was functioning well from baseline to endline among the treatment systems, compared with no change in the control systems. Higher water availability due to the monsoon could explain favorable effects on the rated functionality and satisfaction during this season. At the same time, increased surface runoff due to the monsoon can mobilize organic and inorganic matter and therefore cause turbidity (Brasington and Richards, 2000). The turbidity potentially affected the rated system functionality and satisfaction negatively. However, in the treatment systems, roughing sand filters were installed as part of the interventions, which can effectively reduce turbidity throughout the distribution system (Hashimoto et al., 2019). Hence, they could have caused the water to be less turbid during monsoon compared to other years and therefore be a reason for higher satisfaction and better rated functionality in the treatment systems.
According to the results, the combined intervention potentially prevented interruptions. The reported interruptions that lasted longer than 1 week in the control systems were higher at endline than at baseline. However, the proportion of people reporting such interruptions did not change significantly from baseline to endline within the treatment systems. Hence, the interventions either prevented interruptions from occurring or any interruptions could be fixed faster among the treatment systems. At the same time, among all systems we observed a decrease from baseline to endline in users' confidence that a problem could be fixed within 1 week. It is difficult to interpret a clear reason for this finding. Potentially the monsoon caused problems (e.g., landslides or impassable roads) that were insurmountable within a short time period. In summary, results indicate that the water safety interventions reduced the number of interruptions, potentially due to infrastructure improvements and better trained village maintenance workers.
Limitations
It is plausible that a number of aspects of the study design may limit our interpretation of the results obtained. First, the baseline and endline data collection were not conducted during the same season. The baseline data collection took place during the dry season and the endline after monsoon. Hence, seasonal effects likely influenced study outcomes across both treatment and control groups. Rainfall prior to endline data collection increased water availability, which could have caused increased levels of contamination due to mobilized fecal contaminants. Thus, seasonality could be responsible for differences not only in water quality but also in users' perception and system functionality (Kumpel et al., 2017).
We note also that correct application of system-chlorination was scarce at our study site. At endline, there were only two systems with measurable chlorine concentration at the point of consumption. Future research at this and similar field sites should aim to include more systems with correctly applied chlorination at the system level.
E. coli is sensitive and accordingly has some limitations as an indicator bacterium. They might not survive as long as certain pathogens, such as cryptosporidium, especially after exposure to chlorine (WHO, 2017b). The results reported here may therefore overstate the actual risk reductions of drinking chlorinated water. Furthermore, the data for many E. coli samples were censored since their concentrations were at the upper and lower detection limits. The inclusion of discrete values in continuously distributed microbial data may bias the results of statistical analyses (Chik et al., 2018).
Conclusion
The evidence from this study implies that chlorination led to a dramatic decrease of fecal contamination in drinking water at the point of consumption, while no other intervention was as effective. However, the number of systems across the study site where chlorination was correctly applied was limited. As compared to chlorination, the effectiveness of other interventions was relatively low, which may have been due to higher contamination brought about by the monsoon. Future research should prioritize interventions that effectively counteract the seasonal effects of the monsoon in Nepal to achieve consistent safety and availability of safe water. Additionally, the interventions increased households' awareness of water contamination issues, which in turn appeared to motivate the uptake of household water treatment methods. In addition, the interventions achieved higher general satisfaction and better rated functionality among the households enrolled in this study. As our research highlights the effectiveness of chlorination in ensuring acceptable drinking water quality, for future studies we would encourage more broadly applying chlorination methods at system level.
Data Availability Statement
The original contributions presented in the study are included in the article/Supplementary Material and water quality data are available at https://opendata.eawag.ch/. Further inquiries can be directed to the corresponding author.
Ethics Statement
The research activities involving human participants were reviewed and approved by EAWAG Ethical Review Committee. All participants provided their written informed consent to participate in this study.
Author Contributions
CB, AS, BK, MB, and SM: conceived and designed the research and contributing to the writing of the article. CB, AS, BK, and MB: conducted the field research. CB and SM: analyzed the results. CB: wrote the first draft of the manuscript. All authors contributed to the article and approved the submitted version.
Funding
This research was supported by the Swiss Agency for Development Cooperation (Contract number 81053992) and this document is an output from the REACH programme funded by UK Aid from the UK Foreign, Commonwealth and Development Office (FCDO) for the benefit of developing countries (Programme Code 201880). However, the views expressed, and information contained in it are not necessarily those of or endorsed by those agencies, which can accept no responsibility for such views or information or for any reliance placed on them.
Conflict of Interest
The authors declare that the research was conducted in the absence of any commercial or financial relationships that could be construed as a potential conflict of interest.
Publisher's Note
All claims expressed in this article are solely those of the authors and do not necessarily represent those of their affiliated organizations, or those of the publisher, the editors and the reviewers. Any product that may be evaluated in this article, or claim that may be made by its manufacturer, is not guaranteed or endorsed by the publisher.
Acknowledgments
We particularly acknowledge Rubika Shrestha, Ram Bahadur Shrestha, Mohan Bhatta, Binod Pandey, Kushmakar Pant, Ramesh Chaudhary, Prakash Ayer, Neerima Thapa, Netra Thapa, Ramesh Yogi, Meghraj Pandey, Ujir Singh Nepali, Ganesh Bista, Mahendra Adhikari, Lalita Bhandari, Lok Bohora, Satya Shahi, Chandra Dangi, Mukesh Sharma, Guillaume Clair-Caliot, and Benjamin Ambuehl for significant support during the implementation and assessment of the study interventions. Vasco Lepori, Thomas Lauber, and Urs Bänziger supported the writing process and reviewed the first draft of the manuscript. Timothy Julian provided valuable feedback on data collection, analysis and interpretation.
Supplementary Material
The Supplementary Material for this article can be found online at: https://www.frontiersin.org/articles/10.3389/frwa.2021.750802/full#supplementary-material
References
Bain, R., Cronk, R., Hossain, R., Bonjour, S., Onda, K., Wright, J., et al. (2014a). Global assessment of exposure to faecal contamination through drinking water based on a systematic review. Trop. Med. Int. Health 19, 917–927. doi: 10.1111/tmi.12334
Bain, R., Cronk, R., Wright, J., Yang, H., Slaymaker, T., and Bartram, J. (2014b). Fecal contamination of drinking-water in low- and middle-income countries: a systematic review and meta-analysis. PLoS Med. 11:e1001644. doi: 10.1371/journal.pmed.1001644
Barrington, D., Fuller, K., and McMillan, A. (2013). Water safety planning: adapting the existing approach to community-managed systems in rural Nepal. J. Water Sanit. Hyg. Dev. 3, 392–401. doi: 10.2166/washdev.2013.120
Baum, R., Kayser, G., Stauber, C., and Sobsey, M. (2014). Assessing the microbial quality of improved drinking water sources: results from the Dominican Republic. Am. J. Trop. Med. Hyg. 90, 121–123. doi: 10.4269/ajtmh.13-0380
Bista, M.. (2001). Infectious diseases in Nepal: a collection of selected publications on communicable diseases including vector-borne diseases 1992-2000. J. Inst. Med. Nepal 12, 247–257.
Brasington, J., and Richards, K. (2000). Turbidity and suspended sediment dynamics in small catchments in the Nepal Middle Hills. Hydrol. Process. 14, 2559–2574. doi: 10.1002/1099-1085(20001015)14:14<2559::AID-HYP114>3.0.CO;2-E
Chik, A. H. S., Schmidt, P. J., and Emelko, M. B. (2018). Learning something from nothing: the critical importance of rethinking microbial non-detects. Front. Microbiol. 9:2304. doi: 10.3389/fmicb.2018.02304
Crider, Y., Sultana, S., Unicomb, L., Davis, J., Luby, S. P., and Pickering, A. J. (2018). Can you taste it? taste detection and acceptability thresholds for chlorine residual in drinking water in Dhaka, Bangladesh. Sci. Total Environ. 613–614, 840–846. doi: 10.1016/j.scitotenv.2017.09.135
Daniel, D., Marks, S. J., Pande, S., and Rietveld, L. (2018). Socio-environmental drivers of sustainable adoption of household water treatment in developing countries. Npj Clean Water 1, 1–6. doi: 10.1038/s41545-018-0012-z
Diener, A., Schertenleib, A., Daniel, D., Kenea, M., Pratama, I., Bhatta, M., et al. (2017). “Adaptable drinking-water laboratory unit for decentralised testing in remote and alpine regions” in 40th WEDC International Conference (Loughborough), 1–6.
Ferrero, G., Setty, K., Rickert, B., George, S., Rinehold, A., DeFrance, J., et al. (2019). Capacity building and training approaches for water safety plans: a comprehensive literature review. Int. J. Hyg. Environ. Health 222, 615–627. doi: 10.1016/j.ijheh.2019.01.011
Francis, M. R., Nagarajan, G., Sarkar, R., Mohan, V. R., Kang, G., and Balraj, V. (2015). Perception of drinking water safety and factors influencing acceptance and sustainability of a water quality intervention in rural southern India. BMC Public Health 15:731. doi: 10.1186/s12889-015-1974-0
Government of Nepal (2017). Nepal–Demographic and Health Survey 2016. Kathmandu: Ministry of Health and Population.
Government of Nepal (2018). Annual Report - Department of Health Services 2074/75 (2017/18), Vol. 75. Kathmandu: Ministry of Health and Population.
Hashimoto, Y., Takashima, H., and Jayamohan, S. (2019). Application of roughing filter to pre-treat 1,000 NTU raw water for slow sand filter. Water Pract. Technol. 14, 355–364. doi: 10.2166/wpt.2019.021
Johnson, K. M., Kumar, M. R., and Ponmurugan, P. (2010). Degradation of the quality of water during monsoon and the related outbreak of waterborne diseases. Ecol. Environ. Conserv. 16, 277–280.
Kumpel, E., Cock-Esteb, A., Duret, M., de Waal, D., and Khush, R. (2017). Seasonal variation in drinking and domestic water sources and quality in Port Harcourt, Nigeria. Am. J. Trop. Med. Hyg. 96, 437–445. doi: 10.4269/ajtmh.16-0175
Kumpel, E., Delaire, C., Peletz, R., Kisiangani, J., Rinehold, A., De France, J., et al. (2018). Measuring the impacts of water safety plans in the Asia-Pacific Region. Int. J. Environ. Res. Public Health 15:1223. doi: 10.3390/ijerph15061223
Kumpel, E., and Nelson, K. L. (2013). Comparing microbial water quality in an intermittent and continuous piped water supply. Water Res. 47, 5176–5188. doi: 10.1016/j.watres.2013.05.058
Mahmud, S. G., Shamsuddin, S. A. J., Ahmed, M. F., Davison, A., Deere, D., and Howard, G. (2007). Development and implementation of water safety plans for small water supplies in Bangladesh: benefits and lessons learned. J. Water Health 5, 585–597. doi: 10.2166/wh.2007.045
Marks, S. J., and Shrestha, R. (2020). “Improving drinking water quality in rural communities in Mid-Western Nepal,” in Women in Water Quality, Women in Engineering and Science, ed D. O'Bannon (Cham: Springer), 47–59. Available online at: https://link.springer.com/chapter/10.1007%2F978-3-030-17819-2_3
Meierhofer, R., Bänziger, C., Deppeler, S., Kunwar, B. M., and Bhatta, M. (2018). From water source to tap of ceramic filters—factors that influence water quality between collection and consumption in rural households in Nepal. Int. J. Environ. Res. Public Health 15:2439. doi: 10.3390/ijerph15112439
Nissui (2009). Compact Dry “Nissui” EC for Coliform and E. coli, User's Manual. 1–4. Tokyo: Nissui Pharmaceuticals Co. Ltd.
Peletz, R., Kisiangani, J., Bonham, M., Ronoh, P., Delaire, C., Kumpel, E., et al. (2018). Why do water quality monitoring programs succeed or fail? a qualitative comparative analysis of regulated testing systems in sub-Saharan Africa. Int. J. Hyg. Environ. Health 221, 907–920. doi: 10.1016/j.ijheh.2018.05.010
Schertenleib, A., Sigrist, J., Friedrich, M. N. D., Ebi, C., Hammes, F., and Marks, S. J. (2019). Construction of a low-cost mobile incubator for field and laboratory use. J. Vis. Exp. 145:e58443. doi: 10.3791/58443
Shaheed, A., Orgill, J., Montgomery, M. A., Jeuland, M. A., and Brown, J. (2014). Why “improved” water sources are not always safe. Bull. World Health Organ. 92, 283–289. doi: 10.2471/BLT.13.119594
Shields, K. F., Bain, R. E., Cronk, R., Wright, J. A., and Bartram, J. (2015). Association of supply type with fecal contamination of source water and household stored drinking water in developing countries: a bivariate meta-analysis. Environ. Health Perspect. 123, 1222–1231. doi: 10.1289/ehp.1409002
String, G. M., Singleton, R. I., Mirindi, P. N., and Lantagne, D. S. (2020). Operational research on rural, community-managed Water Safety Plans: case study results from implementations in India, DRC, Fiji, and Vanuatu. Water Res. 170:115288. doi: 10.1016/j.watres.2019.115288
Tosi Robinson, D., Schertenleib, S., Kunwar, B., Shrestha, R., Bhatta, M., and Marks, S. J. (2018). Assessing the impact of a risk-based intervention on piped water Quality in rural communities: The case of Mid-Western Nepal. Int. J. Environ. Res. Public Health 15:1616. doi: 10.3390/ijerph15081616
Trent, M., Dreibelbis, R., Bir, A., Tripathi, S. N., Labhasetwar, P., Nagarnaik, P., et al. (2018). Access to household water quality information leads to safer water: a cluster randomized controlled trial in India. Environ. Sci. Technol. 52, 5319–5329. doi: 10.1021/acs.est.8b00035
UNDP (2019). Human Development Report 2019 Inequalities in Human Development in the 21 st Century Nepal. New York, NY: UNDP, 1–10.
WHO (2017a). Global Status Report on Water Safety Plans: A Review of Proactive Risk Assessment and Risk Management Practices to Ensure the Safety of Drinking-water. Geneva: World Health Organization.
WHO (2017b). Guidelines for Drinking-Water Quality: Fourth Edition Incorporating the First Addendum. Geneva: World Health Organization.
Keywords: drinking water, water safety planning, microbial quality, piped systems, rural communities, Nepal
Citation: Bänziger C, Schertenleib A, Kunwar BM, Bhatta MR and Marks SJ (2022) Assessing Microbial Water Quality, Users' Perceptions and System Functionality Following a Combined Water Safety Intervention in Rural Nepal. Front. Water 3:750802. doi: 10.3389/frwa.2021.750802
Received: 31 July 2021; Accepted: 20 December 2021;
Published: 15 February 2022.
Edited by:
Abbas Roozbahani, University of Tehran, IranReviewed by:
Katarzyna Pietrucha-Urbanik, Rzeszów University of Technology, PolandLisa Paruch, Norwegian Institute of Bioeconomy Research (NIBIO), Norway
Copyright © 2022 Bänziger, Schertenleib, Kunwar, Bhatta and Marks. This is an open-access article distributed under the terms of the Creative Commons Attribution License (CC BY). The use, distribution or reproduction in other forums is permitted, provided the original author(s) and the copyright owner(s) are credited and that the original publication in this journal is cited, in accordance with accepted academic practice. No use, distribution or reproduction is permitted which does not comply with these terms.
*Correspondence: Carola Bänziger, Y2Fyb2xhLmJhZW56aWdlckBmaG53LmNo
†Present address: Carola Bänziger, FHNW, University of Applied Sciences Northwestern Switzerland, Muttenz, Switzerland