 Samer Muhandes
 Barnaby Dobson1,3
 Ana Mijic
- 1Department of Civil and Environmental Engineering of Imperial College London, London, United Kingdom
- 2Project Centre Limited – Flood and Water Management Team, London, United Kingdom
- 3Environmental Change Institute, University of Oxford, Oxford, United Kingdom
The role of Sustainable Drainage Systems (SuDS) in reducing combined sewer overflows (CSOs) and flood volumes can be accurately assessed using the available high-fidelity sewer network modelling software packages in the market. However, these tools are too slow for a range of modern applications such as optimisation or uncertainty analysis where long-term climate projection simulations are required. In this study, we create a novel representation of combined sewer systems to enhance an existing spatially aggregated model (CityWat) with additional functionalities to assess flood volumes, discharge to rivers and CSOs. We validate the developed model (CityWatStorm) by comparing the simulation results with a high-fidelity InfoWorks ICM model. Finally, we implement SuDS at a city scale and assess the betterment achieved in the context of flood volumes and CSOs. We conclude that CityWatStorm is able to capture the SuDS betterment within 95% accuracy, and the total flood volume and CSOs with an accuracy ranging from 78 to 83%. This makes the aggregated model suitable for a wide range of applications such as sensitivity analysis of catchment interventions for long-term planning under future uncertainties.
Introduction
Population growth and urban expansion, coupled with climate change impacts, are likely to result in an increased pluvial flood risk in urban areas as well as higher discharges through combined sewer overflows (CSOs) (Nilsen et al., 2011). This puts pressure on decision-makers, who will increasingly need to be well-informed in a timely manner to plan and design interventions for alleviating flood risk and CSOs. High-fidelity hydraulic modelling tools, such as InfoWorks ICM (Innovyze, 2021), are widely used to inform wastewater city scale intervention decisions. While these tools are accurate, they are computationally expensive to run because they represent the physical drainage network at high spatial and temporal resolutions (Salvadore et al., 2015). Thus, they are limited in ability to provide modelling support to decision-makers who are trying to simulate drainage network issues over large scales, particularly given the uncertainties associated with future conditions.
One such application in the UK is through introducing a framework for Drainage and Wastewater Management Plans (DWMP). This will require water companies to target investments more effectively and plan interventions in a unified approach for long-term planning (Water UK, 2019). These plans and investments must be supported by hydraulic model simulations able to assess the range of intervention scenarios typically done using design storm concept (Water UK, 2019). However, if hydraulic models are to properly capture the behaviour of wastewater interventions, then they must also use continuous rainfall to drive simulations, as opposed to the traditional design storm approach (Adams and Howard, 1986; Muhandes et al., 2021). These requirements have introduced a severe computational burden on modellers, who cannot accommodate both the uncertainty around future conditions and the requirement for use of continuous storms with a traditional modelling approach. Instead, an approach providing hydraulically based simulations that is accurate enough to provide estimates around flooding and CSOs that can be used in long-term planning, but without the computational burden associated with high-fidelity models, is essential in navigating these future requirements placed on water companies.
In the DWMP context, CSOs have been identified as one of the key indicators used in the risk-based catchment screening in order to establish the vulnerability of the catchment and determine whether it requires more detailed investigations (Water UK, 2019). As CSOs pose a serious risk to the environment and to human health, there is an increased interest to investigate the frequency and the quantity of CSOs on a wastewater catchment/city scale. Designing interventions that reduce CSOs requires simulation under scenarios that characterise potential futures (capturing factors such as climate change, population growth and urban creep) and optimisation or evaluation of plausible options (Claudine and Alain, 2015), both of which require significant computational efficiency.
The state-of-the-art in research has demonstrated that a reduced complexity approach to CSO modelling can be used to create accurate simulations in a fraction of the time (Nielsen et al., 2007; Morales et al., 2017). This enables modelling of CSOs in contexts that require rapid simulations, for example, Lund et al. (2020) use surrogate modelling to control CSO behaviour with optimisation of Model Predictive Control (MPC). These studies all employ some form of spatial aggregation to achieve the reduction in complexity. Even though they are significant simplifications, spatially aggregated modelling approaches can be acceptable by stakeholders when looking at high-level catchment interventions (El Hattab et al., 2020). To reduce the volume and frequency of CSOs, Sustainable Drainage Systems (SuDS) are now recognised as one of the most effective catchment interventions, demonstrated in hydraulic modelling (Riechel et al., 2020) and have become the standard method for surface water management in new developments in the UK (GLA, 2015). However, industry assessments of city-scale SuDS interventions require large scale catchment models to be simulated against design storms using a range of industry recognised storm durations (Singh et al., 2021; Webber et al., 2021). We identify a gap in assessing CSOs in an integrated and fast spatially aggregated model when assessing the benefits of implementing SuDS on CSOs.
A further benefit to reduced complexity modelling is the ability to extend model boundaries beyond drainage systems. Spatially aggregated hydraulic modelling has been used to represent the whole water cycle to inform decisions related to river water quality (Dobson and Mijic, 2020), real-time flood forecasting (Li and Willems, 2020) and supply-sewerage runoff treatment (Coombes et al., 2016). These integrated models were developed with the aim to reveal a wide range of alternative catchment management options without the need to run computationally expensive simulations. Aiming to meet the needs for fast and probabilistic flood modelling, Li and Willems (2020) developed a hybrid modelling approach that integrates spatially aggregated hydrological models that are calibrated to high-fidelity models to predict the occurrence of flooding. They found that the hybrid model can achieve up to 86% accuracy for flood warnings with 96% computational saving compared to the traditional high-fidelity approach. Meanwhile, Dobson and Mijic (2020) presented an integrated model, called CityWat, that represents water supply and wastewater infrastructure to simulate downstream river water quality. The CityWat model (Dobson and Mijic, 2020; Dobson et al., 2021) is an open-source lumped water management model of London water cycle processes. Each process is represented within CityWat at a city scale and the lumping helps with creating efficiency, enabling of sharing parameter information openly without national security concerns and providing the industry with easy-to-understand water management model. The CityWat model has proved to have capability to accurately simulate urban water system at a city scale, however, the model cannot be applied to assess the flood volumes or CSOs as it does not apply a limit on the discharge rate to rivers. Surcharge state, CSOs and flooding only occur when the drainage system is subject to flows/runoff higher than the discharge limit. The importance of the new lumped modelled approach manifests in enabling the industry to assess, develop and run long-term simulations for a wide range of applications such as multi-parameter optimisation, catchment interventions, climate change adaptation and multi-parameter sensitivity analysis with less computational efforts and higher flexibility introduced in the system design. Developing lumped models involves using the physical and spatially distributed hydraulic model parameters which helps enhance the lumped model accuracy.
In this study, we create a novel representation of combined sewer systems that is compatible with an integrated and spatially aggregated urban water model, CityWat (Dobson and Mijic, 2020). This integrated approach enables the representation of the combined sewer discharges into rivers, as well as the foul water overflows at the treatment works. We include a more detailed interaction between surface water, foul water and water supply model components which will improve the assessment of SuDS interventions. We assess and validate the new model (CityWatStorm hereafter) with a focus on flood volume and CSOs by comparing them to InfoWorks ICM simulations driven by continuous rainfall using Norwich city in the UK as a case study. Finally, we assess and compare the effectiveness of modelling SuDS interventions using simulation outputs from CityWatStorm compared to outputs from high-fidelity modelling simulations.
Methods
Overview
CityWatStorm is a novel representation of a combined sewer system that captures flood volumes and combined sewer overflows by considering the sewer discharge limit to rivers which is normally determined based on a specified rate (termed as greenfield runoff rate). We validated and examined the performance of the CityWatStorm against high-fidelity model simulation outputs using continuous historical storms. We deployed this method on a case study of the urban area including and surrounding the city of Norwich, UK. Model parameters were estimated from a combination of network data provided by the Anglian Water and openly available data (described in further detail in section Norwich Case Study). We used historical gauged rainfall data to run both a high-fidelity hydraulic model and CityWatStorm. Finally, we implemented SuDS at a city-scale in both CityWatStorm and the high-fidelity model to examine model's ability to capture SuDS performance. The workflow used in the study is shown in Figure 1.
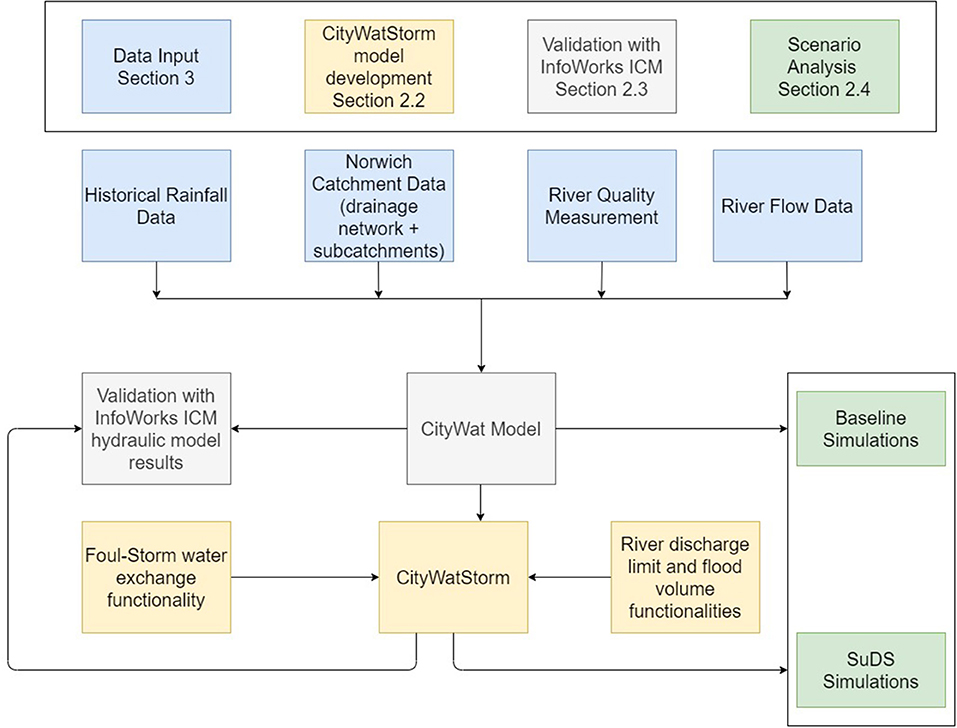
Figure 1. Diagram of methodology for developing, validating, and simulating CityWatStorm.
InfoWorks ICM® software (Innovyze, 2021) has been used in this investigation to carry out the hydraulic simulations. InfoWorks is an industry-standard advanced integrated catchment modelling software that enables users to model complex hydraulic and hydrologic networks and processes accurately. It is widely used around the world in both research as well as in industry and all UK water companies have their catchment models validated and calibrated in InfoWorks ICM, hence the decision to adopt the software in this investigation (Muhandes et al., 2021).
The CityWatStorm Model
We have developed CityWatStorm as an integrated model designed to capture the surface water hydraulic performance and its interaction with the foul network. This model is a novel representation of wastewater systems that is compatible with the existing CityWat model (Dobson and Mijic, 2020), which provided a spatially aggregated representation of key processes in the urban water cycle at city scale.
In CityWatStorm we develop two new model components to improve the representation of surface water and foul sewer processes. The key output variables from CityWatStorm analysed in this study are flood volumes, CSO and sewer discharge to rivers. The CityWatStorm model configuration is illustrated in Figure 2 with relevant process description given below and key equations summarised in Appendix A. The key variables introduced to the CityWat model are allowable river discharge limit applied on the surface water component, pass-forward capacity limit applied on the wastewater treatment works and storm/foul water exchange applied between the surface and foul water components to mimic the dual manholes in Norwich. These additions enabled CityWatStorm to estimate the flood volumes, the discharge to rivers and the CSOs.

Figure 2. Integrated water supply and wastewater modelling using CityWatStorm. Blue components show the original CityWat model. Brown components show the novel CityWatStorm foul water processes, and the beige components show the surface water processes developed as part of this study.
The surface water component within CityWatStorm (beige components in Figure 2) calculates the runoff volumes generated from precipitation over the Norwich catchment in daily timestep and dissipates 3 mm/day of the precipitation via evaporation (Leong et al., 2014). Then, the generated runoff after dissipation gets discharged to the river according to the limit applied on sewer discharge to rivers. Any runoff volume that was stored from the previous timestep will be added to the runoff volume before the model starts discharging into rivers. If the runoff rate is less than the allowable discharge rate, no volume will be utilised within the surface water drainage network and as a result, the network will not be surcharged and will not trigger any volumetric exchange with the foul network. However, when the runoff rate exceeds the allowable discharge rate, the volume within the surface water network will be utilised and the network will become surcharged which will trigger the exchange with the foul network. As the exchange is limited with a pre-defined capacity, there will be a potential flooding event should the remaining rate exceed the exchange rate.
Considering a discharge limit from the surface water drainage network is crucial to understand when the drainage system will be subject to free discharge condition (i.e., no surcharge), surcharge state (i.e., water rising above the pipe soffit levels) or flooding events (i.e., water leaving the system). Therefore, we have applied a limit based on the greenfield runoff rate of the whole catchment. The greenfield runoff represents the runoff rate that is generated from precipitation over a greenfield site. In the UK, authorities require new developments to limit any proposed discharge to the greenfield runoff rates for 2.3-year return period (referred to as Qbar) and this represents the maximum capacity of existing watercourses formed over time by surface water runoff (EA, 2013).
As for the foul water component of the model (brown components in Figure 2), the main flow inputs are from the household output added to the storm-foul exchange previously calculated in the surface water simulation. The leakage is then calculated as a percentage of the household output and subtracted from the overall foul flow. When the foul water gets to the treatment works, it sends the pass-forward flows to the river and the remaining flow is diverted into a temporary storage and then will overflow into the river as a CSO. As the Norwich catchment has interconnected foul and surface water manholes (termed as dual manholes), this means that a volumetric exchange can happen at multiple locations between the foul network and the surface water network whilst the network is surcharged. Once the exchange rate exceeds the exchange capacity, water will escape the network and flood. In CityWatStorm this has been represented in the spatially aggregated way using a link that replicates the foul-surface water exchange.
CityWatStorm Scenarios
Model Evaluation Against InfoWorks ICM
Since no observation data exists for this case study, we validate the CityWatStorm by simulating the Norwich catchment in both CityWatStorm and InfoWorks ICM and comparing the modelling results, which is a common practise in wastewater catchment modelling, e.g., Thrysøe et al. (2019). We used the hydraulic modelling results obtained from the high-fidelity InfoWorks ICM model as a reference and we compared CityWatStorm modelling outputs against this reference.
The validation process was undertaken using comparisons with simulations driven by 5-min resolution continuous historical storms (August 2018–October 2018), rainfall data has been provided in the Supplementary Materials. Longer time-series were not feasible to use because of the high computational cost of running InfoWorks ICM. We used the relative error (RE) to assess the total pluvial flood volumes from impervious areas, CSOs and discharge volume to rivers whereas we used the Coefficient of Determination (R2) to assess the accuracy of the time varying results of the same variables.
Implementation of City-Scale SuDS
To assess the hydraulic effectiveness of implementing SuDS and estimate the reduction in flood volumes and CSOs (betterment hereafter), the Norwich case study has been used to set the baseline models for the proposed CityWatStorm model and the high-fidelity InfoWorks ICM representations.
We define the hydraulic effectiveness of SuDS as the percentage reduction in flood volume and CSOs. In InfoWorks ICM, we represent the behaviour of SuDS interventions using the built-in method to divert runoff from sub-catchments into SuDS structures and thus represent the behaviour of SuDS interventions. We used this method (named as SuDS Controls) to implement 20% SuDS in the form of rain gardens across the catchment (Muhandes et al., 2021). We used a code in SQL which was developed in previous studies (Muhandes et al., 2021) to automate the process and introduce SuDS in the form of rain gardens as a percentage in all subcatchments and switch this SuDS percentage from an impermeable area into SuDS features that outfall into the subcatchments outlet node.
As for the CityWatStorm, SuDS has been introduced in an aggregated manner by changing the percentage of impervious catchment to reflect the percentage of SuDS uptake across the whole catchment and then introducing the reduced areas as green (pervious) areas in the CityWatStorm model. In section Norwich Case Study, we explain the setup and parameterisation of CityWatStorm for the Norwich catchment in detail.
Norwich Case Study
To test the hydraulic performance of the proposed CityWatStorm model and suitability of spatial aggregation, we use the Norwich combined sewer catchment. The Norwich catchment is illustrated in a simplified manner in Figure 3. The sewers in the catchment drain 68.5 km2 of foul sub-catchments and 29.9 km2 of surface water sub-catchments with 1,300 km of pipes, before discharging into rivers Wensum and Yare at multiple outfall locations. The Norwich case study is ideal for this experiment because it contains a combined sewer network, and it is large enough that running the model using the existing high-fidelity modelling tools for long rainfall timeseries (e.g., years, decades or centuries) is cost prohibitive which makes the case for the computational effort saving. The Norwich catchment and its InfoWorks ICM modelled representation, have been presented in a previous study (Muhandes et al., 2021).
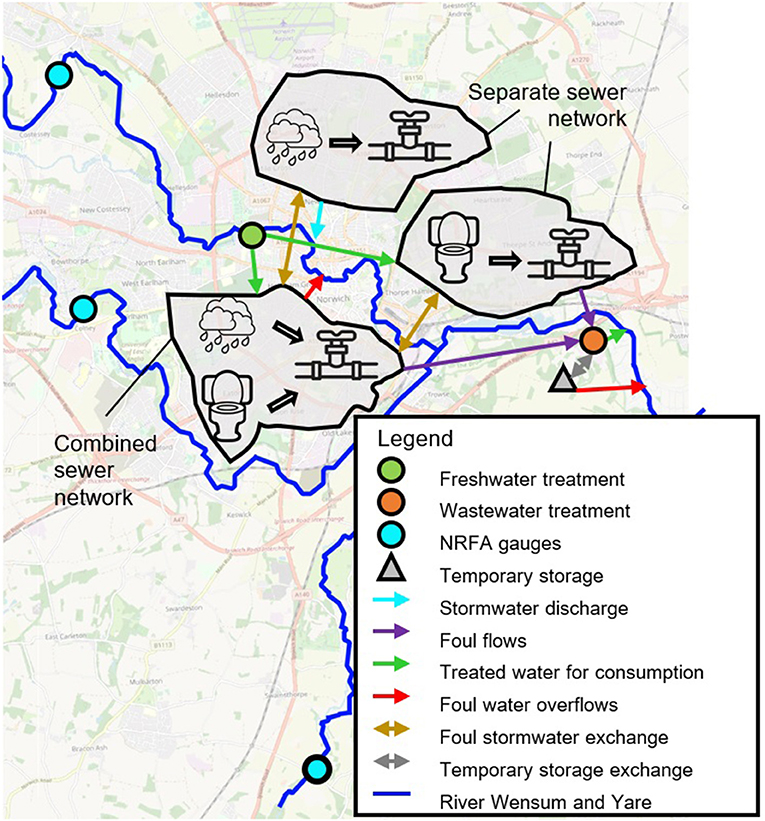
Figure 3. A map depicting the Norwich catchment and the interaction between water supply, surface water and foul water along rivers.
As discussed in the previous sections, the CityWatStorm model captures the interaction between water supply, surface water and foul water. River flows from both Wensum and the Yare are simulated with a maximum abstraction rate (acap) introduced to route water through a water supply network reaching the households (Nhousehold) in Norwich which then ends up in the foul sewers as domestic foul flows. Additionally, some sub-catchments have roof runoff that enters the foul network (a roof area shown in the InfoWorks ICM model to be 6.13 km2), in the CityStorm model this runoff also contributes to the simulated foul flow.
As for the surface water component, historical precipitation is modelled over Norwich impermeable area (Atotal) generating surface water runoff which is routed through a surface water network and then discharged to rivers according to an allowable discharge limit (Qlimit). Once the flow through the network is throttled because of the allowable discharge limit, a storm-foul water exchange will happen which will lead to flooding once the exchange rate exceeds the foul-stormwater exchange capacity (Capexch).
The hydraulic interactions between water supply infrastructure, drainage infrastructure and river flows within CityWatStorm are depicted in Figure 3.
The parameters shown in Table 1 are the ones that dominate the hydraulic behaviour of the CityWatStorm model, while the remaining parameters have been either obtained or scaled down from the original CityWat model (Dobson and Mijic, 2020). The Norwich combined sewer network data from the InfoWorks ICM model was used to inform the choice of most of the parameters. This information, however, could be defined even if only the asset data about the network, rather than the simulation model, were available. Justification for key parameters values selection is given in Table 1.
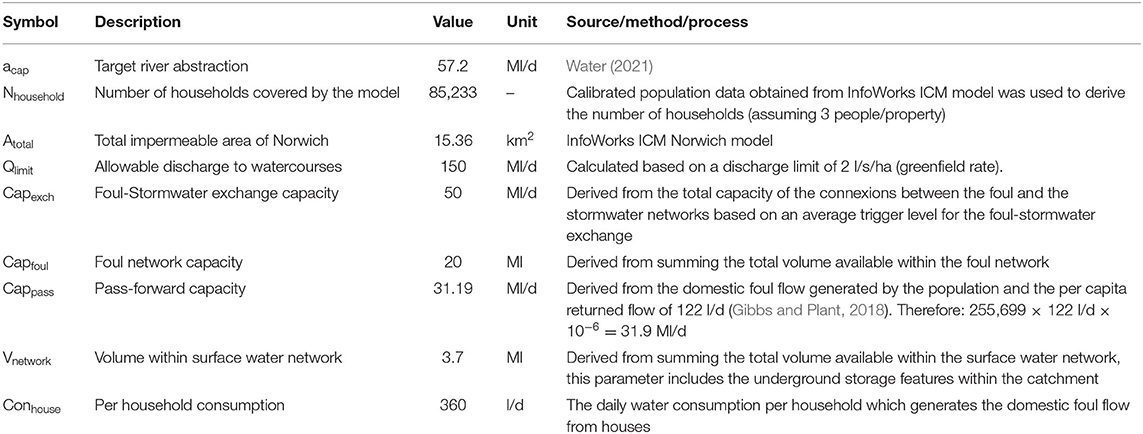
Table 1. CityWatStorm parameters for Norwich case study.
Results
Evaluation of the CityWatStorm Model
Flood Volume Comparison
The first experiment was to evaluate the CityWatStorm simulation results by comparing them with high-fidelity InfoWorks ICM modelling results. In Figure 4, we compare the total flood volume (Figure 4A) and the time-varying flood volume (Figure 4B). Figure 4A shows that CityWatStorm simulated a total flood volume with a relative error (RE) of 17.3%. Figure 4B shows that CityWatStorm simulates flood timings generally in line with InfoWorks. We see differences in the flood timings between days 13 and 16 because flow is instantaneous in the spatially aggregated CityWatStorm, while the time of concentration is captured by InfoWorks ICM. This causes a quicker response to rainfall events in CityWatStorm, but also quicker draining of the network that prevents flooding on subsequent days. The rapid response of CityWatStorm resulted in a relatively low Coefficient of Determination between the CityWatStorm and the InfoWorks ICM timeseries R2 = 0.21.
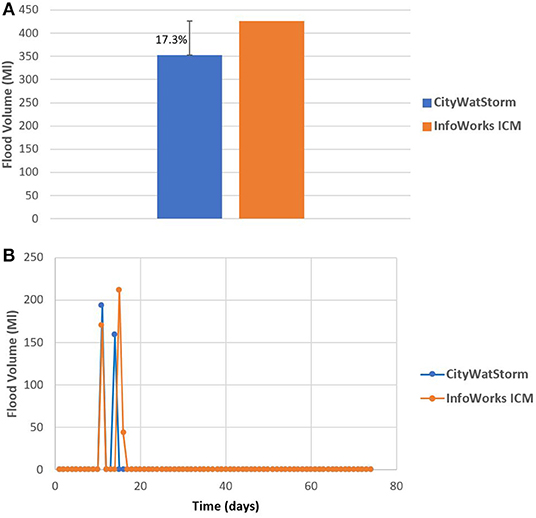
Figure 4. CityWatStorm vs InfoWorks ICM. (A) Total flood volume comparison. (B) Flood volume timeseries comparison.
Combined Sewer Overflow Comparison
In Figure 5, we compare the total CSO volumes (Figure 5A) and the time varying CSO rate (Figure 5B). Figure 5A highlights that CityWatStorm is capturing the total CSO volume with RE of 21.3%. Figure 5B shows that CityWatStorm struggles to capture temporal element of CSOs, nor can it capture the peaks accurately. This is because CSOs in InfoWorks ICM occur with significant spatial heterogeneity that cannot be captured by the citywide aggregation utilised by CityWatStorm.
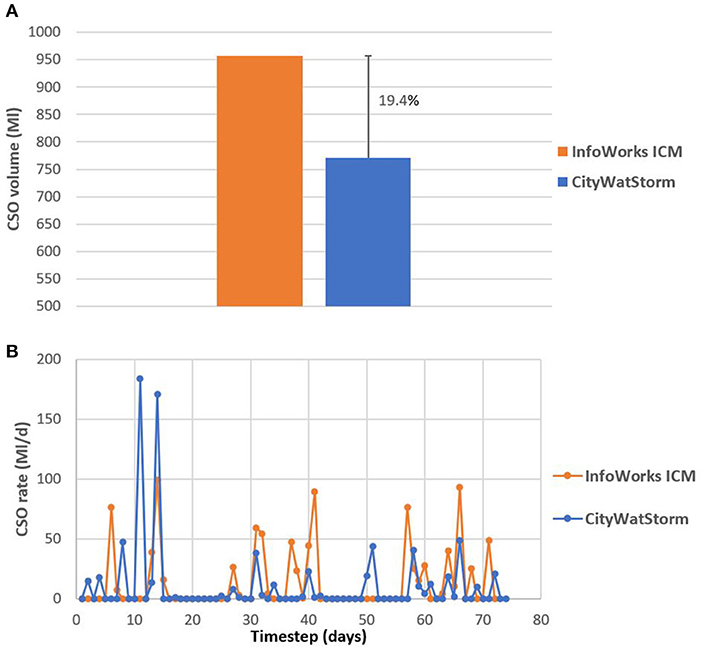
Figure 5. CityWatStorm vs. InfoWorks ICM. (A) Total CSO comparison. (B) Time varying CSO comparison.
By losing the spatial element of the physical network, the CSO response in CityWatStorm is not spatially distributed and hence the rapid and prolonged response which resulted in a low coefficient of determination between the CityWatStorm and the InfoWorks ICM time varying results R2 = 0.11.
Discharge Into Rivers Comparison
In Figure 6, we compare the total discharge volume (Figure 6A) and the time varying discharge to rivers (Figure 6B). Figure 6A highlights that CityWatStorm is capturing the total discharge to rivers within an RE equal to 18.6%. As with the CSO hydraulic performance (Figure 5), CityWatStorm started discharging to rivers 4 days earlier than InfoWorks ICM. Following this initial period, CityWatStorm captured the peaks and timings accurately with one large peak missed in day 41. The coefficient of determination between the CityWatStorm and the InfoWorks ICM time varying results R2 = 0.29 indicates a better agreement between the timeseries than the time varying flood volumes or CSOs.

Figure 6. CityWatStorm vs. InfoWorks ICM. (A) Total discharge to rivers comparison. (B) Time varying discharge to rivers comparison.
SuDS Modelling – Betterment Analysis
The next experiment is to implement SuDS on a city scale in both CityWatStorm and InfoWorks ICM and we drove both models with a 2-month historical storm (October 2018–December 2018). The aim is to test the hydraulic effectiveness of implementing SuDS when aggregating large catchment models. In this work we define the hydraulic betterment as the percentage reduction in CSO or flood volumes.
The introduction of 20% SuDS uptake in CityWatStorm resulted in a flood volume betterment of up to 43.1% whereas in InfoWorks ICM, the introduction of SuDS has resulted in a flood volume betterment of 39.5% (Figure 7). The slight variation in betterment is linked to the aggregation of the SuDS storage volume in one location which ensures that the available volume within the network is 100% utilised before generating any flood volumes, this is not the case in the physically represented models as flooding might occur when there is still capacity in other parts of the network.
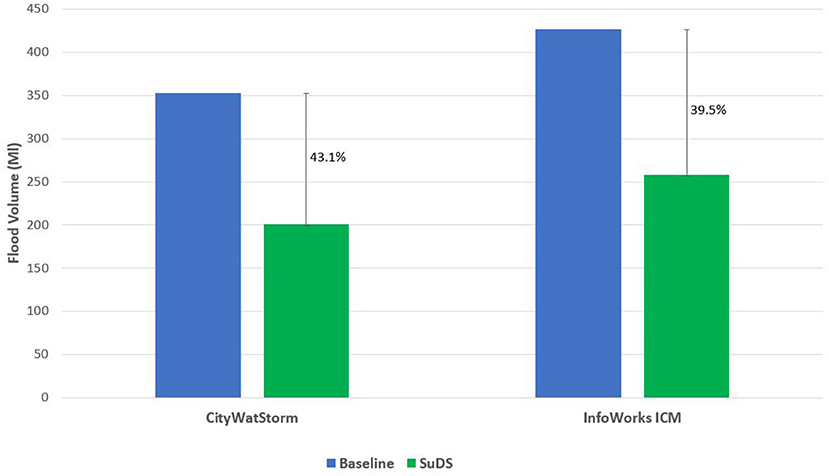
Figure 7. SuDS implementation - Flood volume betterment.
Similar to the flood volume SuDS assessment, Figure 8 shows that the introduction of SuDS in CityWatStorm resulted in a CSO reduction for up to 20.3% whereas in InfoWorks ICM, the introduction of SuDS has resulted in a CSO reduction of 18.4%.
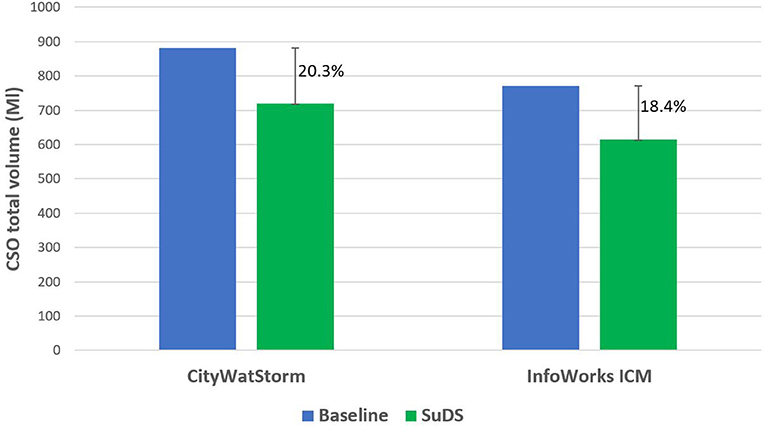
Figure 8. SuDS implementation – Total CSO volume betterment.
Similar to the SuDS betterment observed in flood volumes, the reduction of CSO volumes is greater in the spatially aggregated model as the model utilises all the volumes available within the foul and combined sewer networks before spilling to rivers and that is not the case in spatially distributed models.
In Figure 9, we compare the time varying CSO results between the baseline and SuDS scenarios in both InfoWorks ICM (Figure 9A) and CityWat (Figure 9B). We investigate the SuDS betterment by looking at the time varying CSO rate for both the baseline and the SuDS scenarios. The difference between the graphs (highlighted in green) represents the betterment. Figure 9A highlights that in InfoWorks ICM, the CSO betterment also manifested in a total removal of one CSO event in the baseline scenario (day 25) and a delay in the CSO event being triggered. However, Figure 9B highlights that in the CityWatStorm model, the betterment only manifested in an overall reduction in the CSO with no elimination of CSO events.
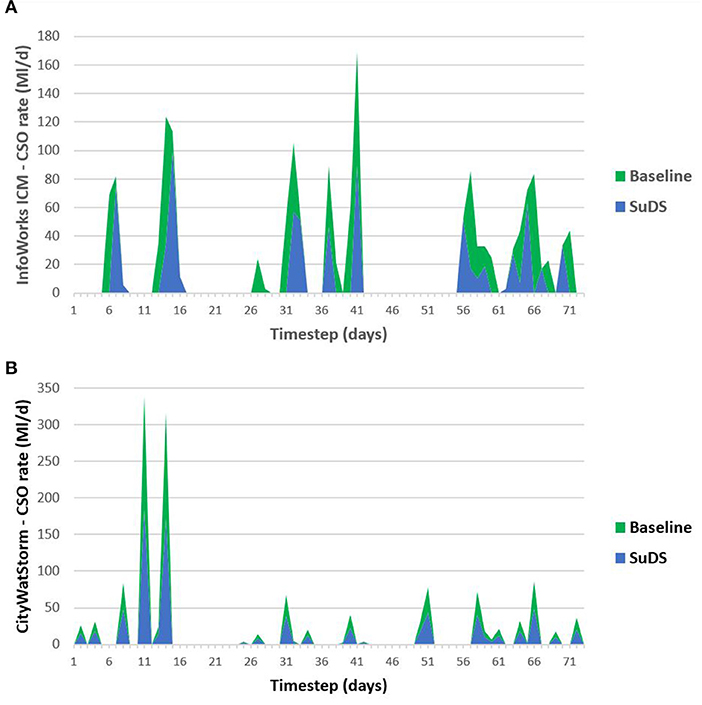
Figure 9. SuDS implementation - Time varying CSO betterment. (A) InfoWorks ICM simulation results. (B) CityWatStorm simulation results.
Discussion
The first aim of this study was to develop and evaluate a spatially aggregated modelling approach to rapidly simulate large urban catchment systems against continuous rainfall timeseries, which will reduce the computational efforts and enable multiple applications such as the optimisation of interventions against various climate projection scenarios. In Figures 4–6 we show that CityWatStorm has been able to capture the total flood volume, total CSO volume and total discharge to rivers volume. The lowest accuracy achieved was 80.6% which is comparable to the 86% accuracy achieved in the investigation conducted by Li and Willems (2020), however the speed improvement of 99.99% is far greater than the improvement of 96% reported in their investigation. A 2-month simulation period in InfoWorks ICM model took 26.7 h to run, whereas the CityWatStorm took 6.5 s to run the same catchment with the Intel(R) Core(TM) i7-8850H CPU @ 2.60 GHz computer. This means that for a 1-year continuous simulation, the CityWatStorm is able to achieve computational effort saving for up to 400 h. Furthermore, the CityWatStorm method does not require calibration against slow high-fidelity models, unlike the model presented in Li and Willems (2020). This suggests that the spatially aggregated approach can be suitable to assess long term system performance under climate projections. It may also be used to quickly assess catchments where no high-fidelity model is available to provide high-level information about the usefulness of SuDS and other wastewater system interventions.
The coefficient of determination values indicate a high variation between CityWatStorm and InfoWorks ICM timeseries, which is mainly due to CityWatStorm rapid response to surface runoff. We expect a further improvement when the CityWatStorm is upgraded to a semi-distributed representation, as is performed in Dobson et al. (2021). However, the results can still provide excellent value-for-effort when running large catchment models especially in the context of designing long-term planning interventions, optimisation against various climate projection scenarios or undertaking uncertainty analysis as the frequency of CSOs. Figures 4–6 show that CityWatStorm captures the main physical behaviour of the system, particularly in capturing the total flood, discharge and CSO volumes. The results from the 2-month simulation are influenced by the initial conditions and we expect a better agreement between CityWatStorm and InfoWorks ICM when running a longer timeseries rainfall (e.g., decades or centuries) with higher magnitude as once the volume available within the network is fully utilised, the time of concentration becomes irrelevant, and the spatially distributed drainage system will have a closer hydraulic behaviour to the spatially aggregated system. In future work approaches such as increasing the spatial resolution of the CityWatStorm model (Dobson et al., 2021) should be tested along with running longer timeseries rainfall.
The second aim of this study was to test the betterment achieved when implementing SuDS on a city scale in both CityWatStorm and InfoWorks ICM. Figures 7, 8 show that CityWatStorm can capture the betterment introduced by implementing SuDS accurately with a 5% higher betterment in CityWatStorm when assessing the total flood volumes and 2% higher when assessing total CSO volumes. The agreement between the SuDS betterment assessment in both CityWatStorm and InfoWorks ICM is due to the ability of the lumped approach to capture the overall runoff reduction regardless of the timing and spatial extent of the SuDS intervention. This means that for the same SuDS uptake percentage, the overall reduction in CSO, flood volumes and river discharge would fall within the same range, but the time-varying results will be different. This makes the case to use CityWatStorm when assessing the SuDS uptake on a city scale.
Muhandes et al. (2021) recommend the use of continuous storms to assess the role of SuDS uptake on a city scale, in this paper, we have used continuous storms and developed a rapid assessment tool to capture the SuDS betterment on a city scale. Future work can include more detailed representations of various SuDS types in a spatially distributed surrogate model of the type presented in Thrysøe et al. (2019), in order to establish the level, spatial extent and the timing of SuDS interventions required to combat climate change adaptation.
Conclusion
The development of the CityWatStorm spatially aggregated tool enabled a wider application of integrated modelling to assess the betterment of implementing SuDS using a continuous rainfall timeseries. The developed CityWatStorm model was shown to be able to capture the SuDS betterment achieving an accuracy of 96.4%, and it was also able to simulate total volumes of flooding, discharge to rivers or CSOs that were comparable to the high-fidelity InfoWorks ICM results. This demonstrates that CityWatStorm can be applied to rapidly undertake detriment/betterment analysis, sensitivity analysis, optimisation scenarios and catchment intervention assessment. We believe that this proposed model can help water companies develop their DWMP and assess their large catchment models against a range of long-term climate projection scenarios.
Data Availability Statement
The original contributions presented in the study are included in the article/Supplementary Material, further inquiries can be directed to the corresponding author/s.
Author Contributions
SM, BD, and AM developed the CityWatStorm model. SM performed code development and analysis of simulation results. AM and BD provided scope and discussion around model evaluation and SuDS impact analysis. All authors contributed to the manuscript writing and plots.
Funding
This study received funding from Project Centre Limited. The funder was not involved in the study design, collection, analysis, interpretation of data, the writing of this article or the decision to submit it for publication. The research reported in this paper was taken as part of the CAMELLIA project (Community Water Management for a Liveable London), funded by the Natural Environment Research Council (NERC) under grant NE/S003495/1.
Author Disclaimer
The views expressed in this paper are those of the authors alone, and not the organisations for which they work.
Conflict of Interest
SM is employed by Project Centre Limited. Project Centre Limited has funded the research and Innovyze has provided the software InfoWorks ICM®. The funding sponsors Project Centre Limited, Innovyze and Imperial College London had no role in the design of the study, in the collection, analysis, or interpretation of data, in the writing of the manuscript, and in the decision to publish the results.
The remaining authors declare that the research was conducted in the absence of any commercial or financial relationships that could be construed as a potential conflict of interest.
Publisher's Note
All claims expressed in this article are solely those of the authors and do not necessarily represent those of their affiliated organizations, or those of the publisher, the editors and the reviewers. Any product that may be evaluated in this article, or claim that may be made by its manufacturer, is not guaranteed or endorsed by the publisher.
Acknowledgments
The authors would like to thank Project Centre Limited for funding the research, Innovyze for providing the software (InfoWorks ICM®) used in this research and Anglian Water for providing the hydraulic model for research purposes. The simulation model used in this study are not available since they are the property of the private water company that owns it. The rainfall data used is available at the Centre for Environmental Data Analysis website https://catalogue.ceda.ac.uk/.
Supplementary Material
The Supplementary Material for this article can be found online at: https://www.frontiersin.org/articles/10.3389/frwa.2021.773974/full#supplementary-material
References
Adams, B. J., and Howard, C. D. D. (1986). Design storm pathology. Can. Water Resour. J. 11, 49–55. doi: 10.4296/cwrj1103049
Claudine, F., and Alain, M. (2015). Climate change impact on combined sewer overflows. J. Water Resour. Plan. Manage. 141:4014073. doi: 10.1061/(ASCE)WR.1943-5452.0000468
Coombes, P. J., Smit, M., and MacDonald, G. (2016). Resolving boundary conditions in economic analysis of distributed solutions for water cycle management. Austr. J. Water Resour. 20, 11–29. doi: 10.1080/13241583.2016.1162762
Dobson, B., Jovanovic, T., Chen, Y., Paschalis, A., Butler, A., and Mijic, A. (2021). Integrated modelling to support analysis of COVID-19 impacts on London's water system and in-river water quality. Front. Water 3:641462. doi: 10.3389/frwa.2021.641462
Dobson, B., and Mijic, A. (2020). Protecting rivers by integrating supply-wastewater infrastructure planning and coordinating operational decisions. Environ. Res. Lett. 15:114025. doi: 10.1088/1748-9326/abb050
El Hattab, M. H., Theodoropoulos, G., Rong, X., and Mijic, A. (2020). Applying the systems approach to decompose the SuDS decision-making process for appropriate hydrologic model selection. Water 12, 1–15. doi: 10.3390/w12030632
GLA (2015). London Sustainable Drainage Action Plan - Draft for Public Consultation. P. 73. Available online at: https://www.london.gov.uk/sites/default/files/lsdap_final.pdf (accessed May, 2021).
Leong, J., Tan, J., Charrois, J., and Ladewig, B. P. (2014). Review of high recovery concentrate management options. Desalination Water Treat. 52, 7609–7627. doi: 10.1080/19443994.2013.834273
Li, X., and Willems, P. (2020). A hybrid model for fast and probabilistic urban pluvial flood prediction. Water Resour. Res. 56, 1–26. doi: 10.1029/2019WR025128
Lund, N. S. V., Borup, M., Madsen, H., Mark, O., and Mikkelsen, P. S. (2020). CSO Reduction by integrated model predictive control of stormwater inflows: a simulated proof of concept using linear surrogate models. Water Resour. Res. 56, 1–15. doi: 10.1029/2019WR026272
Morales, V. M., Mier, J. M., and Garcia, M. H. (2017). Innovative modeling framework for combined sewer overflows prediction. Urban Water J. 14, 97–111. doi: 10.1080/1573062X.2015.1057183
Muhandes, S., Dobson, B., and Mijic, A. (2021). A method for adjusting design storm peakedness to reduce bias in hydraulic simulations. Proc. Inst. Civil Eng. Water Manage. 1–13. doi: 10.1680/jwama.20.00092
Nielsen, G. B., Nielsen, M. K., Mikkelsen, P. S., Madsen, H., Sulsbrück, P., and Taylor, H. (2007). Application of On-Line Data for CSO-Calculation and Its Consequences, Lyngby, DK. 1583–1590.
Nilsen, V., Lier, J. A., Bjerkholt, J. T., and Lindholm, O. G. (2011). Analysing urban floods and combined sewer overflows in a changing climate. J. Water Clim. Change 2, 260–271. doi: 10.2166/wcc.2011.042
Riechel, M., Matzinger, A., Pallasch, M., Joswig, K., Pawlowsky-Reusing, E., Hinkelmann, R., et al. (2020). Sustainable urban drainage systems in established city developments: modelling the potential for CSO reduction and river impact mitigation. J. Environ. Manage. 274:111207. doi: 10.1016/j.jenvman.2020.111207
Salvadore, E., Bronders, J., and Batelaan, O. (2015). Hydrological modelling of urbanized catchments: a review and future directions. J. Hydrol. 529, 62–81. doi: 10.1016/j.jhydrol.2015.06.028
Singh, A., Dawson, D., Trigg, M., and Wright, N. (2021). A review of modelling methodologies for flood source area (FSA) identification. Nat. Hazards 107, 1047–1068. doi: 10.1007/s11069-021-04672-2
Thrysøe, C., Arnbjerg-nielsen, K., and Borup, M. (2019). Identifying fit-for-purpose lumped surrogate models for large urban drainage systems using GLUE. J. Hydrol. 568, 517–533. doi: 10.1016/j.jhydrol.2018.11.005
Water UK (2019). A Framework for the Production of Drainage and Wastewater Management Plans. Available online at: https://www.water.org.uk/wp-content/uploads/2019/06/Water_UK_DWMP_Framework_Report_Main_280519.pdf (accessed March, 2021).
Water, A. (2021). Heigham Water Treatment Works. Retrieved from: https://www.onealliance.co.uk/project/heigham-water-treatment-works
Keywords: wastewater modelling, combined sewer overflows, reduced complexity modelling, SuDS, lumped modelling, urban flooding
Citation: Muhandes S, Dobson B and Mijic A (2022) The Value of Aggregated City Scale Models to Rapidly Assess SuDS in Combined Sewer Systems. Front. Water 3:773974. doi: 10.3389/frwa.2021.773974
Received: 10 September 2021; Accepted: 14 December 2021;
Published: 25 January 2022.
Edited by:
Susanne Charlesworth, Coventry University, United KingdomReviewed by:
Sumit Purohit, Pacific Northwest National Laboratory (DOE), United StatesFaisal Ahammed, University of South Australia, Australia
Copyright © 2022 Muhandes, Dobson and Mijic. This is an open-access article distributed under the terms of the Creative Commons Attribution License (CC BY). The use, distribution or reproduction in other forums is permitted, provided the original author(s) and the copyright owner(s) are credited and that the original publication in this journal is cited, in accordance with accepted academic practice. No use, distribution or reproduction is permitted which does not comply with these terms.
*Correspondence: Samer Muhandes, c2FtZXIubXVoYW5kZXNAaG90bWFpbC5jb20=