 Pradip Kumar Sikdar
 Sumanta Banerjee
 Surajit Chakraborty
- Department of Environment Management, Indian Institute of Social Welfare and Business Management, Kolkata, India
The quaternary hydrogeologic system of the South Bengal Basin in India with low natural topographic gradients, such as deltas and floodplains, is complex. This research elaborates the hydrogeologic system in and around the twin megacities of Kolkata and Howrah located on this complex delta of the South Bengal Basin and the rapid urbanization pattern during the past 30 years to understand the past, present (2016), and future (2030) behavior of the aquifer system and the advective flow paths of contaminants (wastewater, arsenic, and heavy metals) through hydrogeological simulations and field data. The groundwater model has been calibrated and validated by using the observed and simulated head. The root mean square error of the model is 1.07 m. The built-up area has increased from 142 to 243 km2 between 1985 and 2016, resulting in over-pumping of groundwater. About 93% of the available groundwater is abstracted, and as a result, the piezometric surface is declining at a rate of 13–37 cm/year and the groundwater trough in Kolkata is expanding at the rate of 8.60 km2/year. At places, the confined aquifer is behaving as an unconfined one, increasing the threat of land subsidence. The water quality is deteriorating in parts of Kolkata city where the groundwater is contaminated with wastewater, arsenic, and heavy metals, particularly in boroughs VIII and X. Contaminants from industrial sites may reach the strainer depth (100–120 m bgl) of pumping wells within a period of 20–25 years. The maximum simulated drawdown with respect to the predevelopment head is 22 m. If over-pumping continues, then simulation indicates that the head may drop by another 1.94–2.20 m by 2030. All this may endanger the health and well-being of millions of people living in the area in the near future.
Introduction
Currently, about 3.5 billion people, which is half of the world's total population, live in urban areas having 36 megacities catering to more than 10 million people (Banerjee and Sikdar, 2020). It is estimated that about 58% of the predicted global population of 2025, which is 8 billion, will be urban dwellers (Sahu and Sikdar, 2017; Banerjee and Sikdar, 2020). This enormous urban expansion will consume a significant quantity of natural resources and create serious environmental hazards and ecosystem deterioration through pollution of air, water, and land (Yan et al., 2016; Battista and de Lieto Vollaro, 2017). Groundwater, a vital resource, provides the major portion of the global urban water requirement and, thus, results in groundwater pollution and over-exploitation (Howard and Gelo, 2002). Climate change may also impact the future availability of groundwater resources (Brouyère et al., 2004; Chen et al., 2004; Scibek et al., 2007; Woldeamlak et al., 2007; Goderniaux et al., 2009, 2011; Van Roosmalen et al., 2009; Taylor et al., 2013). Groundwater abstraction on the Indian subcontinent increased from about 10–20 km3/year to ~260 km3/year between the mid-1950s and early twenty-first century (Shah et al., 2003; Shamsudduha et al., 2011). In the Ganges-Brahmaputra and Indus basins, the groundwater abstraction exceeds the potential groundwater recharge at the rate of ~246 km3/year (CGWB, 2006). Over-withdrawal of groundwater causes problems such as land subsidence, deterioration of water quality, saltwater intrusion, decline of the piezometric surface, and increased pumping costs (Sikdar et al., 1996; Hoque et al., 2007; Galloway and Burbey, 2011; Hosono et al., 2011; McDonald et al., 2011; Sahu and Sikdar, 2011, 2017; Banerjee and Sikdar, 2021). The deterioration of groundwater is more obvious for countries such as India, having more than 17% of the global population but only 2.5% of its geographical area (Patra et al., 2018; Banerjee and Sikdar, 2021). In India, the unsystematic urban sprawl, fast growth of population, and expedited speed of industrialization create immense stress on the hydrogeological resources (Foster, 1988; Yisa and Jimoh, 2010; Patra et al., 2018; Banerjee and Sikdar, 2021; Ram et al., 2021). This is coupled with the majority of the Asian cities not having any groundwater policy to protect the stressed aquifer and remediate contaminated aquifer.
Bengal Basin, the largest fluvio-deltaic system of Ganges-Brahmaputra-Meghna (Coleman, 1981; Alam et al., 2003) and the home to more than 235 million people, spreads over West Bengal (India) and most of Bangladesh. The net groundwater recharge in Bangladesh has changed due to the dramatic increase of groundwater abstraction in the Bengal Basin during 1975–2007 (Shamsudduha et al., 2011). Surface water pollution by sewage and industrial waste, introduction of high-yielding dry-season rice (Harvey et al., 2005), and increasing demand of water by growing megacities has resulted in a shift of the water-withdrawal policy from surface water to groundwater in the early 1970s in both countries (Mukherjee and Fryar, 2008). As a result, several million handpump-fitted wells and heavy-duty motor wells were installed to meet the demand for drinking, irrigation, and industrial purposes (Smith et al., 2000; BGS/DPHE/MML, 2001; Horneman et al., 2004; Harvey et al., 2005). The aquifer of the South Bengal Basin in West Bengal (India), located in the lower deltaic plain of the River Ganges, also is subjected to huge stress as a result of over-exploitation of groundwater due to rapid population growth and increase in urban sprawl (Banerjee and Sikdar, 2021).
The aquifer beneath two of the fast-growing megacities of the South Bengal Basin—Kolkata and Howrah—has been experiencing quality deterioration, lowering of piezometric surface, change of groundwater flow direction, expansion of groundwater trough, and change of aquifer behavior on a local scale (McArthur et al., 2018; Banerjee and Sikdar, 2021) due to the increase of built-up area and reduction of wetland and vegetation cover (Mukherjee et al., 2018). The estimated groundwater overdraft in 2016 is 408 × 103 m3/day, which lowered the piezometric surface by 34 cm within the study area, whereas the long-term decline of water levels is 13–37 cm/year (Banerjee and Sikdar, 2021). As a consequence, Kolkata and Howrah of the South Bengal Basin are moving toward an obvious water crisis. Some studies (Sikdar, 1996; Sikdar et al., 2001; Sahu and Sikdar, 2011, 2017; McArthur et al., 2018; Mukherjee et al., 2018) have already highlighted similar problems in a piecemeal manner.
Numerical models are used to understand and manage stressed hydrologic and groundwater systems under different pumping scenarios in different parts of the world (Konikow and Bredehoeft, 1974; Gorelick, 1983; Burges, 1986; Al-Layla et al., 1988; Biver, 1991; Bobba, 1993; Medina et al., 2001; Boronina et al., 2002; Sucharit and Panot, 2003; Ahmed et al., 2004; Ebraheem et al., 2004; Takounjou et al., 2009; Hashemi et al., 2012; Sohrabi et al., 2013; El Alfy, 2014; Maxwell et al., 2015; Mustafa et al., 2018, 2019, 2020; Sikdar and Sahu, 2018).
Groundwater flow models for the Bengal Basin were developed for Faridpur and Chapai Nawabganj (DPHE and BGS, 2001) and for Jennaidah and Jessore (JICA, 2002) in Bangladesh. The British Geological Survey (BGS) and the Bangladesh Department of Public Health and Engineering (DPHE) created kilometer-scale generic and site-specific 2-D horizontal and vertical models to understand the effects of abstraction and stratigraphy on travel times to wells as well as groundwater flow near a meandering river (DPHE and BGS, 2001). The Japan International Cooperation Agency (JICA) developed a series of 2-D and 3-D flow and transport models to simulate the transport of arsenic (As) and predict its movement under future groundwater use conditions in areas of western Bangladesh. Three models were constructed on a village scale and one on a more regional scale, ~9,000 km2 in area. The outcome indicated that deep pumping gave rise to downward flow of As, and consequently, suitable management of deep pumping was suggested (JICA, 2002). Several other groundwater modeling exercises have been carried out in the Bengal Basin (Michael and Voss, 2008, 2009a,b) and in areas of Bangladesh (e.g., MPO, 1987; DPHE and BGS, 2001; Burgess et al., 2002; JICA, 2002; Mustafa et al., 2018, 2019, 2020). A few studies focus on the Indian part (Sikdar and Dasgupta, 1997; Ghosh et al., 1999; Mukherjee, 2004; Mukherjee et al., 2007; McArthur et al., 2008; Sahu et al., 2013; Sikdar et al., 2013, 2018; Sikdar and Chakraborty, 2017). A five-layer steady-state mathematical model of groundwater flow in the, JAM area, West Bengal, India with a constant recharge of 100 mm/year to support the conceptual model of flow of groundwater was prepared by McArthur et al. (2008). The flow modeling was done using Visual MODFLOW® 3.0 (WHI, 2002), and the MODPATH module (Pollock, 1994) was used to track the paths of nonreactive particles entering the water table. Sahu et al. (2013) carried out hydrogeological simulation analysis to evaluate the impact on past, present, and future groundwater pumping for the region of Kolkata, India, on recharge area locations with a focus on sustainable management of groundwater resource. No work has been carried out on the aquifer of Howrah city and the surrounding rural and peri-urban areas that are contiguous to Kolkata's aquifer.
For sustainable groundwater management and policy making, reliable prediction of groundwater levels for different future scenarios are necessary (Mustafa et al., 2019). Because the twin cities do not have any water policy, it is imperative to chalk out a city water policy by understanding how the groundwater system in the past behaved, how it is reacting at the present to the imposed stresses, and how it will behave under future stresses. Therefore, the objectives of this research are to replicate the behavior of a natural system by defining the essential features of the system in some controlled physical or mathematical manner to (i) gain a better understanding of processes to how a system responds to a number of interactive simultaneous actions that defy intuitive analysis, (ii) answer environmental transport questions, (iii) predict and model different scenarios, (iv) evaluate groundwater resource, and (v) locate contamination sources. Thus, the novelty of the present study is that it contributes to better understanding the hydrogeologic system of the twin cities and their peri-urban areas to assess the resource potential, protect the stressed aquifer, predict future impact under different stresses, and remediate the contaminated aquifer. The model outputs are valuable not just in making groundwater science understandable, but also useful to generate interest among city policymakers to frame the much-needed city water policy.
Study Area
Geological Setting
The South Bengal Basin is characterized by extremely flat topography (Sikdar et al., 2013). The subsurface lithological assemblages of the upper few hundred meters comprise a buried late Pleistocene landscape of palaeo-channels and palaeo-interfluves overlain by Holocene channel/flood plain deposits (McArthur et al., 2018). The study area, which is a part of the Bengal Basin, is 436 km2, and it does not exhibit any prominent topographical features. It lies on both sides of the meandering River Hugli, which is the lifeline of the twin cities. The area covers Kolkata and Howrah cities and the surrounding peri-urban areas of the South 24-Parganas and Howrah districts (Figure 1C). The topographic elevation ranges between 3 and 8 m above mean sea level (msl). The study area has a fluvio-deltaic depositional environment. The peat layers in the upper horizons were deposited as result of boggy and marshy conditions at the end of the sedimentation process (Supplementary Figure 1; Sikdar, 2000). The irregular nature of the subsurface lithology is characterized by the filled up palaeo-channels and a natural levee on both sides of the River Hugli.
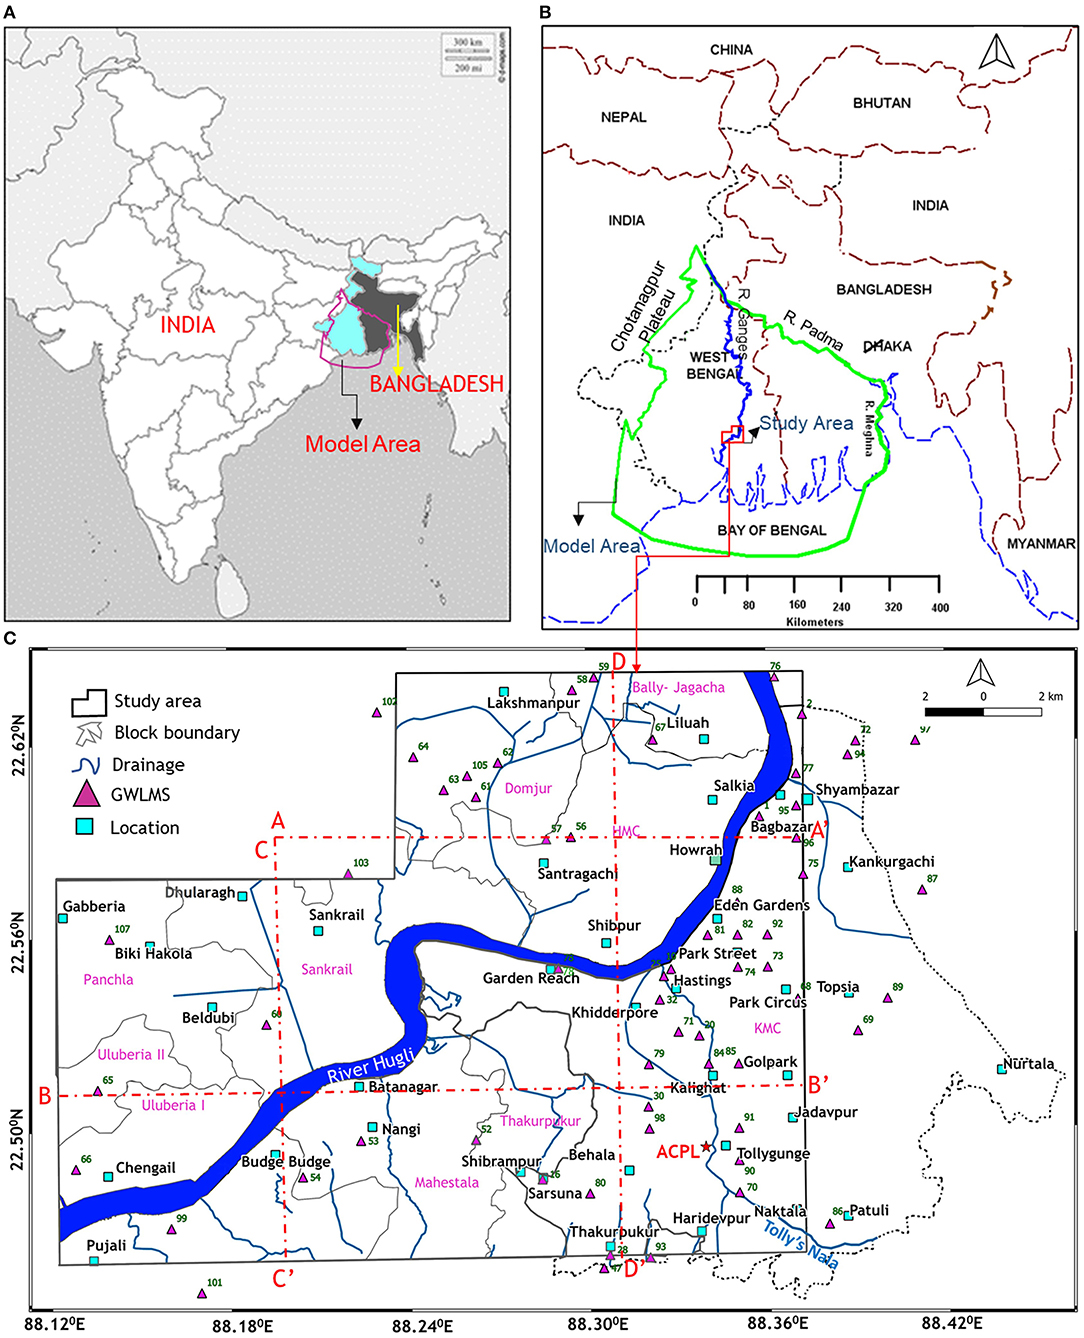
Figure 1. (A) Location of the model area in the map of West Bengal (India) and Bangladesh. (B) Location of the model boundary where the green line indicates the model boundary, the red boundary indicates the study area, the dotted blue line indicates the coastline, the brown line indicates the international boundary, and the black dashed line indicates the state boundary. (C) Location map of the study area showing block boundaries, drainage, groundwater-level monitoring stations (GWLMS) and section lines (AA′, BB′, CC′, DD′) for Figure 2.
The sedimentary architecture of the field area has been well-discussed by using borehole lithological data and geophysical data in Banerjee and Sikdar (2021) and Figure 2. A confining clay-silty clay layer of average 26.30 m thickness occurs at the upper part of sedimentary succession (Banerjee and Sikdar, 2021). The clay isopach map reveals that the thickness of the upper confining bed is 21 and 37 m toward the eastern and western sides, respectively, of the River Hugli. Below the upper confining bed, coarse clastic deposits consisting of fine-to-coarse sand at places mixed with gravel of about 300 m thickness (Supplementary Figure 1) form the Quaternary confined aquifer beneath the study area (Geological Survey of India (GSI), 1999; Sikdar, 2000; Banerjee and Sikdar, 2021). Spatially uncorrelated clay, silty clay, and clayey silt lenses of various dimensions within the sandy layer make the aquifer composition heterogeneous in nature (Sahu and Sikdar, 2017). The grain size sharply increases to sand lithofacies after 60 m bgl and up to 150 m bgl covering an area >400 km2 (Banerjee and Sikdar, 2021). Therefore, the screen of the wells in and around Kolkata and Howrah cities is mainly placed between 80 and 140 m bgl for groundwater abstraction.
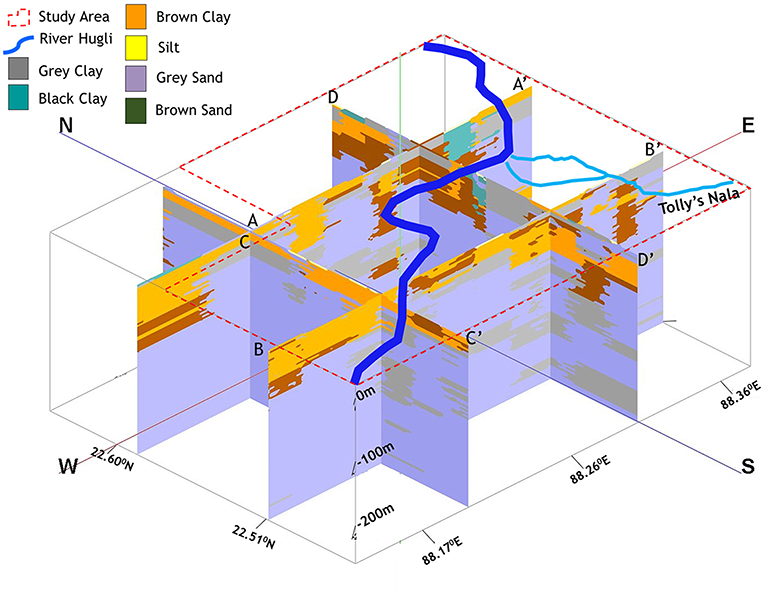
Figure 2. Three-dimensional subsurface geological sections of the area marked in Figure 1. The palaeo-channel Tolly's Nala (Adi Ganga), a previous course of the River Hugli, is also represented on the 3-D model (modified after Banerjee and Sikdar, 2021).
The presence of thick Holocene clay/silty clay and late Pleistocene Last Glacial Maximum Paleosol (LGMP) restrict any major infiltration of water from the River Hugli into the aquifer below (Sikdar and Dasgupta, 1997). The upper confining clay/silty clay bed is reduced to <10 m or absent at places, e.g., along the Tolly's Nala, Mahestala, and Budge Budge in the southern and southwestern parts of the study area (Figures 1, 5 of Banerjee and Sikdar, 2021). Below the Tolly's Nala, the Holocene clay/silty clay and the LGMP were not deposited, and gray sands occur, providing the passage for the Nala water to infiltrate into the underlying Quaternary aquifer system (McArthur et al., 2018).
Urban Growth and Demand for Groundwater
Since historical time, the steady growth of the urban area in and around the twin cities was influenced by the easy availability of surface water from the River Hugli and groundwater from the Quaternary confined aquifer (Sikdar et al., 2001; Banerjee and Sikdar, 2021). In Kolkata, the built-up area increased from 100 to 162 km2 by reducing the wetland and vegetation cover by 40 and 23 km2, respectively (Mukherjee et al., 2018), between 1980 and 2014, which is well-linked to the “neo-liberal” economic reforms of 1991. During the period of 1985–2016 in Howrah city, the built-up area increased from 27 to 38 km2, and the surrounding peri-urban and rural areas within the study area increased from 22 to 62 km2 (Banerjee and Sikdar, 2021). The estimated rate of urbanization between 1985 and 2016 for Kolkata and Howrah cities are 0.80%/year and 0.54%/year, whereas it is about 0.48%/year in the rural areas of Howrah, Mahestala, and Budge Budge (Banerjee and Sikdar, 2021). This expansion of the urbanized area by >3 km2/year has increased the total groundwater demand manifold.
In 1956, the estimated groundwater abstraction from the tubewells owned by Kolkata Municipal Corporation (KMC) was about 55 million l/day (mld), which jumped to about 182 mld in 1989 and 219 mld in 1992 (Banerjee and Sinha Roy, 1992). In 2006, the groundwater abstraction reduced to 144.3 mld (CGWB, 2006) due to the introduction of a surface water supply. Estimated groundwater draft by the motor pump–fitted KMC-owned and private wells is about 305 mld (CGWB, 2006), whereas the projected draft is about 320 mld during 2020–2025. Presently, about 10% of the total water demand for the 4.6 million people of the KMC area is supplied by exploiting groundwater from 265 KMC-owned, large-diameter wells with motor pumps and about 10,000 small-diameter public wells fitted with hand pumps (McArthur et al., 2018). Additionally, private motorized wells of industries, multistoried buildings, housing societies, shopping complexes, etc., exploit about 25% of the city's water supply from the Quaternary aquifer (Banerjee and Sikdar, 2021). The screens of these wells are placed between 80 and 140 m bgl (Maity, 2012; Chakrabarti, 2013; Chatterjee, 2014; McArthur et al., 2018).
Total drinking water demand of the 4.6 million permanent population and 6 million floating population of Kolkata city is about 1,262 mld1. The supply is about 1209.6 mld, out of which 1096.2 mld is surface water and 113.4 mld is groundwater. Officially, there is a gap of 37.8 mld between demand and supply (see text footnote 1). Considering a 35% loss due to pipeline leakage, Kolkata is a water-shortage city instead of being a water-positive city. The supply management issue along with the supply–demand gap, low water supply pressure, and a poor distribution network have resulted in increasing groundwater dependency. The supply of surface water in Howrah city and the peri-urban and rural areas of Howrah, Mahestala, and Budge Budge is insignificant with respect to the demand for domestic, agricultural, and small-to-medium–scale industries.
Deterioration of Hydrogeologic System
Indiscriminate withdrawal has led to a significant drop in groundwater levels and resulted in the formation of a groundwater trough in central and south-central Kolkata (Sikdar, 1996). As a consequence, the natural southerly groundwater flow direction toward the Bay of Bengal changed toward the direction of the trough (Sikdar, 2000; Banerjee and Sikdar, 2021). This area of the trough has increased by 15 times at the rate of 8.6 km2/year during 1985–2016 with core shifting in the east and resulting in the regional groundwater flow direction from west to east in the city (Banerjee and Sikdar, 2021). The groundwater level dropped by about 14 m and has created several cones of depression in the Quaternary aquifer system of Kolkata due to decades of high-capacity pumping (McArthur et al., 2018). On the other side of the River Hugli, the piezometric surface is declining since 1996 in Howrah city (Patra et al., 2018). In and around the study area, the rate of fall of piezometric surface is 13–37 cm/year (Banerjee and Sikdar, 2021). Over-withdrawal of groundwater since long ago has also deteriorated water quality, changed the aquifer behavior from confined to unconfined at places, and increased the chance of land subsidence in and around the two old but fast-growing megacities of south Bengal Basin (Banerjee and Sikdar, 2021).
Methods
Built-Up Area
The built-up area for 1985, 1993, 2003, 2016, and 2019, a proxy for population growth, is estimated by using Landsat 5TM and Sentinel 2B satellite images for the study area (436 km2) as well as for an additional area of 93 km2 of Kolkata, which falls outside the present study area. The built-up area for the individual block for the mentioned years is derived by the application of QGIS 2012 software and semi-automatic classification plugin (SCP) (Van Rossum, 2007). Accuracy assessment is done using overall accuracy and Kappa coefficient methods. Based on the change of the trend of the built-up area in each block, the predicted built-up class in 2030 is estimated.
The built-up area for each block within the study area and Kolkata is estimated for the abovementioned time slices. The block-wise built-up area is plotted against different years and extrapolated for 2030 by using the second order polynomial trend line method. The projected built-up area of Kolkata for 2030 is determined by extrapolating the built-up area since 2003 as the major expansion happened before that. The future pumping for the year 2030 is estimated based on the average rate of the change of the built-up area in between 1985 and 2019 in and around the study area.
Groundwater Flow Model
A conceptual hydrogeological model of the model area is prepared based on available subsurface lithological data, hydraulic conductivity, and basement depth. This is followed by developing a steady-state anisotropic homogeneous groundwater flow model (Sahu et al., 2013; Sikdar et al., 2013, 2018; Sahu and Sikdar, 2017; Sikdar and Chakraborty, 2017; Sikdar and Sahu, 2018). The MODFLOW-GUI preprocessor (McDonald et al., 2000; Winston, 2000) based on ArgusONETM is used here to develop a 3-D numerical model of the South Bengal Basin. The finite-difference method of MODFLOW is used for the simulation of groundwater flow through porous media. The modeling algorithm includes selection of code and verification; model design, which involves discretizing the space and time; calibration; sensitivity analysis; and finally, future predictions.
The pre-monsoon groundwater level of 62 monitoring stations for the year 2016 (Figure 1C) in and around the study area, which were collated from different government and private organizations (Banerjee and Sikdar, 2021), are used here for groundwater modeling purposes. The root mean square (RMS) errors between the observed and simulated heads are estimated for different runs. The lowest RMS error is considered for the validation of this model. The groundwater flow model is used to evaluate the spatial distribution of hydraulic heads and drawdown under pre-pumping and present pumping for the year 2016. The future pumping for the year 2030 is estimated based on the trend of the change of the built-up area calculated from the remote sensing analysis. Based on that, the hydraulic heads of the monitoring stations and drawdown of water level with respect to the year 2016 are generated. A groundwater budget of the study area is computed from the groundwater flow model for present and future development conditions.
Model Boundaries
Previous groundwater modeling and simulations in the Bengal Basin indicate that flow systems are both local and regional (Michael and Voss, 2009a; Sahu et al., 2013; Sikdar et al., 2013; Sikdar and Chakraborty, 2017). Therefore, to understand the complex impacts of groundwater withdrawal on the piezometric head, numerical simulations of regional-scale groundwater flow in the Bengal Basin is necessary. Similar to previous studies, a very large model area is considered here because of the layered but connected nature of the subsurface lithology. The model boundary (Figures 1A,B) on the western edge is a closed boundary drawn along the boundary between the crystalline rock and the unconsolidated sediments. The coastal boundary in the south is set as a prescribed head along the seafloor, extending several tens to hundreds of kilometers offshore with a vertical no-flow boundary at the southernmost edge of the model (Michael and Voss, 2008). Therefore, the model area extends from the River Ganges and River Padma in the north to the Bay of Bengal in the south and from the outcrop of Precambrian crystalline bedrock of the Chotanagpur Plateau on the west to the River Meghna in the east in Bangladesh (Figure 1B).
The density of seawater is taken into account by setting the head value at the seafloor to be equivalent to the freshwater head of water with density of 1.025 × 10³ kg/m3 at a depth determined by the bathymetry. The underlying Precambrian basement (granite) or a lithologic unit with very low permeability (shale) forms the impermeable bottom of the basin. In areas in which shale or granite is absent or cannot be identified, the top of a thick Pliocene clay bed, which is essentially impermeable to groundwater flow, is chosen as the model bottom (Deshmukh et al., 1973; Khan, 1991; Michael and Voss, 2008). The model depth varies between 10 and 3,000 m bgl.
The model top, represented by topography, is created from Shuttle RADAR Topography Mission (SRTM) elevation data (EROS, 2002) with a spatial and altitude resolution of 90 and 1 m, respectively. The elevation data is further subsampled onto the model grid by averaging the data points in each cell. As vegetation is generally low to the ground and dense tree cover is rare, it is not considered as a big problem for most of the model area except the Sundarban Biosphere Reserve. In the Sundarban area, where average elevation in a grid cell exceeds 4 m, it is taken as 4 m only (Michael and Voss, 2008) due to the dense mangrove cover.
Vertical and Horizontal Discretization
Vertical Discretization
The maximum model thickness is >600 m, and it depends on the topography and depth of the basement as revealed from the drillers' log (Deshmukh et al., 1973; MPO, 1987; Khan, 1991). The entire geological column consists of seven vertical units with differing thicknesses and vertical discretization (Supplementary Table 1).
Horizontal Discretization
The entire model area has been divided laterally into 177 (x) × 176 (y) cells (Supplementary Figure 2). The grid has 10 times finer discretization in the study area than the surrounding areas with cell widths that vary from 500 to 5,000 m. Fine discretization allows the detailed representation of the groundwater flow in and around the part of the South Bengal Basin, whereas coarse discretization in the larger area allows efficient modeling of the entire regional system.
Groundwater Abstraction
Groundwater withdrawal for drinking and domestic purposes is based on the estimated population for rural areas and number of wells in urban centers of Kolkata, Salt Lake, Howrah, Haldia, Rajarhat, and 24-Parganas (Supplementary Table 2). Population data for the districts of West Bengal are obtained for 2011 (Census, 2011) and projected for 2016 (the reference year for this current model) based on the decadal growth rate of the districts during 2001–2011. Population data for the districts of Bangladesh for 1991 are used to calculate the population of 2016 using the yearly growth rate of 2.09% (CIA, 2006). Irrigation pumping is estimated from the proportion of the surface area irrigated in each district [Water Resources Planning Organization (WARPO), 2000; Central Ground Water Board (CGWB) and State Water Investigation Directorate (SWID), 2009; State Water Investigation Directorate (SWID), 2009; Sahu and Sikdar, 2017] and an average yearly application depth of 1 m/year. Water utilization for the production of rice has been considered, and all other crops' use is assumed to be negligible. The amount of groundwater required for industrial purposes is accounted for in the total demand of water for Haldia, Kolkata, Salt Lake, the Leather Complex on the eastern fringe of East Kolkata Wetland, and some industrial parks located at Budge Budge and the Sankrail area of the Howrah district.
Base-Case Hydrogeological Parameters and Model fit
A conceptual homogeneous anisotropic model of the South Bengal Basin around Kolkata and Howrah has been developed based on available subsurface information (Sahu, 2008; Sahu et al., 2013; Sikdar et al., 2013, 2018; Ghoshal, 2015; Sahu and Sikdar, 2017; Sikdar and Chakraborty, 2017; Sikdar and Sahu, 2018). Equivalent horizontal hydraulic conductivity (Kh) and vertical hydraulic conductivity (Kv) values of the anisotropic aquifer system have been estimated from borehole log and pumping test data from primary and secondary sources. The equivalent anisotropy for each of the borehole logs is determined using the methodology of Ababou (Renard and de Marsily, 1997). Later, a homogeneous anisotropic steady-state groundwater flow model of the South Bengal Basin around Kolkata and Howrah is developed (Michael and Voss, 2009a,b; Sahu et al., 2013) in which it is assumed that the real heterogeneous aquifer can be simulated as a single homogenous porous medium with a porosity of 20%.
For the base-case hydrogeological parameters of the numerical model, the horizontal hydraulic conductivity (Kh), vertical hydraulic conductivity (Kv), and anisotropy (Kh/Kv) values of the anisotropic homogenous model of Sahu et al. (2013) for geological units, that is, Kh = 2.40 × 10⁻⁴ m/s, Kv = 1.60 × 10⁻⁷ m/s, and Kh/Kv = 1,500, are used with a prescribed head layer everywhere at the elevation of the land surface following Michael and Voss (2009a,b) and Sahu et al. (2013). Based on these Kh, Kv, and anisotropy, the RMS error of the model is derived for each run. Model calibration is done by evaluating RMS error, that is, the square root of the sum of the squared differences between the observed field data of the dry season in premonsoon 2016 for 62 groundwater-level monitoring stations (GWLMS) in and around the study area (Figure 1C and Supplementary Table 3) and the computed one under present development conditions for screen depth: 100–120 m bgl.
Model Sensitivity Analysis
For the evaluation of the impact of uncertainty in values of important hydrogeologic parameters, such as anisotropy, hydraulic conductivity, lateral boundary condition, and vertical discretization on the modeled head and flow paths, sensitivity analyses are carried out for both predevelopment and present development conditions. The sensitivity of the model is tested by varying the parameter values/conditions from that of the base case for predevelopment and present development conditions and measuring the hydraulic head of each GWLMS.
Grid Convergence Test
The sensitivity of the numerical model for flow paths to the vertical discretization is tested by changing the 34-layer base-case model to 17-layer and 68-layer models and running under both predevelopment and present development conditions.
Particle Tracking
MODPATH (Pollock, 1994) particles (non-reactive) are placed along the course of Tolly's Nala, through which wastewater percolates into the groundwater (McArthur et al., 2018; Banerjee and Sikdar, 2021). As has also been found in the groundwater samples at the nearby areas, whereas the source of the contamination is an abundant factory, Aceto Chemical Private Limited (ACPL; Figure 1C), located next to the Tolly's Nala. The particles are tracked forward, and the total distance covered by each particle in both horizontal and vertical directions and also the time taken to cover that distance are determined for predevelopment, present, and future development scenarios.
The particles are also placed at the surface over the major industrial areas outside KMC (Figure 14 and Supplementary Figure 7) to understand the movement of contaminants into the aquifer for the next 50 years under present stress condition by forward tracking of non-reactive particles.
Particles are also placed at wells' midscreen depth ranging between 76 and 220 m bgl, where heavy metals have been identified (Supplementary Figure 7). The particles are tracked backward under present stress condition to determine the recharge areas.
Results
Built-Up Area
The built-up area of each block for the years of 1985, 1994, 2003, 2016, and 2019 is given in Supplementary Table 4. It is observed that the peri-urban and rural areas show more increase of built-up area than Kolkata and Howrah cities (Supplementary Table 4). During 2016, the built-up area of the twin cities is 68% of their total area, whereas peri-urban and rural areas are only 31%. Based on the rate of increase in built-up area from 1985 to 2019 (Supplementary Table 4), the increase of built-up area in 2030 is estimated between 4.7 and 9.6% with an average of 7.5%.
Model Calibration
The RMS error of the model runs ranges from 1.07 to 3.40 m. The minimum RMS error (1.07 m) among all the tested combinations is considered as the base-case model. The plots of 62 GWLMS observed head of premonsoon 2016 and simulated head for RMS error 1.07 m (Figure 3 and Supplementary Table 3) is close to the 1:1 line and has R2 = 0.91. This indicates good agreement between the simulated and observed heads.
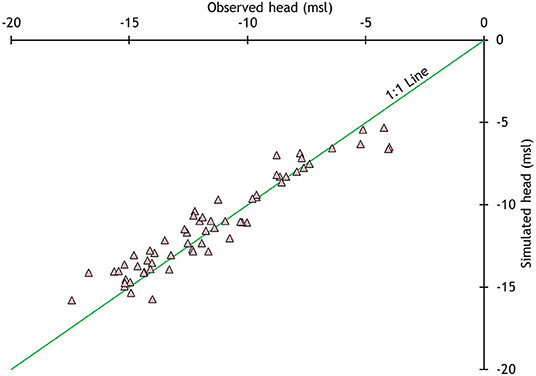
Figure 3. Cross-plots of simulated head with observed head of 2016 premonsoon.
The residuals between observed and simulated head of the GWLMS range between −2.6 and +2.5 m with an average of −0.43 m. The residual map (Supplementary Figure 3) shows no apparent trend in the residuals, which indicates that zoning of K values spatially and at different depths would not be likely to improve the fit to the observed heads. This supports the chosen spatially uniform base-case model's hydrological parameters.
Sensitivity Analysis
Sensitivity analysis has been carried out for predevelopment and present development conditions to evaluate the uncertainty of the simulated head by changing the hydrogeological parameters (e.g., anisotropy, hydraulic conductivity, boundary conditions, and vertical discretization) from the base-case conditions. The results of the sensitivity analysis are given in Supplementary Tables 5, 6.
Anisotropy
With increasing anisotropy, the minimum head of the GWLMS increases from 4.24 to 5.52 m above msl, whereas the maximum head decreases from 9.21 to 7.52 m above msl (Figure 4A and Supplementary Table 5). Mean, median, and mode heads of GWLMS also increase with increasing anisotropy. The more the change of anisotropy, the more the dispersion of head of GLWMS with respect to the base case (Figure 4B). Under the present development condition, with increasing anisotropy, the minimum head of the GWLMS decreases from 1.89 m above msl to 55.67 m below msl, and the maximum head decreases from 7.66 m above msl to 37.68 m below msl (Figure 4C and Supplementary Table 6). With increasing anisotropy, the predictive head in the GWLMS decreases sharply (Figure 4D).
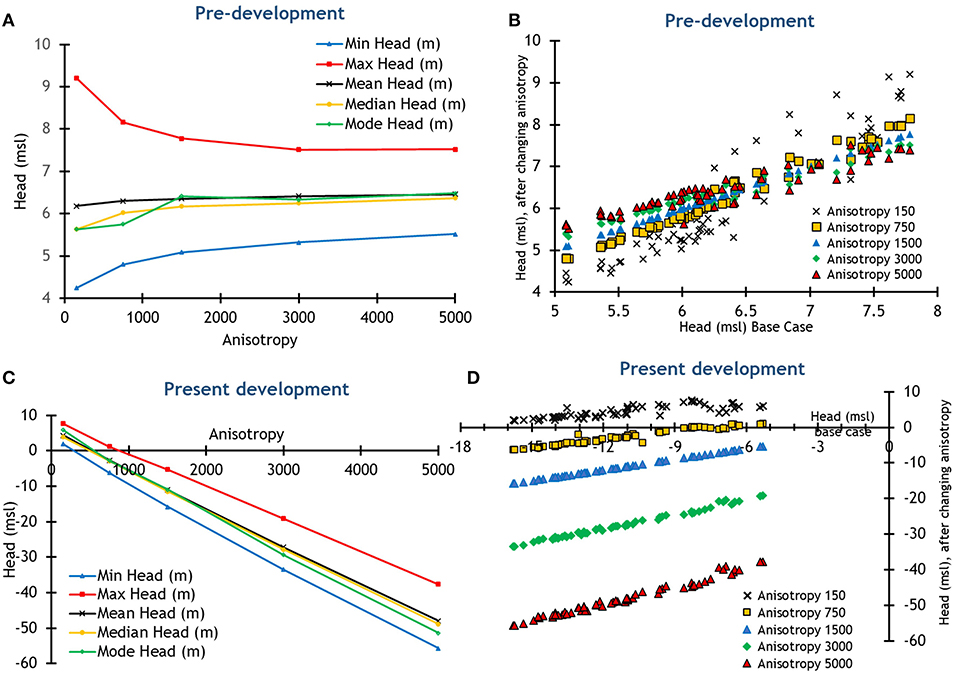
Figure 4. (A) Change of predictive head with respect to anisotropy under predevelopment conditions. (B) Change of predictive head under different anisotropy with respect to base-case head under predevelopment conditions. (C) Change of predictive head with respect to anisotropy under present development conditions. (D) Change of predictive head under different anisotropy with respect to base-case head under present development conditions.
Hydraulic Conductivity
The sensitivity of the hydrogeological model to hydraulic conductivity is tested in predevelopment and present development conditions by increasing and decreasing Kh and Kv values by two orders of magnitude with respect to the base-case hydraulic conductivity (Kh = 2.4e−4 m/s, Kv = 1.6e−7 m/s), whereas the anisotropy remains same as that of the base case (Kh/Kv = 1,500). Under predevelopment conditions, each increase in Kh and Kv values by two orders of magnitude results in negligible or no change of heads (Figure 5A and Supplementary Table 5). The sensitivity of the model to the change of hydraulic conductivity with respect to the base case in present development conditions is very high (Figure 5B and Supplementary Table 6).
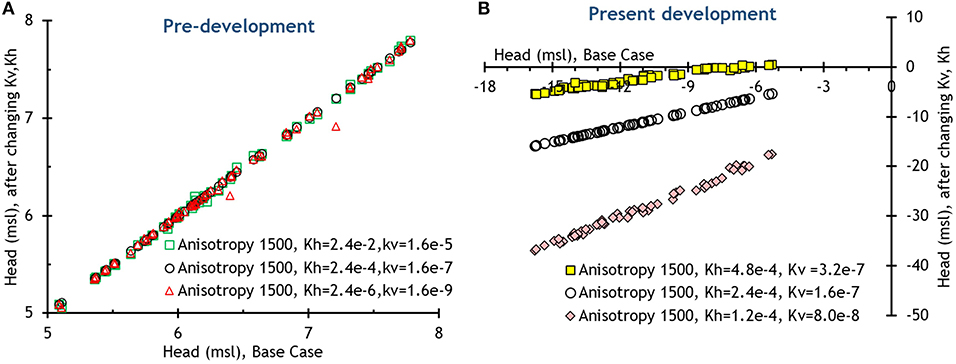
Figure 5. The change of the heads of GWLMS with the change of Kh and Kv values under (A) predevelopment and (B) present development conditions.
Boundary Conditions
The sensitivity of this hydrogeological model to the base-case boundary conditions (three sides of the base-case model are open, allowing free flow of water to cross these boundaries, and the western side is a vertical no-flow boundary) is tested. This test is performed by considering the rivers and the sea as no-flow boundaries. Under predevelopment and present development conditions, the change of boundary conditions with respect to the base case results in a negligible change in predictive head (Figure 6Aii and Supplementary Tables 5, 6).
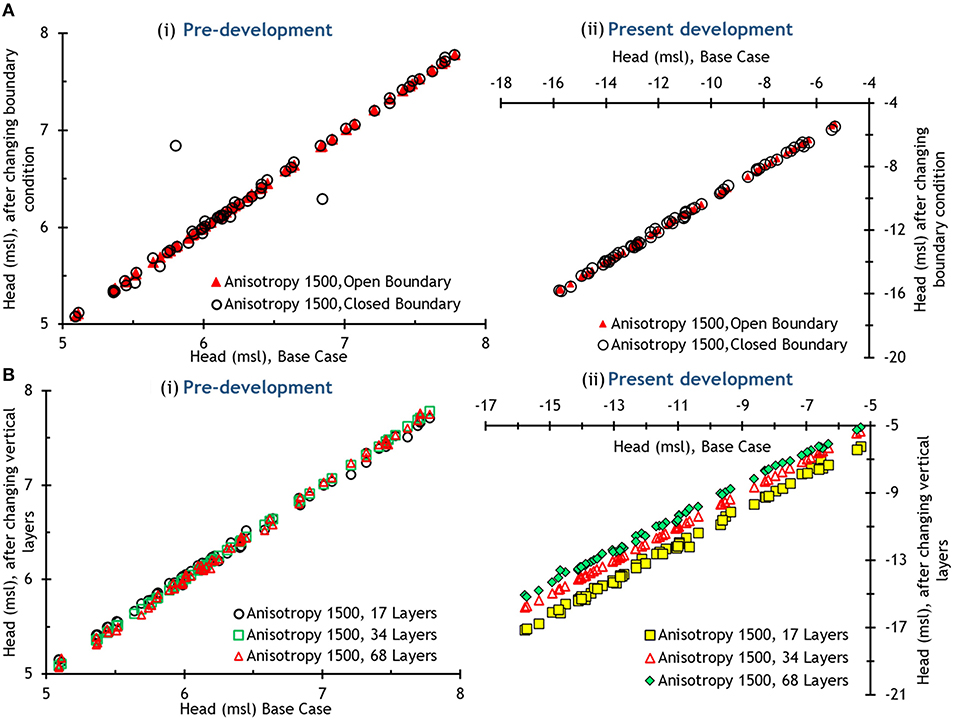
Figure 6. (A) The change of the heads of GWLMS with the change of boundary conditions under (i) predevelopment and (ii) present development conditions. (B) The change of the heads of GWLMS with the change of vertical discretization under (i) predevelopment and (ii) present development conditions.
Vertical Discretization
The sensitivity of the numerical solutions for heads to the vertical discretization is tested. The change of predictive head with respect to the base-case model under predevelopment conditions is negligible due to the change of vertical discretization (Figure 6Bi and Supplementary Table 5). Under present development conditions, the predictive head with respect to the base case model decreases with the increasing number of layers (Figure 6Bii and Supplementary Table 6; 17–68 layers). However, the average change of predictive head in GWLMS for the 17-layer model is 1.05 m below msl, whereas for the 68-layer model, it is 0.56 m above msl with respect to the base case model.
Groundwater Flow Simulations
Predevelopment Conditions
The predevelopment steady-state head distributions for the base-case hydrogeological parameters for the entire model area and in and around the study area for the depth range of 100–120 m bgl are shown in Figure 7 and Supplementary Figure 4A, respectively. In the hydrogeological system undisturbed by pumping, the groundwater flow is controlled by the local topography of the piezometric surface, which is assumed to follow the land surface. Simulation indicates that, in the predevelopment conditions, the influence of topography is prominent in the distribution of heads in the Quaternary confined aquifer. The regional groundwater flow is toward SSE. A local groundwater mound (defined by 8 m above msl piezometric surface contour) has formed in the central-western part of the study area over the Domjur and Sankrail blocks (Figure 7).
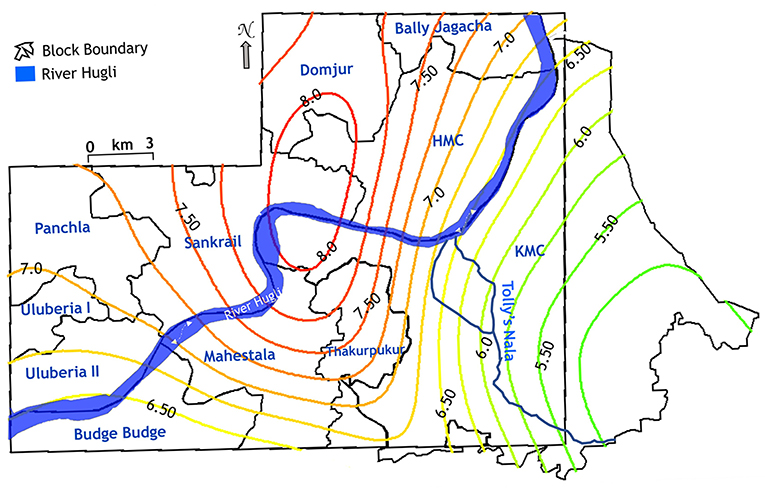
Figure 7. Spatial distribution of head (depth: 100–120 m) of the study area under predevelopment conditions.
Present Development Conditions
The present development steady-state head distributions for the base-case hydrogeological parameters for the entire model area and in and around the study area for the depth range of 100–120 m bgl are shown in Figure 8A and Supplementary Figure 4B, respectively. Under present development, a groundwater trough defined by 16 m below msl contour has developed in the eastern side of Kolkata city due to over-withdrawal of groundwater (Figure 8A). The simulated piezometric surface ranges between 6 and 16 m below msl. Generally, the groundwater flows from all directions toward the groundwater trough. The simulated drawdown (with respect to the predevelopment condition) is ≤ 22 m (Figure 8B and Supplementary Figure 5). This region of pumping-induced drawdown controls the groundwater flow of the area.
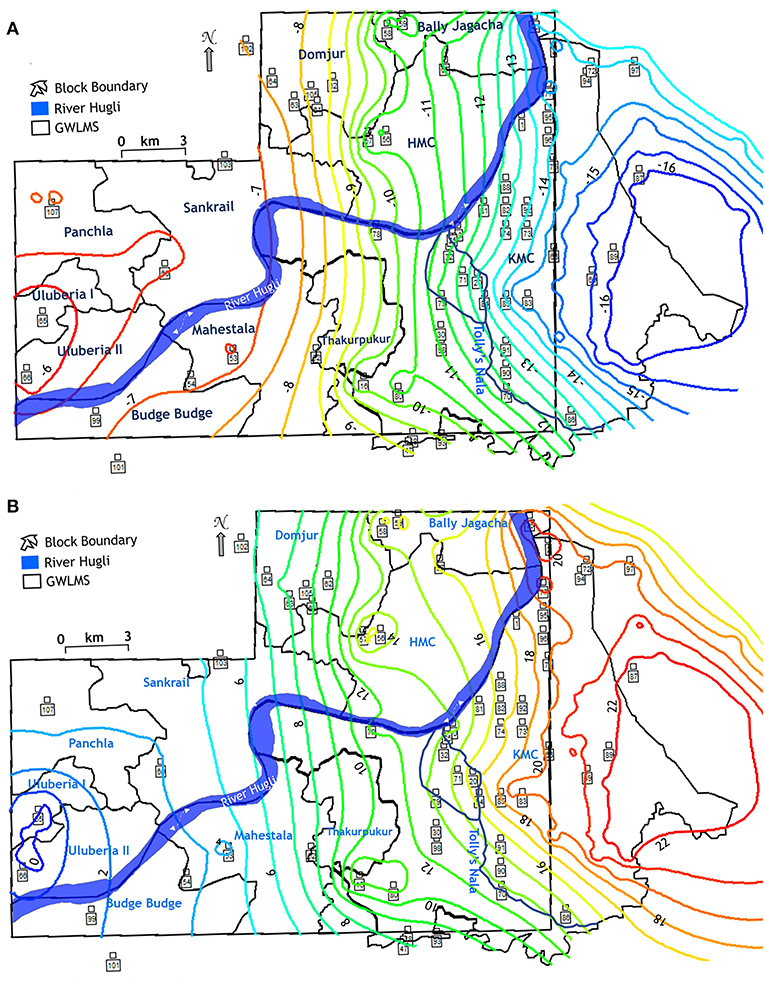
Figure 8. (A) Spatial distribution of heads (depth: 100–120 m) of the study area under present development conditions. (B) Spatial distributions of drawdown (depth: 100–120 m) with respect to predevelopment of the study area under present development conditions.
Future Development (2030) Conditions
The future development (2030) steady-state head distributions for the base-case hydrogeological parameters for the entire model area and in and around the study area for the depth range of 100–120 m bgl are shown in Figure 9A and Supplementary Figure 6A, respectively. Under future development conditions, the area of the groundwater trough increases, and the depth increases by >2m compared with that of the present development in the eastern side of Kolkata city due to the over-withdrawal of groundwater (Figure 9A). The simulated head ranges between 8 and 20 m below msl. The simulated future development drawdown (with respect to the current development condition) ranges from 1.94 to 2.20 m (Figure 9B).
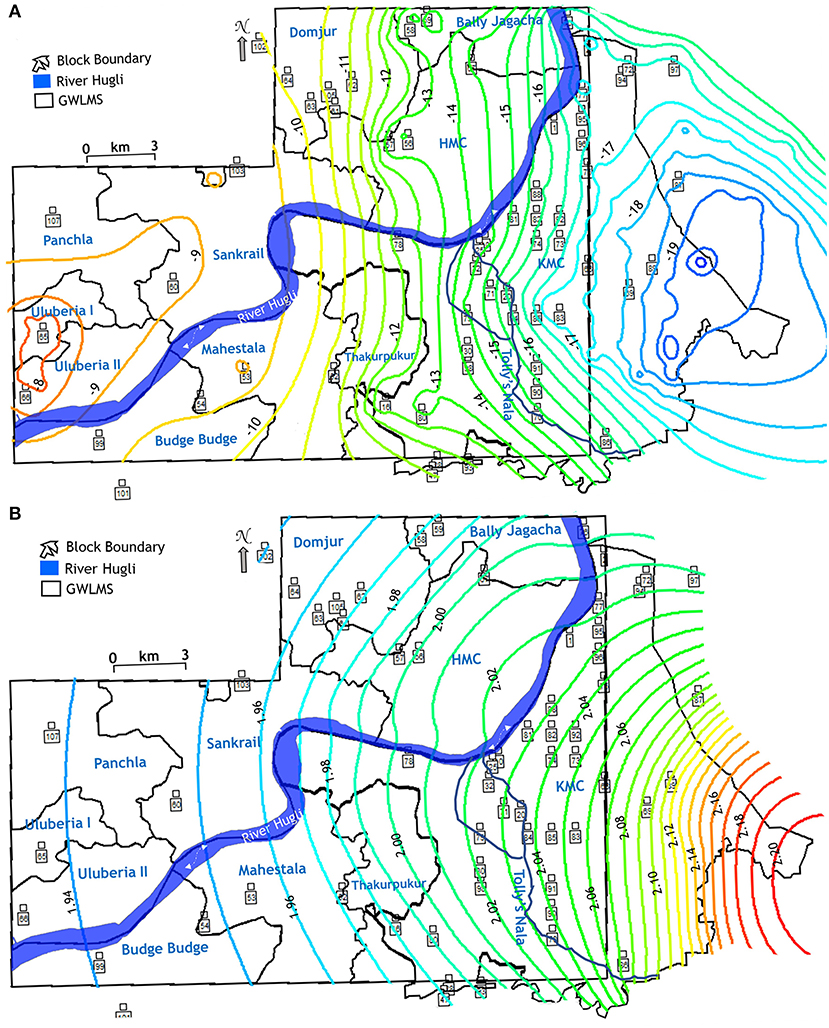
Figure 9. (A) Spatial distribution of heads (depth: 100–120 m) of the study area under future development (2030) condition. (B) Spatial distribution of drawdown (depth: 100–120 m) with respect to present development of the study area under future development (2030) condition.
Groundwater Budget
The predicted groundwater inflows and outflows in the aquifer system of the study area under present and future development conditions are given in Supplementary Table 7. In the present development conditions, about 93% of groundwater is abstracted through wells, whereas in the future development conditions, about 93.7% of groundwater will be abstracted through wells.
Discussion
The predictions of the groundwater numerical model are strongly influenced by the uncertainties resulting from model parameters, data input, and the conceptual hydrogeological model (Refsgaard et al., 2006). Change of climatic conditions and groundwater abstraction add more uncertainties to the model predictions (Mustafa et al., 2019). In this research paper, model structure, boundary conditions, discretization, hydraulic conductivity, and grid convergence are taken into account during sensitivity analysis for predevelopment and present development scenarios. The conceptual model structure has been developed by using the available subsurface lithological data and hydrogeological parameters followed by the development of a steady-state anisotropic homogenous groundwater flow model (Sikdar et al., 2013, 2018; Sahu and Sikdar, 2017). The model has been calibrated and validated by using the observed head data of the GWLMS during 2016 with the simulated head data. The difference between observed and simulated heads of the base-case model (RMS error = 1.07 m) is possibly a cumulative manifestation of measurement errors, errors in the specified head boundaries, discrepancies in topographic elevations, errors in the specific head boundaries, and spatial variability of aquifer parameters not accounted for in the model. Numerical simulation shows that the effect of topographic elevation on the head distribution is prominent during the predevelopment conditions. Under present pumping conditions, the groundwater flow in the confined aquifer system in the study area is controlled by the drawdown.
In aquifer systems, lowering of porewater/hydrostatic pressure due to groundwater abstraction results in an increase in the lithostatic pressure acting on the aquifer matrix. To compensate for these intrinsic stress changes, the aquifer material is subjected to poroelastic deformation through changes in aquifer material and pore volume. This, in turn, induces changes in the effective pore network and, thus, in the hydraulic properties of the aquifer. Therefore, the piezometric heads are not significantly sensitive to hydraulic conductivity under predevelopment conditions but highly sensitive under present development conditions with heavy groundwater abstraction.
It is also noticed that the change of boundary conditions under both the predevelopment and present development stress field has minimum effect on the piezometric heads. The change of heads with respect to the base-case model under predevelopment conditions is negligible due to the change of vertical discretization (Supplementary Table 5). Under present development conditions, the heads with respect to the base-case model decrease with the increasing number of layers (17–68 layers). Therefore, the 34-layer model can be considered as sufficiently discretized in the vertical direction to provide a reliable numerical representation for the base-case model. Due to the large basin scale modeling area, the uncertainty in model prediction has not been carried out. Uncertainty in model predictions for a large model area are relatively less compared with that of a small model area because characterization methods are well-suited to discern bulk properties, and field observations directly reflect bulk system properties (Sahu and Sikdar, 2017).
The accelerated pace of the growing population and urban sprawl has already posed tremendous stress on the Quaternary aquifer system beneath the study area. The built-up area had increased from 120 to 180 km2 between 1985 and 2016 (Supplementary Table 4). Therefore, in 2016, about 68% of the area of the twin cities is covered by the built-up area. During the same period, the built-up area has increased from 22 to 62 km2 (Supplementary Table 4) in the peri-urban and rural parts of the study area. To meet the demand of the increasing population, groundwater has been over-exploited, resulting in the lowering of piezometric surface by 13–37 cm/year (Banerjee and Sikdar, 2021), the estimated overdraft being 408 × 103 m3/day in 2016 (Banerjee and Sikdar, 2021). The continuous over-drafting during 1985–2016 has also caused exponential expansion of the groundwater trough (Banerjee and Sikdar, 2021) by 15 times to the tune of 8.60 km2/year.
The groundwater numerical model under present development (reference year 2016) conditions also shows the groundwater trough in the central and eastern sides of Kolkata city. The built-up area in Kolkata city was more than 70% in 2016. The increasing population growth within and beyond the eastern side of the city limit has caused comparatively higher drawdown and expansion of the groundwater trough (Figure 8B) in that direction. The piezometric surface at the core of the trough is 16 m below the msl, and the groundwater flows from all directions toward the groundwater trough (Figure 8A).
According to CGWB (2020), an area is categorized as “critical” if the stage of groundwater development is between 90 and 100% with significant long-term decline of the piezometric head in the pre-monsoon and post-monsoon periods. In the present study area, the stage of groundwater development is 93% (Supplementary Table 7) with significant long-term decline of the piezometric head and, hence, can be categorized as critical. In 2030, the stage of groundwater would increase to 93.7% (Supplementary Table 7) and, hence, would continue to be critical.
The simulated drawdown (with respect to the predevelopment conditions) ranges from <2 to 22 m (Figure 8B and Supplementary Figure 5). It is expected that, if over-pumping continues as a result of the increase in urban area by 7.5%, the piezometric surface will drop further by 1.94–2.2 m in 2030 (Figure 9B). The estimated land subsidence for the 1 m drop of the hydraulic head varies between 2.7 and 6.2 cm with an average of 5.43 cm (Banerjee and Sikdar, 2021). Therefore, as a consequence of the further lowering of piezometric surface by 2030, an expected land subsidence of 10.32–11.97 cm may happen in and around the study area. The areas in which the piezometric surface already occurs below the base of the upper confining layer local unconfined condition has developed in the aquifer system (Banerjee and Sikdar, 2021). These areas are more vulnerable to land subsidence due to the further drawdown of the water level by 2030. Moreover, change of aquifer behavior from confined to local unconfined conditions may develop at new places in the near future where the piezometric surface now occurs just above the base of the upper confining clay/silty clay bed due to the further decline of the piezometric surface.
Movement of Contaminated Groundwater
Case 1: Particles Placed on Tolly's Nala
Kolkata's aquifer is contaminated with high-Cl sewage effluent (McArthur et al., 2018; Banerjee and Sikdar, 2021) and As >10 μg/L generated from a pollution plume that originated from an industrial site producing Paris Green (arsenical pesticide) close to Tolly's Nala between 1965 and 1985 (Sikdar, 1996; McArthur et al., 2018). One hundred and three MODPATH nonreactive particles (Pollock, 1994) are placed along the course of Tolly's Nala beneath which the aquifer is contaminated with As >10 μg/L and wastewater (Sikdar, 1996; Sikdar et al., 2001; McArthur et al., 2018; Banerjee and Sikdar, 2021) and tracked in the forward direction from Tolly's Nala to the discharge locations. The generated path lines provide insight into the part of the aquifer where As would travel under different pumping conditions: predevelopment (Figures 10A,B), present development (Figures 11A,B), and future development (Figures 12A,B) stress conditions. The particles are transported through the aquifer by advection at an average rate equal to the average velocity of groundwater as predicted by MODPATH. The results are given in Supplementary Table 8. Modeled flow paths tracked in the forward direction from Tolly's Nala to the discharge locations under future development conditions indicate that the infiltrated wastewater and As may reach the screen depth (100–120 m) of few wells in Boroughs VIII and X of Kolkata within 48–172 years (Figures 12A,B). Several wells have been identified in Boroughs VIII and X where groundwater is already contaminated by wastewater and As (Figure 13), confirming the outcomes of the MODPATH simulation. Some pollutants may travel a long distance and pollute the wells located in Boroughs X, XI, XII, and East Kolkata Wetland area in few hundred years' time (Figure 13).
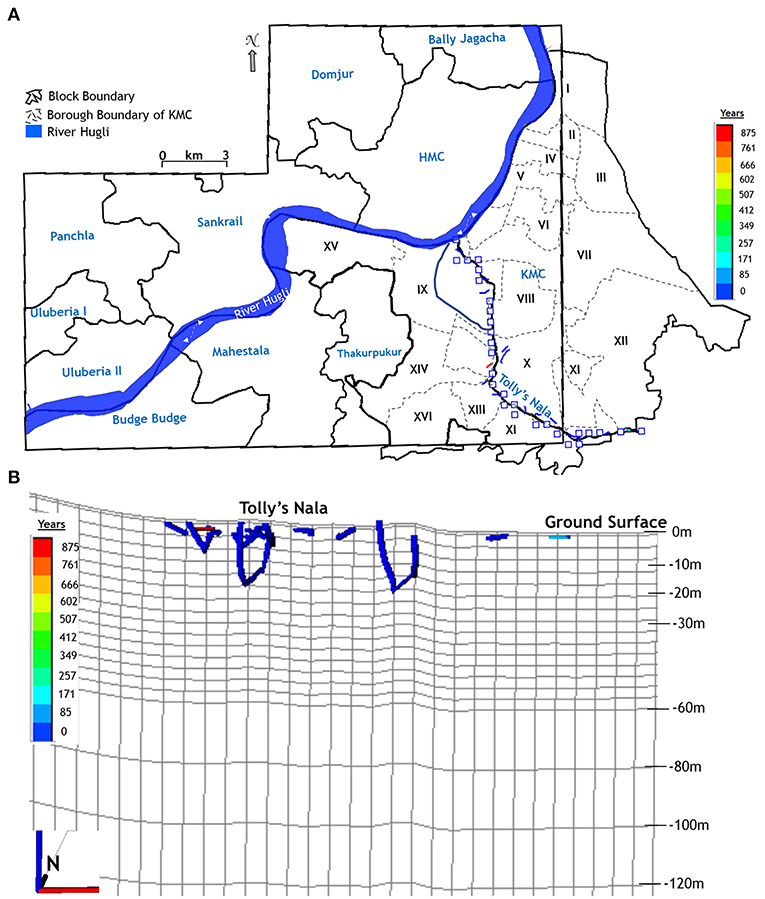
Figure 10. (A) Path lines of forward tracked particle under predevelopment pumping conditions. (B) 3-D view of particle path lines from Tolly's Nala (recharge area) into the aquifer under predevelopment conditions; vertical exaggeration is 75x.
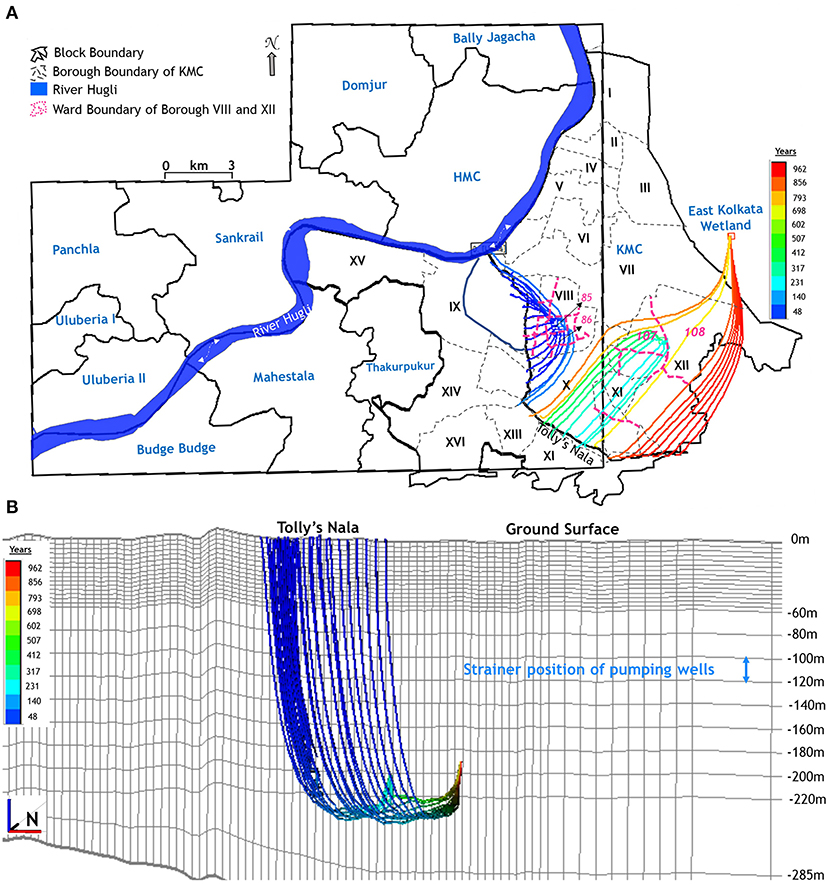
Figure 11. (A) Path lines of forward tracked particle under present development pumping conditions. (B) 3-D view of particle path lines from Tolly's Nala (recharge area) into the aquifer under present development conditions; vertical exaggeration is 75x.
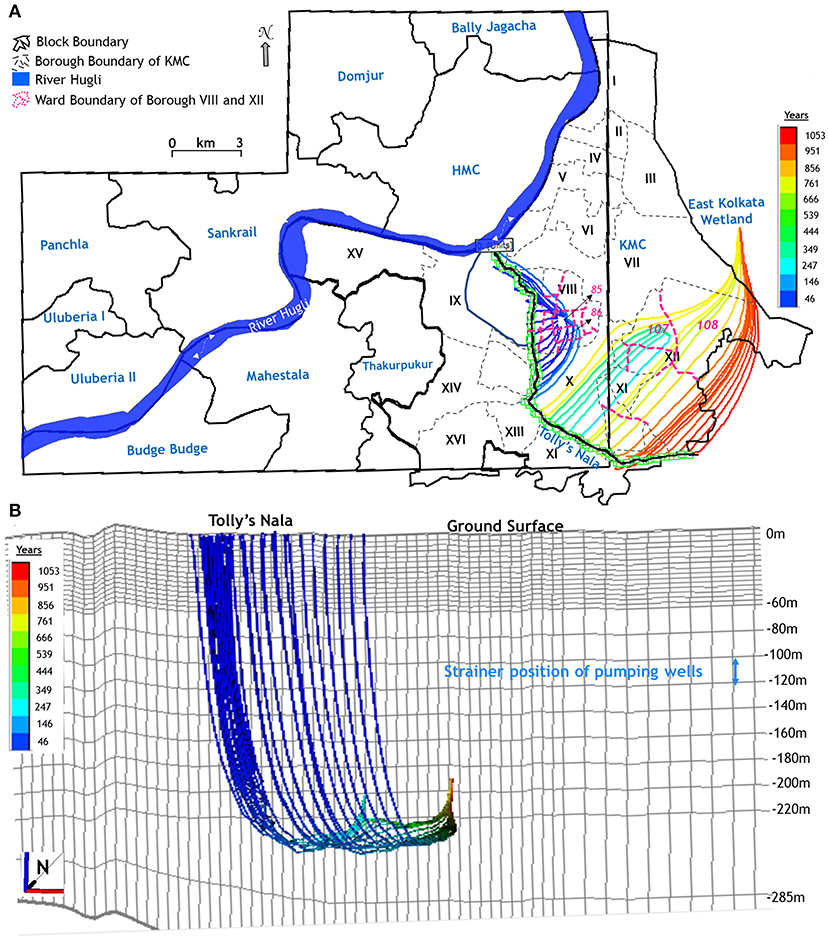
Figure 12. (A) Path lines of forward tracked particle under future development pumping conditions. (B) 3-D view of particle path lines from Tolly's Nala (recharge area) into the aquifer under future development conditions; vertical exaggeration is 75x.
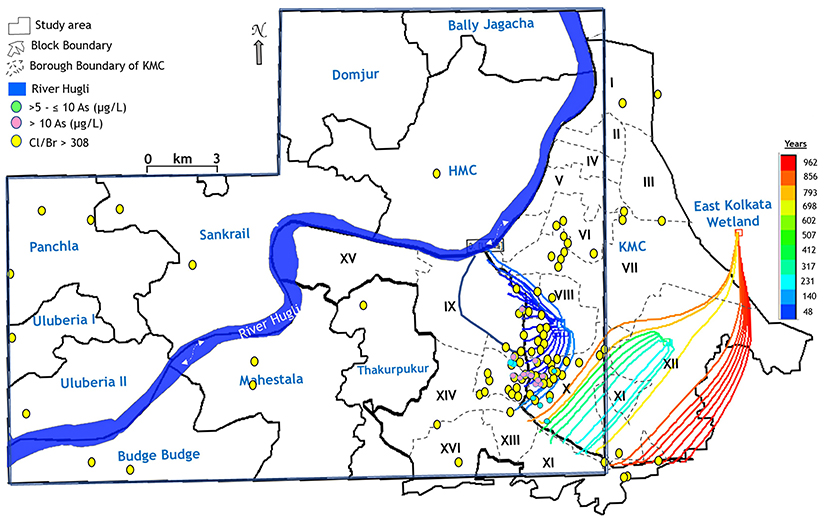
Figure 13. Path lines of forward tracked particle from Tolly's Nala under present development pumping conditions. Groundwater samples of McArthur et al. (2018) and the present study having higher concentrations of As and wastewater where Cl/Br > 308 are plotted in the study area.
Case 2: Particles Placed on the Surface of Major Industrial Areas
Major industrial areas outside Kolkata city are located at the Pujali and Joychandipur areas of the Budge Budge block, the Kulai area of the Pujali block, and Dhulagarh and Mourigram of the Sankrail block (Figure 14A). One hundred and thirty-three MODPATH particles (Pollock, 1994) are placed at the surface over these major industrial areas to understand the advective movement of wastewater and contaminants in the aquifer for the next 50 years under current development conditions by forward tracking of particles (Figures 14A,B and Supplementary Table 9). The modeling effort shows that contaminants generated from industrial activities may reach the strainer depth (100–120 m bgl) of pumping wells within a period of 20–25 years (Figure 14B and Supplementary Table 9). The movement of the particles is toward the east from the Howrah side, whereas the same is toward the east and also southeast directions from the Pujali and Joychandipur areas of the Budge Budge block. Therefore, not only the groundwater below the industrial areas may be contaminated, but also the quality of the groundwater of the areas located in the eastern side of the industrial parks may be adversely affected in the near future.
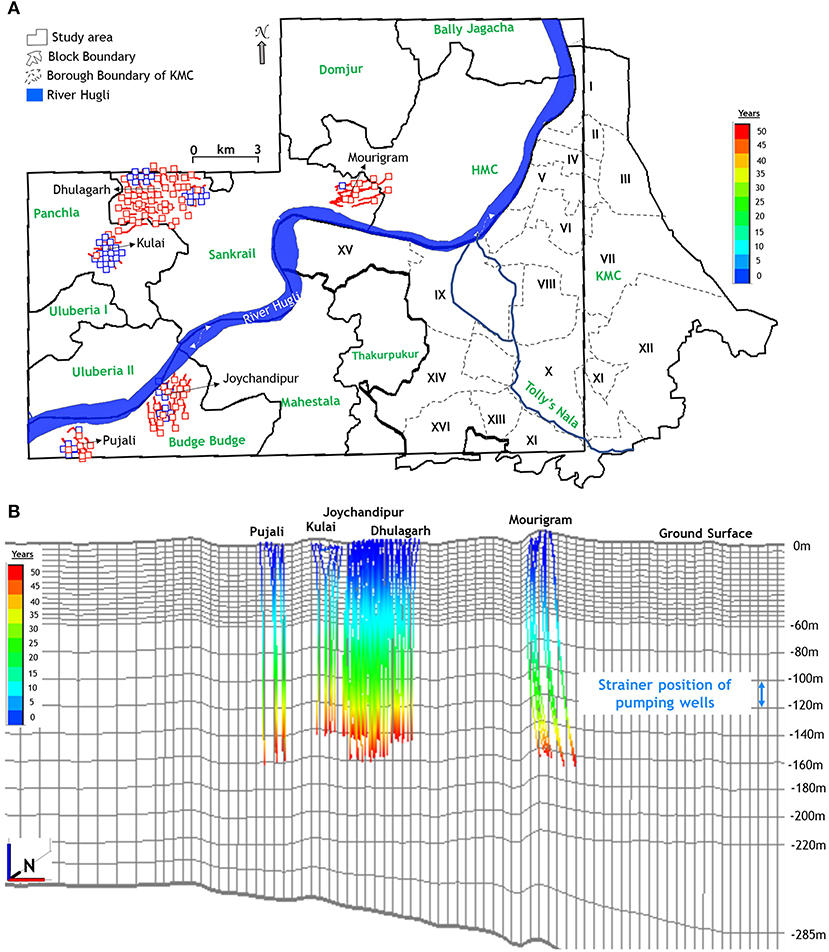
Figure 14. (A) Path lines and endpoints of forward tracked particles, generated from the industrial areas outside KMC, within the next 50 years under present development pumping conditions. (B) 3-D view of particle path lines for 50 years from industrial areas into the aquifer under present development conditions; vertical exaggeration is 75x.
Case 3: Particles Placed at Midscreen Depth of Wells Polluted With Heavy Metals
Particles are placed in wells' midscreen depth ranging between 76 and 220 m bgl, in which heavy metals such as copper, lead, zinc, etc., have been identified (Supplementary Figure 7) and traced backward (Figures 15A,B) to identify the recharge areas of the pollutant. Particle tracking indicates that that the heavy metals are transported from nearby industrial sites since the last two decades. The heavy metals in the groundwater of Borough I of KMC have been recharged from industrial areas in Liluah, Howrah (Figure 15A).
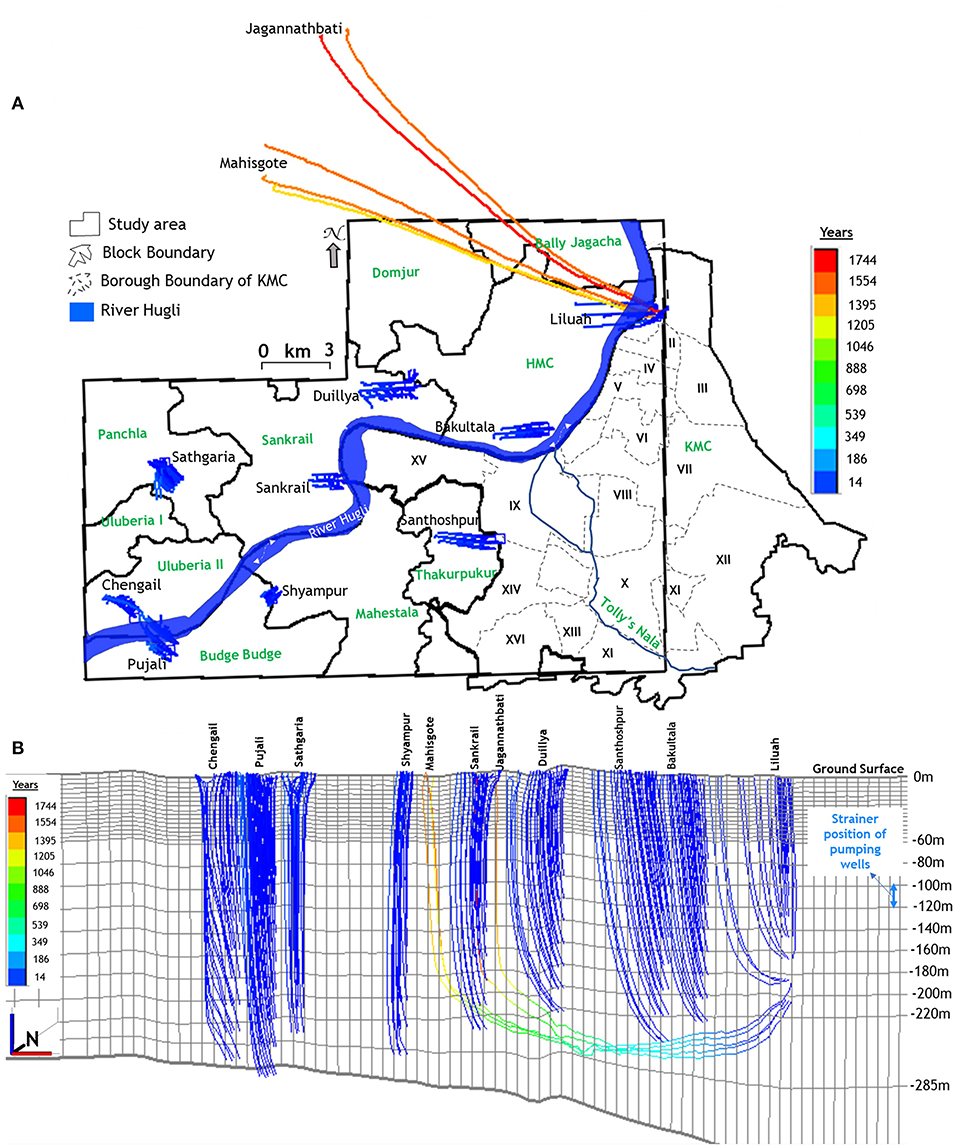
Figure 15. (A) Path lines and endpoints of backward tracked particles from the screen depth of wells having heavy metals under present development pumping conditions. (B) 3-D view of particle path lines of backward tracked particles from the screen depth of wells having heavy metals under present development pumping conditions; vertical exaggeration is 50x.
Conclusions
Reliable predictions from groundwater simulations provide the primary information for decision making and risk analysis for policy making on sustainable water management practices. However, accurate predictions are strongly controlled by several uncertainties related to model parameters, which are taken into account during sensitivity analysis for predevelopment and present development scenarios. To understand the impacts of uncertainty in values of aquifer anisotropy, hydraulic conductivity, lateral boundary conditions, and vertical discretization sensitivity analyses are carried out for both predevelopment and present development conditions by varying the parameter values/conditions from that of the base case and measuring the simulated head. Uncertainty analysis in model predictions has not been carried out because, for a large model area, uncertainties are relatively less compared with that of a small model area because characterization methods are well-suited to discern bulk properties, and field observations directly reflect bulk system properties. For reliable predictions, this groundwater model has been calibrated and validated using the observed and simulated head and calculating the RMS error for several runs. The model with the minimum RMS error (1.07 m) is used in the present study. The base-case model under present development conditions is sensitive to the change of anisotropy and vertical discretization.
The accelerated pace of the growing population and urban sprawl has already posed tremendous stress on the Quaternary aquifer system. This research attempts to understand the hydrogeologic system and groundwater flow pattern of the area in and around the twin cities of Kolkata and Howrah in the South Bengal Basin under natural and stressed conditions. The built-up area had increased from 142 to 243 km2 between 1985 and 2016. The over-exploitation of groundwater to meet the increased demand has resulted in the lowering of the piezometric surface by 13–37 cm/year and development of a groundwater trough in the central and eastern sides of Kolkata city. At present, 93% of the groundwater is abstracted, resulting in a maximum drawdown of 22 m with respect to predevelopment conditions. It is expected that if over-pumping continues as a result of the increase in urban area by 7.5% by 2030, the piezometric surface will drop further by 1.94–2.2 m, and the stage of groundwater development would be 93.7%.
Simulations indicate that additional pumping may induce recharge from areas of known contamination, which is likely to deteriorate further the quality of groundwater. Kolkata's aquifer is contaminated with high-Cl sewage effluent and As > 10 μg/L at places. Modeled flow paths tracked in the forward direction from Tolly's Nala to the discharge locations indicate that the infiltrated wastewater and As may reach the screen depth (100–120 m) of a few wells in Boroughs VIII and X of Kolkata within 48–172 years (Figures 12A,B). Several wells have been identified in Boroughs VIII and X in which groundwater is already contaminated by wastewater and As, validating the outcomes of the MODPATH simulation. The modeling effort shows that contaminants generated from the major industrial activities may reach the strainer depth (100–120 m bgl) of pumping wells within a period of 20–25 years. Therefore, not only the groundwater below the industrial areas may be contaminated, but also the quality of the groundwater of the areas located on the eastern side of the industrial parks may be adversely affected in the near future.
The adverse behavior of the aquifer system to over-pumping is not unique to urban centers of the South Bengal Basin, but also elsewhere in the world in a similar hydrogeological framework, such as Dhaka (Bangladesh), Ho Chi Minh city (Vietnam), Venice (Italy), Mexico City (Mexico), Jakarta (Indonesia), and many more. Therefore, a cautious approach to groundwater development could minimize the risk of groundwater-related hazards.
A framework of urban water supply of the stressed aquifer of the area in and around Kolkata and Howrah cities may include reducing the pumping of groundwater, supplying treated surface water from River Hugli, restricting the wastewater infiltration by desilting and maintaining the course and banks of Tolly's Nala, reducing groundwater pumping on either sides of the Nala, implementing rainwater harvesting on a mass scale, and regular monitoring of water level and quality at selected locations by the concerned authority. Development of new well fields in the peri-urban areas, on past channels, and where the upper aquitard thickness is less should be avoided.
Data Availability Statement
The original contributions presented in the study are included in the article/Supplementary Material, further inquiries can be directed to the corresponding author/s.
Author Contributions
PKS: supervision, conceptualization, visualization, model run, data interpretation, and writing—review and editing. SB: field work, sample analysis, model run, preparation of schematic and plots, analysis, validation, and writing—original draft preparation. SC: model run. All authors contributed to the article and approved the submitted version.
Conflict of Interest
The authors declare that the research was conducted in the absence of any commercial or financial relationships that could be construed as a potential conflict of interest.
Publisher's Note
All claims expressed in this article are solely those of the authors and do not necessarily represent those of their affiliated organizations, or those of the publisher, the editors and the reviewers. Any product that may be evaluated in this article, or claim that may be made by its manufacturer, is not guaranteed or endorsed by the publisher.
Acknowledgments
The authors convey thanks to the director, Indian Institute of Social Welfare and Business Management (IISWBM), for providing the infrastructure for the research work. The authors are thankful to the director of State Water Investigation Directorate, West Bengal; Kolkata Municipal Corporation; Aqua Solutions Pvt. Ltd., Kolkata; Pioneer Tubewells Industries Pvt. Ltd., Kolkata; Drilltech Consultant Pvt. Ltd., Kolkata for sharing relevant hydrogeological and geological information for the research work. The authors acknowledge the help of Ritaban Mitra and Rohit Basu Dhar during the research work.
Supplementary Material
The Supplementary Material for this article can be found online at: https://www.frontiersin.org/articles/10.3389/frwa.2021.801299/full#supplementary-material
Footnotes
1. ^City of Sorrows, Mismanagement Spells Doom for Water Sources of Kolkata. Available online at: https://www.downtoearth.org.in/news/city-of-sorrows-12134 (accessed September 30, 2021).
References
Ahmed, K. M., Bhattacharya, P., Hasan, A. M., Akhter, S. M., Alam, S. M. M., Bhuyian, M. A. H., et al. (2004). Arsenic enrichment in groundwater of the alluvial aquifers in Bangladesh: an overview. Appl. Geochem. 19, 181–200 doi: 10.1016/j.apgeochem.2003.09.006
Alam, M., Alam, M. M., Curray, J. R., Chowdhury, M. L. R., and Gani, M. R. (2003). An overview of the sedimentary geology of the Bengal basin in relation to the regional tectonic framework and basinfill history. Sediment. Geol. 155, 179–208. doi: 10.1016/S0037-0738(02)00180-X
Al-Layla, R., Yazicigil, H., and de Jong, R. (1988). Numerical modeling of solute transport patterns in the Dammam aquifer. Water Resour. Bull. 24:86127. doi: 10.1111/j.1752-1688.1988.tb00882.x
Banerjee, I., and Sinha Roy, S. P. (1992). “Management of groundwater resources in Calcutta Metropolitan District area,” in Proc. Sem. Calcutta Water Supply - Techno Economic Options.
Banerjee, S., and Sikdar, P. K. (2020). Land Subsidence due to leakage of aquitard-aquifer pore water in an under-construction tunnel of East-West Metro Railway Project, Kolkata. J. Geol. Soc. India 96, 467–474. doi: 10.1007/s12594-020-1584-z
Banerjee, S., and Sikdar, P. K. (2021). Hydrogeological characterization of the Quaternary aquifer of south Bengal Basin in India and the impact of urbanization on the groundwater resources of the system. J. Hydrogeol. 29, 1463–1484. doi: 10.1007/s10040-021-02340-0
Battista, G., and de Lieto Vollaro, R. (2017). Correlation between air pollution and weather data in urban areas: assessment of the city of Rome (Italy) as spatially and temporally independent regarding pollutants. Atmos. Environ. 165, 240–247. doi: 10.1016/j.atmosenv.2017.06.050
BGS/DPHE/MML (2001). Arsenic contamination of groundwater in Bangladesh, Vol. 2. Technical Report WC/00/19, eds D. G. Kinniburgh and P. L. Smedley, British Geological Survey (BGS), Keyworth.
Biver, P.. (1991). Modeling transport in a double porosity medium: an alternative approach. Water Pollut. 43–57. doi: 10.1007/978-94-011-3694-5_3
Bobba, A. G.. (1993). Field validation of 'SUTRA' groundwater flow model to Lambton County. Water Resour. Manage. 7, 289–310. doi: 10.1007/BF00872286
Boronina, A., Renard, P., Balderer, W., and Christodoulides, A. (2002). Groundwater resources in the Kouris catchment (Cyprus): data analysis and numerical modelling. J. Hydrol. 271, 130–149. doi: 10.1016/S0022-1694(02)00322-0
Brouyère, S., Carabin, G., and Dassargues, A. (2004). Climate change impacts on groundwater resources: modelled deficits in a chalky aquifer, Geer basin, Belgium. Hydrogeol. J. 12, 123–134. doi: 10.1007/s10040-003-0293-1
Burges, S. J.. (1986). Trends and directions in hydrology. Water Resour. Res. 22, 1S−5S. doi: 10.1029/WR022i09Sp0001S
Burgess, W. G, Burren, M, Perrin, J, Mather, S. E, and Ahmed, K. M. (2002). “Constraints on sustainable development of arsenic-bearing aquifers in southern Bangladesh. Part 1: A conceptual model of arsenic in the aquifer,” in Sustainable Groundwater Development, eds K. M. Hiscock, M. O. Rivett, and R. M. Davison (London: The Geological Society Special Publications), 145–163. doi: 10.1144/GSL.SP.2002.193.01.12
Central Ground Water Board (CGWB) and State Water Investigation Directorate (SWID) (2009). Report on the Dynamic Ground Water Resources of West Bengal as on 31.03.2009, Technical Report Series 'B' No. 234, 2011, 244. Central Ground Water Board (CGWB) and State Water Investigation Directorate (SWID).
CGWB (2020). National Compilation on Dynamic Groundwater Resources of India, 2020. Central Ground Water Board.
Chakrabarti, C. A.. (2013). Source Journal of Environment of Kolkata. Kolkata: Municipal Corporation.
Chatterjee, A.. (2014). Water Supply System in Kolkata City and Adjoining Areas. Available online at: https://medium.com/@anjan.chatterjee/watersupply-system-in-kolkata-city-and-adjoining-areas-b199099a4517#.trpdgul6z (accessed March 1, 2021).
Chen, Z., Grasby, S. E., and Osadetz, K. G. (2004). Relation between climate variability and groundwater levels in the upper carbonate aquifer, southern Manitoba, Canada. J. Hydrol. 290, 43–62. doi: 10.1016/j.jhydrol.2003.11.029
Coleman, J. M.. (1981). Deltas: Processes of Deposition and Models of Exploration, 2nd Edn. Minneapolis, MN: Burgess.
Deshmukh, D. S., Prasad, K. N., Niyogi, B. N., Biswas, A. B., Guha, S. K., Seth, N. N., et al. (1973). Geology and groundwater resources of the alluvial areas of West Bengal. Bull. Geol. Surv. India Ser. B 34:451.
DPHE and BGS (2001). Groundwater Studies for Arsenic Contamination in Bangladesh. Phase I: Rapid Investigation. Department of Public Health Engineering (DPHE) of Government of Bangladesh; British Geological Survey (BGS); Mott MacDonald Ltd (MML).
Ebraheem, A. M., Riad, S., Wycisk, P., and Sefelnasr, A. M. (2004). A local-scale groundwater flow model for groundwater resources management in Dakhla Oasis, SW Egypt. Hydrogeol. J. 12, 714–722. doi: 10.1007/s10040-004-0359-8
El Alfy, M.. (2014). Numerical groundwater modelling as an effective tool for management of water resources in arid areas. Hydrol. Sci. J. 59, 1259–1274. doi: 10.1080/02626667.2013.836278
EROS. (2002). Shuttle Radar Topography Mission (SRTM) Elevation Data Set. National Aeronautics and Space Administration (NASA), German Aerospace Center (DLR), Italian Space Agency (ASI), From: the National Center for Earth Resources Observations and Science, US Geological Survey, Sioux Falls.
Foster, S. S. D.. (1988). Impacts of urbanisation on groundwater. Hydrol. Process. Water Manage. Urban Areas.
Galloway, D., and Burbey, T. (2011). Regional land subsidence accompanying groundwater extraction. Hydrogeol. J. 19, 1459–1486. doi: 10.1007/s10040-011-0775-5
Geological Survey of India (GSI) (1999). Geology and Mineral Resources of the States of India, Part 1- West Bengal, Miscellaneous Publication No. 30. Geological Survey of India.
Ghosh, N. C., Chakraborty, B., and Mazumder, P. K. (1999). “Groundwater flow model,” in Proceedings of Workshop on Groundwater and Its Protection With Special Reference to Arsenic Contamination (Calcutta: CGWB).
Ghoshal, U.. (2015). Numerical modelling of groundwater flow with special emphasis on arsenic migration: the example of Jamuna subbasin, Nadia district, West Bengal and its implications [thesis submitted for the degree of Doctor of Philosophy (Science)]. University of Calcutta, Calcutta, India.
Goderniaux, P., Brouyere, S., Blenkinsop, S., Burton, A., Fowler, H. J., Orban, P., et al. (2011). Modeling climate change impacts on groundwater resources using transient stochastic climatic scenarios. Water Resour. Res. 47:W12516. doi: 10.1029/2010WR010082
Goderniaux, P., Brouyère, S., Fowler, H. J., Blenkinsop, S., Therrien, R., Orban, P., et al. (2009). Large scale surface-subsurface hydrological model to assess climate change impacts on groundwater reserves. J. Hydrol. 373, 122–138. doi: 10.1016/j.jhydrol.2009.04.017
Gorelick, S. M.. (1983). A review of distributed parameter groundwater management modeling methods. Water Resour. Res. 19, 305–319. doi: 10.1029/WR019i002p00305
Harvey, C. F., Swartz, C. H., Badruzzaman, A. B. M., Keon-Blute, N., Yu, W., Ali, M. A., et al. (2005). Groundwater arsenic contamination on the Ganges Delta: biogeochemistry, hydrology, human perturbations, and human suffering on a largescale. Compt. Rendus Geosci. 337, 285–296. doi: 10.1016/j.crte.2004.10.015
Hashemi, H., Berndtsson, R., and Kompani-Zare, M. (2012). Steady-state unconfined aquifer simulation of the gareh-bygone plain, Iran. Open Hydrol. J. 6, 58–67. doi: 10.2174/1874378101206010058
Hoque, M. A., Hoque, M. M., and Ahmed, K. M. (2007). Declining groundwater level and aquifer dewatering in Dhaka metropolitan area, Bangladesh: causes and quantification. Hydrogeol. J. 15, 1523–1534. doi: 10.1007/s10040-007-0226-5
Horneman, A., Van Geen, A., Kent, D. V., Mathe, P. E., Zheng, Y., Dhar, R. K., et al. (2004). Decoupling of As and Fe release to Bangladesh groundwater under reducing conditions. Part I: evidence from sediment profiles. Geochim. Cosmochim. Acta 68, 3459–3473. doi: 10.1016/j.gca.2004.01.026
Hosono, T., Nakano, T., Shimizu, Y., Onodera, S., and Taniguchi, M. (2011). Hydrogeological constraints on nitrate and arsenic contamination in Asian metropolitan groundwater. Hydrol. Process. 25, 2742–2754. doi: 10.1002/hyp.8015
Howard, K. W. F., and Gelo, K. K. (2002). “Intensive groundwater use in urban areas: the case of megacities,” in Intensive Use of Groundwater: Challenges and Opportunities, eds R. Llamas and E. Custodio (Lisse: Balkema), 35–58.
JICA (2002). The Study on the Ground Water Development of Deep Aquifers for Safe Drinking Water Supply to Arsenic Affected Areas in Western Bangladesh. Final Report, Kokusai Kogyo Co.; Mitsui Mineral Development Engineering Co., Tokyo.
Konikow, L. F., and Bredehoeft, J. D. (1974). Modeling flow and chemical quality changes in an irrigated stream-aquifer system. Water Resour. Res. 10, 646–662. doi: 10.1029/WR010i003p00546
Maity, B. K.. (2012). Management of Urban Water Cycle in Kolkata Municipal Corporation. Available online at: http://www.bengalchamber.com/energyconclave/year2012/b-k-maiti.pdf (accessed March 1, 2021).
Maxwell, R. M., Condon, L. E., and Kollet, S. J. (2015). A high-resolution simulation of groundwater and surface water over most of the continental USA with the integrated hydrologic model Par Flow v3. Geosci. Model Dev. 8, 1–14. doi: 10.5194/gmd-8-923-2015
McArthur, J. M., Ravenscroft, P., Banerjee, D. M., Milsom, J., Hudson-Edwards, K. A., Sengupta, S., et al. (2008). How paleosols influence groundwater flow and arsenic pollution: a model from the Bengal Basin and its worldwide implication. Water Resour. Res. 44:W11411. doi: 10.1029/2007WR006552
McArthur, J. M., Sikdar, P. K., Leng, M. J., Ghosal, U., and Sen, I. (2018). Groundwater quality beneath an asian megacity on a delta: Kolkata's (Calcutta's) disappearing arsenic and present manganese. Environ. Sci. Technol. 52, 5161–5172. doi: 10.1021/acs.est.7b04996
McDonald, M. G., Harbaugh, A. W., Banta, E. R., and Hill, M. C. (2000). MODFLOW-2000, the US Geological Survey Modular Ground-Water Model-User Guide to Modularization Concepts and the Ground Water Flow Process. Open-File Report, U.S. Geological Survey.
McDonald, R., Douglas, I., Revenga, C., Hale, R., Grimm, N., Gronwall, J., et al. (2011). Global urban growth and the geography of water availability, quality, and delivery. Ambio 40, 437–446. doi: 10.1007/s13280-011-0152-6
Medina, M. A. Jr, Thomann, W., Holland, J. P., and Lin, Y. C. (2001). Integrating parameter estimation, optimization and subsurface solute transport modeling. Hydrol. Sci. Technol. 17, 259–282.
Michael, H. A., and Voss, C. I. (2008). Evaluation of the sustainability of deep groundwater as an arsenic-safe resource in the Bengal Basin. Proc. Natl. Acad. Sci. U.S.A. 105, 8531–8536. doi: 10.1073/pnas.0710477105
Michael, H. A., and Voss, C. I. (2009a). Controls on groundwater flow in the Bengal Basin of India and Bangladesh: regional modeling analysis. Hydrogeol. J. 17, 1561–1577. doi: 10.1007/s10040-008-0429-4
Michael, H. A., and Voss, C. I. (2009b). Estimation of regional-scale groundwater flow properties in the Bengal Basin of India and Bangladesh. Hydrogeol. J. 17, 1329–1346. doi: 10.1007/s10040-009-0443-1
MPO (1987). Technical Report No. 5, The Groundwater Resource. Development, Ministry of Irrigation, Water Development and Flood Control, Dhaka.
Mukherjee, A., and Fryar, A. E. (2008). Deeper groundwater chemistry and geochemical modeling of the arsenic affected western Bengal basin, West Bengal, India. Appl. Geochem. 23, 863–894. doi: 10.1016/j.apgeochem.2007.07.011
Mukherjee, A., Fryar, A. E., and Howell, P. D. (2007). Regional hydrostratigraphy and groundwater flow modelling in the arsenic-affected areas of the western Bengal basin, West Bengal, India. Hydrogeol. J. 15, 1397–1418. doi: 10.1007/s10040-007-0208-7
Mukherjee, S.. (2004). “Prerequisite studies for numerical flow modeling to locate safe drinking water wells in the zone of arsenic polluted groundwater in the Yamuna sub-basin, West Bengal, India,” in Proceedings of 32nd International Geologic Congress (Florence). doi: 10.1201/9780203970829.ch34
Mukherjee, S., Bebermeier, W., and Schütt, B. (2018). An overview of the impacts of land use land cover changes (1980-2014) on urban water security of Kolkata. Land 7:91. doi: 10.3390/land7030091
Mustafa, S. M. T., Hasan, M. M., Saha, A. K., Rannu, R. P., Uytven, E. V., Willems, P., et al. (2019). Multi-model approach to quantify groundwater-level prediction uncertainty using an ensemble of global climate models and multiple abstraction scenarios. Hydrol. Earth Syst. Sci. 23, 2279–2303. doi: 10.5194/hess-23-2279-2019
Mustafa, S. M. T., Nossent, J., Ghysels, G., and Huysmans, M. (2018). Estimation and impact assessment of input and parameter uncertainty in predicting groundwater flow with a fully distributed model. Water Resour. Res. 54, 6585–6608. doi: 10.1029/2017WR021857
Mustafa, S. M. T., Nossent, J., Ghysels, G., and Huysmans, M. (2020). Integrated Bayesian Multi-model approach to quantify input, parameter and conceptual model structure uncertainty in groundwater modeling. Environ. Model. Softw. 126:104654. doi: 10.1016/j.envsoft.2020.104654
Patra, S., Sahoo, S., Mishra, P., and Mahapatra, S. C. (2018). Impacts of urbanization on land use /cover changes and its probable implications on local climate and groundwater level. J. Urban Manage. 7, 70–84. doi: 10.1016/j.jum.2018.04.006
Pollock, D. W.. (1994). User's Guide for MODPATH/MODPATH-PLOT, Version 3: A Particle Tracking Post-Processing Package for MODFLOW, the U. S. Geological Survey Finite-Difference Groundwater Flow Model. USGS Open-File Report. U. S. Geological Survey, Reston. doi: 10.3133/ofr94464
Ram, A., Tiwari, S. K., Pandey, H. K., Chaurasia, A. K., Singh, S., and Singh, Y. V. (2021). Groundwater quality assessment using water quality index (WQI) under GIS framework. Appl. Water Sci. 11:46. doi: 10.1007/s13201-021-01376-7
Refsgaard, J. C., Van der Sluijs, J. P., Brown, J., and Van derKeur, P. (2006). A framework for dealing with uncertainty due to model structure error. Adv. Water Resour. 29, 1586–1597. doi: 10.1016/j.advwatres.2005.11.013
Renard, P., and de Marsily, G. (1997). Calculating equivalent permeability: a review. Adv. Water Resour. 20, 5–6, 253–278. doi: 10.1016/S0309-1708(96)00050-4
Sahu, P.. (2008). Groundwater resource assessment and management of the area in and around East Calcutta Wetlands, West Bengal [Thesis submitted for the degree of Doctor of Philosophy (Science)]. University of Calcutta, Calcutta, India.
Sahu, P., Michael, H. A., Voss, C. I., and Sikdar, P. K. (2013). Impacts on groundwater recharge areas of megacity pumping: analysis of potential contamination of Kolkata, India, water supply. Hydrol. Sci. J. 58, 1340–1360. doi: 10.1080/02626667.2013.813946
Sahu, P., and Sikdar, P. K. (2011). Groundwater potential zoning of a periurban wetland of south Bengal Basin, India. Environ. Monit. Assess. 174, 119–134. doi: 10.1007/s10661-010-1443-2
Sahu, P., and Sikdar, P. K. (2017). Effect of pumping on hydrologic system of a young satellite city in south Bengal Basin through numerical modelling: past, present and future. Sustain. Water Resour. Manage. 3, 321–341. doi: 10.1007/s40899-017-0098-3
Scibek, J., Allen, D. M., Cannon, A. J., and Whitfield, P. H. (2007). Groundwater-surface water interaction under scenarios of climate change using a high-resolution transient groundwater model. J. Hydrol. 333, 165–181. doi: 10.1016/j.jhydrol.2006.08.005
Shah, T., DebRoy, A., Qureshi, A. S., and Wang, J. (2003). Sustaining Asia's groundwater boom: an overview of issues and evidence. Nat. Resour. Forum 27, 130–140. doi: 10.1111/1477-8947.00048
Shamsudduha, M., Taylor, R. G., Ahmed, K. M., and Zahid, A. (2011). The impact of intensive groundwater abstraction on recharge to a shallow regional aquifer system: evidence from Bangladesh. Hydrogeol. J. 19, 901–916. doi: 10.1007/s10040-011-0723-4
Sikdar, P. K.. (1996). Hydrogeology of the area in and around Calcutta and Howrah Municipal Corporation with special emphasis on the management of groundwater resources [thesis submitted for the degree of Doctor of Philosophy (Science)]. University of Calcutta, Calcutta, India.
Sikdar, P. K.. (2000). Geology of the Quaternary aquifers of the twin city of Calcutta-Howrah. J. Geol. Soc. India 56, 169–186.
Sikdar, P. K., Biswas, A. B., and Saha, A. K. (1996). A study on the possible land subsidence in Calcutta and Howrah cities due to groundwater overdraft. Indian J. Geol. 5, 193–200.
Sikdar, P. K., and Chakraborty, S. (2017). Numerical modelling of groundwater flow to understand the impacts of pumping on arsenic migration in the aquifer of North Bengal Plain. J. Earth Syst. Sci. 126:29. doi: 10.1007/s12040-017-0799-x
Sikdar, P. K., and Dasgupta, S. P. (1997). Pollution-risk analysis of groundwater of Calcutta and Howrah cities. Indian Miner. 50, 397–402.
Sikdar, P. K., Ghoshal, U., and Chakraborty, S. (2018). Groundwater modeling to understand the impact of pumping in the deep Late Pleistocene aquifers of the western Bengal Basin on arsenic migration. Arabian J. Geosci. 11:795. doi: 10.1007/s12517-018-4101-6
Sikdar, P. K., and Sahu, P. (2018). “Modelling the potential impact of small-scale pumping near future water supply wells in a stressed aquifer in South Western Bengal basin on groundwater flow,” in Clean and Sustainable Groundwater in India, ed D. Saha et al. (Springer Hydrogeology). p. 279–300. doi: 10.1007/978-981-10-4552-3_18
Sikdar, P. K., Sahu, P., Sinha Ray, S. P., Sarkar, A., and Chakraborty, S. (2013). Migration of arsenic in multi-aquifer system of Bengal Basin: analysis via numerical modeling. Environ. Earth Sci. 70, 1863–1879. doi: 10.1007/s12665-013-2274-6
Sikdar, P. K., Sarkar, S. S., and Palchoudhury, S. (2001). Geochemical evolution of groundwater in the Quaternary aquifer of Calcutta and Howrah, India. J. Asian Earth Sci. 19, 579–594. doi: 10.1016/S1367-9120(00)00056-0
Smith, A. H., Lingas, E. O., and Rahman, M. (2000). Contamination of drinking-water by arsenic in Bangladesh: a public health emergency. Bull. World Health Org. 78, 1093–1103.
Sohrabi, N., Chitsazan, M., Amiri, V., and Nezhad, T. M. (2013). Evaluation of groundwater resources in alluvial aquifer based on MODFLOW program, case study: evan plain (Iran). Int. J. Agric. Crop Sci. 5, 1164–1170.
State Water Investigation Directorate (SWID) (2009). A comprehensive hydrogeological information of Murshidabad district. Geologic Division No. Ill. State Water Investigation Directorate (SWID); Government of West Bengal, Kolkata.
Sucharit, K., and Panot, S. (2003). “Groundwater modeling in the north part of lower central plain, Thailand,” in Proceedings of the International Conference on Water and Environment (Bhopal), 180–187.
Takounjou, A. F., Rao, V. V. S. G., Ngoupayou, N. J., Nkamdjou, L. S., and Ekodeck, G. E. (2009). Groundwater flow modelling in the upper Anga'a river watershed, Yaounde, Cameroon. Afr. J. Environ. Sci. Technol. 3, 341–352.
Taylor, R. G., Scanlon, B., Döll, P., Rodell, M., Van Beek, R., Wada, Y., et al. (2013). Ground water and climate change. Nat. Clim. Change 3, 322–329. doi: 10.1038/nclimate1744
Van Roosmalen, L., Sonnenborg, T. O., and Jensen, K. H. (2009). Impact of climate and land use change on the hydrology of a largescale agricultural catchment. Water Resour. Res. 45:W00A15. doi: 10.1029/2007WR006760
Water Resources Planning Organization (WARPO) (2000). National Water Management Plan Project: Draft Development Strategy. Ministry of Water Resources; Government of the People's Republic of Bangladesh.
Winston, R. B.. (2000). Graphical User Interface for MODFLOW, Version 4. Open-File Report, U.S. Geological Survey. doi: 10.3133/ofr00315
Woldeamlak, S. T., Batelaan, O., and De Smedt, F. (2007). Effects of climate change on the groundwater system in the Grote-Nete catchment, Belgium. Hydrogeol. J. 15, 891–901. doi: 10.1007/s10040-006-0145-x
Yan, Z. W., Wang, J., Xia, J. J., and Feng, J. M. (2016). Review of recent studies of the climatic effects of urbanization in China. Adv. Clim. Change Res. 7, 154–168. doi: 10.1016/j.accre.2016.09.003
Keywords: hydrogeologic system, groundwater modeling, piezometric heads, land subsidence, wastewater and arsenic, Bengal Basin
Citation: Sikdar PK, Banerjee S and Chakraborty S (2022) Understanding the Past-Present-Future Hydrogeologic System Through Numerical Groundwater Modeling of South Bengal Basin, India. Front. Water 3:801299. doi: 10.3389/frwa.2021.801299
Received: 25 October 2021; Accepted: 24 December 2021;
Published: 10 February 2022.
Edited by:
Mohammad Shamsudduha, University College London, United KingdomCopyright © 2022 Sikdar, Banerjee and Chakraborty. This is an open-access article distributed under the terms of the Creative Commons Attribution License (CC BY). The use, distribution or reproduction in other forums is permitted, provided the original author(s) and the copyright owner(s) are credited and that the original publication in this journal is cited, in accordance with accepted academic practice. No use, distribution or reproduction is permitted which does not comply with these terms.
*Correspondence: Pradip Kumar Sikdar, cF9zaWtkYXJAaG90bWFpbC5jb20=