 Mariette Vreugdenhil1*†
 Isabella Greimeister-Pfeil1†
 Wolfgang Preimesberger1
 Stefania Camici2Wouter Dorigo1
 Markus Enenkel3
 Robin van der Schalie4
 Susan Steele-Dunne5Wolfgang Wagner1
- 1Department of Geodesy and Geoinformation, TU Wien, Vienna, Austria
- 2Research Institute for Geo-Hydrological Protection IRPI, Italian National Research Council, Perugia, Italy
- 3Harvard Humanitarian Initiative, Harvard University, Cambridge, MA, United States
- 4Planet Labs, Haarlem, Netherlands
- 5Department of Geoscience and Remote Sensing, Delft University of Technology, Delft, Netherlands
Agricultural droughts are extreme events which are often a result of interplays between multiple hydro-meteorological processes. Therefore, assessing drought occurrence, extent, duration and intensity is complex and requires the combined use of multiple variables, such as temperature, rainfall, soil moisture (SM) and vegetation state. The benefit of using information on SM and vegetation state is that they integrate information on precipitation, temperature and evapotranspiration, making them direct indicators of plant available water and vegetation productivity. Microwave remote sensing enables the retrieval of both SM and vegetation information, and satellite-based SM and vegetation products are available operationally and free of charge on a regional or global scale and daily basis. As a result, microwave remote sensing products play an increasingly important role in drought monitoring applications. Here, we provide an overview of recent developments in using microwave remote sensing for large-scale agricultural drought monitoring. We focus on the intricacy of monitoring the complex process of drought development using multiple variables. First, we give a brief introduction on fundamental concepts of microwave remote sensing together with an overview of recent research, development and applications of drought indicators derived from microwave-based satellite SM and vegetation observations. This is followed by a more detailed overview of the current research gaps and challenges in combining microwave-based SM and vegetation measurements with hydro-meteorological data sets. The potential of using microwave remote sensing for drought monitoring is demonstrated through a case study over Senegal using multiple satellite- and model-based data sets on rainfall, SM, vegetation and combinations thereof. The case study demonstrates the added-value of microwave-based SM and vegetation observations for drought monitoring applications. Finally, we provide an outlook on potential developments and opportunities.
Introduction
As a result of climate change, the frequency and intensity of droughts have increased in much of the world, driven by continuously evolving precipitation shifts and temperature increases (Dai, 2013; Trenberth, 2014; Hoegh-Guldberg et al., 2018). The effects of drought on ecosystems and society are staggering, leading to crop losses and famine, tree mortality and amplification of heatwaves, among many other impacts (Schumacher et al., 2019; Senf et al., 2020; Brás et al., 2021). Due to the significant and often costly impact of droughts, drought monitoring is pivotal for early warning and early action. However, droughts are complex extreme events. As described in detail by Zscheischler et al. (2020) events such as droughts can occur as a result of existing preconditions, interactions of multiple drivers, a succession or a spatial interplay of events. In addition, droughts are often creeping disasters, developing from a meteorological drought due to a long-term rainfall deficit or prolonged increased temperatures to an agricultural and hydrological drought, affecting vegetation and ground- and surface waters. A socio-economic drought is the result of prolonged agricultural and hydrological drought, when these impact forests, crop yields, infrastructure and drinking water sources for people and livestock. Due to its complex nature, identifying and monitoring drought is an intricate problem and many methods exist based on single or combined hydro-meteorological variables as well as vegetation observations.
Meteorological droughts are usually monitored by a combination of precipitation and temperature observations, such as the Standardized Precipitation Index (SPI). Most agricultural drought indicators use precipitation and temperature in combination with information on vegetation productivity to characterize the main drivers and impacts of droughts. For monitoring drought impact on vegetation, visible and near-infrared (VNIR) indices such as the Normalized Difference Vegetation Index (NDVI) and Leaf Area Index (LAI) are most commonly used. The use of SM for agricultural drought monitoring has increased in recent decades as it can fill a gap between the lagged response of the land surface to precipitation deficits. Mostly modeled or satellite-based SM information is used as it can provide global and daily information on SM. The advantage of satellite-observed SM products is that they better capture variability of SM than rainfall and temperature driven models, and they implicitly include irrigation water which is seldom considered in models (Massari et al., 2021).
Several publicly available, operational SM products are based on satellite microwave observations, providing global, daily coverage. The microwave signal interacts with the land surface and is sensitive to the water content in the top centimeters of the soil and the above ground biomass. Therefore, they do not only allow for the retrieval of SM, but also of the water contained in the above ground biomass. Often the water content in the above ground biomass is parametrized through the Vegetation Optical Depth (VOD), which describes the attenuation of the microwave signal by the vegetation (Attema and Ulaby, 1978). However, studies also use direct satellite measurements as indicators of vegetation dynamics, such as the slope of the backscatter incidence angle relationship and the ratio between co- and cross polarized backscatter or brightness temperatures (Saatchi et al., 2013; Steele-Dunne et al., 2019). Studies have shown that microwave-based vegetation indicators can complement VNIR vegetation indicators as they provide information on water content in the above ground biomass including the woody part of the vegetation (Liu et al., 2011; Andela et al., 2013; Tian et al., 2016; Konings et al., 2019).
Many products based on remotely sensed microwave observations are available and the aim of this paper is to provide an overview of how satellite-based microwave data and products are used for agricultural drought monitoring. Several publications have given an overview of the use of remote sensing for drought monitoring from meteorological to socio-economic drought (Table 1). Recent drought monitoring overviews by AghaKouchak et al. (2015), West et al. (2019), and Jiao et al. (2021) included satellite SM next to other datasets and methods. Other review papers focus on applications of specific microwave instruments, techniques or datasets (Dorigo et al., 2017; Steele-Dunne et al., 2017; Wigneron et al., 2021). Our paper distinguishes itself from these existing reviews by focusing on the use of microwave observations and thereof derived products for agricultural drought monitoring without focusing on a specific sensor or dataset. We address the complexity of monitoring droughts and the benefits and shortcomings in using microwave-based products and indices. Furthermore, we discuss the challenges and opportunities of using a combination of variables such as precipitation, SM and vegetation indices. These are illustrated using a case study for drought monitoring in Senegal.
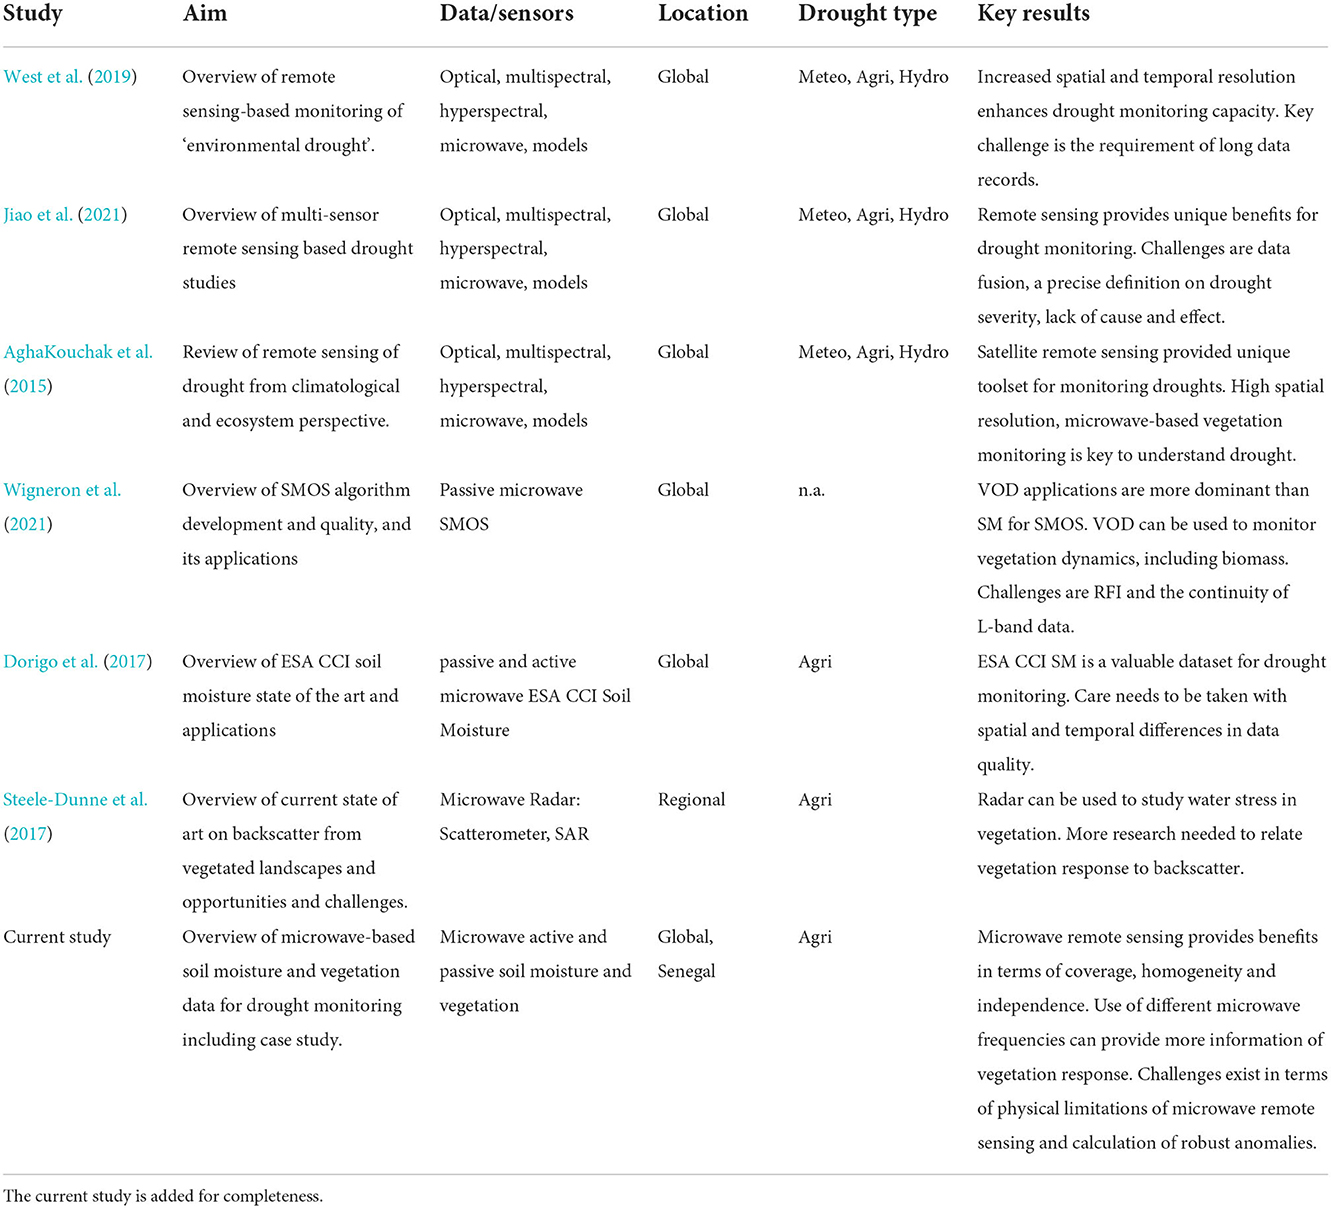
Table 1. Summary of relevant review papers on drought monitoring with remote sensing data.
Fundamental concepts in microwave remote sensing
Microwave sensors operate at frequencies between 0.3 and 300 GHz, corresponding to wavelengths between 1 m and 1 mm (Ulaby et al., 1986). The sensing depth in vegetation canopy or soil is related to the wavelength, where longer wavelengths have higher sensing depths than shorter wavelengths. Therefore, microwaves interact with, and sense more of, the medium than visible and near infrared signals. So, while VNIR sensors measure surface characteristics, microwaves provide information from within the soil and vegetation. Many Earth observation microwave sensors operate between 1 and 18 GHz, in the so-called L-, C-, X- and Ku-bands. At these frequencies, there is a large difference between the dielectric constant of water (up to e = 80), soil particles (2 < e < 4) and dry matter (1.5 < e < 2) (Ulaby and El-Rayes, 1986). Hence, microwaves are sensitive to the water content in the surface soil layer and the above ground biomass through their sensitivity to the dielectric constant of the medium they interact with or originate from. With increasing water content, the dielectric constant of the medium increases, leading to a higher reflectivity and lower emissivity (Ulaby et al., 1982). In addition to the sensitivity to the dielectric constant, the microwave signal is also affected by the geometry of the medium, e.g., vegetation structure and soil roughness (Attema and Ulaby, 1978; Paloscia et al., 1998; Verhoest et al., 2008).
Reflectivity and emissivity from the land surface can be measured through active and passive microwave sensors, respectively. Passive sensors measure the natural emission of the land surface. As this signal is relatively weak, these sensors must aggregate the emission over a relatively large area. The required footprint depends on frequency, but can be several tens of kilometers at L-band (Entekhabi et al., 2010a; Kerr et al., 2012). An advantage is that global coverage is achieved every few days over the equator and more frequently in higher latitudes. The observable of passive systems is brightness temperature [K], which is a function of physical temperature and emissivity, and can be recorded in both vertical and horizontal polarizations. Active sensors used for soil and vegetation remote sensing are scatterometers and Synthetic Aperture Radars (SAR). The sensors transmit a microwave signal and receive the part of the echo that is reflected back to the sensor, the so-called backscatter. The signal can be emitted and received under combinations of different polarizations, including a combination of vertical and horizontal polarization, and under different incidence angles. The active manner of sensing allows for higher spatial resolutions. SAR systems, in particular, can have spatial resolutions up to several meters, although this is often at the cost of temporal resolution or spatial coverage.
One of the challenges in the retrieval of SM and vegetation information from both active and passive microwave observations is to separate between the signal originating from either the soil or the vegetation. Different types of methods and model approaches exist to obtain SM or vegetation information, ranging from simple indices to change detection, radiative transfer models, and machine learning methods (Petropoulos et al., 2015; Li et al., 2021). Purely data-driven approaches for SM retrieval are to use change detection, where the observable is scaled between measurements observed under the driest and wettest conditions over a long period (Wagner et al., 1999a), or machine learning (Kolassa et al., 2018). One of the most common methods for the retrieval of soil and vegetation information is by inverting a radiative transfer model (Owe et al., 2001; Kerr et al., 2012; O'Neill et al., 2015). This forward model characterizes the brightness temperature or backscatter as a combination of emissions or reflections from the soil (which are attenuated by the vegetation), emission from the vegetation (also attenuated by the vegetation), and interactions between the two. The last term is often neglected as some studies have suggested it does not significantly contribute to the total signal at lower wavelengths (Attema and Ulaby, 1978; Jackson and Schmugge, 1991). SM can be retrieved from the soil contribution, and the attenuation by the vegetation is described by VOD, which is related to the water content of the above ground biomass. Note that this approach makes a number of assumptions on the scattering mechanisms, distributions of scatterers and contributions from the different constituents to simplify the model.
In active microwave remote sensing, diversity in viewing geometry and/or polarization can provide insight into the relative contribution of different scattering mechanisms from vegetated surfaces. Vegetation can be considered a volume scatterer, where multiple scattering occurs within the medium and this scattering occurs more or less equally in all directions (Ulaby et al., 1986). Multiple scattering can also change the polarization of the signal, e.g., where the incoming vertically polarized signal is changed to horizontal polarization. Soils act more like a surface scatterer, which mainly directs scattering away from the sensor in the same polarization. SAR polarimetry can be used to monitor changes in vegetation height, structure and biomass (e.g., Steele-Dunne et al., 2017), anomalies in which can indicate the impact of drought. When backscatter is obtained at multiple incidence angles, one can quantify the relationship between incidence angle and backscatter, which is strongly driven by changes in vegetation, with an increase in vegetation leading to a less steep slope (Wagner et al., 1999b; Naeimi et al., 2009). The slope has been used to monitor phenology and vegetation water dynamics and to retrieve VOD (Vreugdenhil et al., 2017; Steele-Dunne et al., 2019; Petchiappan et al., 2022). In addition, when cross-polarized backscatter is measured, this can be used to quantify vegetation dynamics (Toan et al., 1992; Paloscia et al., 1998; Saatchi et al., 2013; Khabbazan et al., 2019). The cross-polarized backscatter will increase with increasing vegetation as the vegetation causes depolarization of the signal.
The above described methods for obtaining SM and vegetation information are simplifications of complex processes and interactions, and neglect for example the effect of multiple scattering, vegetation structure or soil roughness on the microwave signal. Nevertheless, reliable SM is retrieved from different microwave sensors using radiative transfer, change detection, or machine learning models and are available operationally, such as the Soil Moisture Ocean Salinity [SMOS, (Kerr et al., 2012)] and Soil Moisture Active Passive [SMAP, (Entekhabi et al., 2010a)], Advanced Microwave Scanning Radiometer Sensor (AMSR-E) Land Parameter Retrieval Model (LPRM) (de Jeu et al., 2008; Owe et al., 2008), Metop Advanced Scatterometer [ASCAT, (Wagner et al., 2013)] HSAF SM product and the long-term merged record from the European Space Agency Climate Change Initiative [ESA CCI, (Dorigo et al., 2017)]. The Vegetation Optical Depth Climate Archive [VODCA, (Moesinger et al., 2020)] dataset merges VOD derived from the radiative transfer based Land Parameter Retrieval Model (Meesters et al., 2005; Van der Schalie et al., 2017) into a long-term record.
Drought monitoring approaches and applications based on microwave remote sensing
Soil moisture indicators
The increasing availability of operational SM products has boosted their use for agricultural drought monitoring in recent years. An overview of indicators used for agricultural drought monitoring based on single variables from microwave observables and SM are given in Table 2. The indicators can be divided into two general approaches: (1) indicators based on anomalies from a long-term mean, and (2) indicators based on plant available water. The skill of satellite SM-based drought indicators has been evaluated with many different reference datasets, depending on the focus of the study. Many studies that focus more on meteorological drought monitoring or drought monitoring in general use hydro-meteorological indicators, such as the Standardized Precipitation Index (SPI), Standardized Precipitation Evapotranspiration Index (SPEI), Atmospheric Water Deficit (AWD) or Palmer Drought Severity Index (PDSI) as a reference for assessing the microwave-based drought indicators. Studies that particularly focus on agricultural drought monitoring often use vegetation datasets or indicators for evaluation, such as the Crop Moisture Index (CMI) or Vegetation Health Index (VHI). Regional studies often use regional or national existing drought indicators, such as data from the United States Drought Monitor (USDM). Some evaluations do not use a specific drought reference dataset, but calculate the same index with in situ or modeled SM observations and inter-compare them. Most studies developed drought indicators for certain regions and only few studies have assessed drought monitoring on a global scale using satellite SM data. Few studies focused specifically on agricultural drought monitoring. Hence, we include general drought monitoring studies that address agricultural areas.

Table 2. Drought indicators based on SM data.
Anomaly approaches
The simplest approaches are based on SM anomalies, percentiles or indices, such as the Standardized Brightness Temperature Index (SBTI), Standardized Soil Moisture Index (SSMI or SSI), Soil Moisture Deficit Index (SMDI), Soil Moisture Condition Index (SMCI) and Soil Moisture Anomaly Percentage Index (SMAPI) (Champagne et al., 2011; Scaini et al., 2015; Carrão et al., 2016; Velpuri et al., 2016; Cammalleri et al., 2017; Nicolai-Shaw et al., 2017; Pablos et al., 2017; Padhee et al., 2017; Eswar et al., 2018; Sadri et al., 2018; Xu et al., 2018; Blyverket et al., 2019; Ford and Quiring, 2019; Liu et al., 2019; Zhu et al., 2019; Modanesi et al., 2020; Fang et al., 2021; van Hateren et al., 2021; Vroege et al., 2021). There are many ways to prepare raw SM data to calculate robust anomalies from the long-term mean. Most studies aggregate raw SM data to multiple days (e.g., dekadal), monthly or seasonal values using linear averaging or smoothing windows to obtain robust anomalies. Anomalies are calculated as deviations from the long-term mean. To obtain a drought indicator, a threshold needs to be defined on what constitutes drought conditions. Studies using the percentile anomaly approach set different thresholds for drought conditions, varying between values of below 10% to below 33% compared to all occurring conditions for that particular period. For standardized SM indices and Z-scores, usually a standard deviation of −1 or lower is classified as moderate drought (Carrão et al., 2016), which is also recommended by WMO for the Standardized Precipitation Index. This corresponds to a percentile of 15.8%, if the data is normally distributed.
The advantage of these approaches is that they are data-driven and can be calculated from satellite SM when a long record is available without the need for auxiliary data. A method to obtain robust anomalies when only short time series are available is to use parameters from a long-term SM record in combination with a short time series. Sadri et al. (2018) fitted 3 years (2015–2017) of SMAP SM to a beta distribution and used the percentiles as drought indices. However, to obtain the bounds of the beta distribution, a long time series is needed. To circumvent this, modeled SM was used to assess the quality of the fit based on 3 (2015–2017) compared to 38 (1979–2017) years of data. SMAP data was only used over areas where the fit of model data over 3 years was statistically significantly similar to the fit using 38 years of data. Xu et al. (2018) calculated the SSI and SMDI from SMAP using the mean and standard deviation from long-term SM records from North American Land Data Assimilation System (NLDAS) and Global Land Assimilation System (GLDAS), respectively. Champagne et al. (2011) used a space for time approach, where AMSR-E SM was aggregated over regions of homogenous SM dynamics, where each pixel in the region was used to obtain a stable frequency distribution.
Several studies have assessed the skill of satellite SM-based drought indicators on a global scale by comparing it to models (Cammalleri et al., 2017; Ford and Quiring, 2019; Liu et al., 2019). Cammalleri et al. (2017) demonstrated the potential of the ESA CCI SM dataset for drought monitoring when comparing Z-scores of ESA CCI SM anomalies to those of Land Information System (LIS) modeled SM and Land Surface Temperature (LST) from Moderate Resolution Imaging Spectroradiometer (MODIS) as a proxy for SM. Especially over arid regions ESA CCI SM outperformed the other datasets, whereas LIS was more reliable over areas where station data was available, i.e., Europe and North-America. Liu et al. (2019) compared global-scale drought characterization using SMAPI based on ESA CCI and GLDAS-Noah surface SM datasets to the SPI calculated from Global Precipitation Climatology Centre (GPCC) precipitation data. The performance of SMAPI of both SM datasets was highly consistent with the SPI especially with respect to spatial drought patterns. ESA CCI SMAPI had a higher frequency in drought detection than SMAPI based on GLDAS-Noah, which they attributed to the shallower soil depth represented by the former. Furthermore, large discrepancies between SMAPI based on ESA CCI and GLDAS-Noah were found over arid and semi-arid regions and dense vegetation, as there is a low signal-to-noise ratio over these areas. Zhang et al. (2016) also found that the SMCI based on the AMSR-E observations performed poorly over densely vegetated regions in CONUS. Ford and Quiring (Ford and Quiring, 2019) compared the skill of model- and satellite-based standardized SM anomalies from SMOS, SMAP and ESA CCI, to in situ based SM anomalies and found that over the US the SSMI based on the NLDAS VIC model outperformed those based on most satellite-based indicators. The satellite-based indicators based on SMAP outperformed those based on ESA CCI and SMOS with respect to drought occurrence. The lower accuracy of the SMOS-based SSMI was attributed to high Radio Frequency Interference. On the other hand, the short period of SMAP impeded drought severity estimates from SMAP, as the anomaly calculation was based on a too short period. Issues on length of data record also affected drought indicators from AMSR-E, where Champagne et al. (2011) found moderate correlations between SM anomalies of AMSR-E and drought indicators such as SPI and SPEI and attributed this to the short observation period (2003–2009). Nicolai-Shaw et al. (2017) encountered problems obtaining reliable drought indicators using ESA CCI before 1991 due to insufficient data density. After 1991, drought conditions using a percentile approach corresponded to hydro-meteorological indicators such as temperature, precipitation and vegetation indicators.
Sentinel-1 was launched in 2015 and still has a short data record. Few studies have used Sentinel-1 SM for drought monitoring. Urban et al. (2018) used SM retrieved from 10 m Sentinel-1 VV and VH backscatter using a change detection method to monitor drought impact in the Kruger National Park in South Africa. Results showed Sentinel-1 SM to be sensitive even to small changes in moisture content, making it suitable for drought monitoring in this area. A strong decrease in Sentinel-1 SM was observed during the 2015–2016 drought, which was more pronounced over open and sparsely vegetated areas.
Plant available water approaches
Indicators of SM related to plant available water can be calculated based on soil information, such as wilting point and field capacity. With these approaches the resulting value is directly indicating drought or non-drought conditions. The advantage is that these indicators can be calculated when no long-term records are available to calculate anomalies. This allows for the use of shorter satellite SM datasets such as NASAs SMAP (launched in 2015) and Sentinel-1 (launched in 2014). For example, the Soil Water Deficit Index (SWDI) (Martínez-Fernández et al., 2016; Mishra et al., 2017; Pablos et al., 2017; Paredes-Trejo and Barbosa, 2017; Bai et al., 2018; Zhu et al., 2019; Fang et al., 2021; Zhou et al., 2021; Cao et al., 2022) can be calculated as the SM scaled between field capacity and wilting point, indicating drought conditions when the value is below 0. The benefit of SWDI for short time series was demonstrated by Mishra et al. (2017) who calculated SWDI over the continental US from SMAP passive microwave SM observations. The analysis demonstrated that even though original SMAP SM did not reveal spatial drought patterns, the SWDI based on SMAP SM data did when compared to AWD and PDSI. Fang et al. (2021) assessed SWDI and SMDI calculated from downscaled SMAP SM and SMAP combined with GLDAS-Noah over Australia and found SWDI to capture drought conditions better than SMDI. Martínez-Fernández et al. (2016) and Paredes-Trejo and Barbosa (2017) used SMOS (L2, v5.51, and v6.2, respectively) SM to retrieve SWDI over Spain and Brazil which compared well to AWD and CMI. The SWDI was able to detect drought-weeks, when SWDI is below 0, with a good performance in probability of detection compared to AWD (where drought constitutes AWD < 0), except over mountainous areas. Pablos et al. (2017) calculated multiple drought indicators from SMOS (BEC L4 SM v.3) over Spain and found the SWDI showed a smoother temporal behavior compared to other drought indicators, which jumped between drought and non-drought from one observation to the next. However, a downside of this method is that in order to obtain these indicators additional information is needed on field capacity and wilting point, introducing additional uncertainty from auxiliary datasets.
To avoid the use of auxiliary data, Martínez-Fernández et al. (2017) tested the scaling of SWDI between wilting point and field capacity from soil samples and via pedotransfer functions, and several approaches to calculate wilting point and field capacity from the data itself. However, the accuracy of SM data is important in this approach. When field capacity and wilting point were estimated from SMOS SM data, the dry bias in SMOS led to an overestimation of drought-weeks. When the parameters were estimated through pedotransfer functions or from in situ data, the number of drought-weeks was more accurately captured (Martínez-Fernández et al., 2017; Pablos et al., 2017). Pablos et al. (2017) also showed that SWDI calculated from SMOS BEC L4 SM v.3 SM overestimated the number of drought-weeks when using in situ and pedotransfer functions to obtain soil properties. This was also attributed to the dry bias that is observed in SMOS SM. The dry bias was observed in SMOS v.3 and has been resolved since. To mitigate the impact of bias, several studies advocate for applying a bias correction before calculating drought indicators. For SMAP, studies found that a bias correction against in situ or modeled data on the satellite SM data improved drought monitoring skill (Mishra et al., 2017; Cao et al., 2022). These results demonstrate that the accuracy of the satellite SM products is crucial for estimating drought duration and a scaling of SM to in situ SM or model SM data prior to calculation of a drought index is recommended.
One advantage of approaches based on plant water availability is that they may be more directly related to the impact of drought on vegetation. Several studies have assessed this by comparing SWDI to vegetation observations and indicators such as NDVI, Gross Primary Production (GPP) and Vegetation Condition Index (VCI). Chatterjee et al. (2022) demonstrated the use of SMAP SWDI over the Continental US with a strong correspondence to vegetation GPP derived from MODIS. The study particularly highlighted the improved drought detection of SMAP SWDI, compared to SPI, SPEI and Comprehensive Drought Index (CDI), when evaluated with MODIS GPP. Zhou et al. (2021) calculated SWDI both from GLDAS-Noah and ESA CCI SM over China and looked at lags in drought onset compared to VCI. No lags between VCI and SWDI were found over crops, but over forests VCI showed a later drought onset than SWDI. Wu et al. (2022) used high resolution (3 km) SM based on SMAP and Sentinel-1 (SPL2) and medium resolution (9 km) SMAP only SM (SPL3) to calculate SWDI and compared this to AWD, and anomalies from the long-term monthly means for NDVI and GPP over China. Spatial and temporal patterns between SWDI and AWD were similar and a high correlation was found for SPL3, without a lag time. Only over very heterogeneous, small, scattered croplands low correlations were observed. Correlations with vegetation indicators were lower than with AWD and a lag of 8 days, with SWDI leading GPP, was observed over most land cover types. Although the high-resolution product showed more spatial detail, correlation with AWD, NDVI and GPP was lower.
Vegetation indicators
In their review on remote sensing of drought, AghaKouchak et al. (2015) already argued for the use of high spatial resolution microwave vegetation indicators to improve the understanding of drought impact on ecosystems. Advantages of microwave remote sensing are the possibility to use day- and night-time observations and the higher penetration depth of the signal, thus allowing for a more comprehensive look at moisture status of the entire canopy. Here, microwave-based data can complement the VNIR data as it is sensitive to both the canopy and the woody parts of the vegetation, where increasing wavelength increases the sensitivity to woody parts. For microwave remote sensing most studies on vegetation monitoring have focused on coarse spatial resolution microwave data.
Coarse resolution data from radiometers and scatterometers has mainly been used to monitor drought impact on forests. Studies have demonstrated the potential of vegetation parameters such as VOD to monitor drought impact on vegetation, particularly on forests (Konings et al., 2021), such as the Amazon in 2005, 2010 and 2015 (Saatchi et al., 2013; Liu et al., 2018; Petchiappan et al., 2022), and on tree mortality (Rao et al., 2019). Over croplands and pastures only very few studies have been performed using coarse resolution data, mostly passive microwave-based VOD (Buitink et al., 2020; Afshar et al., 2021; Likith et al., 2022) or the active microwave-based slope from the backscatter incidence angle relationship (Schroeder et al., 2016; Vreugdenhil et al., 2017; Steele-Dunne et al., 2019; Petchiappan et al., 2022). Most studies investigate satellite observations such as backscatter and brightness temperature directly, or use VOD.
Anomaly approaches
Several studies use Z-scores to monitor drought using microwave observations. Vreugdenhil et al. (2017) used monthly means of VOD derived from Metop ASCAT to obtain Z-scores from the anomalies to the long-term mean to assess inter-annual variability in Australia during the Millennium drought. Over grass- and croplands strong inter-annual dynamics were observed, with low values in standardized VOD and LAI in south-eastern Australia during the Millennium drought compared to the wetter La Niña years of 2010 and 2011. In Western Australia, the 2010 La Niña year was one of the driest years on record, which was reflected by anomalously low VOD over croplands. Similar to other studies, VOD lagged behind LAI by 1–2 months over croplands and more woody biomass, while no lag was found in sparse vegetation and grasslands. Buitink et al. (2020) used VOD from C-band VODCA and near-infrared reflectance of terrestrial vegetation (NIRv) to assess the anatomy of the 2018 agricultural drought in the Netherlands. A 31-day smoothing window was applied over the data from 2016 and 2017 and these were averaged to obtain a climatology. Anomalies were calculated as deviations from the climatology. Strong negative anomalies in VOD and NIRv were observed, although they were preceded by higher-than-average values in early summer indicating early development due to favorable temperatures. In general, a two- and three-week lag was observed between decreasing SM and decreasing VOD and NIRv, respectively. Afshar et al. (2021) assessed the potential of SMOS L-VOD (SMOS-IC v2) in comparison to NDVI for monitoring agricultural drought. Here standardized VOD and NDVI for drought and non-drought periods based on a 12-month SPI were compared. VOD was smoothed over 30 days and monthly standardized anomalies are calculated using a Z-score approach. Average Z-scores of VOD and NDVI were calculated for drought periods, characterized as SPI values of lower than 1 and at least 3 months duration. VOD showed a sensitivity to drought with significant differences in Z-scores between drought and non-drought conditions. Drought onset and termination of VOD was later than that of SPI. Evaluated against SPI, VOD performed better compared to NDVI over wetter climates, which was attributed to the more frequent cloud cover impeding reliable NDVI observations. Furthermore, VOD was more sensitive to capture drought over dense vegetation, as NDVI was argued to suffer from saturation. Likith et al. (2022) evaluated Z-scores of VOD from SMOS (L-band, CATDS-PDC L3SM) and VODCA (C- and X-band) with NDVI, solar-induced chlorophyll fluorescence (SIF) and precipitation data over India. Monthly averages were obtained to normalize the datasets with Z-scores of the anomalies from the long-term mean. Strong correlations between rainfall, SIF and VOD Z-scores were found over India, where a response in SIF and VOD lagged rainfall by 1–2 months. Testing L-, C- and X-band, strongest correlations were found between X-band VOD and precipitation for most regions in India.
Z-score statistics from multi-sensor VOD datasets are notoriously impacted by the sensor blend at a certain time and location, with periods of enhanced noise potentially leading to higher Z-scores and thus an overestimation of drought severity. To overcome this, Moesinger et al. (2020) proposed the Standardized Vegetation Optical Depth Index (SVODI) by combining VOD estimates from multiple passive microwave sensors and frequencies in a probabilistic manner. Particularly in water-limited areas, SVODI patterns compared well to temporal patterns of VHI, VCI, the temperature condition index (TCI), and soil moisture, but anomalies occur later, indicating that VOD anomalies likely represent a more advanced stage of drought conditions.
Other approaches
Shorachi et al. (2022) used Sentinel-1 backscatter and Cross Ratio (CR) to assess the 2018 drought in the Netherlands for different crop types. They found a drop in backscatter of 1–2 decibel. Although the CR did not show convincing negative anomalies during the growing season, it did show an early end of the growing season for onions and maize. Furthermore, negative anomalies in CR were found in 2019, indicating the impact of the drought on the next growing season. It was also noted that negative anomalies were stronger in descending (morning) overpasses than ascending overpasses. In their study to assess the drought monitoring potential of the combined SMAP and Sentinel-1 SM product SPL2, Wu et al. (2021) showed that Sentinel-1 VH backscatter has a higher predictive power for NDVI than brightness temperature over croplands. Abdel-Hamid et al. (2020) studied the impact of the 2015/2016 drought on commercial and communal grasslands in South-Africa using Sentinel-1 and NDVI from Landsat-8 with a regression analysis. The analysis showed a strong impact of the drought on both VV and VH backscatter, with lower values during the drought period. Furthermore, communal grasslands were more impacted by droughts than commercial grasslands. Ghazaryan et al. (2020) demonstrated the use of Sentinel-1 backscatter and ratio of VH/VV backscatter, and VNIR based vegetation indices for drought monitoring over different crops in the Ukraine. Drought duration and spatial extent were obtained from Sentinel-1 backscatter and VNIR data by calibrating thresholds on the area of the Receiver Operating Characteristic Curve with in situ data on drought. Compared to VNIR-based indices Sentinel-1 drought indicators showed a longer drought duration and drought onset was 12–24 days earlier. Spatial patterns in drought impact corresponded between VNIR and Sentinel-1 indicators. Furthermore, during drought periods, higher variability was observed in backscatter from Maize crops. For wheat fields, backscatter was higher during drought periods, which was explained as a decrease in attenuation during drought period.
Steele-Dunne et al. (2017) provided a thorough overview on the use of radar remote sensing for agricultural canopies. Here the use of radar remote sensing for monitoring diurnal differences is discussed, as diurnal differences in backscatter are related to a decrease in canopy water content as a result of water loss during the day. For example, Schroeder et al. (2016), found that diurnal differences in ASCAT backscatter over the US were most pronounced over areas that suffered from drought. Steele-Dunne et al. (2019) demonstrated the potential for drought monitoring with the slope and curvature of the backscatter-incidence angle relationship of Metop ASCAT over North-American grasslands. Data was aggregated to 10-daily values, and drought years identified with the USDM were compared to the long-term mean over 2007–2016. During the 2011 and 2012 drought strong negative anomalies in slope were observed, suggesting an impact of drought on the vegetation. Petchiappan et al. (2022) also performed an analysis of drought impact on vegetation over the Cerrado regions. The 2015 drought occurred during the wet season in the Cerrado, and most of the agricultural areas showed higher than average slope values for this period. This was explained by above-average radiation, leading to increased vegetation activity.
Sawada et al. (2020) compared trends in LAI and C-band VOD retrieved with LPRM and found significant negative trends in precipitation and VOD, but not in LAI for the period 1993–2009. This was explained as a decrease in above ground biomass during the drought, whereas the greenness as represented by LAI stayed stable. These results were also found by van Dijk et al. (2013) when assessing the Millennium drought impact over wheat. Although a decline concurrent with declining precipitation was expected for the three indicators, this decline was not observed in NDVI. This was explained by the fact that NDVI shows the long-term increase in Water Use Efficiency of crops. Jiao et al. (2020) retrieved VOD from SSM/I, TRMM and AMSR-E C-band observations over Australia and used this as an indicator for canopy density (CD). The magnitude of absolute and relative anomalies of monthly aggregated CD were calculated compared to a baseline which was defined as CD in the same season for a year when a water balance indicator showed no drought conditions. Sensitivity of CD to drought was assessed as fraction of decline to its normal state when the water balance was one standard deviation lower than the long-term mean (1970–2012). The severe impact of drought on cultivated and grasslands was shown, where negative anomalies corresponded to declines in above ground biomass and fraction of absorbed photosynthetic active radiation (FPAR) and photosynthetic vegetation cover (PVC) from Advanced Very High Resolution Radiometer (AVHRR) observations. The study also showed a high sensitivity of the indicators to drought, particularly over grass- and croplands. Furthermore, CD tended to lag PVC and FPAR over cultivated areas and forests, whereas no lag was found for sparse vegetation cover types.
Combined drought indicators
Approaches to combine multiple satellite datasets for drought monitoring are mostly based on a combination of precipitation and temperature data. However, studies have started to integrate satellite SM as an additional indicator. Enenkel et al. (2016) developed the Enhanced Combined Drought Index (ECDI), that conceptualizes drought as a cascading process for four variables (precipitation, SM, land surface temperature and vegetation status). For each variable the anomaly from the long-term average is calculated as a ratio, which is then multiplied by the ratio between the length of the current deficit and the long-term average of deficits for the period of interest. The ECDI assigns individual weights to rainfall, SM and land surface temperature based on the historical correlation with NDVI as a proxy for vegetation health.
Several other studies used a weighted sum of precipitation, temperature and SM, and some vegetation, where the weights are obtained with constrained optimization or Principal Component Analysis (Zhang and Jia, 2013; Hao et al., 2015; Zhang et al., 2016; Arun Kumar et al., 2021; Niaz et al., 2021). The resulting combined drought indicators have been evaluated against reference data such SPI or SPEI. Hao et al. (2015) tested different combinations of variables and found that an indicator based on precipitation, temperature and SM corresponds most to 1-month SPI. When including vegetation information through VCI the indicator correlated more with 3-month SPI. Arun Kumar et al. (2021) also found a strong correspondence with 3-month SPI when including VCI in the combined drought indicator and that the most important variables for drought monitoring were based on vegetation and precipitation for the study area in India and not SM.
Another often used combined drought indicator is the SM Agricultural Drought Index (SMADI), which is based on the slope of standardized land surface temperature and NDVI relationship multiplied with SM standardized to its maximum, the so-called SM condition index [SMCI (Sánchez et al., 2016)]. Drought conditions are represented by high slopes of LST/NDVI, relating to low vegetation and high temperature conditions, and high values of the SM condition index. A lag needs to be included between the LST/NDVI slope and SM to account for the delayed response of the vegetation. This lag has been tested in various studies but is often set to 8 or 14 days. The quality of SMADI for drought monitoring is assessed in several studies at local, regional and global scale (Sánchez et al., 2016, 2018; Mercedes-Salvia et al., 2021; Souza et al., 2021). Sánchez et al. (2016) found that SMADI corresponded to SWDI and CMI calculated from in situ observations over the Iberian Peninsula. Pablos et al. (2017) compared both SMADI and SWDI to AWD and CMI. High temporal correlations were found between SMADI and AWD. Lower agreement was found with CMI, as CMI showed continuous zero values at the beginning and end of the growing season. The SMADI slightly underestimated the number of drought-weeks as compared to AWD, but was similar to the number of drought weeks obtained from CMI. Over the Continental US the SMADI corresponded to the USDM, although it underestimated spatial drought extent and intensity. Also, on a global scale SMADI corresponded to Emergency Events Database (EM-DAT) drought events (Sánchez et al., 2018). Mercedes-Salvia et al. (2021) tested the added-value of the SMADI, standardized SM anomalies, SPI, SPEI compared to the national drought monitor for early warning of agricultural drought in Argentina. Results showed that SMADI performed best in detecting drought, where 84% of droughts were captured, against 53% of false positives. The standardized SM anomalies showed the lowest false positive drought detections, but also the lowers true positive drought detections (47%). Similar to other combined drought indicators, Souza et al. (2021) showed that SMADI corresponded most to 3-month SPI over Brazil.
Applications
Crocetti et al. (2020) assessed the potential of various EO-based water- and vegetation-related drought indicators against an extensive database of reported drought impacts in the Pannonian Basin. They found that microwave-based soil moisture anomalies had very similar skill in identifying severe drought as SPEI and the evaporative stress index based on thermal imagery. The EO-based vegetation indicators showed a more mixed response to severe drought, with drought impacts on VOD occurring later in the season than for SIF and NDVI.
Some studies use drought indicators based on microwave observations for crop yield prediction and monitoring. Carrão et al. (2016) showed that the Empirical Surface Soil Moisture Index (ESSMI) from ESA CCI cumulated during the growing season corresponded to yield from maize, soybean and wheat in South America. Also, Padhee et al. (2017) demonstrated that a SM deficit indicator from ESA CCI SM corresponded to yield losses of Rabi crops over the Bundelhand regions and was a better indicator for yield losses than VCIs based on optical data. Modanesi et al. (2020) calculated SSI from ESA CCI and Modern-Era Retrospective Analysis for Research and Applications, version 2 (MERRA-2) and SPI from rainfall observations from the Indian Meteorological Department over India. Results showed that SM is more suitable than precipitation for agricultural drought monitoring, and that SSI based on ESA CCI satellite SM was better capable of explaining crop yield reductions than the SSI based on MERRA-2 SM.
Microwave observations are also used in drought risk financing. Vroege et al. (2021) demonstrated that the use of ESA CCI SM to obtain a yield index significantly decreases drought risk exposure of farmers. The study demonstrated that satellite SM outperformed in situ based SM for index insurance of drought when assessing anomalies over longer time scales but not on shorter time scales, due to lower data density of satellite observations.
Case study
The purpose of the following case study is to demonstrate the complexity of monitoring drought with different satellite-based rainfall, SM and vegetation datasets. The focus is on the major drought event that struck Senegal in 2014 and the development of the drought, including onset, severity and duration is calculated from different datasets and compared.
Study area and data
Climate in Senegal is characterized by strong gradients. The average annual temperature is 27.8°C but temperature varies from the coast to the inland. Precipitation varies strongest from north to south. In the north, rainfall is below 400 mm per year, hence, this area is not suitable for rainfed agriculture every year. The central area of Senegal receives between 400 and 800 mm of rainfall per year. Two distinct seasons characterize Senegal's climate: a dry season from roughly October to May and a rainy season from June to September. Crop growing areas in Senegal correspond mostly to regions that, according to the ESA CCI Land Cover classification, are classified as cropland, natural vegetation, shrublands, or herbaceous cover, and mixtures thereof (Figure 1). Most planted crops in Senegal are groundnut, millet, maize, sorghum and rice, and most crops are sown in June and July, except for rice. The exact timing of sowing of crops depends on the start of the rain season. As agriculture is mainly rainfed, crops are highly sensitive to climate disasters such as droughts, and food insecurity is common. Many droughts have impacted Senegal over the years, and as a result of climate change, droughts are expected to become even more common. In the last decade, Senegal experienced droughts in 2011, 2014, and 2019.
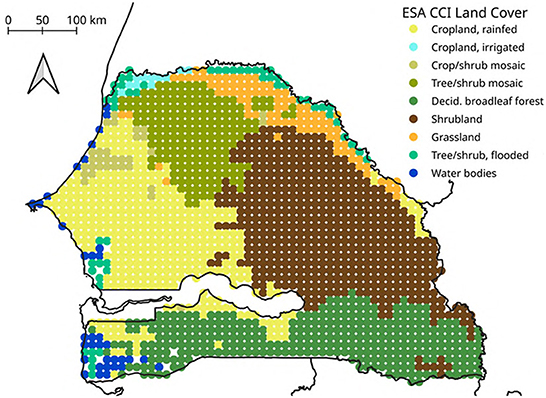
Figure 1. Predominant land cover in the study area (ESA CCI Land Cover classification resampled to 0.1°).
We selected microwave-based surface SM, Soil Water Index (SWI) and VOD datasets for the case study, along with the thermal infrared/rain gauge-based CHIRPS rainfall dataset and NDVI from optical data. The SWI is based on a temporal filtering method with a parameter T as an indicator of soil depth divided by diffusivity indicating infiltration time. The SWI is available for different T-values, where a higher T-value is related to deeper soil depths. An overview and characteristics of the datasets are provided in Table 3. Several studies (Cammalleri et al., 2017; Myeni et al., 2019) showed the good performance of some of the selected datasets over Africa and particularly Senegal. The overlapping temporal coverage is 2007–2018. All datasets were resampled to a 0.1° grid and 10-day (“dekadal”) averages. To make anomalies in the different variables comparable, we calculated dekadal anomaly time series by subtracting the average value of each dekad of the year, calculated from all 12 years of data, from the original time series. These anomaly values were then converted to percentiles. We applied the following classification: Extreme deficit < 10th percentile <= moderate deficit < 33th percentile (p33) <= normal or close to normal conditions < 66th percentile <= moderate surplus < 90th percentile <= extreme surplus.
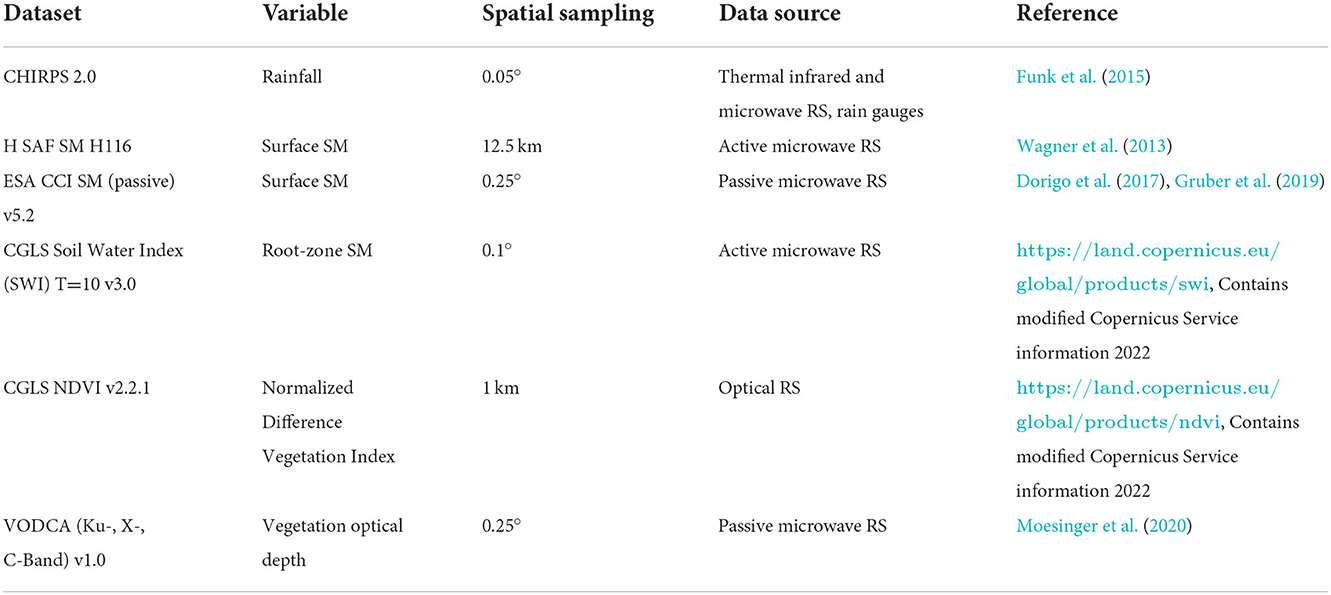
Table 3. Datasets used in the case study for Senegal and their main characteristics.
Intercomparison of drought monitoring skill
In 2014, late and irregular rains at the start of the growing season as well as erratic rains in July and August led to very high yield deficits, affecting close to a million people. Especially the northwest of the country was hit hard by the drought event (African Risk Capacity End of Season Report, EM-DAT, Global Information and Early Warning System on Food and Agriculture). Figure 2 shows the spatial and temporal development of the 2014 drought. In normal years, rainfalls start in the beginning of June, allowing for the sowing of crops and the start of the growing season. In June 2014, there was a rainfall deficit in the north of Senegal and later expanding over the country, leading to deficits in both ESA CCI passive and HSAF SM. Drought conditions develop slightly later in SWI, because it takes time for a drought to develop into lower soil depths. Also, in the vegetation datasets drought impacts can be observed, where onset is earliest and strongest in NDVI and Ku-band VOD. All variables show a progression of the negative anomalies from at first mainly in the north and east of Senegal to the north and west, and thus over time affecting all major crop growing regions of the country. In July and August 2014, extreme rainfall deficits aggravated the already critical conditions of the early growth season, depicted by extreme drought conditions in all rainfall and SM products in the third dekad of July for the whole country. Strongest drought conditions in the vegetation indicators, observed in the first dekad of August 2014, correspond to strongest drought conditions in SWI, with the epicenter of drought conditions in western Senegal. Only toward mid-September, the situation slowly started to relax in terms of rainfall. Nonetheless, in SM and SWI and vegetation indicators drought conditions persisted, particularly the extreme drought conditions in the north. The Casamance region, located in the south west, typically receives more rainfall than the rest of the country, which was also the case in 2014 and is reflected by all variables: whereas large parts of the country experienced moderate to extreme negative anomalies during the growing season, rainfall, SM and vegetation conditions were at least temporarily above average in Casamance.
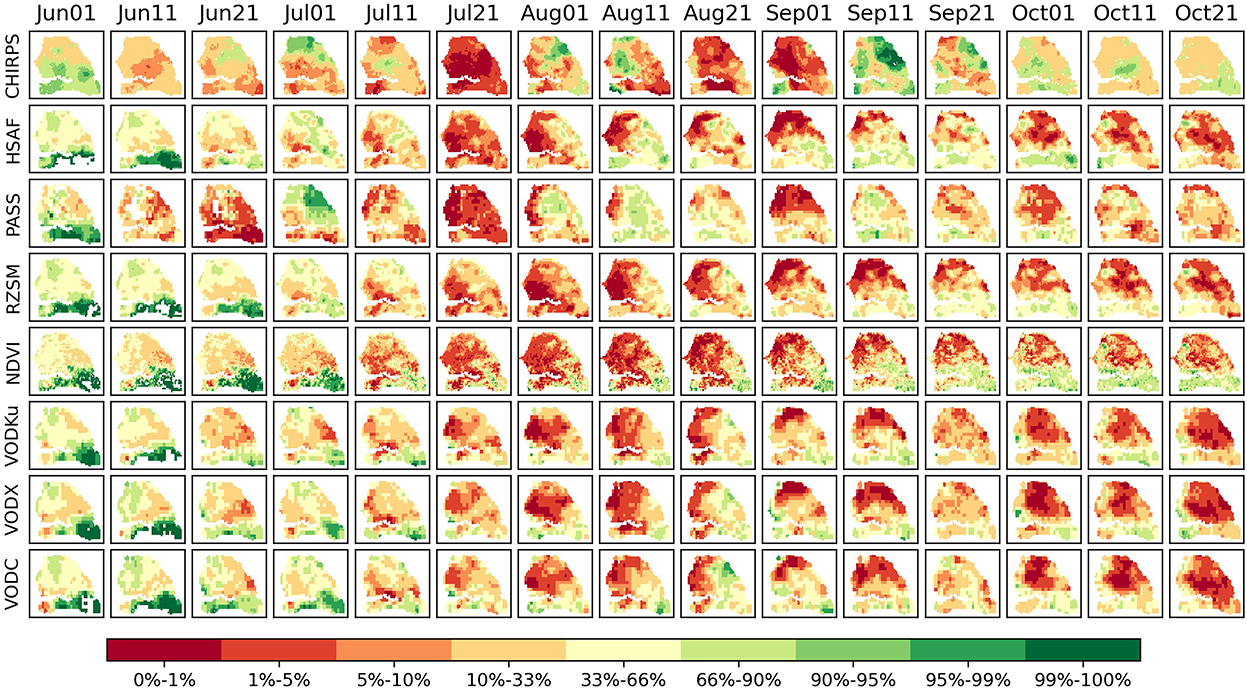
Figure 2. Spatio-temporal development of the 2014 drought in Senegal represented by anomaly percentiles in all datasets.
Figure 3 shows the number of pixels as percentage of the total under drought (values lower than the 33rd percentile p33) for cropland, shrublands and the tree/shrub mosaic ESA CCI land cover class. This allows comparing the extent and onset of drought in the different variables. The top three panels, showing drought pixels as depicted by the CHIRPS dataset, show that almost 100% of the three major land cover classes experienced very low rainfalls in mid-June 2014. In July and August, there are some periods of slight recovery, but only in September the situation relaxes, and < 50% of the pixels in cropland and shrublands appear under drought. Surface SM from active and passive sensors shows relatively similar extent of drought conditions apart from August 2014, where the fraction of drought pixels identified by the passive dataset drops to below 50% in all three land cover classes. Figure 2 shows that in the first two dekads of August, positive anomalies are observed in the rainfall datasets and are also present for a large area in the passive surface SM but to a smaller extent in the H SAF dataset. Root-zone SM dynamics are very similar to H SAF surface SM, as SWI is based on the same dataset, but smoother and show a lag of around one dekad to surface SM.

Figure 3. Pixels under drought over the duration of the 2014 drought in Senegal for rainfall, SM and vegetation.
Finally, the comparison of vegetation datasets, i.e., NDVI and VOD, shows that NDVI reacts faster to moisture deficits than VOD at the beginning of the growing season. Of the VOD datasets, VOD-Ku is closest to NDVI in terms of drought onset and extent, followed by VOD-X and VOD-C. VOD from Ku-band usually shows the highest number of drought pixels and VOD from C-band the lowest number. In all land cover types, VOD-C lags behind NDVI, VOD-Ku and VOD-X in the beginning of the growing season. This is what one would expect from theory, as longer wavelengths penetrate deeper into the canopy and are sensitive to the larger canopy constituents (Steele-Dunne et al., 2012, 2017; Konings et al., 2021). NDVI and Ku-band are sensitive to the leaves at the canopy surface. Longer wavelengths sense more, and potentially all of the plant, and therefore a larger water store than the surface leaves alone. Furthermore, at C-band, VOD may be sensitive to stems/stalks. In shrublands, the VOD datasets show the same decrease in drought pixels in August as passive SSM, indicating that this is caused by a systematic effect that especially the lower frequencies are sensitive to.
In a last step, we calculated common drought statistics from all variables, including drought onset (dekad of the first value in the growing season lower than p33), drought duration (number of dekads in the growing season with values lower than p33), and drought severity (average percentile of all anomaly values in the growing season lower than p33). We defined the growing season as the months June to October.
Figure 4 shows how the deficits first occurred in the northeast of Senegal and only later occurred also in the west. In addition, time lags of several dekads between surface and root-zone SM, as well as between NDVI and the different VOD frequencies, are apparent. The drought duration maps of the vegetation variables highlight again differences between microwave sensors with different wavelengths. The spatial patterns are most similar between NDVI and the VOD datasets with shorter wavelengths. Still, there is a clear similarity also with VOD-C, with longest duration in west Senegal. It also needs to be noted that based on CHIRPS precipitation the Casamance suffered a relatively long and severe drought, whereas vegetation indicators showed no drought impacts. The area along Senegal's border to Mauritania is visible as a region which was slightly less affected by the drought, most likely due to irrigation using freshwater from the Guiers Lake and Senegal river.
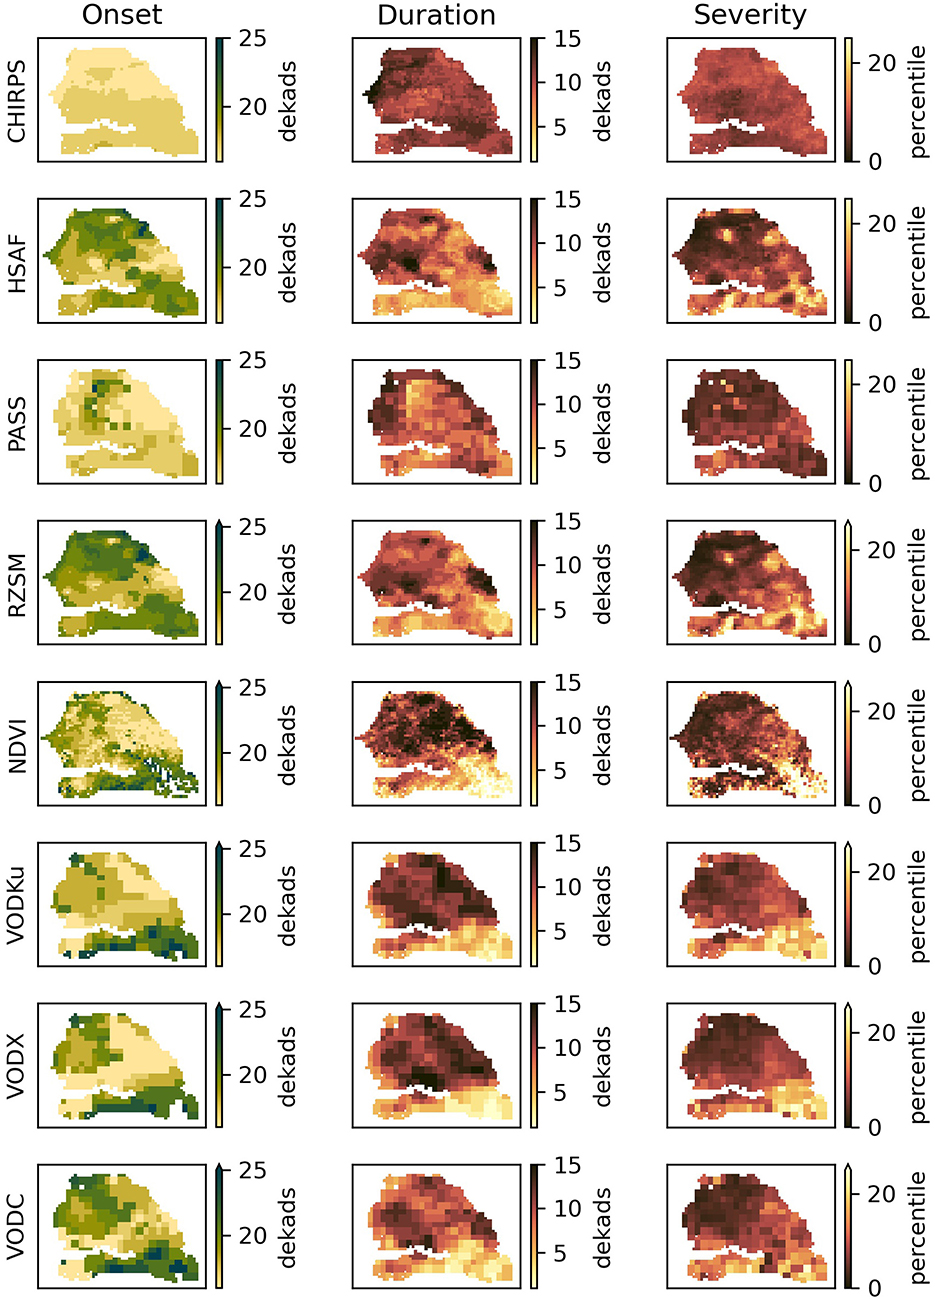
Figure 4. Statistics for the 2014 Senegal drought in terms of onset, duration and severity as captured by rainfall, SM and vegetation datasets.
In summary, the case study showed the good correspondence of the selected datasets and their ability to detect drought events, including drought onset, duration and severity. Differences between the variables highlight the respective sensitivities and the benefit of variable combinations for drought assessment. Using rainfall, surface and root zone SM, and vegetation data, the development of drought can be monitored. Note that the common data period was 12 years (2007–2018), which is generally considered (too) short for the robust derivation of climate-related parameters and trends. A great value thus lies in long-term data records such as the ESA CCI SM or VODCA datasets, which combine observations from different sensors and span periods from 1978 to present and 1987–2018, respectively.
Current research gaps and challenges
Most studies discussed in this review show the added-value of using microwave-based SM or vegetation data for drought monitoring. The main strengths are that more reliable data is available over areas where no weather station data is available, which may impact the skill of certain precipitation datasets and models. This also allows for drought monitoring on a global scale using a homogeneous dataset. In vegetation monitoring, microwave-based observations provide additional information on deeper layers of the vegetation, including the woody component of the vegetation. This provides the opportunity to assess the impact of drought through the plant, instead of only the surface of the canopy.
There are several physical limitations of microwave remote sensing that may be relevant for drought monitoring, namely topography, vegetation density and structure, and the potential for enhanced scattering in very dry soil.
Limitations of all microwave-based products are related to the difficulty of obtaining reliable retrievals over mountainous regions. In mountainous regions the topography can affect the microwave signal (Davenport et al., 2008; Mialon et al., 2008; Naeimi et al., 2009) and this led to uncertainties in drought monitoring in several studies (Mishra et al., 2017; Paredes-Trejo and Barbosa, 2017). Potential ways to mitigate the effect of topography on the SAR backscatter signal is to use gamma° (Small, 2011; Navacchi et al., 2022).
Dense vegetation is a limiting factor in drought monitoring as microwaves cannot penetrate dense vegetation and lose their sensitivity to SM (Magagi and Kerr, 1997; Wagner et al., 2013; Colliander et al., 2017; Dorigo et al., 2017). Most SM datasets are masked for dense vegetation, impeding drought monitoring over these regions. Working with SAR data at high resolution, the structural effect can influence the signal. Shorachi et al. (2022) looked at Sentinel-1 backscatter and CR per orbit, but noted that, when a dense time series from Sentinel-1 is needed, the incidence angle effect on the backscatter from Sentinel-1 can play a role. Particularly when monitoring crops, it is suggested that this is problematic as geometry affects backscatter differently at different incidence angles.
Furthermore, some studies note a lower quality of SM retrievals over arid and semi-arid regions, particularly for active microwave observations. Baik et al. (2019) found that SWDI from ASCAT deviated from that of modeled SM over Australia over arid regions, where it is suggested that roughness and scattering from the subsurface were affecting the signal. Enenkel et al. (2018) noted the subsurface scattering in backscatter as a potential issue for drought monitoring. While all current soil surface backscatter models predict that backscatter increases with increasing soil wetness for all polarizations, recent experimental research (Morrison and Wagner, 2020; Wagner et al., 2022) has demonstrated that under very dry soil conditions, when the microwave signal penetration depth is high, an unexpected inverse relationship between backscatter and SM occurs. Instead of the soil acting primarily as a surface scatterer, deeper soil layers induce volume scattering, i.e., enhanced scattering due to subsurface discontinuities. Especially for detection and monitoring of drought, the sub-surface scattering issue needs to be taken into account and more research is needed to understand the extent and severity of this problem on drought monitoring. Challenges particular to obtaining reliable drought indicators are the data availability of the used data sets. One of the limitations mentioned by Ghazaryan et al. (2020) is that the density of Sentinel-1 observations was a limiting factor to estimate drought duration. Vroege et al. (2021) noted that the lower data density of satellite data decreased the accuracy of using satellite SM for drought risk insurance. Also, Nicolai-Shaw et al. (2017) identified data density as a limitation. To resolve the issue of data gaps, Liu et al. (2019, 2022) successfully used model SM data for gap filling of the ESA CCI dataset. When the need for long time series is bypassed by calculating drought indicators based on soil properties, the quality of soil property datasets is crucial to obtain reliable drought indicators. More research is hence needed on the effect of gap filling and use of auxiliary data for drought monitoring.
For drought monitoring, it is important to realize that microwaves penetrate the first few centimeters of the soil and vegetation and that this brings certain advantages and limitations. For SM it means that there is no information readily available on the root zone. Some studies note discrepancies between satellite SM drought indicators and modeled and in situ SM indicators because of the different sensing depth of satellites. Zhang et al. (2017) noted that SMCI from AMSR-E showed highest correspondence to 1-month SPI, whereas vegetation-based indicators from NDVI were more similar to 3-month SPI. Mishra et al. (2017) and Zhang et al. (2021) found a 1-week delay between SM based indices (ESA CCI and SMAP based) and AWD, SPI and SPEI. Martínez-Fernández et al. (2016) found a 1-week lag between the SWDI from in situ SM observations from the root zone (0–50 cm) compared to AWD and CDI. However, this lag was not observed with the SWDI based on SMOS surface SM, demonstrating that the top layer reacts faster than the root zone. Root zone SM may be a more suitable variable to analyze agricultural drought as it can provide information on the plant available water. Soil Water Index (Wagner et al., 1999a; Albergel et al., 2008) as used in this study—provides an estimate of root zone SM, which cannot be measured by satellites directly. The difficulty with aggregating data or using SWI is that there is no consensus on the soil depth a certain aggregation period represents. For example, only few studies have tried to relate the SWI T-value to actual soil depths (Albergel et al., 2008; Brocca et al., 2010; Paulik et al., 2014) or to vegetation accessible water (Bouaziz et al., 2020). Hence, a major research gap in using satellite SM for drought monitoring is to obtain reliable SM representative for the root zone.
It also needs to be considered that a delay between SM deficits and vegetation response may be present. Studying major European droughts, van Hateren et al. (2021) demonstrated differences in onset of drought between drought indicators from ESA CCI SM and MODIS NDVI. This was also seen in several of the studies that focused on drought monitoring with SM and vegetation microwave data (Vreugdenhil et al., 2017; Jiao et al., 2020; Wu et al., 2021; Likith et al., 2022) and in the case study on Senegal. Combined Drought Indicators usually account for the lagged response of the vegetation by including a lag for the vegetation datasets (Sánchez et al., 2016; Souza et al., 2021). Furthermore, not all rainfall or SM anomalies lead to an anomaly in vegetation. van Hateren et al. (2021) showed that negative anomalies observed in SM did not always lead to negative anomalies in NDVI. This is also demonstrated by numerous studies on the recent European drought of 2018, where dry conditions led to increased vegetation activity in energy limited regions (Bastos et al., 2006). Similarly, in our case study for Senegal, drought conditions are observed in a region in the south of Senegal in some of the rainfall and SM indicators, which were not represented in the vegetation indicators. The observed discrepancies between the precipitation, SM and vegetation datasets explicitly emphasize the complexity of drought development and monitoring.
Conclusions and potential developments
In this study, we demonstrated the use of microwave remote sensing of SM and vegetation for agricultural drought monitoring. Studies have shown the benefits of using satellite SM datasets, particularly due to their global coverage, homogeneity and independence of station data. However, there are physical limitations of using microwave SM particularly over arid regions, mountains and dense vegetation. In addition, it is important to consider factors other than water content that may manifest in drought anomalies (e.g., structural effects in SAR data), and how they should be handled. One of the challenges is the calculation of robust anomalies when a short dataset or temporally discontinuous dataset is available. Furthermore, the calculation of some drought indicators requires additional ancillary data (e.g., soil parameters), the quality of which can dominate the skill of the drought indicator.
The use of VOD or vegetation indicators from microwave observations for monitoring drought impact on vegetation is still in an early stage. The complex response of vegetation to drought and how vegetation mitigates drought effects, particularly if plants change their hydraulic and water use efficiency, can potentially be studied using microwave-based vegetation data in combination with VNIR data. Studies discussed in this review demonstrated the complementarity of microwave data to VNIR approaches, as it can provide information on water content in the vegetation, including its woody components. Especially with the availability of high spatial and temporal resolution Sentinel-1 data, there is potential to develop new methods for agricultural drought monitoring and assessing the impact of drought on vegetation. The response of vegetation to water deficit is different for different vegetation types, where plants respond by speeding up their phenology (escape), change water use efficiency or shedding and decreasing (avoid) or tolerating a drought by changing osmosis or going dormant (Chaves et al., 2003). Yet, these responses are not straightforward to monitor with only one vegetation data set. Therefore, research should focus on understanding the complexity of drought development and how it varies across vegetation types.
Microwaves allow us to sense dynamics within the canopy rather than just observe its surface. In addition, the relative sensitivity of microwave observations to soil and vegetation varies by wavelength, polarization and technique. The diversity of microwave observations available now, and in the coming decades, provides a unique perspective on the complexity of drought development. The Senegal case study demonstrated the potential of using different bands, as it showed a difference in drought onset and extent between microwave bands. This suggests different bands can be used for different vegetation and crop types to obtain information on the water content in most important parts of the vegetation. To date, few studies have addressed the different sensitivities of bands to vegetation (Moesinger et al., 2020; Prigent and Jimenez, 2021), and there is a need to understand how drought signals in different bands vary across different vegetation types. One of the limitations is the dearth of in situ data on how water content within plants varies in response to drought. This is essential to understand the mechanism by which soil water deficit propagates through the water content of the various elements of the canopy, thereby affecting emission and scattering from the canopy. The vertical distribution of moisture within agricultural crops is non-uniform, varies during the season, during the day, and in response to water stress (Vermunt et al., 2020, 2022). A recent modeling study using a multi-layer Water Cloud Model suggests that backscatter can be dominated by deeper canopy layers depending on the moisture content and its distribution within the canopy. On the one hand, this highlights the value of microwaves to sense deep into the canopy and to respond to changes in response to water stress. On the other hand, it highlights the need to improve our understanding of microwave interactions with vegetation, so that we can make optimal use of observations at different frequencies to study drought response in vegetation. This is essential given the upcoming launches of Sentinel-1 NG, ROSE-L, NiSAR, and the multi-frequency CIMR mission.
Established indicators based on precipitation and VNIR data have been available as analysis-ready data products for many years. Consequently, they are widely used and their strengths and weaknesses have been evaluated in numerous studies. User familiarity with the products, combined with this strong track record facilitates their uptake by NGOs, government bodies and insurance companies. Drought indicators based on microwave satellite data are less “familiar” to users, and their interpretation may be less intuitive for new users. To promote the uptake of microwave-based drought indicators, the onus is on the microwave remote sensing community to provide quality-controlled, analysis-ready drought indicators, and to demonstrate the benefit of including microwave-based drought indicators. Many lessons can be learned from the successful dissemination and use of microwave SM and microwave-based vegetation products (Entekhabi et al., 2010b; Mecklenburg et al., 2016; Brocca et al., 2017; Dorigo et al., 2017; Wigneron et al., 2021). In addition, microwave-based indicators have recently been used in drought risk insurance. Vroege et al. (2021), for example, explored the potential of satellite-retrieved SM to reduce farmers' drought risk exposure. Furthermore, Enenkel et al. (2018) argued that microwave SM can close sensitive knowledge gaps between atmospheric moisture supply and the response of the land surface in the context of operational parametric insurance projects. This underscores the need to view microwave-based drought indicators not as an intended replacement for indicators from VNIR data. Rather, it underscores the potential to exploit the unique perspective provided by multi-sensor microwave-based drought indicators to complement existing, established drought indicators.
Author contributions
MV, IG-P, WP, and SC conceptualized and designed the study. WP organized the database. IG-P, WP, and MV performed the analysis. MV and IG-P wrote the first draft of the manuscript. SS-D, WD, SC, RS, WW, and ME wrote sections of the manuscript. All authors contributed to manuscript revision, read, and approved the submitted version.
Funding
MV was funded through the ESA European Space Agency Living Planet Fellowship, SHRED: Sentinel-1 for high-resolution monitoring of Vegetation Dynamics (4000125441/18/I-NS). MV, WP, SC, ME, and IG-P were funded through the WorldBank assignment SMART-DRI. WW and MV were funded through FFG ASAP project ROSSIHNI (885327). SS-D was supported by the NWO/NSO MINERVA knowledge network. RS and WD acknowledge support from the ESA CCI Programme. SC and WW acknowledge support from the EUMETSAT Satellite Application Facility on Support to Operational Hydrology and Water Management.
Acknowledgments
The authors would like to thank Sebastian Hahn for preparing the H SAF soil moisture data.
Conflict of interest
Author RS was employed by Planet Labs.
The remaining authors declare that the research was conducted in the absence of any commercial or financial relationships that could be construed as a potential conflict of interest.
Publisher's note
All claims expressed in this article are solely those of the authors and do not necessarily represent those of their affiliated organizations, or those of the publisher, the editors and the reviewers. Any product that may be evaluated in this article, or claim that may be made by its manufacturer, is not guaranteed or endorsed by the publisher.
References
Abdel-Hamid, A., Dubovyk, O., Graw, V., and Greve, K. (2020). Assessing the impact of drought stress on grasslands using multi-temporal SAR data of Sentinel-1: a case study in Eastern Cape, South Africa. Eur. J. Rem. Sens. 53, 3–16. doi: 10.1080/22797254.2020.1762514
Afshar, M. H., Al-Yaari, A., and Yilmaz, M. T. (2021). Comparative Evaluation of Microwave L-Band VOD and Optical NDVI for agriculture drought detection over central Europe. Rem. Sens. 13, 1251. doi: 10.3390/rs13071251
AghaKouchak, A., Farahmand, A., Melton, F. S., Teixeira, J., Anderson, M. C., Wardlow, B. D., et al. (2015). Remote sensing of drought: Progress, challenges and opportunities. Rev. Geophys. 53, 452–480. doi: 10.1002/2014RG000456
Albergel, C., Rüdiger, C., Pellarin, T., Calvet, J. C., Fritz, N., Froissard, F., et al. (2008). From near-surface to root-zone soil moisture using an exponential filter: an assessment of the method based on in-situ observations and model simulations. Hydrol. Earth Syst. Sci. Discuss. 12, 1323–1337. doi: 10.5194/hess-12-1323-2008
Andela, N., Liu, Y. Y., van Dijk, A., de Jeu, R. A. M., and McVicar, T. R. (2013). Global changes in dryland vegetation dynamics (1988-2008) assessed by satellite remote sensing: comparing a new passive microwave vegetation density record with reflective greenness data. Biogeosciences. 10, 6657. doi: 10.5194/bg-10-6657-2013
Arun Kumar, K. C., Reddy, G. P. O., Masilamani, P., Turkar, S. Y., and Sandeep, P. (2021). Integrated drought monitoring index: A tool to monitor agricultural drought by using time-series datasets of space-based earth observation satellites. Adv. Space Res. 67, 298–315. doi: 10.1016/j.asr.2020.10.003
Attema, E. P. W., and Ulaby, F. T. (1978). Vegetation modeled as a water cloud. Radio Sci. 13, 357–364. doi: 10.1029/RS013i002p00357
Bai, J., Cui, Q., Chen, D., Yu, H., Mao, X., Meng, L., et al. (2018). Assessment of the SMAP-Derived Soil Water Deficit Index (SWDI-SMAP) as an Agricultural Drought Index in China. Rem. Sens. 10, 1302. doi: 10.3390/rs10081302
Baik, J., Zohaib, M., Kim, U., Aadil, M., and Choi, M. (2019). Agricultural drought assessment based on multiple soil moisture products. J. Arid Environ. 167, 43–55. doi: 10.1016/j.jaridenv.2019.04.007
Bastos, A., Ciais, P., Friedlingstein, P., Sitch, S., Pongratz, J., Fan, L., et al. (2006). Direct and seasonal legacy effects of the 2018 heat wave and drought on European ecosystem productivity. Sci. Adv. 6, eaba2724. doi: 10.1126/sciadv.aba2724
Blyverket, J., Hamer, P. D., Schneider, P., Albergel, C., and Lahoz, W. A. (2019). Monitoring soil moisture drought over northern high latitudes from space. Rem. Sens. 11, 1200. doi: 10.3390/rs11101200
Bouaziz, L. J. E., Steele-Dunne, S. C., Schellekens, J., Weerts, A. H., Stam, J., Sprokkereef, E., et al. (2020). Improved understanding of the link between catchment-scale vegetation accessible storage and satellite-derived soil water index. Water Resour. Res. 56, e2019WR.026365. doi: 10.1029/2019WR026365
Brás, T. A., Seixas, J., Carvalhais, N., and Jägermeyr, J. (2021). Severity of drought and heatwave crop losses tripled over the last five decades in Europe. Environ Res Lett. 16, 065012. doi: 10.1088/1748-9326/abf004
Brocca, L., Crow, W. T., Ciabatta, L., Massari, C., De Rosnay, P., Enenkel, M., et al. (2017). A Review of the Applications of ASCAT Soil Moisture Products. IEEE J. Select. Top. Appl. Earth Observ. Rem. Sens. 10, 2285–2306. doi: 10.1109/JSTARS.2017.2651140
Brocca, L., Melone, F., Moramarco, T., Wagner, W., and Hasenauer, S. (2010). ASCAT soil wetness index validation through in situ and modeled soil moisture data in central Italy. Rem. Sens. Environ. 114, 2745–2755. doi: 10.1016/j.rse.2010.06.009
Buitink, J., Swank, A. M., van der Ploeg, M., Smith, N. E., Benninga, H. J. F., van der Bolt, F., et al. (2020). Anatomy of the 2018 agricultural drought in the Netherlands using in situ soil moisture and satellite vegetation indices. Hydrol. Earth Syst. Sci. 24, 6021–6031. doi: 10.5194/hess-24-6021-2020
Cammalleri, C., Vogt, J. V., Bisselink, B., and de Roo, A. (2017). Comparing soil moisture anomalies from multiple independent sources over different regions across the globe. Hydrol. Earth Syst. Sci. 21, 6329–6343. doi: 10.5194/hess-21-6329-2017
Cao, M., Chen, M., Liu, J., and Liu, Y. (2022). Assessing the performance of satellite soil moisture on agricultural drought monitoring in the North China Plain. Agric. Water Manage. 263. doi: 10.1016/j.agwat.2021.107450
Carrão, H., Russo, S., Sepulcre-Canto, G., and Barbosa, P. (2016). An empirical standardized soil moisture index for agricultural drought assessment from remotely sensed data. Int. J. Appl. Earth Observ. Geoinf. 48, 74–84. doi: 10.1016/j.jag.2015.06.011
Champagne, C., McNairn, H., and Berg, A. A. (2011). Monitoring agricultural soil moisture extremes in Canada using passive microwave remote sensing. Rem. Sens. Environ. 115, 2434–2444. doi: 10.1016/j.rse.2011.04.030
Chatterjee, S., Desai, A. R., Zhu, J., Townsend, P. A., and Huang, J. (2022). Soil moisture as an essential component for delineating and forecasting agricultural rather than meteorological drought. Rem. Sens. Environ. 269, 112833. doi: 10.1016/j.rse.2021.112833
Chaves, M. M., Maroco, J. P., and Pereira, J. S. (2003). Understanding plant responses to drought—from genes to the whole plant. Funct. Plant Biol. 30, 239–264. doi: 10.1071/FP02076
Colliander, A., Jackson, T. J., Bindlish, R., Chan, S., Das, N., Kim, S. B., et al. (2017). Validation of SMAP surface soil moisture products with core validation sites. Rem. Sens. Environ. 191, 215–231. doi: 10.1016/j.rse.2017.01.021
Crocetti, L., Forkel, M., Fischer, M., Jurecka, F., Grlj, A., Salentinig, A., et al. (2020). Earth Observation for agricultural drought monitoring in the Pannonian Basin (southeastern Europe): current state and future directions. Reg. Environ. Chang. 20, 123. doi: 10.1007/s10113-020-01710-w
Dai, A. (2013). Increasing drought under global warming in observations and models. Nat. Clim. Change. 3, 52. doi: 10.1038/nclimate1633
Davenport, I. J., Sandells, M. J., and Gurney, R. J. (2008). The effects of scene heterogeneity on soil moisture retrieval from passive microwave data. Adv. Water Resour. 31, 1494–1502. doi: 10.1016/j.advwatres.2008.06.002
de Jeu, R. A. M., Wagner, W., Holmes, T. R. H., Dolman, A. J., van de Giesen, N. C., Friesen, J., et al. (2008). Global soil moisture patterns observed by space borne microwave radiometers and scatterometers. Surv Geophys. 29, 399–420. doi: 10.1007/s10712-008-9044-0
Dorigo, W., Wagner, W., Albergel, C., Albrecht, F., Balsamo, G., Brocca, L., et al. (2017). ESA CCI Soil Moisture for improved Earth system understanding: State-of-the art and future directions. Rem. Sens. Environ. 203, 185–215. doi: 10.1016/j.rse.2017.07.001
Enenkel, M., Farah, C., Hain, C., White, A., Anderson, M., You, L., et al. (2018). What rainfall does not tell us—enhancing financial instruments with satellite-derived soil moisture and evaporative stress. Rem. Sens. 10, 1819. doi: 10.3390/rs10111819
Enenkel, M., Steiner, C., Mistelbauer, T., Dorigo, W., Wagner, W., See, L., et al. (2016). A combined satellite-derived drought indicator to support humanitarian aid organizations. Rem. Sens. 8, 340. doi: 10.3390/rs8040340
Entekhabi, D., Njoku, E. G., O'Neill, P. E., Kellogg, K. H., Crow, W. T., Edelstein, W. N., et al. (2010a). The soil moisture active passive (SMAP) mission. Proc. IEEE. 98, 704–716. doi: 10.1109/IGARSS.2011.6049669
Entekhabi, D., Reichle, R. H., Koster, R. D., and Crow, W. T. (2010b). Performance metrics for soil moisture retrievals and application requirements. J. Hydrometeorol. 11, 832–840. doi: 10.1175/2010JHM1223.1
Eswar, R., Das, N. N., Poulsen, C., Behrangi, A., Swigart, J., Svoboda, M., et al. (2018). SMAP Soil Moisture Change as an Indicator of Drought Conditions. Rem. Sens. 10, 788. doi: 10.3390/rs10050788
Fang, B., Kansara, P., Dandridge, C., and Lakshmi, V. (2021). Drought monitoring using high spatial resolution soil moisture data over Australia in 2015–2019. J. Hydrol. 594, 125960. doi: 10.1016/j.jhydrol.2021.125960
Ford, T. W., and Quiring, S. M. (2019). Comparison of contemporary in situ, model, and satellite remote sensing soil moisture with a focus on drought monitoring. Water Resour. Res. 55, 1565–1582. doi: 10.1029/2018WR024039
Funk, C., Peterson, P., Landsfeld, M., Pedreros, D., Verdin, J., Shukla, S., et al. (2015). The Clim. hazards infrared precipitation with stations—a new environmental record for monitoring extremes. Sci. Data. 2, 150066. doi: 10.1038/sdata.2015.66
Ghazaryan, G., Dubovyk, O., Graw, V., Kussul, N., and Schellberg, J. (2020). Local-scale agricultural drought monitoring with satellite-based multi-sensor time-series. GISci. Rem. Sens. 57, 704–718. doi: 10.1080/15481603.2020.1778332
Gruber, A., Scanlon, T., van der Schalie, R., Wagner, W., and Dorigo, W. (2019). Evolution of the ESA CCI Soil Moisture Clim. data records and their underlying merging methodology. Earth Syst. Sci. Data. 11, 717–739. doi: 10.5194/essd-11-717-2019
Hao, C., Zhang, J., and Yao, F. (2015). Combination of multi-sensor remote sensing data for drought monitoring over Southwest China. Int. J. Appl. Earth Observ. Geoinf. 35, 270–283. doi: 10.1016/j.jag.2014.09.011
Hoegh-Guldberg, O., Jacob, D., Taylor, M., Bindi, M., Brown, S., Camilloni, I., et al. (2018). “Impacts of 1.5 C global warming on natural and human systems,” in Global warming of 15° C: An IPCC Special Report. Geneva, Switzerland: IPCC Secretariat, 175–311.
Jackson, T. J., and Schmugge, T. J. (1991). Vegetation effects on the microwave emission of soils. Rem. Sens. Environ. 36, 203–212. doi: 10.1016/0034-4257(91)90057-D
Jiao, T., Williams, C. A., Rogan, J., De Kauwe, M. G., and Medlyn, B. E. (2020). Drought impacts on australian vegetation during the millennium drought measured with multisource spaceborne remote sensing. J. Geophys. Res. Biogeosci. 125, e2019JG.005145. doi: 10.1029/2019JG005145
Jiao, W., Wang, L., and McCabe, M. F. (2021). Multi-sensor remote sensing for drought characterization: current status, opportunities and a roadmap for the future. Rem. Sens. Environ. 256, 112313. doi: 10.1016/j.rse.2021.112313
Kerr, Y. H., Waldteufel, P., Richaume, P., Wigneron, J. P., Ferrazzoli, P., Mahmoodi, A., et al. (2012). The SMOS soil moisture retrieval algorithm. IEEE Transac. Geosci. Rem. Sens. 50, 1384–1403. doi: 10.1109/TGRS.2012.2184548
Khabbazan, S., Vermunt, P., Steele-Dunne, S., Ratering Arntz, L., Marinetti, C., van der Valk, D., et al. (2019). Crop monitoring using Sentinel-1 data: a case study from The Netherlands. Rem. Sens. 11, 1887. doi: 10.3390/rs11161887
Kolassa, J., Reichle, R. H., Liu, Q., Alemohammad, S. H., Gentine, P., Aida, K., et al. (2018). Estimating surface soil moisture from SMAP observations using a Neural Network technique. Rem. Sens. Environ. 204, 43–59. doi: 10.1016/j.rse.2017.10.045
Konings, A. G., Rao, K., and Steele-Dunne, S. C. (2019). Macro to micro: microwave remote sensing of plant water content for physiology and ecology. New Phytol. 223, 1166–1172. doi: 10.1111/nph.15808
Konings, A. G., Saatchi, S. S., Frankenberg, C., Keller, M., Leshyk, V., Anderegg, W. R., et al. (2021). Detecting forest response to droughts with global observations of vegetation water content. Global Change Biol. 27, 6005–6024. doi: 10.1111/gcb.15872
Li, Z. L., Leng, P., Zhou, C., Chen, K. S., Zhou, F. C., Shang, G. F., et al. (2021). Soil moisture retrieval from remote sensing measurements: current knowledge and directions for the future. Earth-Sci. Rev. 218, 103673. doi: 10.1016/j.earscirev.2021.103673
Likith, M., Harod, R., and Eswar, R. (2022). Exploring the use of satellite observations of soil moisture, solar-induced chlorophyll fluorescence and vegetation optical depth to monitor droughts across India. J Earth Syst Sci. 131, 94. doi: 10.1007/s12040-022-01848-7
Liu, Y., Liu, Y., and Wang, W. (2019). Inter-comparison of satellite-retrieved and Global Land Data Assimilation System-simulated soil moisture datasets for global drought analysis. Rem. Sens. Environ. 220, 1–18. doi: 10.1016/j.rse.2018.10.026
Liu, Y., Liu, Y., Wang, W., Fan, X., and Cui, W. (2022). Soil moisture droughts in East Africa: Spatiotemporal patterns and Clim. drivers. J. Hydrol. Reg. Stud. 40, 101013. doi: 10.1016/j.ejrh.2022.101013
Liu, Y. Y., de Jeu, R. A., McCabe, M. F., Evans, J. P., and van Dijk, A. I. (2011). Global long-term passive microwave satellite-based retrievals of vegetation optical depth. Geophys. Res. Lett. 38 doi: 10.1029/2011GL048684
Liu, Y. Y., van Dijk, A. I. J. M., Miralles, D. G., McCabe, M. F., Evans, J. P., de Jeu, R. A. M, et al. (2018). Enhanced canopy growth precedes senescence in 2005 and 2010 Amazonian droughts. Rem. Sens. Environ. 211, 26–37. doi: 10.1016/j.rse.2018.03.035
Magagi, R. D., and Kerr, Y. H. (1997). Retrieval of soil moisture and vegetation characteristics by use of ERS-1 wind scatterometer over arid and semi-arid areas. J. Hydrol. 188, 361–384. doi: 10.1016/S0022-1694(96)03166-6
Martínez-Fernández, J., González-Zamora, A., Sánchez, N., Gumuzzio, A., and Herrero-Jiménez, C. M. (2016). Satellite soil moisture for agricultural drought monitoring: assessment of the SMOS derived soil water deficit index. Rem. Sens. Environ. 177, 277–286. doi: 10.1016/j.rse.2016.02.064
Martínez-Fernández, J., Sánchez, N., and González-Zamora, Á. (2017). “Agricultural drought monitoring using satellite soil moisture and other remote sensing data over the Iberian Peninsula,” in Remote Sensing of Hydrometeorological Hazards. Boca Raton, FL: CRC Press.
Massari, C., Modanesi, S., Dari, J., Gruber, A., De Lannoy, G. J. M., Girotto, M., et al. (2021). A review of irrigation information retrievals from space and their utility for users. Rem. Sens. 13. Available from: https://www.scopus.com/inward/record.uri?eid=2-s2.0-85110745042anddoi=10.3390%2frs13204112andpartnerID=40andmd5=5358861c43217539cd6c0cc2460c1cba
Mecklenburg, S., Drusch, M., Kaleschke, L., Rodriguez-Fernandez, N., Reul, N., Kerr, Y., et al. (2016). ESA's soil moisture and ocean salinity mission: from science to operational applications. Rem. Sens. Environ. 180, 3–18. doi: 10.1016/j.rse.2015.12.025
Meesters, A. G., De Jeu, R. A., and Owe, M. (2005). Analytical derivation of the vegetation optical depth from the microwave polarization difference index. IEEE Geosci. Rem. Sens. Lett. 2, 121–123. doi: 10.1109/LGRS.2005.843983
Mercedes-Salvia, M. M., Sánchez, N., Piles, M., Ruscica, R. C., González-Zamora, Á., Roitberg, E., et al. (2021). The added-value of remotely-sensed soil moisture data for agricultural drought detection in Argentina. IEEE J. Select. Top. Appl. Earth Observ. Rem. Sens. 14, 6487–6500. doi: 10.1109/JSTARS.2021.3084849
Mialon, A., Coret, L., Kerr, Y. H., Secherre, F., and Wigneron, J. P. (2008). Flagging the Topographic Impact on the SMOS Signal. IEEE Transac. Geosci. Rem. Sens. 46, 689–694. doi: 10.1109/TGRS.2007.914788
Mishra, A., Vu, T., Veettil, A. V., and Entekhabi, D. (2017). Drought monitoring with soil moisture active passive (SMAP) measurements. J. Hydrol. 552, 620–632. doi: 10.1016/j.jhydrol.2017.07.033
Modanesi, S., Massari, C., Camici, S., Brocca, L., and Amarnath, G. (2020). Do satellite surface soil moisture observations better retain information about crop-yield variability in drought conditions? Water Resour. Res. 56, e2019WR.025855. doi: 10.1029/2019WR025855
Moesinger, L., Dorigo, W., de Jeu, R., van der Schalie, R., Scanlon, T., Teubner, I., et al. (2020). The global long-term microwave Vegetation Optical Depth Clim. Archive (VODCA). Earth Syst. Sci. Data. 12, 177–177. doi: 10.5194/essd-12-177-2020
Morrison, K., and Wagner, W. (2020). Explaining anomalies in SAR and scatterometer soil moisture retrievals from dry soils with subsurface scattering. IEEE Transac. Geosci. Rem. Sens. 58, 2190–2197. doi: 10.1109/TGRS.2019.2954771
Myeni, L., Moeletsi, M. E., and Clulow, A. D. (2019). Present status of soil moisture estimation over the African continent. J. Hydrol. Reg. Stud. 21, 14–24. doi: 10.1016/j.ejrh.2018.11.004
Naeimi, V., Scipal, K., Bartalis, Z., Hasenauer, S., and Wagner, W. (2009). An improved soil moisture retrieval algorithm for ERS and METOP scatterometer observations. IEEE Transac. Geosci. Rem. Sens. 47, 1999–2013. doi: 10.1109/TGRS.2008.2011617
Navacchi, C., Cao, S., Bauer-Marschallinger, B., Snoeij, P., Small, D., Wagner, W., et al. (2022). Utilising Sentinel-1's orbital stability for efficient pre-processing of sigma nought backscatter. ISPRS J. Photogramm. Rem. Sens. 192, 130–141. doi: 10.1016/j.isprsjprs.2022.07.023
Niaz, M. A., Faiz, M. A., and Yongxia, W. (2021). Development of an integrated weighted drought index and its application for agricultural drought monitoring. Arab. J. Geosci. 14 doi: 10.1007/s12517-021-06879-w
Nicolai-Shaw, N., Zscheischler, J., Hirschi, M., Gudmundsson, L., and Seneviratne, S. I. A. (2017). drought event composite analysis using satellite remote-sensing based soil moisture. Rem. Sens. Environ. 203, 216–225. doi: 10.1016/j.rse.2017.06.014
O'Neill, P. E., Njoku, E. G., Jackson, T. J., Chan, S., and Bindlish, R. (2015). SMAP Algorithm Theoretical Basis Document: Level 2 and 3 Soil Moisture (Passive) Data Products. Pasadena, CA, USA: Jet Propulsion Lab, California Inst Technol, JPL D-66480.
Owe, M., de Jeu, R., and Holmes, T. (2008). Multisensor historical climatology of satellite-derived global land surface moisture. J. Geophys. Res. Earth Surf. 113. doi: 10.1029/2007JF000769
Owe, M., de Jeu, R., and Walker, J. A. (2001). methodology for surface soil moisture and vegetation optical depth retrieval using the microwave polarization difference index. IEEE Transac. Geosci. Rem. Sens. 39, 1643–1654. doi: 10.1109/36.942542
Pablos, M., Martínez-Fernández, J., Sánchez, N., and González-Zamora, Á. (2017). Temporal and spatial comparison of agricultural drought indices from moderate resolution satellite soil moisture data over Northwest Spain. Rem. Sens. 9, 1168. doi: 10.3390/rs9111168
Padhee, S. K., Nikam, B. R., Dutta, S., and Aggarwal, S. P. (2017). Using satellite-based soil moisture to detect and monitor spatiotemporal traces of agricultural drought over Bundelkhand region of India. GISci. Rem. Sens. 54, 144–166. doi: 10.1080/15481603.2017.1286725
Paloscia, S., Macelloni, G., and Pampaloni, P. (1998). “The relations between backscattering coefficient and biomass of narrow and wide leaf crops, in Geoscience and Remote Sensing Symposium Proceedings, 1998 IGARSS '98 1998 IEEE International, vol. 1, 100–102.
Paredes-Trejo, F., and Barbosa, H. (2017). Evaluation of the SMOS-derived soil water deficit index as agricultural drought index in Northeast of Brazil. Water. 9, 377. doi: 10.3390/w9060377
Paredes-Trejo, F., Barbosa, H. A., Giovannettone, J., Lakshmi Kumar, T. V., Thakur, M. K., Buriti, C. O., et al. (2021). Drought assessment in the são francisco river basin using satellite-based and ground-based indices. Rem. Sens. 13 doi: 10.3390/rs13193921
Paulik, C., Dorigo, W., Wagner, W., and Kidd, R. (2014). Validation of the ASCAT soil water index using in situ data from the international soil moisture network. Int. J. Appl. Earth Observ. Geoinf. 30, 1–8. doi: 10.1016/j.jag.2014.01.007
Petchiappan, A., Steele-Dunne, S. C., Vreugdenhil, M., Hahn, S., Wagner, W., Oliveira, R., et al. (2022). The influence of vegetation water dynamics on the ASCAT backscatter–incidence angle relationship in the Amazon. Hydrol. Earth Syst. Sci. 26, 2997–3019. doi: 10.5194/hess-26-2997-2022
Petropoulos, G. P., Ireland, G., and Barrett, B. (2015). Surface soil moisture retrievals from remote sensing: Current status, products and future trends. Phys. Chem. Earth, Parts A/B/C. 83–84, 36–56. doi: 10.1016/j.pce.2015.02.009
Prigent, C., and Jimenez, C. (2021). An evaluation of the synergy of satellite passive microwave observations between 1.4 and 36 GHz, for vegetation characterization over the Tropics. Rem. Sens. Environ. 257, 112346. doi: 10.1016/j.rse.2021.112346
Rao, K., Anderegg, W. R. L., Sala, A., Martínez-Vilalta, J., and Konings, A. G. (2019). Satellite-based vegetation optical depth as an indicator of drought-driven tree mortality. Rem. Sens. Environ. 227, 125–136. doi: 10.1016/j.rse.2019.03.026
Saatchi, S., Asefi-Najafabady, S., Malhi, Y., Aragão, L. E. O. C., Anderson, L. O., Myneni, R. B., et al. (2013). Persistent effects of a severe drought on Amazonian forest canopy. PNAS. 110, 565–570. doi: 10.1073/pnas.1204651110
Sadri, S., Wood, E. F., and Pan, M. (2018). Developing a drought-monitoring index for the contiguous US using SMAP. Hydrol. Earth Syst. Sci. 22, 6611–6626. doi: 10.5194/hess-22-6611-2018
Sánchez, N., González-Zamora, Á., Martínez-Fernández, J., Piles, M., and Pablos, M. (2018). Integrated remote sensing approach to global agricultural drought monitoring. Agric. For. Meteorol. 259, 141–153. doi: 10.1016/j.agrformet.2018.04.022
Sánchez, N., González-Zamora, Á., Piles, M., and Martínez-Fernández, J. A. (2016). New Soil Moisture Agricultural Drought Index (SMADI) Integrating MODIS and SMOS products: a case of study over the Iberian Peninsula. Rem. Sens. 8, 287. doi: 10.3390/rs8040287
Sawada, Y., Koike, T., Ikoma, E., and Kitsuregawa, M. (2020). Monitoring and predicting agricultural droughts for a water-limited subcontinental region by integrating a land surface model and microwave remote sensing. IEEE Transac. Geosci. Rem. Sens. 58, 14–33. doi: 10.1109/TGRS.2019.2927342
Scaini, A., Sánchez, N., Vicente-Serrano, S. M., and Martínez-Fernández, J. (2015). SMOS-derived soil moisture anomalies and drought indices: a comparative analysis using in situ measurements. Hydrol. Process. 29, 373–383. doi: 10.1002/hyp.10150
Schroeder, R., McDonald, K. C., Azarderakhsh, M., and Zimmermann, R. (2016). ASCAT MetOp-A diurnal backscatter observations of recent vegetation drought patterns over the contiguous US: An assessment of spatial extent and relationship with precipitation and crop yield. Rem. Sens. Environ. 177, 153–159. doi: 10.1016/j.rse.2016.01.008
Schumacher, D. L., Keune, J., van Heerwaarden, C. C., Vilà-Guerau de Arellano, J., Teuling, A. J., and Miralles, D. G. (2019). Amplification of mega-heatwaves through heat torrents fuelled by upwind drought. Nat. Geosci. 12, 712–717. doi: 10.1038/s41561-019-0431-6
Senf, C., Buras, A., Zang, C. S., Rammig, A., and Seidl, R. (2020). Excess forest mortality is consistently linked to drought across Europe. Nat. Commun. 11, 6200. doi: 10.1038/s41467-020-19924-1
Shorachi, M., Kumar, V., and Steele-Dunne, S. C. (2022). Sentinel-1 SAR backscatter response to agricultural drought in the Netherlands. Rem. Sens. 14, 2435. doi: 10.3390/rs14102435
Small, D. (2011). Flattening gamma: Radiometric terrain correction for SAR imagery. IEEE Transac. Geosci. Rem. Sens. 49, 3081–3093. doi: 10.1109/TGRS.2011.2120616
Souza, A. G. S. S., Ribeiro Neto, A., and de Souza, L. L. (2021). Soil moisture-based index for agricultural drought assessment: SMADI application in Pernambuco State-Brazil. Rem. Sens. Environ. 252, 112124. doi: 10.1016/j.rse.2020.112124
Steele-Dunne, S. C., Friesen, J., and van de Giesen, N. (2012). Using diurnal variation in backscatter to detect vegetation water stress. IEEE Transac. Geosci. Rem. Sens. 50, 2618–2629. doi: 10.1109/TGRS.2012.2194156
Steele-Dunne, S. C., Hahn, S., Wagner, W., and Vreugdenhil, M. (2019). Investigating vegetation water dynamics and drought using Metop ASCAT over the North American Grasslands. Remo. Sens. Environ. 224, 219–235. doi: 10.1016/j.rse.2019.01.004
Steele-Dunne, S. C., McNairn, H., Monsivais-Huertero, A., Judge, J., Liu, P. W., Papathanassiou, K., et al. (2017). Radar remote sensing of agricultural canopies: A review. IEEE J. Select. Top. Appl. Earth Observ. Rem. Sens. 10, 2249–2273. doi: 10.1109/JSTARS.2016.2639043
Tian, F., Brandt, M., Liu, Y. Y., Verger, A., Tagesson, T., Diouf, A. A., et al. (2016). Remote sensing of vegetation dynamics in drylands: Evaluating vegetation optical depth (VOD) using AVHRR NDVI and in situ green biomass data over West African Sahel. Rem. Sens. Environ. 177, 265–276. doi: 10.1016/j.rse.2016.02.056
Toan, T. L., Beaudoin, A., Riom, J., and Guyon, D. (1992). Relating forest biomass to SAR data. IEEE Transac. Geosci. Rem. Sens. 30, 403–411. doi: 10.1109/36.134089
Trenberth, K. E. (2014). Challenges for Observing and Modeling the Global Water Cycle. In: Remote Sensing of the Terrestrial Water Cycle. New York, NY: John Wiley and Sons, Inc. 511–9. doi: 10.1002/9781118872086.ch32
Ulaby, F. T., and El-Rayes, M. (1986). Microwave dielectric spectrum of vegetation material. In: International geoscience and remote sensing symposium, 1103–6. Available from: http://cat.inist.fr/?aModele=afficheNandcpsidt=8332178 (accessed on September 14, 2016).
Ulaby, F. T., Moore, R. K., and Fung, A. K. (1982). Microwave Remote Sensing Active and Passive-Volume II: Radar Remote Sensing and Surface Scattering and Enission Theory. Available from: http://infoscience.epfl.ch/record/51982 (accessed on September 15, 2016).
Ulaby, F. T., Moore, R. K., and Fung, A. K. (1986). Microwave Remote Sensing Active and Passive-Volume III: From Theory to Applications. Available from: http://infoscience.epfl.ch/record/51983 (accessed on September 15, 2016).
Urban, M., Berger, C., Mudau, T. E., Heckel, K., Truckenbrodt, J., Onyango Odipo, V., et al. (2018). Surface moisture and vegetation cover analysis for drought monitoring in the Southern Kruger National Park Using Sentinel-1, Sentinel-2, and Landsat-8. Rem. Sens. 10, 1482. doi: 10.3390/rs10091482
Van der Schalie, R., de Jeu, R. A., Kerr, Y. H., Wigneron, J. P., Rodríguez-Fernández, N. J., Al-Yaari, A., et al. (2017). The merging of radiative transfer based surface soil moisture data from SMOS and AMSR-E. Rem. Sens. Environ. 189, 180–193. doi: 10.1016/j.rse.2016.11.026
van Dijk, A. I. J. M., Beck, H. E., Crosbie, R. S., de Jeu, R. A. M., Liu, Y. Y., Podger, G. M., et al. (2013). The Millennium Drought in southeast Australia (2001–2009): Natural and human causes and implications for water resources, ecosystems, economy, and society. Water Resour Res. 49, 1040–1057. doi: 10.1002/wrcr.20123
van Hateren, T. C., Chini, M., Matgen, P., and Teuling, A. J. (2021). Ambiguous agricultural drought: Characterising soil moisture and vegetation droughts in europe from earth observation. Rem. Sens. 13, 1990. doi: 10.3390/rs13101990
Velpuri, N. M., Senay, G. B., and Morisette, J. T. (2016). Evaluating new SMAP soil moisture for drought monitoring in the rangelands of the US high plains. Rangelands. 38, 183–190. doi: 10.1016/j.rala.2016.06.002
Verhoest, N. E. C., Lievens, H., Wagner, W., Álvarez-Mozos, J., Moran, M. S., Mattia, F., et al. (2008). On the soil roughness parameterization problem in soil moisture retrieval of bare surfaces from synthetic aperture radar. Sensors. 8, 4213–4248. doi: 10.3390/s8074213
Vermunt, P. C., Khabbazan, S., Steele-Dunne, S. C., Judge, J., Monsivais-Huertero, A., Guerriero, L., et al. (2020). Response of subdaily L-Band backscatter to internal and surface canopy water dynamics. IEEE Transac. Geosci. Rem. Sens. 59, 7322–7337.
Vermunt, P. C., Steele-Dunne, S. C., Khabbazan, S., Judge, J., and van de Giesen, N. C. (2022). Extrapolating continuous vegetation water content to understand sub-daily backscatter variations. Hydrol. Earth Syst. Sci. 26, 1223–1241. doi: 10.5194/hess-26-1223-2022
Vreugdenhil, M., Hahn, S., Melzer, T., Bauer-Marschallinger, B., Reimer, C., Dorigo, W. A., et al. (2017). Assessing vegetation dynamics over mainland Australia with metop ASCAT. IEEE J. Select. Top. Appl. Earth Observ. Rem. Sens. 10, 2240–2248. doi: 10.1109/JSTARS.2016.2618838
Vroege, W., Bucheli, J., Dalhaus, T., Hirschi, M., and Finger, R. (2021). Insuring crops from space: the potential of satellite-retrieved soil moisture to reduce farmers' drought risk exposure. Eur. Rev. Agric. Econ. 48, 266–314. doi: 10.1093/erae/jbab010
Wagner, W., Hahn, S., Kidd, R., Melzer, T., Bartalis, Z., Hasenauer, S., et al. (2013). The ASCAT soil moisture product: a review of its specifications, validation results, and emerging applications. Meteorologische Zeitschrift. 22, 5–33. doi: 10.1127/0941-2948/2013/0399
Wagner, W., Lemoine, G., Borgeaud, M., and Rott, H. (1999b). A study of vegetation cover effects on ERS scatterometer data. IEEE Transac. Geosci. Rem. Sens. 37, 938–948. doi: 10.1109/36.752212
Wagner, W., Lemoine, G., and Rott, H. A. (1999a). Method for estimating soil moisture from ERS scatterometer and soil data. Rem. Sens. Environ. 70, 191–207. doi: 10.1016/S0034-4257(99)00036-X
Wagner, W., Lindorfer, R., Melzer, T., Hahn, S., Bauer-Marschallinger, B., Morrison, K., et al. (2022). Widespread occurrence of anomalous C-band backscatter signals in arid environments caused by subsurface scattering. Rem. Sens. Environ. 276, 113025. doi: 10.1016/j.rse.2022.113025
West, H., Quinn, N., and Horswell, M. (2019). Remote sensing for drought monitoring and impact assessment: Progress, past challenges and future opportunities. Rem. Sens. Environ. 232, 111291. doi: 10.1016/j.rse.2019.111291
Wigneron, J. P., Li, X., Frappart, F., Fan, L., Al-Yaari, A., De Lannoy, G., et al. (2021). SMOS-IC data record of soil moisture and L-VOD: Historical development, applications and perspectives. Rem. Sens. Environ. 254, 112238. doi: 10.1016/j.rse.2020.112238
Wu, D., Li, Z., Zhu, Y., Li, X., Wu, Y., Fang, S., et al. (2021). A new agricultural drought index for monitoring the water stress of winter wheat. Agric. Water Manage. 2021, 244. doi: 10.1016/j.agwat.2020.106599
Wu, Z., Qiu, J., Crow, W. T., Wang, D., Wang, Z., Zhang, X., et al. (2022). Investigating the efficacy of the SMAP downscaled soil moisture product for drought monitoring based on information theory. IEEE J. Select. Top. Appl. Earth Observ. Rem. Sens. 15, 1604–1616. doi: 10.1109/JSTARS.2021.3136565
Xu, Y., Wang, L., Ross, K. W., Liu, C., and Berry, K. (2018). Standardized soil moisture index for drought monitoring based on soil moisture active passive observations and 36 years of north american land data assimilation system data: a case study in the Southeast United States. Rem. Sens. 10, 301. doi: 10.3390/rs10020301
Zhang, A., and Jia, G. (2013). Monitoring meteorological drought in semiarid regions using multi-sensor microwave remote sensing data. Rem. Sens. Environ. 134, 12–23. doi: 10.1016/j.rse.2013.02.023
Zhang, G., Su, X., Ayantobo, O. O., and Feng, K. (2021). Drought monitoring and evaluation using ESA CCI and GLDAS-Noah soil moisture datasets across China. Theor Appl Climatol. 144, 1407–1418. doi: 10.1007/s00704-021-03609-w
Zhang, J., Mu, Q., and Huang, J. (2016). Assessing the remotely sensed drought severity index for agricultural drought monitoring and impact analysis in North China. Ecol. Indicat. 63, 296–309. doi: 10.1016/j.ecolind.2015.11.062
Zhang, L., Jiao, W., Zhang, H., Huang, C., and Tong, Q. (2017). Studying drought phenomena in the Continental United States in 2011 and 2012 using various drought indices. Rem. Sens. Environ. 190, 96–106. doi: 10.1016/j.rse.2016.12.010
Zhou, K., Li, J., Zhang, T., and Kang, A. (2021). The use of combined soil moisture data to characterize agricultural drought conditions and the relationship among different drought types in China. Agric. Water Manage. 243, 106479. doi: 10.1016/j.agwat.2020.106479
Zhu, Q., Luo, Y., Xu, Y. P., Tian, Y., and Yang, T. (2019). Satellite soil moisture for agricultural drought monitoring: assessment of SMAP-derived soil water deficit index in Xiang River Basin, China. Rem. Sens. 11, 362. doi: 10.3390/rs11030362
Keywords: drought, microwave remote sensing, agriculture, soil moisture, vegetation
Citation: Vreugdenhil M, Greimeister-Pfeil I, Preimesberger W, Camici S, Dorigo W, Enenkel M, van der Schalie R, Steele-Dunne S and Wagner W (2022) Microwave remote sensing for agricultural drought monitoring: Recent developments and challenges. Front. Water 4:1045451. doi: 10.3389/frwa.2022.1045451
Received: 15 September 2022; Accepted: 10 November 2022;
Published: 30 November 2022.
Edited by:
Harrie-Jan Hendricks Franssen, Helmholtz Association of German Research Centres (HZ), GermanyReviewed by:
Gonzalo Martinez, University of Cordoba, SpainAmen Al-Yaari, Université Paris-Sorbonne, France
Copyright © 2022 Vreugdenhil, Greimeister-Pfeil, Preimesberger, Camici, Dorigo, Enenkel, van der Schalie, Steele-Dunne and Wagner. This is an open-access article distributed under the terms of the Creative Commons Attribution License (CC BY). The use, distribution or reproduction in other forums is permitted, provided the original author(s) and the copyright owner(s) are credited and that the original publication in this journal is cited, in accordance with accepted academic practice. No use, distribution or reproduction is permitted which does not comply with these terms.
*Correspondence: Mariette Vreugdenhil, bWFyaWV0dGUudnJldWdkZW5oaWxAZ2VvLnR1d2llbi5hYy5hdA==
†These authors have contributed equally to this work and share first authorship