 Heindriken Dahlmann
 Ruth Stephan
 Kerstin Stahl
- Faculty of Environment and Natural Resources, University of Freiburg, Freiburg, Germany
The European Alps, despite being Europe's water towers, are increasingly affected by droughts. In recent decades, when climate warming has intensified, drought impacts have illustrated the regions' vulnerability. Improved knowledge on the spatial distribution of drought impacts from high elevation headwater regions down to plateau and foothill areas is of tremendous importance to understand socio-economic drought dimensions. The region has an exceptional data availability including archived drought impact information. It is therefore a good test bed for the often-assumed general hypothesis that drought impacts occur more often downstream. The aim of this study was to investigate whether upstream-downstream differences in the distribution of drought impacts exist in the four major river basins of the European Alps - Rhine, Rhone, Po and Danube. Two different classifications were developed to divide these basins in up- and downstream areas. We based the first classification on the distances to the main sink, and the second classification on human influence. The EDIIALPS database provided qualitative data to analyze the distribution patterns of reported drought impacts from 2000 to 2020. The results suggest a strong regional variability regarding the temporal and spatial distribution of drought impacts within the individual basins. But they support the general hypothesis: for both classifications the number of drought impacts per area is higher in downstream regions. For the classification based on distances differences are statistically significant for the Rhine and Danube basin. Further, the analysis of the drought indices SPI-6 and SPEI-6 revealed that the drought event does not have a large impact on the upstream-downstream differences. The study provides support for the existence of upstream-downstream asymmetries, but most importantly, the spatial distributions of drought impacts found in the four major river basins of the European Alps highlight the need for a network based analysis with more consistent impact data within river basins. Climate change and enhanced cascading effects likely increase these asymmetries and consequently future drought management strategies should take them into account.
Introduction
Droughts are natural hazards and among the most damaging events in terms of affected people (Wilhite, 2000; Wilhite et al., 2007). In contrast to floods or storms, droughts develop slower, last longer and have a wider range of impacts. While regional analyses often focus on meteorological or hydrological drought, information about impacts can elucidate the socio-economic drought. The analysis and quantification of drought damages has received more attention with the creation of impact datasets, but however mostly focusing on country scale and often with limited regional comparisons (Bachmair et al., 2015; Erfurt et al., 2020; Torelló-Sentelles and Franzke, 2022).
Mountain regions are often wetter climatic regions compared to their surrounding lowlands and less populated. Therefore, regarding drought the European Alps for example have received less attention in the past compared to other regions in Europe. However, this mountain region with its water tower function has increasingly been affected by drought with substantial consequences for the environment and society (Gobiet et al., 2014; Haslinger et al., 2015). Alpine water resources feed four of the largest river basins in Europe – Rhine, Rhone, Po and Danube – and thus provide vital ecosystem services and play an essential role in water storage and supply for the European continent (Viviroli and Weingartner, 2004; European Environment Agency, 2009). For the residents of the highly populated region, Alpine water resources present a crucial pillar for local economies, ranging from agriculture over tourism to hydropower production (Gobiet et al., 2014; Cammalleri et al., 2020). The drought events of 2003, 2010, 2015, and 2018 highlighted the vulnerability of the Alpine region to droughts and affected more than 17% of the European population (Mastrotheodoros et al., 2020). Hereby, the drought in 2003 is considered to be the deadliest natural disaster in Europe in the last 50 years with a death toll exceeding 30,000 (UNEP, 2004).
The complex nature of drought impacts poses many challenges for drought research and management. Droughts are accompanied by a set of diffuse, often indirect and cascading impacts (Logar and van den Bergh, 2013) ranging from crop failures over shipping interruptions to shortages in drinking water supply systems (Cammalleri et al., 2020). Drought impacts are characterized by their slow accumulation and their persistence even when the drought event is over (Wilhite, 2000). Furthermore, they can spread over large geographic areas and occur delayed to the drought event as well as in cascading patterns (Wilhite and Vanyarkho, 2000).
Since drought frequencies and their accompanying impacts are expected to further increase in the European Alps until the end of the 21st century (Haslinger et al., 2015), research on the spatial distribution of drought impacts is of tremendous importance. A growing number of studies investigated drought impacts in the Alpine region, whereby studies often focus on one specific impact, drought event or basin (Musolino et al., 2018; Gregoric et al., 2019; Cammalleri et al., 2020). A very comprehensive overview of the distribution of drought impacts in the Alpine region is given by Stephan et al. (2021a). The authors analyzed the distribution of drought impacts in the Alpine region on a spatial, temporal and seasonal scale and revealed a wide range of impacted sectors as well as tempo-spatial differences across domains and countries: Most importantly, a “high altitude” region defined by Stephan et al. (2021a) showed a larger percentage of impact types that is related to hydrological drought (e.g., on public water supply) than in the pre-Alpine region, which reported a majority of impacts that is related to soil moisture drought (e.g., agriculture). Also, in the past, the impacts in the high-elevation region have occurred later in the summer/fall than those in the pre-Alpine region. Further, a recent study by Mastrotheodoros et al. (2020) investigated the potential impacts of water cycle changes on the availability of green water in the Alpine region. The authors found that evapotranspiration may increase in high elevations in large parts of the Alps, thus amplifying a runoff deficit.
Whereas these studies suggest that upstream-downstream patterns are highly relevant, particularly where rivers are transboundary, most drought impact information is collected, geocoded, and therefore analyzed at the political-administrative level, for example at the country or regional level. Databases such as the European Drought Impact Report Inventory (EDII) provide the option of linking an impact report to a water source such as a river or lake, but this information is often not available and the geographical link therefore rarely used (Stahl et al., 2016). Any analysis targeting different spatial scales or units such as river basins have to rely on spatial intersection of hydrological and political spatial units. This may be one of the reasons that in drought impact research, upstream-downstream relations and differences have not been extensively investigated and discussed although several studies highlighted the importance of the connection between up- and downstream regions, stating that upstream areas have a significant and supportive role for the water availability of adjacent downstream regions by providing disproportionally high runoff (Beniston, 2012). Hereby two levels of spatial connection might be considered: (i) Impacts related to physically linked water sources such as the river flow in the drainage network; an analysis of these would require certainty that an impact is linked to the water supply from that river network or (ii) impacts related to the generally different water-richness situation in upstream and downstream reaches; an analysis here might assume that some of the impacts relate to the “same water,” but differences might also be due to general water tower-lowland water balance differences. Only (ii) is feasible to analyze with the currently available data. Therefore, this study aims to launch this novel research aspect of upstream-downstream drought impacts by testing the common hypothesis that drought impacts are different and more frequent in downstream areas of major continental river basins. Approaching the outlined research gaps, more specifically this study addresses the following research questions:
1. How do drought impacts differ in the four river basins?
2. What spatial differences result from different approaches to classify up- and downstream areas?
3. How do drought impacts differ in the up- and downstream regions of the four basins?
4. Does the severity of the physical drought event influence differences in up- and downstream areas' drought impacts?
Materials and methods
Study area
This study focuses on the European Alps with the main Alpine crest and their foothills in order to include parts of the downstream areas. Specifically, we used the so-called “Alpine Space” region (see Figure 1), defined within the framework of the EU-“Interreg - Alpine Space Programme” (Interreg Alpine Space Programme., 2021). The Alpine Space includes area shares of the countries Germany, France, Switzerland, Italy, Liechtenstein, Austria and Slovenia. The study area is characterized by a large topographic variability, including vast lowlands, valleys and peaks up to 4,800 m high (Gobiet et al., 2014). This relief also comes with high spatio-temporal variability of climate. Climate variables, especially temperature and precipitation, experience rapid and systematic changes over short distances in the region (Vanham, 2012). However, the European Alps are a very water-rich region in general with precipitation totals from 400 to even beyond 3,000 mm/year (Isotta et al., 2014).
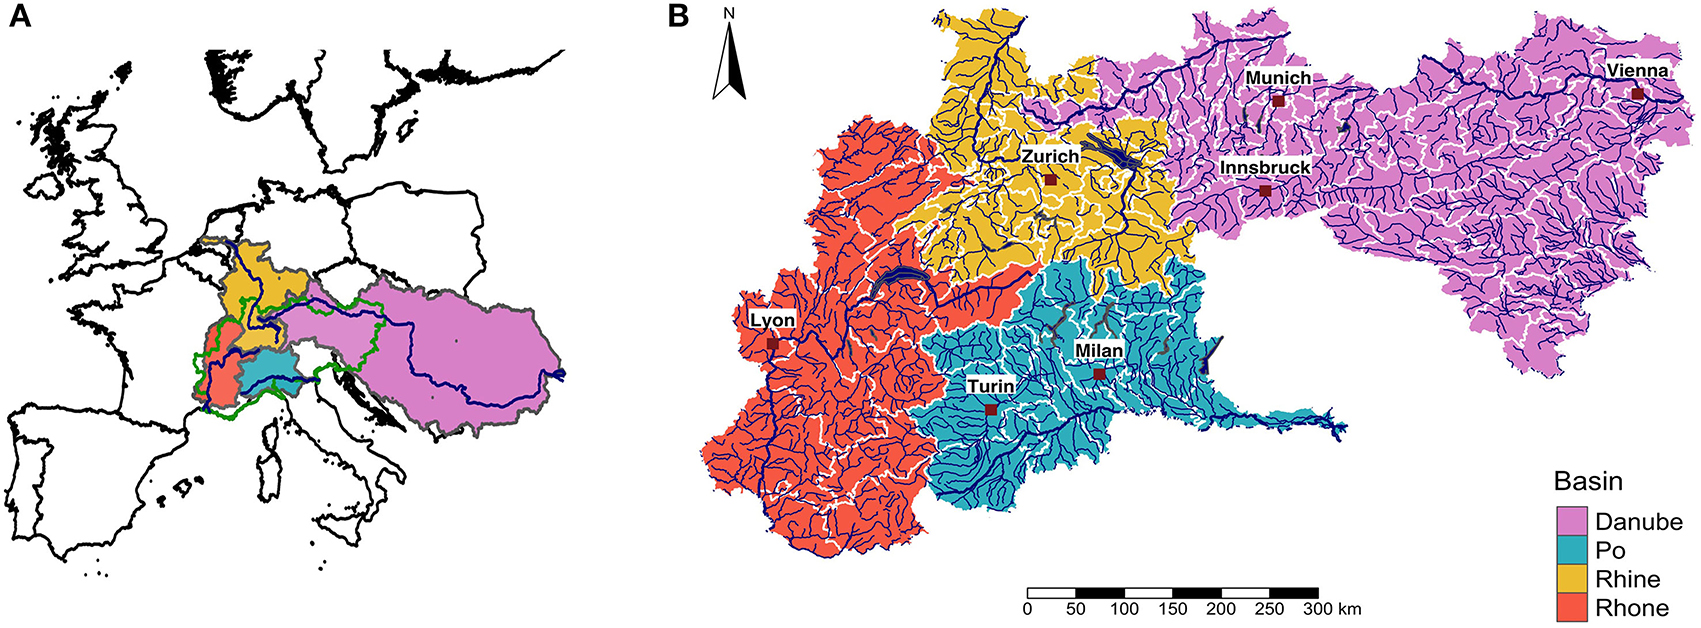
Figure 1. (A) The Rhine, Rhone, Po and Danube basins in Europe and the Alpine Space extent of the basins (marked with a green line), (B) the NUTS 3 regions of the river basins within the extent of the Alpine Space.
In many regions of the world, mountains play an essential role as water reservoirs (Viviroli et al., 2007, 2020; Immerzeel et al., 2019). More than 50% of the mountain areas worldwide have a supportive or essential function for their adjacent downstream regions (Viviroli et al., 2007). Therefore, mountain regions are commonly referred to as water towers. The European Alps perform this water tower function for Europe by accumulating and providing water for more than 170 million people living in the four major river basins (European Environment Agency, 2009). Water resources are of crucial importance for the health of the Alpine ecosystems and societies (Gobiet et al., 2014). In addition, they are a mainstay of many local economies ranging from tourism to hydropower production (Schneider and Homewood, 2013; Cammalleri et al., 2020). Agriculture is among the most important sectors across the study region with beef and dairy production in the higher elevation areas and large areas for crop production in the foothills and foreland areas (Jager et al., 2020).
Drought impact data
The data basis of this study is provided by the Alpine Drought Impact Report Inventory (EDIIALPS), an updated version of the European Drought Impact Report Inventory (EDII) tailored to the Alpine region and introduced by Stephan et al. (2021b). The EDII is a text-based database with the purpose of compiling qualitative and cross-sectoral drought impact data of historical and recent drought events in Europe (Stahl et al., 2012). Hereby, drought impacts are understood as “reports on negative environmental, economic or social effects experienced as a consequence of drought” (Stahl et al., 2016, p. 803). The sources of the reported drought impacts are diverse, ranging from newspaper articles to governmental reports to scientific articles. The impact reports are classified into 13 impact categories (with 96 subtypes): Agriculture and livestock farming (1), Forestry (2), Freshwater aquaculture and fisheries (3), Energy and industry (4), Waterborne transportation (5), Tourism and recreation (6), Public water supply (7), Water quality (8), Freshwater ecosystems (9), Terrestrial ecosystems (10), Air quality (13), Human health and public safety (14), and Conflicts (15). In the EDIIALPS version used for this study, the EDII categories Soil system (11) and Forest fires (12) were excluded because other databases are often more comprehensive, e.g., for forest fires, and also because the relationship between drought, impacts and management is often inconclusive in these categories (Stephan et al., 2021b).
For this study we used impact data of the EDIIALPS (Stephan et al., 2022) localized at least to the level of NUTS 3 regions covering the period from 01-2000 until 02-2021. We chose this time range, as it focuses on the most recent drought events and additionally presents a higher data coverage. Using data of the last two decades also assured more homogeneous data collection conditions than existed prior to the availability of online publications. We also used the entries of “reported impacts.” It is important to note that a certain drought report may have been used more than once for impact entries in the database if it describes several impact subcategories, e.g., a report on “Agriculture and livestock farming” could result in an impact of “Reduced availability of irrigation water” (subcategory 1.5) and as well one of “Reduced productivity of annual crop cultivation” (subcategory 1.1) if the original text description reflected these. Finally, we used the year of occurrence as a temporal reference. Often no information on the end date of an impact is available. Therefore, it was assumed that an impact occurred solely in the year it started and not beyond.
Combination of study area and drought impact data
We first delineated the Rhine, Rhone, Po and Danube basins (see Figure 1A). For this purpose, we used the HydroBASINS dataset providing basins and sub basins as hydrographic layers on a global scale (Linke et al., 2019). In a second step, we tailored the basins and their sub basins to the extent of the study area by cutting off sections beyond the scope of the Alpine Space. The boundaries of the Alpine Space correspond to the borders of administrative regions based on the Nomenclature of Units for Territorial Statistics (NUTS) system. Third, we determined the associated NUTS 3 regions for each basin assuming that a NUTS 3 region is part of a basin if at least 50% of its area lies within it (see Figure 1B).
This way, we were able to localize the EDIIALPS impact data geocoded to NUTS 3 level to the individual basins. Thus, we derived yearly EDIIALPS entries for each NUTS 3 region and the individual river basins.
Upstream-downstream classification approaches
In the literature, there is no consensus on how to divide upstream and downstream areas. Therefore, two classifications were developed within the frame of this study. To ensure uniformity, definitions that could be applied consistently across all four basins were required. Several classifications were tested, based on geographical distances, upstream area percentages, human influences and population numbers. Finally, we chose two upstream-downstream classifications that resulted in two different spatial patterns that correspond to two different hypotheses of upstream-downstream impact asymmetries for comparison.
The first approach, hereafter referred to as “distance approach,” identifies sub basins (upstream headwater regions) and regions further down that receive the water (downstream regions) and therefore follows the idea of the water tower hydrology of disproportionate topography and water supply to also influence drought impacts. To implement this approach, we calculated the distance between each sub basin polygon outlet and the most downstream sink, i.e., the outlet of the main river basin along the river network (Lehner and Grill, 2013). The most downstream sink is that of the larger basin, e.g., for the Rhine basin the outlet is at the North Sea. For this approach, we used the geographic information on distances available in the HydroBASINS dataset. A major advantage of the dataset is the inclusion of information on flow direction and relative distinction of up- and downstream cells within the basin. The 3rd quantile of the distance between each sub basin polygon outlet and most downstream sink was used as threshold value to divide between up- and downstream areas. Finally, we assigned the NUTS 3 regions to the respective up- and downstream areas assuming a NUTS 3 region would be part of a (upstream/downstream) region if at least 50% of its area was within the region's area.
The second approach, termed “human footprint approach,” follows the idea that downstream areas are often characterized by a strong human influence and therefore follows the idea of a more explicit indication of a higher water demand and therefore a higher vulnerability toward drought impacts downstream. For this purpose, we applied human footprint data of the BasinATLAS dataset (Linke et al., 2019). Here, the human footprint presents the relative human influence on the land surface for the year 2009 measured by eight variables (Venter et al., 2016): (1) built environments, (2) population density, (3) electric infrastructure, (4) crop lands, (5) pasture lands, (6) roads, (7) railways, and (8) navigable waterways. Since the BasinATLAS dataset is connected to the HydroBASINS dataset, we directly extracted human footprint data for the defined sub basins. We define sub basins with a large human footprint index (>200), which corresponds to a relative human influence of at least 20% in the sub basin, as downstream. Also, sub basins downstream of these sub basins are classified as downstream. Accordingly, we classified all other sub basins as upstream. The threshold of 200 was chosen, because this value covers the main areas of heavy human impact (mainly cities) in all basins. For consistency and comparability, we opted for one common threshold rather than choosing individual values for each basin. Furthermore, our approach ensured that the direction of river flow is respected meaning that any basin classified as upstream flows into one classified as downstream. In a final step, we assigned NUTS 3 regions to the respective up- and downstream areas. Therefore, we classified a NUTS 3 region with at least 60% of its area covered by upstream sub basins as upstream. This procedure avoided small areas characterized by a large human footprint (e.g., cities) being absorbed into upstream NUTS 3 regions when merging the sub basins.
Finally, we linked the yearly EDIIALPS entries for each NUTS 3 region with the up- and downstream NUTS 3 regions of the basins in order to investigate upstream-downstream differences.
Test for upstream-downstream impact asymmetries
To test our main hypothesis that drought impacts occur more often downstream, we considered different aspects of the impact data. First of all, we compared the temporal occurrence and the distribution of drought impacts of the four basins over the individual impact categories. Furthermore, we tested upstream-downstream differences regarding the number of reported impacts in the EDIIALPS with the Mann–Whitney-U-Test. This test ranks the data and then evaluates whether the central tendencies of two independent samples are different (Mann and Whitney, 1947; Kotz and Johnson, 1992). A p-value ≤ 0.05 was used to indicate significant differences. Also, the number of impacts were area-weighted and are expressed per km2 in order to take into account the different spatial extents of upstream and downstream areas.
To analyze whether the detected differences in impacts are due to the hazard or due to the vulnerability and exposure we also compared the Standardized Precipitation Index (SPI) and the Standardized Precipitation and Evapotranspiration Index (SPEI). These meteorological indices are widely used for drought hazard monitoring and comparison across different regions (McKee et al., 1993; Vicente-Serrano et al., 2010). They are monitored by the Alpine Drought Observatory (ADO) for which downscaled ERA-5 data was used and standardized with the reference period from 1981 to 2020 (EURAC, 2022). For the comparison we decided to choose the SPI-6 of October each year since the majority of impacts in the Alpine Space occur in the summer and early autumn (Stephan et al., 2021a). We aggregated the ADO's gridded values by averaging all grid cells within each NUTS 3 region hence matching the spatial resolution of the analyzed EDII drought impacts.
Results
Temporal and categorical differences of reported drought impacts in the basins
The analysis of the EDIIALPS data revealed a strong regional variability regarding the distribution of drought impacts over time within the basins (Figure 2). Within the study period from 2000 to 2020, a total of 1,742 drought report entries were available. The largest number of reported drought impacts were available in the Danube basin (627 entries), followed by the Rhine basin (582) and the Rhone basin (494). For the Po basin a smaller number of 119 reported drought impacts is available in the EDIIALPS database. The number of reported drought impacts increases over time with specific drought years, in which many impacts have been reported. In the Rhine basin, the year 2003 shows a peak of reported drought impacts, followed by several years without a remarkably high number of entries until they increase again in 2015. In particular, 2003, 2015, and 2018 are important drought years in this catchment. In the Danube basin, 2003, 2015, 2017, and 2018 emerge as drought years. In the Rhone catchment, the number of drought impacts increases mainly from 2011 onwards, with peak years in 2018 and 2019. The Po catchment shows 6 years with impact records. Here, the years 2003 and 2017 stand out, however with <50 and <25 entries, respectively.
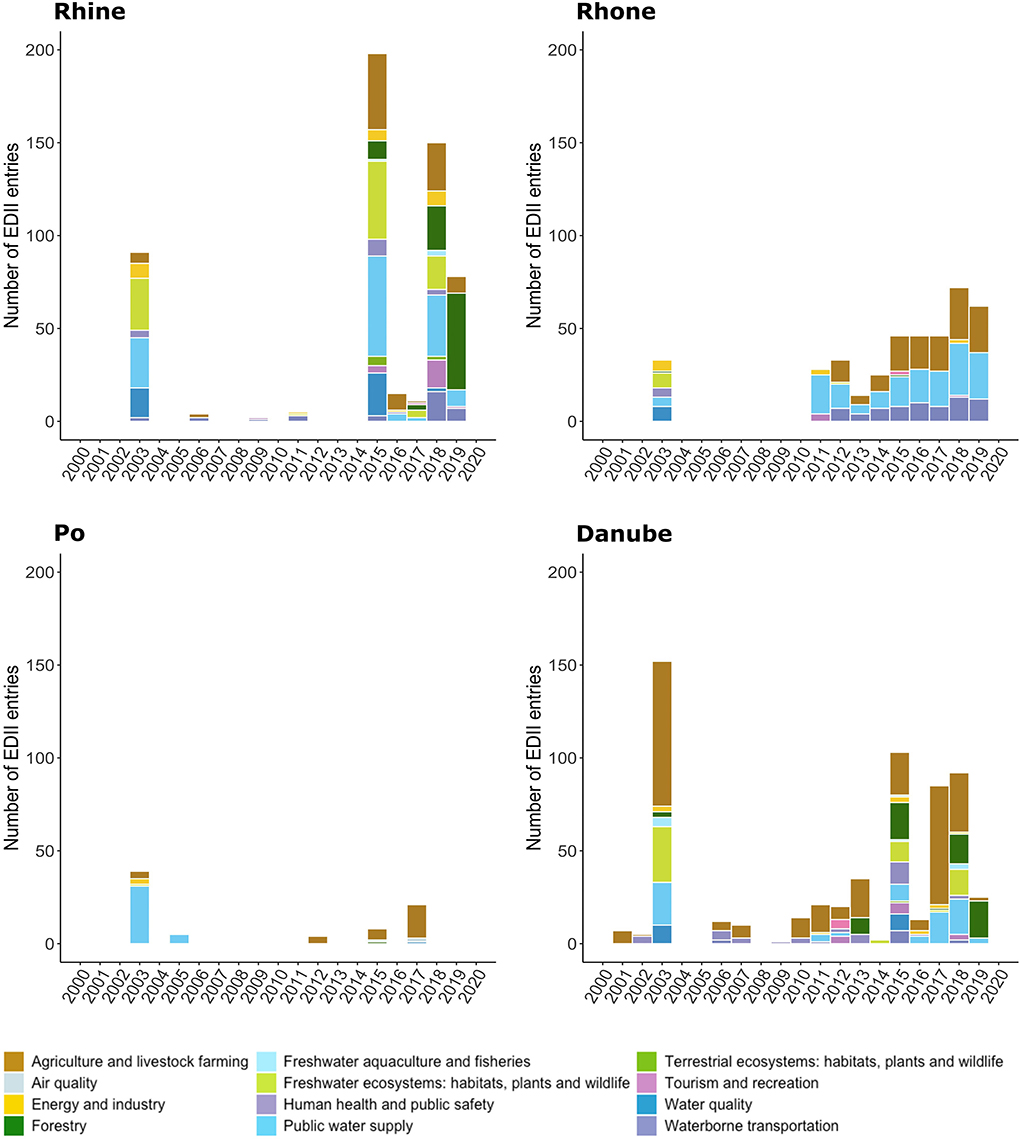
Figure 2. Temporal distribution of reported impacts and the affected impact categories.
The distribution of these reported impacts over the drought impact categories is similar in the Rhine and Danube basins. Agricultural impacts dominated in the Danube basin within the last two decades. The diversity of affected sectors increases in the Rhine and Danube basin over time, whereby especially the basin-specific drought years show a large variety of sectors affected. In contrast, the Rhone and Po basins show less variety in the affected impact categories. In the Rhone basin the drought of 2003 is dominated by six different impact categories, while from 2012 onwards only three categories, i.e. “Agriculture and livestock farming,” “Public water supply,” and “Waterborne transportation” were reported. In the Po basin, the first 2 years are characterized by high fractions in “Public water supply” impacts whereas the following 4 years were dominated by agricultural impacts. In general, the results highlight that “Agriculture and livestock farming” is the main sector affected in the Alpine Space during the 20 years studied.
Upstream-downstream classification and differences of drought impacts
The two different approaches divide the study area into up- and downstream regions of different spatial patterns (see Figure 3). The distance approach generated a classification with small upstream areas in all four river basins presenting the most upstream headwaters of each basin. Depending on the topography and drainage network this approach created a South-North (Rhine), North-East-to-South-West (Rhone), North-South (Po) and West-East (Danube) upstream-downstream pattern. In contrast, the human footprint approach generated a classification with a more balanced ratio of the area shares of the up- and downstream regions in the Rhine, Rhone and Po basin. However, the Danube basin is characterized by a large upstream area, while the downstream area is small and limited to urbanized areas along the main river. The human footprint classification presents most agglomeration areas with a high human impact factor as downstream region, although some small areas with a disproportionately large human footprint (e.g., like Innsbruck) were classified as upstream region due to the conversion to NUTS 3 regions. The difference between the two resulting classifications is more pronounced for the Danube and the Rhone, as they flow along the Alps rather than away from the Alps, thus shifting the geographical pattern from a West-East division to a South-North division (Danube) and from a North-East-to-South-West to a more East-West division (Rhone).
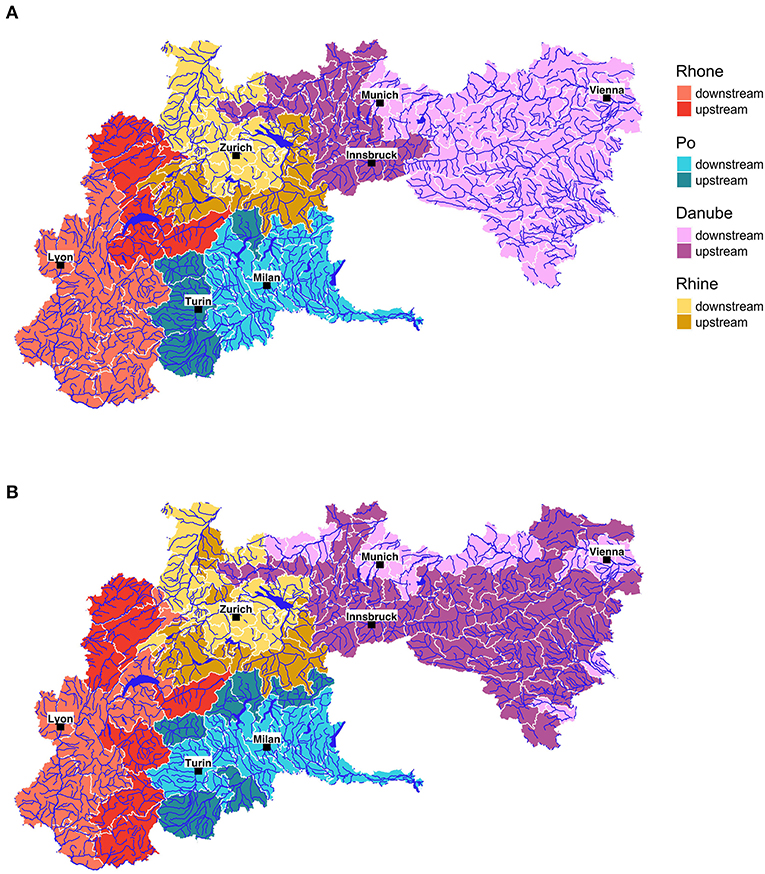
Figure 3. NUTS 3 regions within the four basins classified into up- and downstream parts applying (A) the distance approach and (B) the human footprint approach.
The analysis of the upstream-downstream differences of drought impacts within the individual impact categories reveals that the majority of impacts occur downstream regardless of the applied classification approach (Figure 4). In the Rhine and Po basins, both classifications show similar impact patterns. In the Rhone basin, the three main affected sectors (“Public water supply,” “Agriculture and livestock farming,” and “Waterborne transportation”) show more impacts in upstream areas in the human footprint classification compared to the distance classification. In the Danube basin, differences between both classifications are largest with several categories differently distributed. For example, the categories “Agriculture and livestock farming,” “Public water supply,” and “Human health and public safety” are more frequent in the upstream regions in the human footprint classification.
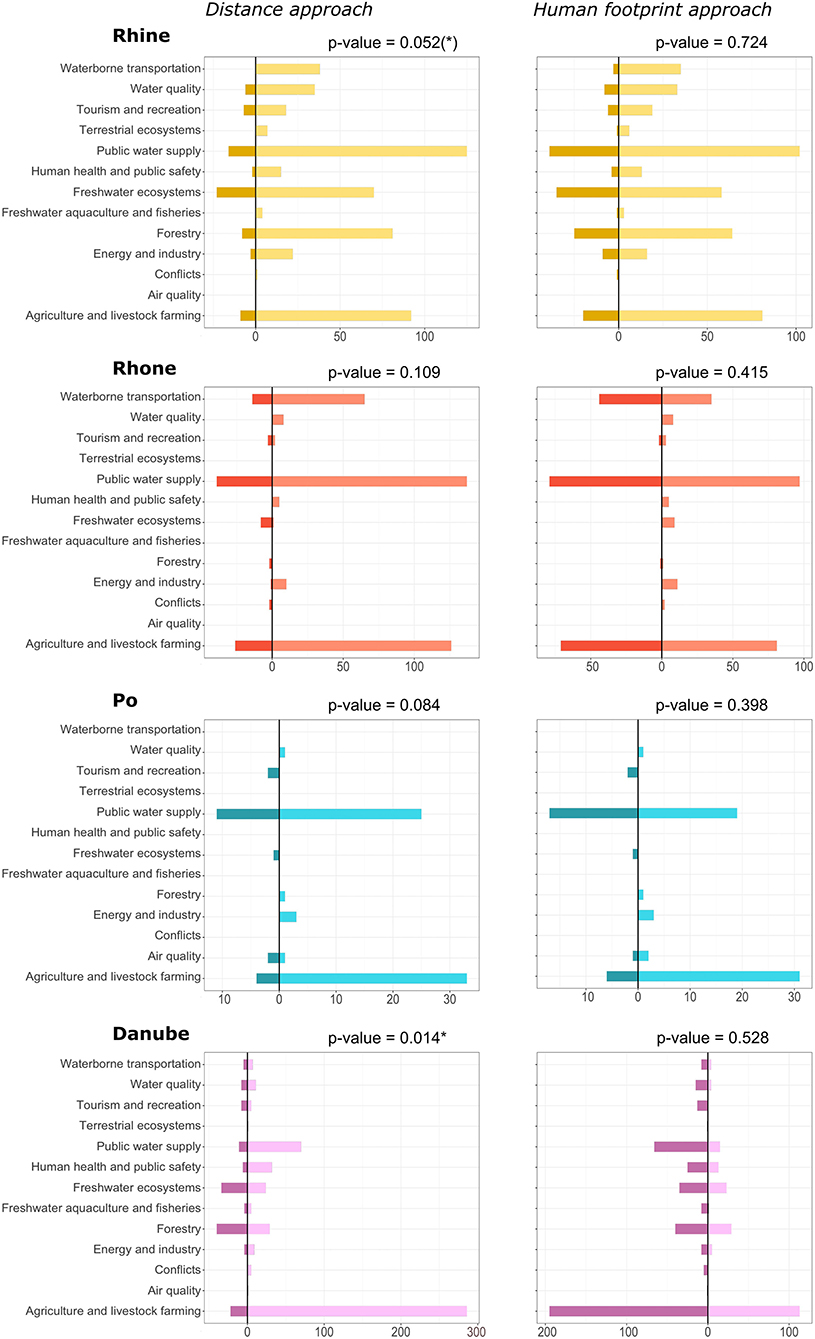
Figure 4. Distribution of drought impacts by impact category in upstream (darker color) and downstream (lighter color) regions.
The statistical test confirms significant upstream-downstream differences for the distance approach in the Rhine and Danube basin (Figure 4). For this classification method, small but not significant (p-value = 0.084) differences exist in the Po basin with substantially more counted impacts downstream for the majority of affected sectors. Similar differences are found in the Rhone basin. The statistical test did not reveal significant differences between up- and downstream impact counts for the human footprint approach in any of the considered river basins.
Influence of the drought hazard on up- and downstream differences
The area-weighted approach shows a larger number of weighted impacts for the overall time period (2000–2020) in downstream regions of the four basins regardless of the applied classification approach. The area-weighted numbers of drought impacts for the basin-specific drought years support the higher impact numbers downstream (Table 1). Exceptions for some years are the slightly higher impact numbers in upstream areas during 2018 (distance classification) and 2019 (human footprint classification) in the Rhone basin, and during 2003 and 2018 in the Danube basin (both distance classification).
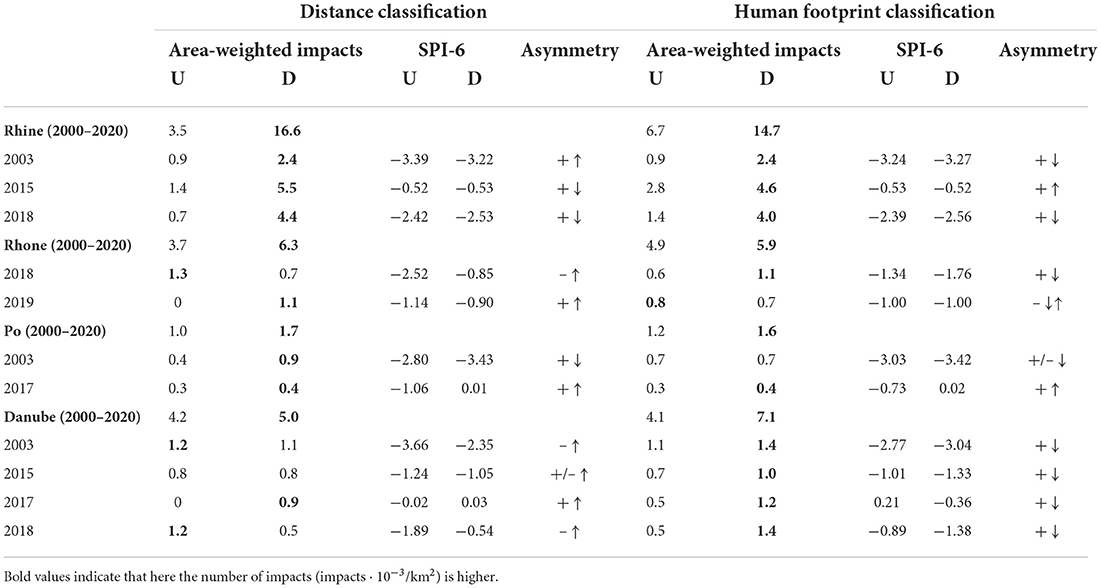
Table 1. Number of impacts · 10−3/km2 and drought indices in the basin-specific drought years; + ↓ : more impacts D, stronger drought hazard D, + ↑ : more impacts D, stronger drought hazard U, – ↓ : more impacts U, stronger drought hazard D, – ↑ : more impacts U, stronger drought hazard U.
The results of the hazard analysis of SPI-6 and SPEI-6 reveal small differences between up- and downstream regions between 2000 and 2020 (Figure 5). These differences are more pronounced for the distance classification. In general, SPI-6 and SPEI-6 show very similar patterns. Individually, the Rhine basin does not show large differences in either classification. The Rhone basin shows some differences in the distance classification with a more severe character of droughts in downstream areas. For the Po basin, both classifications lead to mostly negative differences, i.e., more severe droughts in upstream areas. We found the largest differences for the distance classification in the Danube basin where the droughts were more severe in upstream areas within the overall time period. The human footprint approach reveals smaller differences, however, here the drought conditions seem to be slightly stronger in downstream regions. The SPI-6 values of the basin-specific drought years confirm the results for the entire time period (Table 1). Just two exceptions can be found in the Rhone and Po basin: Both basin-specific drought years of the Rhone basin, 2018 and 2019, show more severe drought in the upstream parts applying the distance approach. In the Po basin the year 2003 is presented with higher drought severity downstream contrasting the general pattern of the basin with higher drought severity upstream.
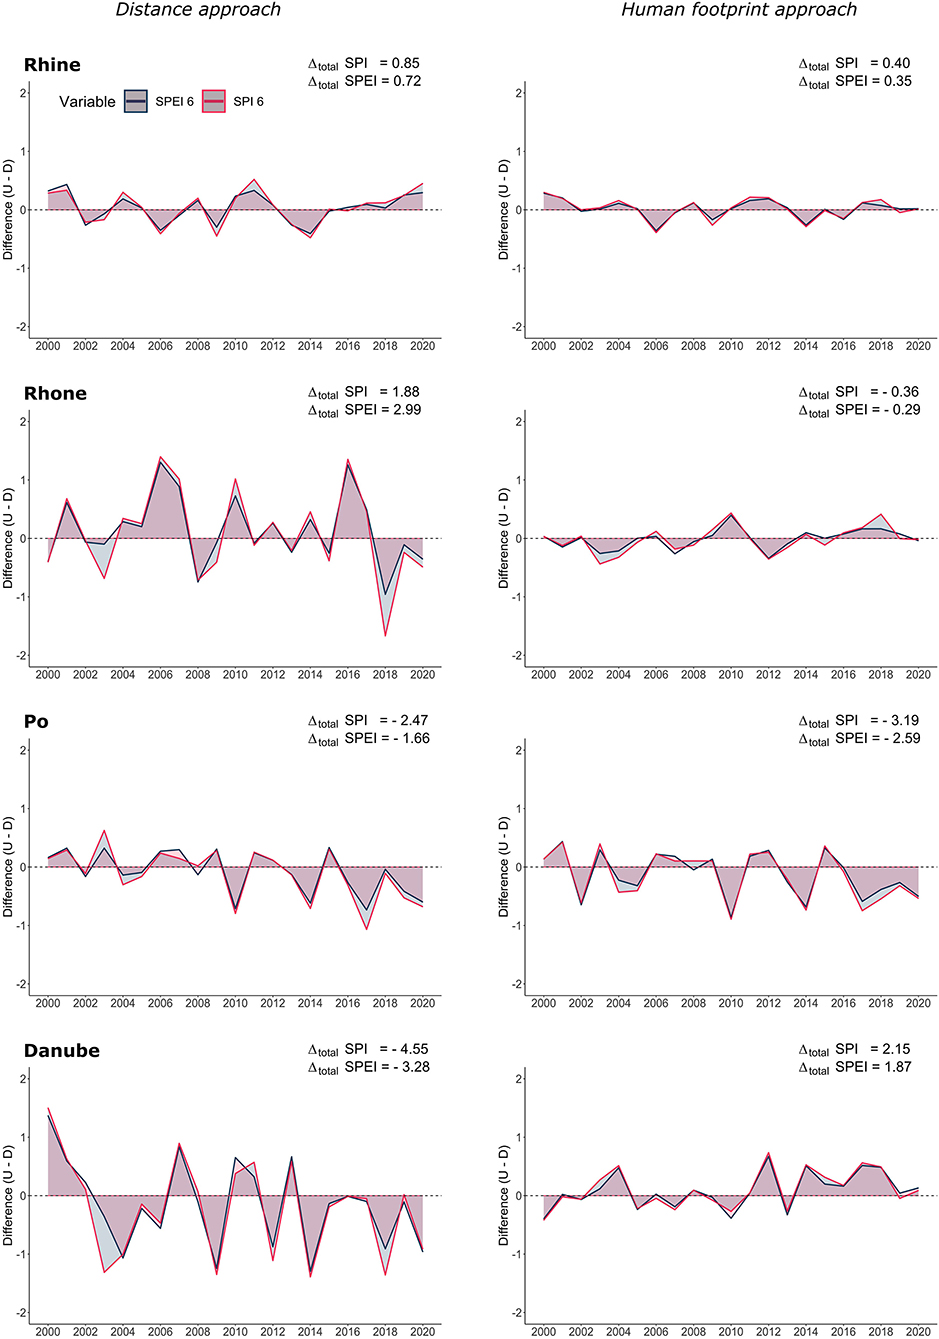
Figure 5. Upstream-downstream differences of the SPI-6 and SPEI-6 values within the four basins; values < 0 indicate that drought conditions are more severe in the upstream area.
Discussion
Temporal development of drought impacts across the river basins
The results revealed a strong regional variability regarding the temporal distribution of drought impacts within the basins. This has to be put in context with the sources and representativeness of the drought impact data. We presented an increasing trend of impact reports across the river basins. Since based on the same data, Stephan et al. (2021a) found similar results for the entire Alpine Space stating that the number of collected drought impacts increased, especially after 2000 and 2010. This increase is attributable to the fact that the general data availability has improved due to digitization trends and the online publishing of reports and documents (Stahl et al., 2016). Access to drought reports has become easier and awareness of climate change and associated drought impacts has increased over the last decades. Accordingly, a higher number of reports does not automatically indicate more severe drought conditions or, on the contrary, the absence of reports does not automatically mean that no drought occurred.
The comparison of the temporal distribution of drought impacts reveals great agreement with other studies which underpins the significance of the EDIIALPS data despite the reporting biases. The basin-specific drought years identified through the impact analysis correlate well with drought years determined by other studies analyzing the four basins. For example, the years 2003 and 2018 were identified as relevant drought years for the Rhine basin (Benedict et al., 2021) and 2003, 2007, 2011, and 2017 for the Po basin (Musolino et al., 2018; Baronetti et al., 2020). These temporal patterns are also visible in the results of this study.
Regarding the sectoral distribution of impacts, the category “Agriculture and Livestock farming” emerged as the main affected sector with especially high impact numbers in the Danube basin. According to Stephan et al. (2021a) across the entire “Alpine Space,” most reported impacts fell into the category “Agriculture and livestock farming.” Compared with the whole of Europe, the authors highlighted that the agricultural sector is especially affected in the Alpine region. These results are coherent, as the Alpine region is known for its large crop production areas at lower elevations and livestock farming at higher elevations.
Analyzing the distribution of impacts in the impact categories, it became apparent that the categories are strongly connected to the EDIIALPS data availability and the associated information sources. The analysis showed that very different initial situations in terms of information sources exist for the basins (see Supplementary material). The insight into the archive's data biases led to the conclusion that the basins are not easily comparable with each other as countries and regions maintain different reporting cultures and provide different types of information that could be used to make impact data entries into the EDIIAlps. For the Po basin for example, mainly newspaper articles were collected whereas governmental reports from the French operational “Propluvia” platform (Stephan et al., 2021a) dominate in the French part of the Rhone basin. The Propluvia reports also explain the distribution pattern of the impact categories in the Rhone basin which are dominated by “Agriculture and livestock farming,” “Public water supply,” and “Waterborne transportation” from 2012 onwards since these are the sectors Propluvia focuses on. This explicit focus on certain categories also explains why the basin-specific drought years in the Rhone basin (2018 and 2019) show very similar distributions. The two basin-specific drought years of the Po basin (2003 and 2017) on the other hand show very different affected sectors. It could be argued that the differences arise because a larger time period lies between 2003 and 2017 so that the vulnerabilities of different sectors might have changed over time. However, when looking at the information sources of the Po basin, it becomes visible that while in 2003 the reports were collected from governmental reports, newspaper articles and books, only newspaper articles were analyzed in 2017. This fact could explain the different impact category distribution patterns between the years. The high number of agricultural impacts in the Danube basin is supported by specific awareness and data collection by regional projects such as DriDanube (DriDanube Programme, 2022) and transboundary efforts to collect and assess impact information such as those of the Drought Management Center of South Eastern Europe (DMSCEE., 2022). In summary, while we consider the within-basin and particularly the within-country differences to be robust, when comparing different basins and different countries the detailed bias of information sources of the impact entries needs to be considered. Analyzing an entirely non-biased impact data subset based on text reports for transboundary river basins is not possible with the currently available archive. Creating one by searching for specific information sources in specific regions for specific years to fill gaps might be a useful aim for a future research project.
Assessment of the upstream-downstream classification approaches
Most upstream-downstream studies try to identify up- and downstream regions based on the entire spatial extent of a basin (Nepal et al., 2014; Munia et al., 2016; Li et al., 2021; Lu et al., 2021). Their aim mostly is to understand upstream-downstream linkages in hydrological (and/or socio-hydrological) processes to advance water resource management at basin-scale. In this study, we focused on the European Alpine region and its foothills in order to understand drought impacts specifically in the mountainous region of each basin. While the extent of the Alpine Space suits the analyses as it includes the main Alpine crest and parts of lower elevation regions allowing the integration of regions further downstream, limitations arose from the conversion of different spatial data extents due to diverse data sources. More explicitly the NUTS 3 classification used to localize the impact data and the hydrological basins do not correspond. By converging sub basins into NUTS 3 regions, simplifications had to be accepted especially when applying the human footprint approach. In this approach small-scale areas can be characterized by a disproportionately large human footprint, e.g., cities. When converging the sub basins into NUTS 3 regions, some of these smaller structures were absorbed by large NUTS 3 regions and classified as upstream despite their large human footprint characteristic for downstream areas. Consequently, this effect was minimized by adjusting the merging threshold from sub basins to NUTS 3 regions (60% instead of 50% for the human footprint approach). This decision created a bias regarding the division in up- and downstream areas but in this case, it allowed to give small and significant downstream structures more weight.
Further, the human footprint approach to classify up- and downstream regions is affected by the variables used to calculate relative human influence on the land surface (Venter et al., 2016): (1) built environments, (2) population density, (3) electric infrastructure, (4) crop lands, (5) pasture lands, (6) roads, (7) railways, and (8) navigable waterways. Some of these variables are highly related to the analyzed impact types. For example, the variables “crop land” and “pasture land” capture conditions essential for impacts on agriculture, while the variable navigable waterways captures conditions essential for impacts on waterborne transportation. This may cause a biased preference of specific impact types in downstream regions that has to be taken into account when interpreting the results. Nevertheless, we present two approaches showing contrasting perspectives to define up- and downstream regions.
Since the field of upstream-downstream classifications is highly understudied, the development of future approaches entails manifold options. Even though the four basins of this study vary greatly in their hydrological characteristics and morphology, we tried to pursue a uniform approach to allow comparison between the basins and objectively analyze the distribution patterns of drought impacts. Future approaches might benefit from individual thresholds for each basin and therefore recognizing basin-specific (hydrological, geomorphological or socio-economic) characteristics.
Upstream-downstream asymmetries
The upstream-downstream classification indeed influenced the distribution patterns of the drought impacts especially when focusing on the individual impact categories. Most clearly the category “Agriculture and livestock farming” by applying the distance classification demonstrated the large difference between impact numbers in up- and downstream regions. Hereby, more drought impacts were reported for agricultural crop production areas, which are mainly located in the foothill regions of the Alps (and therefore predominantly classified as downstream by this topographically oriented approach) than for the livestock farming sector in the higher elevated areas. A closer look on the affected impact subtypes reveals that especially for the subcategories “1.1 Reduced productivity of annual crop cultivation” and “1.3 Agricultural yield losses” drought impacts were reported. Subcategories concerning livestock farming do not show many impact entries. Therefore, it becomes clear that the spatially different vulnerabilities regarding crop production and livestock farming are also presented in the upstream-downstream asymmetries of the drought impacts.
The human footprint classification also influenced the upstream-downstream differences. Applying this classification in the Danube basin revealed for example that agricultural impacts mainly occurred in upstream areas, an entirely adverse distribution compared to the distance approach where the majority of impacts occurred downstream. Since “crop land” and “pasture land” are included in the eight variables the human footprint is composed of (Venter et al., 2016), this is an especially unexpected result. A detailed data analysis revealed that the human footprint index itself is biased as the eight variables included are weighted differently. Venter et al. (2016) state that even though intensive agriculture often results in a large-scale ecosystem conversion, cropland was only given a weighting score of 7 and pasture even just a score of 4. However, all areas mapped as built environments received a score of 10. This highlights a clear focus on built areas which might explain the unexpected results. Hence, the human footprint approach is dependent not only on the used variables, but also on the weighting scheme to combine them. The distance approach based on geographical distances and not including human influence at all, seems to better represent agricultural structures in the Danube basin. Hence, these examples show that a closer look at the upstream-downstream classifications and their division patterns is necessary to interpret the results since the approaches highly influence the distribution of drought impacts.
The results for the two upstream-downstream approaches also need to consider the previously described biases in the EDIIALPS data. Hereby, mainly the impact of population numbers has to be discussed. The impact entries in the EDIIALPS database stem from text reports and therefore only represent the number of impacts that have been found. Generally, in highly populated areas more impacts are reported, since the exposure to drought will be higher. In both upstream-downstream approaches, the majority of large cities lies in the downstream parts and therefore, most inhabitants live in downstream parts which definitely could influence the presented asymmetries. A result of more reports from a risk perspective therefore likely explains a higher vulnerability and exposure.
Since our analysis has shown that downstream impacts prevail, we posed the question, whether the upstream-downstream differences are attributable to the drought hazard being stronger in downstream areas. We analyzed the drought hazard with the drought indices SPI-6 and SPEI-6 indicating a six-month anomaly between May and October, when most impacts occur (Stephan et al., 2021a). This anomaly did not integrate precipitation during the winter months which might play an essential role for water storage in some parts of the basins. This aspect needs to be analyzed further in future research. Even though both indices are recommended to monitor drought conditions (World Meteorological Organization, 2012), they capture only some aspects that may have caused the analyzed impacts. Both indices indicate a relative deviation from the normal and therefore provide no information about the absolute water shortage in an area. That means, even a small change in the index value might be enough to cause severe impacts as this anomaly may have led to user conflicts etc. Further, we calculated mean values at the level of NUTS 3 regions for both indices. This way we may have averaged out small-scale areas affected by drought, especially in the heterogeneous Alpine terrain, where conditions can change over short distances. When interpreting the severity of the basin-specific drought years, it is important to keep in mind that the characteristics of each drought event vary widely over the analyzed time period. Whereas the drought 2003 over central Europe was characterized by very hot temperatures over a short period of time, the drought event 2015 was accompanied by warm temperatures and dry conditions over a long period (Laaha et al., 2017).
Apart from these limitations, the applied drought indices did not show substantial differences between the up- and downstream areas in almost all cases, while the number of impacts is substantially higher in downstream regions. One example contrasting this pattern is the SPI-6 in the Rhone basin in the year 2018 presenting extremely dry conditions upstream compared to near normal conditions downstream (distance approach). Accordingly, we identified substantially more impacts upstream than downstream. This extreme severity upstream may have crossed a threshold leading to more than usual drought impacts. Also in the Danube basin, the years 2003 and 2018 show large differences between the SPI-6 values in up- and downstream areas indicating more severe drought conditions upstream, which once again could explain the contradictory results of the area-weighted approach within these years. Considering the general pattern of more downstream impacts with some exceptions during very severe drought conditions, our study supports the notion that there are more drivers than the hazards severity driving the asymmetry of the impact distribution.
One aspect hereby might be the hydrography of the river networks. While the Rhone and the Danube are characterized by a successive inflow of Alpine tributaries as they flow along the Alps, Rhine and Po flow away from the Alps. For this study, we did not include the drainage patterns of the four rivers in the analysis. Further research might explore how basin shapes, drainage patterns and additional landscape properties influence the distribution of impacts.
Another important aspect is the vulnerability. The higher number of impacts in downstream areas may indicate a higher vulnerability of downstream areas to drought conditions compared to upstream areas. On the other hand, a lower number of drought impacts could also indicate that some regions have already well adapted to the drought hazard, for example due to the existence of drought management strategies. To clarify this, the investigation of the regions' vulnerability would be required. In addition to our presented results, this would further improve the understanding of up- and downstream differences and therefore help to develop region specific adaptation strategies.
Conclusion
This study investigated the distribution of drought impacts from 2000 to 2020 in the Rhine, Rhone, Po and Danube basin within the extent of the Alpine Space. The hypothesis whether drought impacts occur more often in downstream regions than in upstream regions was tested with two sub basin classifications: the distance approach and the human footprint approach. The results confirmed the hypothesis for most cases of classification, basin and time span analyzed, but also illustrated a strong regional and temporal variability regarding the distribution of impacts. Asymmetries were statistically significant in the Rhine and Danube basin when applying the distance approach. We found that the physical drought event does not seem to have a large influence on the upstream-downstream differences of the drought impacts. However, the drought characteristics might explain upstream-downstream impact differences in individual basin-specific drought years.
The study provides a first empirical support for the existence of upstream-downstream asymmetries with more impacts occurring in the downstream parts of the basins. It also raises some questions on how best to compare and assess such asymmetries in light of different awareness and hence drought impact reporting in transboundary settings. The spatial distributions of drought impacts found in the four major river basins of the European Alps certainly highlight the need for a more network based analysis with more consistent impact data within river basins. This study provides a starting point for further investigations that might address some of the uncertainties by looking at specific sectoral impacts and relating them to specific water sources and drought indices. Investigating the role of climate change, cascading effects and the vulnerability of the individual regions on these asymmetries provides large potential for further research.
Data availability statement
The original contributions presented in the study are included in the article/Supplementary material, further inquiries can be directed to the corresponding author/s. The drought impact data EDIIALPS V1.1 can be found here: https://freidok.uni-freiburg.de/data/230219 and that the drought indices data can be found here: https://ado.eurac.edu/.
Author contributions
HD, RS, and KS conceived and designed the analysis. RS and HD prepared the data. HD developed the upstream-downstream classifications, analyzed the drought impact and drought indices data and produced the visualizations, and wrote the original draft. KS and RS contributed substantially to the evaluation of the classifications, contributed to the writing process, and also the writing—review and editing. All authors contributed substantially to the discussion of content.
Funding
This study was partly funded by and contributes to: the EU Interreg Alpine Space Programme's project Alpine Drought Observatory (ADO), grant no. ASP940. We acknowledge support by the Open Access Publication Fund of the University of Freiburg.
Conflict of interest
The authors declare that the research was conducted in the absence of any commercial or financial relationships that could be construed as a potential conflict of interest.
Publisher's note
All claims expressed in this article are solely those of the authors and do not necessarily represent those of their affiliated organizations, or those of the publisher, the editors and the reviewers. Any product that may be evaluated in this article, or claim that may be made by its manufacturer, is not guaranteed or endorsed by the publisher.
Supplementary material
The Supplementary Material for this article can be found online at: https://www.frontiersin.org/articles/10.3389/frwa.2022.1061991/full#supplementary-material
References
Bachmair, S., Kohn, I., and Stahl, K. (2015). Exploring the link between drought indicators and impacts. Nat. Hazards Earth Syst. Sci. Discuss. 15, 1381–1397. doi: 10.5194/nhess-15-1381-2015
Baronetti, A., Gonz?lez-Hidalgo, J. C., Vicente-Serrano, S. M., Acquaotta, F., and Fratianni, S. (2020). A weekly spatio-temporal distribution of drought events over the Po Plain (North Italy) in the last five decades. Int. J. Climatol. 40, 4463–4476. doi: 10.1002/joc.6467
Benedict, I., van Heerwaarden, C. C., van der Linden, E. C., Weerts, A. H., and Hazeleger, W. (2021). Anomalous moisture sources of the Rhine basin during the extremely dry summers of 2003 and 2018. Weather Clim. Extrem. 31, 100302. doi: 10.1016/j.wace.2020.100302
Beniston, M. (2012). Impacts of climatic change on water and associated economic activities in the Swiss Alps. J. Hydrol. 412–413, 291–296. doi: 10.1016/j.jhydrol.2010.06.046
Cammalleri, C., Naumann, G., Mentaschi, L., Formetta, G., Forzieri, G., Gosling, S., et al. (2020). Global Warming and Drought Impacts in the EU: JRC PESETA IV Project: Task 7. European Commission. Luxembourg: Joint Research Centre. Publications Office, LU.
DMSCEE. (2022). Available online at: http://www.dmcsee.org (accessed October 25, 2022).
DriDanube Programme. (2022). Available online at: https://www.interreg-danube.eu/approved-projects/dridanube (accessed September 19, 2022).
Erfurt, M., Skiadaresis, G., Tijdeman, E., Blauhut, V., Bauhus, J., Glaser, R., et al. (2020). A multidisciplinary drought catalogue for southwestern Germany dating back to 1801. Nat. Hazards Earth Syst. Sci., 20, 2979–2995. doi: 10.5194/nhess-20-2979-2020
EURAC. (2022). Indices of the Alpine Drought Observatory (data publication in press). Available online at: https://ado.eurac.edu (accessed November 1, 2022).
European Environment Agency. (2009). Regional Climate Change and Adaptation: The Alps Facing the Challenge of Changing Water Resources. Luxembourg: Publications Office, LU.
Gobiet, A., Kotlarski, S., Beniston, M., Heinrich, G., Rajczak, J., Stoffel, M., et al. (2014), 21st. century climate change in the European Alps – a review. Sci. Total Environ. 493, 1138–1151. doi: 10.1016/j.scitotenv.2013.07.050
Gregoric, G., Susnik, A., Zun, M., and Moderc, A. (2019). Better Prepared for Drought. Danube Drought Strategy. Ljubljana.
Haslinger, K., Schoner, W., and Anders, I. (2015). Future drought probabilities in the Greater Alpine Region based on COSMO-CLM experiments – spatial patterns and driving forces. Meteorol. Z. 25, 137–148. doi: 10.1127/metz/2015/0604
Immerzeel, W. W., Lutz, A. F., Andrade, M., Bahl, A., Biemans, H., Bolch, T., et al. (2019). Importance and vulnerability of the world's water towers. Nature 577, 364–369. doi: 10.1038/s41586-019-1822-y
Interreg Alpine Space Programme. (2021). Available online at: https://www.alpine-space.eu (accessed June 22, 2021).
Isotta, F. A., Frei, C., Weilguni, V., Percec Tadic, M., Lass?gues, P., Rudolf, B., et al. (2014). The climate of daily precipitation in the Alps: development and analysis of a high-resolution grid dataset from pan-Alpine rain-gauge data: climate of daily precipitation in the Alps. Int. J. Climatol. 34, 1657–1675. doi: 10.1002/joc.3794
Jager, H., Peratoner, G., Tappeiner, U., and Tasser, E. (2020). Grassland biomass balance in the European Alps: current and future ecosystem service perspectives. Ecosyst. Serv. 45, 101163.: 10.1016/j.ecoser.2020.101163 doi: 10.1016/j.ecoser.2020.101163
Kotz, S., and Johnson, N. L., eds (1992). Breakthroughs in Statistics. Springer Series in Statistics. New York, NY: Springer-Verlag. doi: 10.1007/978-1-4612-4380-9
Laaha, G., Gauster, T., Tallaksen, L. M., Vidal, J.-P., Stahl, K., Prudhomme, C., et al. (2017). The European 2015 drought from a hydrological perspective. Hydrol. Earth Syst. Sci., 21, 3001–3024. doi: 10.5194/hess-21-3001-2017
Lehner, B., and Grill, G. (2013). Global river hydrography and network routing: baseline data and new approaches to study the world's large river systems: global river hydrography and network routing. Hydrol. Process. 27, 2171–2186. doi: 10.1002/hyp.9740
Li, J., Wu, C., Xia, C.-A., Yeh, P. J.-F., Hu, B. X., Huang, G., et al. (2021). Assessing the responses of hydrological drought to meteorological drought in the Huai River Basin, China. Theor. Appl. Climatol. 144, 1043–1057. doi: 10.1007/s00704-021-03567-3
Linke, S., Lehner, B., Ouellet Dallaire, C., Ariwi, J., Grill, G., Anand, M., et al. (2019). Global hydro-environmental sub-basin and river reach characteristics at high spatial resolution. Sci. Data 6, 283. doi: 10.1038/s41597-019-0300-6
Logar, I., and van den Bergh, J. C. J. M. (2013). Methods to assess costs of drought damages and policies for drought mitigation and adaptation: review and recommendations. Water Resour. Manag. 27, 1707–1720. doi: 10.1007/s11269-012-0119-9
Lu, Y., Tian, F., Guo, L., Borz?, I., Patil, R., Wei, J., et al. (2021). Socio-hydrologic modeling of the dynamics of cooperation in the transboundary Lancang– Mekong River. Hydrol. Earth Syst. Sci. 25, 1883–1903. doi: 10.5194/hess-25-1883-2021
Mann, H., and Whitney, D. (1947). On a test of whether one of two random variables is stochastically larger than the other. Ann. Math. Stat. 18, 50–60. doi: 10.1214/aoms/1177730491
Mastrotheodoros, T., Pappas, C., Molnar, P., Burlando, P., Manoli, G., Parajka, J., et al. (2020). More green and less blue water in the Alps during warmer summers. Nat. Clim. Change 10, 155–161. doi: 10.1038/s41558-019-0676-5
McKee, T. B., Doesken, N. J., and Kleist, J. (1993). “The relationship of drought frequency and duration to time scales,” in 8th Conference on Applied Climatology, 179–184. Anaheim, 17–22 January 1993. doi: 10.1515/labm.1993.17.4.179
Munia, H., Guillaume, J. H. A., Mirumachi, N., Porkka, M., Wada, Y., Kummu, M., et al. (2016). Water stress in global transboundary river basins: significance of upstream water use on downstream stress. Environ. Res. Lett. 11, 014002. doi: 10.1088/1748-9326/11/1/014002
Musolino, D., Vezzani, C., and Massarutto, A. (2018). “Drought management in the Po River Basin, Italy,” in Drought, ed. A. Iglesias, D. Assimacopoulos, H. A. J. Van Lanen (Hoboken, NY: Wiley), 201–215. doi: 10.1002/9781119017073.ch11
Nepal, S., Fl?gel, W.-A., and Shrestha, A. B. (2014). Upstream-downstream linkages of hydrological processes in the Himalayan region. Ecol. Process. 3, 19. doi: 10.1186/s13717-014-0019-4
Schneider, F., and Homewood, C. (2013). Exploring water governance arrangements in the swiss alps from the perspective of adaptive capacity. Mt. Res. Dev. 33, 225–233. doi: 10.1659/MRD-JOURNAL-D-13-00004.1
Stahl, K., Blauhut, V., Kohn, I., Acacio, V., Assimacopoulos, D., Bifulco, C., et al. (2012). A European Drought Impacts Report Inventory (EDII): design and test for selected recent droughts in Europe. (DROUGHT-RandSPI technical report; No. 3). Wageningen: Wageningen Universiteit.
Stahl, K., Kohn, I., Blauhut, V., Urquijo, J., De Stefano, L., Acácio, V. V., et al. (2016). Impacts of European drought events: insights from an international database of text-based reports. Nat. Hazards Earth Syst. Sci. 16, 801–819. doi: 10.5194/nhess-16-801-2016
Stephan, R., Erfurt, M., Terzi, S., Žun, M., Kristan, B., Haslinger, K., et al. (2021a). An inventory of alpine drought impact reports to explore past droughts in a mountain region. Nat. Hazards Earth Syst. Sci., 21, 2485–2501. doi: 10.5194/nhess-21-2485-2021
Stephan, R., Erfurt, M., Terzi, S., Žun, M., Kristan, B., Haslinger, K., et al. (2021b). The Alpine Drought Impact Report Inventory (EDIIALPS V1.0.), [data set]. Freiburg: Uni Freiburg.
Stephan, R., Erfurt, M., Terzi, S., Žun, M., Kristan, B., Haslinger, K., et al. (2022). The Alpine Drought Impact Report Inventory (EDIIALPS V1.1.), [data set]. Freiburg: Uni Freiburg. Available online at: https://freidok.uni-freiburg.de/data/230219
Torelló-Sentelles, H., and Franzke, C. L. E. (2022). Drought impact links to meteorological drought indicators and predictability in Spain. Hydrol. Earth Syst. Sci. 26, 1821–1844. doi: 10.5194/hess-26-1821-2022
UNEP. (2004). Impacts of summer 2003 heat wave in Europe. Environ. Alert Bull 2, 1–4. Available online at: https://archive-ouverte.unige.ch/unige:32255
Vanham, D. (2012). The Alps under climate change: implications for water management in Europe. J. Water Clim. Change 3, 197–206. doi: 10.2166/wcc.2012.032
Venter, O., Sanderson, E. W., Magrach, A., Allan, J. R., Beher, J., Jones, K. R., et al. (2016). Global terrestrial human footprint maps for 1993 and 2009. Sci. Data 3, 160067. doi: 10.1038/sdata.2016.67
Vicente-Serrano, S. M., Beguería, S., López-Moreno, J. I., Angulo, M., and El Kenawy, A. (2010). A new global 0.5° gridded dataset (1901–2006) of a Multiscalar Drought Index: comparison with current drought index datasets based on the Palmer Drought Severity Index. J. Hydrometeorol. 11, 1033–1043. doi: 10.1175/2010JHM1224.1
Viviroli, D., Dürr, H. H., Messerli, B., Meybeck, M., and Weingartner, R. (2007). Mountains of the world, water towers for humanity: typology, mapping, and global significance: mountains as water towers for humanity. Water Resour. Res. 43. doi: 10.1029/2006WR005653
Viviroli, D., Kummu, M., Meybeck, M., Kallio, M., and Wada, Y. (2020). Increasing dependence of lowland populations on mountain water resources. Nat. Sustain. 3, 917–928. doi: 10.1038/s41893-020-0559-9
Viviroli, D., and Weingartner, R. (2004). “The hydrological significance of the European Alps,” in Hydrological Atlas of Switzerland. Berne: Swiss Federal Office for the Environment (FOEN), p. plate 6.4.
Wilhite, D. A. (2000). Drought as a Natural Hazard: Concepts and Definitions, Vol. 69, Routledge Hazards and Disasters Series. London.
Wilhite, D. A., Svoboda, M. D., and Hayes, M. J. (2007). Understanding the complex impacts of drought: a key to enhancing drought mitigation and preparedness. Water Resour. Manag. 21, 763–774. doi: 10.1007/s11269-006-9076-5
Wilhite, D. A., and Vanyarkho, O. V. (2000). Drought: Pervasive Impacts of a Creeping Phenomenon. Lincoln: Drought Mitigation Center Faculty Publications.
Keywords: drought impacts, upstream-downstream classification, impact asymmetry, European Alps, river basins, drought indices
Citation: Dahlmann H, Stephan R and Stahl K (2022) Upstream-downstream asymmetries of drought impacts in major river basins of the European Alps. Front. Water 4:1061991. doi: 10.3389/frwa.2022.1061991
Received: 05 October 2022; Accepted: 28 October 2022;
Published: 15 November 2022.
Edited by:
Haiyun Shi, Southern University of Science and Technology, ChinaReviewed by:
Pengnian Huang, Nanjing University of Information Science and Technology, ChinaYao Wang, Southern University of Science and Technology, China
Copyright © 2022 Dahlmann, Stephan and Stahl. This is an open-access article distributed under the terms of the Creative Commons Attribution License (CC BY). The use, distribution or reproduction in other forums is permitted, provided the original author(s) and the copyright owner(s) are credited and that the original publication in this journal is cited, in accordance with accepted academic practice. No use, distribution or reproduction is permitted which does not comply with these terms.
*Correspondence: Heindriken Dahlmann, aGVpbmRyaWtlbi5kYWhsbWFubkBodS1iZXJsaW4uZGU=
†Present address: Heindriken Dahlmann, IRI THESys, Humboldt-Universität zu Berlin, Berlin, Germany