 S. Samadi
- Department of Agricultural Sciences, Clemson University, Clemson, SC, United States
Floods are among the most destructive natural hazards that affect millions of people across the world leading to severe loss of life and damage to properties, critical infrastructure, and the environment. The combination of artificial intelligence (AI), big data, and the Internet of Things (IoTs), has the potential to more accurately predict these extreme events and accelerate the convergence of advanced techniques for flood analytics research. This convergence—so called the Artificial Intelligence of Things (AIoT)—is transformational for both technologies and science-based decision making since AI adds value to IoT through interpretable machine learning (ML) while IoT leverages the power of AI via connectivity and data intelligence. The aim of this research is to discuss the workflow of a Flood Analytics Information System (FAIS; version 4.00) as an example of AIoT prototype to advance and drive the next generation of flood informatics systems. FAIS integrates crowd intelligence, ML, and natural language processing (NLP) to provide flood warning with the aim of improving flood situational awareness and risk assessments. Various image processing algorithms, i.e., Convolutional Neural Networks (CNNs), were also integrated with the FAIS prototype for image label detection, and floodwater level and inundation areas calculation. The prototype successfully identifies a dynamic set of at-risk locations/communities using the USGS river gauge height readings and geotagged tweets intersected with watershed boundary. The list of prioritized locations can be updated, as the river monitoring system and condition change over time (typically every 15 min). The prototype also performs flood frequency analysis (FFA) by fitting multiple probability distributions to the annual flood peak rates and calculates the uncertainty associated with the model. FAIS was operationally tested (beta-tested) during multiple hurricane driven floods in the US and was recently released as a national-scale flood data analytics pipeline.
Introduction
The combination of Internet of Things (IoTs), the big data it creates, and the ability to use it via Artificial Intelligence (AI) is at a tipping point where significant changes, transformation, and innovation are poised to take place (e.g., Samadi and Pally, 2021). This convergence-so called Artificial Intelligence of Things (AIoT)—has made possible the development of many intelligent and context-awareness systems which are able to efficiently monitor and model environmental systems and provide timely and more accurate forecasts and decisions. The application of AIoT empowers a systematic study of domain-inspired architectures to answer fundamental questions and enable data-driven discovery and problem solving (Donratanapat et al., 2020). Indeed, AIoT creates intelligent connected systems to collect and transmit data from multiple sources–supporting the “learning” process involved in training AI to assist with decision making. This leads to interoperable networks and systems that are becoming increasingly more capable of solving real-time forecasting problems across scales.
AIoT also improves the contextually aware decision-making process for resolving complex flood operational decisions enabling the use of machine intelligence to be implemented more efficiently in real-time. In flood studies, AIoT can provide insights from both big data and AI to further enhance real-time forecasts and improve the capabilities of early warning systems. However, AIoT brings with it the burden of developing custom interfaces and handling huge amounts of structured and unstructured data. In flood analytics research, modeling surface runoff requires linking attributes across river networks, to hierarchically nested sub-basins and river reaches at multiple scales. Further, the data characteristics of flood modeling problems have also grown from static to dynamic and spatio-temporal, and centralized to distributed, and grow in both scope and size. The effective integration of big data for flood forecasting decision-making also requires the advances of data mining and analytics systems.
To tackle these challenges, many data providers such as the US Geological Survey (USGS) and the National Weather Service (NWS) focused on building application programming interfaces (APIs) to ease data management strategies and deliver data services via a network connection. Providing information and services through Web APIs supports interoperability and openness, and eases access to the data. The ability of APIs to stream the data and extract valuable attributes for real-time decision making added an entirely new dimension to flood forecasting research. When embedded within an AIoT system, API ensures interoperability between all connected components to optimize processes and extract valuable insights from big data provided by the connected IoT devices.
In the past few years, the use of APIs for extracting flood images and data produced via social media and river cameras in the context of flood crises has opened a new avenue and opportunities for developing new AIoT systems. The potential of AIoT for providing connectivity between IoTs and big data along with high-speed data transfer capabilities can be used to implement real time image processing and machine learning (ML) systems for flood studies. Both image processing and ML algorithms are powerful methods of image data exploration that can be embedded with river cameras for monitoring flood conditions (Donratanapat et al., 2020). Recently, image processing and ML algorithms have been used to label time lapse camera imagery, crowdsourcing and tabular data, and user generated texts and photos to extract road flooding condition and inundation extend (De Albuquerque et al., 2015; Starkey et al., 2017; Feng and Sester, 2018). In addition, ML algorithms such as natural language processing (NLP) have been used to extract and analyze social media geodata and provide actionable intelligence for real-time flood assessment. In many flood situations, big data from other sources such as USGS, NWS, National Hurricane Center (NHC), in situ sensors, existing authoritative geographic data, etc. are also available which can profitably be leveraged upon in order to make the real-time flood situational assessment more efficient and successful.
Despite the importance of using AIoT in flood related research, few studies have focused on its application in flood monitoring and modeling approaches. For example, Demir et al. (2018) investigated a web-based platform- the Iowa Flood Information System (IFIS)- as the next-generation decision support systems for flood studies. IFIS provides real-time information on streams and weather conditions that incorporates advanced rainfall-runoff models for flood prediction and mapping. Fries and Kerkez (2018) used water level sensors across the state of Iowa and outputs from the National Water Model (NWM) to dynamically map large-scale models to site-scale forecasts for flood warnings. In a consequence, Barker and Macleod (2019) developed a prototype as a real-time social geodata pipeline for flood data collection and visualization across Scotland. Ning et el. (2019) implemented a prototype system to screen flooding photos driven from social media for Hurricanes Harvey (August 2017) and Florence (September 2018) using Convolutional Neural Networks (CNNs) algorithms. Their analysis revealed that CNNs on average can detect 46% to 95% of flood objects in an image.
This study aims to discuss the workflow of a Flood Analytics Information System (FAIS version 4.00; Donratanapat et al., 2020) as an example of AIoT system. FAIS can be utilized for real-time flood data analytics and situational awareness as well as post flood impact assessment. FAIS workflow includes collecting and visualizing data from various sources, analyzing the potential at risk areas to flooding using Twitter geotagged data, providing image-based data analytics models for floodwater depth and inundation area calculation, as well as flood frequency analysis (FFA) for the USGS gauging stations. FAIS proved to be a robust and user-friendly tool for both real-time and post-event analysis of flooding at regional scale that could help stakeholders for rapid assessment of real-time flood situation and damages.
This paper is intended for researchers and developers engaged in the areas of AIoT and software development in flood related research and is organized as follows. Section Methodologies discusses different components of an AIoT system followed by a discussion on multiple algorithms used in the FAIS workflow design. Section Application presents FAIS implementation results including data collection, at-risk area calculation, data analytics and FFA. Finally, the conclusions and future work of this study is presented in Section Discussion and Future Works.
Methodologies
In this section, a general approach about AIoT system is presented along with the algorithms used to design the FAIS workflow.
Components of the AIoT system
Three main components of an AIoT system including IoT data analytics system, APIs, and AI/ML systems are explained. As shown in Figure 1, having the capability to monitor and collect real-time data through IoT devices can provide a solution for flood forecasting process and decision making. With an AIoT, AI is embedded into infrastructure components, such as programs and data analytics, all interconnected with IoT networks. APIs are then used to extend interoperability between components at the device level, software level, and platform level. In this way, AIoT acts as software-as-a-service (SaaS) to collect and analyze the data and provide timely assessment. SaaS enables data and model provision as a service and provides controlled access to data through APIs. Each component of AIoT is discussed briefly below.
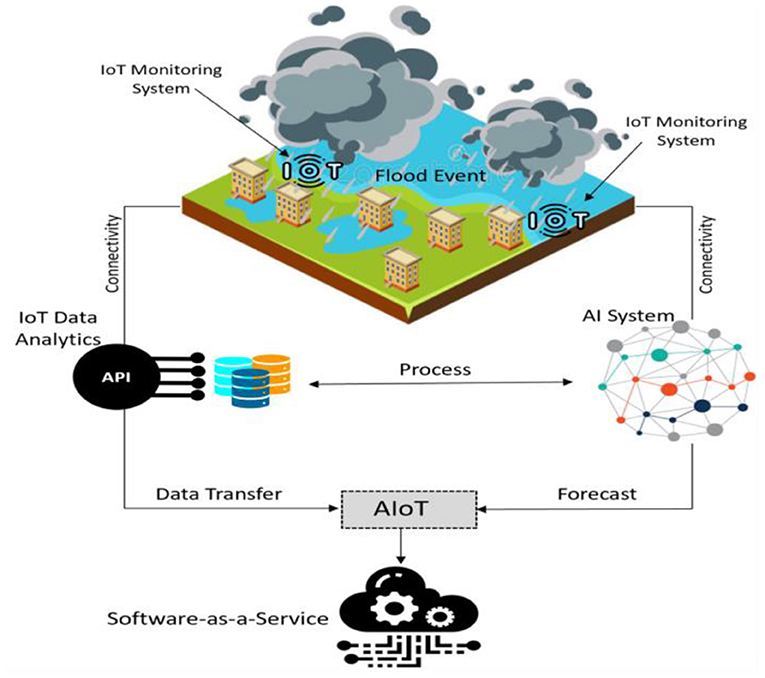
Figure 1. Different components of an AIoT system.
IoT analytics systems
Devices and technology connected over the IoT can monitor and measure big data in real time. These data can offer valuable insights to simulate flooding events across large drainage system. Around 80% of big data are image-based data (Donratanapat et al., 2020) that can be collected through IoT sensors and commercial devices such as the USGS river cameras, Department of Transportation (DOT) traffic monitoring devices, and weather tracking systems. The data can then be transmitted, saved, and retrieved at any time. The huge amount of data that IoT sensors and devices generate must be processed before the information can be used in flood related studies. However, because the data often come in different formats, there are several steps that users must take before processing or applying any type of analytics to the real-time data. These steps are:
1. Standardize or transform the data to a uniform format, ensuring that format is compatible with flood forecasting models.
2. Store or create a backup of the newly transformed format.
3. Filter any repetitive, outdated, or unwanted data to help improve forecast accuracy.
4. Integrate additional structured (or unstructured) data from other sources to help enrich flood data sets.
Flood related dataset can greatly benefit from several types of data analytics procedures including (i) Time series analytics which are based on time-based data, and data are analyzed to reveal any anomalies, patterns, or trends, (ii) Streaming analytics, referred to as event stream processing, facilitates the analysis of massive “in-motion” datasets necessary for real-time streaming and forecasting, and (iii) Spatial analytics which can be used to analyze location-based dataset to reveal various geographic patterns, determining any type of spatial relationship between various parameters in flood forecasting. The best example of spatial analytics is using geospatial patterns and data to track and map flood inundation areas in real-time.
Application programming interface
The inherent programmability and the extended use of open APIs enable innovation in areas related to monitoring, modeling, and overall operational management of flood forecasting research. APIs are used by modelers/developers for implementing various features in flood modeling tools. Developers simply use an API call within their software to implement complex features and interact one piece of code with other portions. The goal is not only to collect real-time flood dataset, but also to monitor and forecast these extreme events. To perform any flood modeling and analytics study, a data retrieval approach is required to collect data from various sources before modeling set up. The interfaces of these application programs convey data in the form of Web Feeds, such as Really Simple Syndication (RSS), Web Services and Screen Scraping. Many APIs can be accessed over the Web using the HTTP protocol based on RESTFUL or Streaming services. Web API can be used in a web server or a web browser. The speedy collection and transmission offered by various APIs provided a seamless data integration within any AIoT system.
AI systems
AI and its sub fields, machine learning and deep learning approaches, have been recently used to solve many environmental related modeling problems. These intelligent systems provide new possibilities for flood studies as more data becomes available and computing power increases. New advances in these intelligent systems provide new methods to simulate time series data (see Samadi et al., 2021) as well as image-based data (Pally and Samadi, 2022). Among many AI algorithms, deep learning methods have been recently applied to flood analytics research such as flood image label detection and recognition. In flood image processing research, deep learning methods such as CNNs can be used to extract visual information from images. CNNs are formed by layers of convolutional filters, fully connected layers, and non-linear operations (Pally and Samadi, 2022). Typically, the first layers contain filters that detect simple features like edges or color, while filters in deeper layers detect more complex features (e.g., complex shapes, objects, etc.).
FAIS structure
FAIS is an example of AIoT application for flood analytics research. The prototype is inspired by the needs to assess the impacts of successive hurricane events in the south and southeast United States. Given the massive amount of data, an automated big data and crowd sourced information system is needed to collect real-time data and create a map-based dashboard to better determine at-risk locations to flooding. These needs and discussion along with existing difficulties in gathering massive data across various Web services provided a comprehensive roadmap for the FAIS development.
FAIS is designed as both a Python package as well as a Web Python platform to collect the data during historical and real-time flood events and visualize impacted areas. FAIS uses IoTs-APIs and various machine learning approaches for transmitting, processing, and loading big data through which the application gathers information from various data servers and replicates it to a data warehouse (IBM database service). Users are allowed to directly stream and download flood related images/videos from the USGS and DOT and save the data on a local storage. The outcomes of river measurement, imagery, and tabular data are displayed on a web based remote dashboard and the information can be plotted in real-time. Several tools and algorithms are integrated within the FAIS application that are discussed below:
Data analytics approaches
To perform data analytics approaches, a new Python package called “FloodImageClassifier” was developed and integrated within the FAIS application for flood image annotation and classification. “FloodImageClassifier” uses various deep learning algorithms (i.e., CNNs) for flood image labeling, inundation area calculation, and flood level classification. Several CNN algorithms such as YOLOv3 (You look only once version 3; Redmon et al., 2016), Fast R-CNN (Region-based CNN; Girshick, 2015), Mask R-CNN (He et al., 2017), and SSD MobileNet (Single Shot MultiBox Detector MobileNet; Liu et al., 2016) were developed and integrated within “FloodImageClassifier” to detect flood labels and estimate floodwater depth. These algorithms encapsulate CNNs in an API to classify images into some categories and assign them sensible labels and scores. MAP (Mean Average Precision) index was used to determine the performance of object detection approaches which is a popular performance metric to evaluate algorithms that involve predicting the object location as well as classifying the probability of occurrence. MAP evaluates the correctness of bounding box prediction using a metric called Intersection over union (IoU). IoU is a ratio between the intersection and the union of the predicted boxes, and the ground truth boxes. Canny edge detection and aspect ratio concept (see Canny, 1986) were then programmed in the package for floodwater level estimation and risk classification. These approaches were performed in order to detect the edges of the water surface as they calculated the surface areas of water which in turn were used to determine the water level.
CNNs algorithms include non-linear approaches for label detection and segmentation such as Rectified Linear Unit (ReLU), a layer that outputs the positive part of the input, and Max-pooling, a layer that performs a non-linear down-sampling. Typically, CNNs include fully connected layers that apply a set of linear and non-linear operations to the extracted features and output a set of probabilities for each class. The multiple layers contain weights and parameters that are learned from training samples using backpropagation and gradient-based optimization methods such as Stochastic Gradient Descent (SGD) or Adaptive Moment Estimation (Adam; Kingma and Ba, 2014). “FloodImageClassifier” package uses “keras” deep learning library to build the CNNs classifier. A schematic figure of developed CNNs is illustrated in Figure 2 that consists of the following layers:
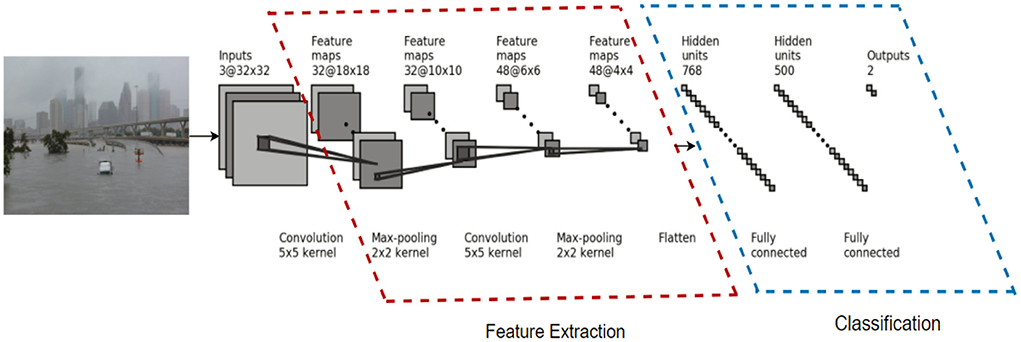
Figure 2. The architecture of floodimageclassifier package. Features within the red dash line reflect pooling layers while the features within the blue dash line represent the connected layers.
Input layer: The first layer of the CNN is the input layer which takes an image as input, resizes the image and passes the image to the next layer for feature extraction.
Convolutional layers: Three convolutional layers were designed in the model to apply small filters on each part of the image, match the feature points within the image and extract features from the image.
Pooling layer: The extracted features are passed onto the pooling layer, which helps in reducing the special dimensions by shrinking the images down while preserving the most important information within them. It picks the highest values from each region that is retained the best fits for each feature within that region.
Rectified linear unit layer: This layer normalizes the pooling layer obtained values by replacing the negative values with zeros to help the CNN stay mathematically stable.
Fully connected layers: This is the final layer which takes the filtered images as input and then divides them into categories along with their respective labels and scores.
Based on the CNN structure presented in Figure 2, four CNN algorithms including YOLOv3, Fast R-CNN, Mask R-CNN, and SSD MobileNet were developed and integrated within the FAIS application. Canny edge detection and aspect ratio concept were also programmed in the package to calculate floodwater level and risk classification. Readers are referred to Girshick (2015); Redmon et al. (2016), He et al. (2017), and Liu et al. (2016) for more information on these algorithms.
FAIS APIs
FAIS was initially developed as a python package targeting two sources of data i.e., USGS and Twitter. The package was then transferred to a web Python platform to collect the data during historical and real-time events and visualize flooding impacts. USGS collects and stores multiple water data including river flow data (flood, streamflow, gauge heights, etc.), water quality, ground water levels, and precipitation at defined gauging stations which are strategically placed at the outlets of rivers and lakes. These placements allow the USGS to correctly monitor and collect the data and compute several statistical indices related to the river flow across the nation. USGS provides two different types of flow data including real-time and historical records based on date and time. FAIS uses the USGS API to document the available service endpoints and leverage the various water data sources. Readers are referred to Donratanapat et al. (2020) for more information on the USGS API development and implementation for the FAIS application.
FAIS also gathers social media data through Streaming and Search APIs. The increasing interaction of federal agencies with social media during the flood crisis has shown that social media platforms are important tools to assess flood situations in real-time. Twitter, one of the biggest social media platforms, contains many fast-paced real-time data and a wide range of historical information regarding news and events that occur in the local and global scales. Being a famous social media, local residents, and government agencies use Twitter to provide information during catastrophic events. For example, during Hurricane Florence (2018), many residents in SC tweeted real-time information about the local damage, road closure and shelter information. The government agencies such as NWS, NHC, SCDOT, and USGS also used Twitter to provide updates about the damaged infrastructure, emergency situations, and resources in real-time and during post-event. These data are valuable because they can provide location specific information about flooding conditions in real-time.
FAIS application collects tweets using two different approaches, i.e., Search and Streaming APIs. These two approaches are based on two use cases of the applications which are historical data gathering as well as streaming/real-time data collection. Search API is more suited to singular and specific queries of tweets, whereas the Streaming API provides a real-time stream of tweets. The Tweepy Python package is first integrated within the FAIS application and implemented for accessing and collecting the Twitter data. Twitter developer account was then used to access Token, Token Secret, Consumer Key, and Consumer Secret to manipulate Twitter functionalities.
In addition, a bot software was developed and integrated into the FAIS prototype as part of real time crowd intelligence mechanism for Twitter data gathering. The developed Twitter bot allows users to monitor every tweet and automates all or part of Twitter activities. Specifically, the developed bot (see Figure 3) allows the user to query tweets from Twitter by a specific user and/or keyword using both Search and Streaming APIs. A reusable Python module or a module configure was created that contains logic steps for implementing the bot functionalities. This module reads the authentication credentials from environment variables and creates the Tweepy API object. The bot reads the credentials from four environment variables including CONSUMER_KEY, CONSUMER_SECRET, ACCESS_TOKEN, and ACCESS_TOKEN_SECRET. After reading the environment variables, the bot creates the Tweetpy authentication object that eventually can be used to create an API object. The administrator can choose to activate or deactivate the bot and change the keywords for Streaming purposes. FAIS Twitter bot contains three main components notably:
1. Twitter Client: This component communicates with the Twitter API and authenticates the connection to use its functionality. Twitter Client also hosts a function called tweets_listener, that continuously stream tweets and search for the matched keywords. Once tweets_listener finds the match it will then communicate to the other two components.
2. Tweet Analyzer: It analyzes the tweets and gives the result a score after a match is found.
3. Twitter Streamer: This module streams tweets from pre-specified eight keywords, analyzes the data, and organizes them into a data frame. The collected tweets then store in a MongoDB database and display on the FAIS Twitter Streaming section as tabular data. The workflow explaining how the bot gathers real time tweets using the Twitter bot is illustrated in Figure 3.
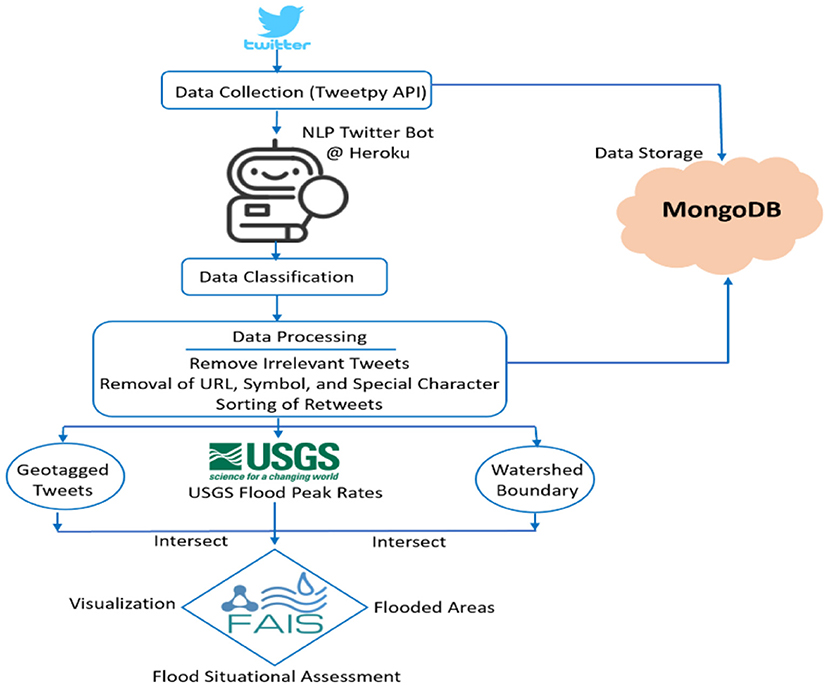
Figure 3. The workflow of Twitter APIs and Twitter bot designed in the FAIS application.
Flood frequency analysis approach
FAIS provides frequency analysis to estimate extreme flood quantiles that combines elements of observational analysis, stochastic probability distribution and design return periods. FFA techniques predict how flow values corresponding to specific return periods or probabilities along a river could change over different design periods. FFA can be used to estimate the design flow values corresponding to specific return periods for designing structures such as dams, bridges, culverts, levees, highways, sewage disposal plants, waterworks, and industrial buildings. FFA is useful in providing a measurement parameter to assess the damage corresponding to specific flow during flooding event. Accurate estimation of flood frequency not only helps engineers in designing safe infrastructure but also in protection against economic losses due to maintenance of structures. FAIS uses several Python packages such as “scipy.stats” (Bell et al., 2021) and “reliability” (Reid, 2021) to retrieve annual peak flow rates for provided years and calculate distribution parameters to create frequency distribution graphs. The tool fits various probability distributions including Normal, Lognormal, Gamma, Gumbel, Pearson Type III, Weibull, and Loglogistic distributions. These distributions and their probability density functions, and mathematical formulations are presented in Table 1. However, the accuracy of FFA estimates may vary using different probability distributions. Hydrologists typically recommend using Pearson Type III, but other distributions such as Gumbel function can be also used for a river system with less regulation and less significant reservoir operations, diversions, or urbanization effects. It is also important to quantify the precision of estimates, so the tool calculates flood frequencies within 95% confidence interval and provides the accuracy of the calculation. A 95% confidence level indicates that the interval between lower bound and upper bound contains the true value of the population parameter (flood data).
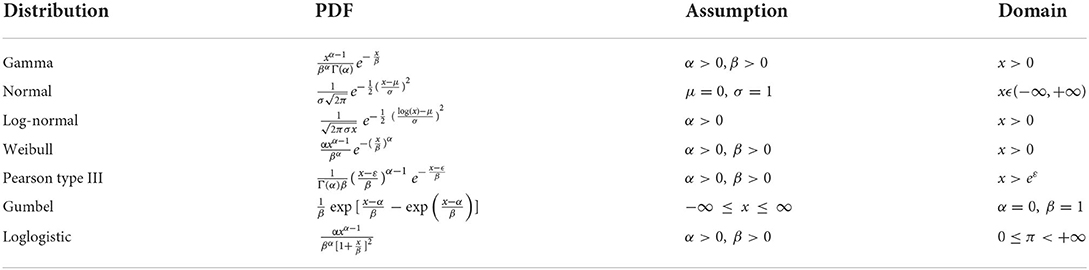
Table 1. Probability distributions and their density functions used in the FFA section of FAIS application.
The usual domains for these seven distributions are the whole real line for the normal density functions and values larger than ε for the Pearson Type III density function, which can, in principle, be any real number. The Pearson type III distribution has been adopted in many FFA assessment as the standard distribution because of its better fit and performance (Sumioka et al., 1997). If ε = 0, then Pearson type III distribution reduces to the gamma distribution. The default estimation parameter method for these distributions is maximum likelihood estimation (MLE), although other approaches such as least-squares, weighted moments, linear moments, and entropy to compute parameter values are also used in the prototype. Readers are referred to Vogel et al. (1993) and Singh (1996) for more information on the probability distributions for FFA and parameter estimation methods.
Application
FAIS implementation
Different components of the FAIS prototype were implemented for collecting data and assessing flood risk and identifying at-risk areas to flooding in real-time. These executions are explained below.
USGS data gathering
FAIS uses USGS APIs for real-time and historical data collection as well as images collection from the USGS river cameras. Users can collect real time and historical discharge (cfs) and gauge height (ft) data and display the gauge geolocation using the FAIS visualization dashboard. A summary of data including maximum gauge height, latitude, longitude, and elevation can also be retrieved on the map dashboard by clicking on each USGS station. Gathering USGS historical data involves selecting the target state, the interested station, and the date. After the query criteria is entered, FAIS creates a request URL and sends it to the USGS server for collecting the data. The prototype displays the data as “Table View” as well as “Map View” and plots the results (see Figures 4–6). Users can also upload a .csv format file of all the collected data that contains station name, ID, latitude, longitude, discharge, gauge height, and the USGS original URL. The prototype also gathers the USGS flow data through HydroShare Web services (results not shown here). It uses HydroShare Representational State Transfer (REST) API to access the data through the Web user interface programmatically.
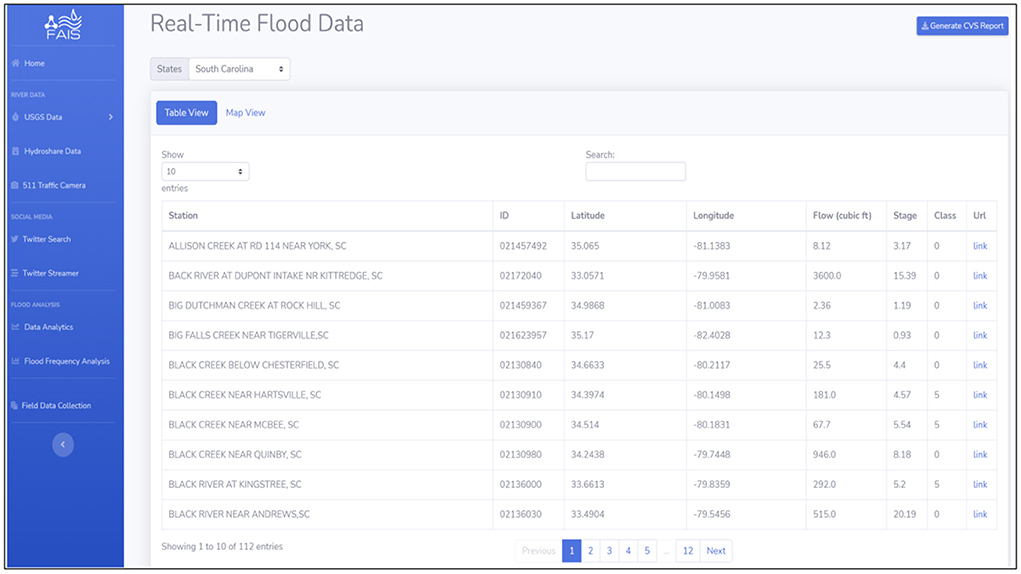
Figure 4. USGS real-time flood data gathering interface. Users can download a .csv file of the data and visit the original data sources at the USGS portal.

Figure 5. Map view interface of the USGS flood gauges. A summary of data for each gauging station can be retrieved from Map View section.
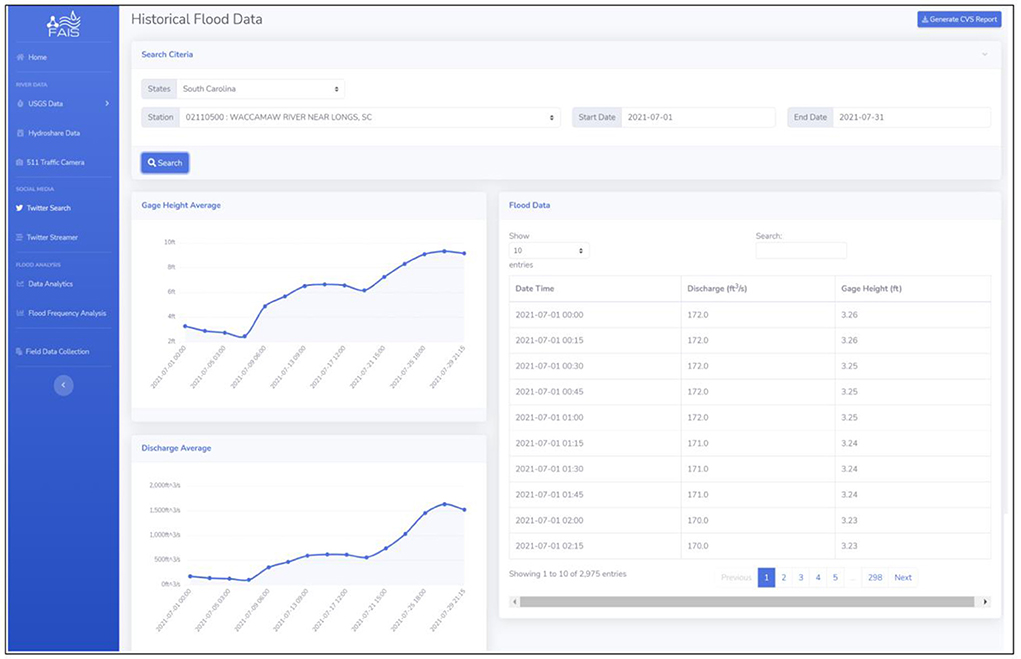
Figure 6. USGS historical flood data collection and visualization interface. Users can display the data for any state and any USGS station by selecting the state and USGS gauging station. A .csv format file of the data can be also downloaded directly from the interface.
Flood risk assessment using Twitter geotagged data
During flooding events, citizens use Twitter to share flood information such as damages, road closure, shelter information, etc. Government agencies such as NWS, NHC, DOT, and USGS also use Twitter to disseminate data and updates about flooding conditions, damaged infrastructure, emergency situations, evacuation route, and other resources. A tweet can provide a variety of information, such as text, images, videos, audio, and additional links. In addition, there is also a significant number of metadata that is attached to each tweet. This metadata includes information regarding geolocation (either a place name or coordinates), the author's name, a defined location, a timestamp of the moment the tweet was sent or retweeted, the number of retweets, the number of favorites, a list of hashtags, a list of links, etc. This information is valuable and has the potential to provide reliable information and actionable intelligence when attempting to extract tweets and use themto assess flood situations.
FAIS uses NLP to cleanse, filter, and group flood related tweets including tweet geolocation information, related images, etc. To accomplish this need, a Twitter Streaming bot (functions on both iOS and Mac) was developed and deployed at Heroku cloud platform outside of the application access which is controlled by the Heroku User Interface. Heroku is a cloud platform as a service (PaaS) that enables system-level supervision and coordination of Twitter APIs, crowd sourced data, and tweets. Twitter bot automates tweet gathering and continuously cleans and monitors all Twitter activities during real time implementation. During a real-time flooding event, the bot gets notification when new content, such as tweets that match certain criteria (keywords) is created. Overall, eight keywords including “Flood Damage,” “Road Closure,” “Emergency Management and Response,” “Flooded Neighborhood,” “Infrastructure Damage,” “Evacuation Route,” “Shelter and Rescue,” and “Storm Surge” are incorporated into the Twitter data gathering section.
FAIS was used to identify at-risk areas to flooding during Hurricane Laura. Hurricane Laura was a deadly and destructive category 4 hurricane that made landfall in the U.S. state of Louisiana (LA) in August 2020. While impacted many countries and people on its path, Laura prompted many warnings and watches across LA coastal communities. Early on August 27, Laura made landfall near peak intensity on Cameron, LA and was recorded as the tenth-strongest U.S. hurricane that made landfall by wind speed on record. When Laura approached LA, FAIS application was used to constantly stream the tweets and identify at-risk areas to flooding. Georeferenced tweets were gathered and filtered by eight keywords (mentioned above) and queries across the shortlisted areas in LA. The retrieved tweets were then used to intersect a maximum of seven locations with the USGS peak flood rates and watershed boundary. Geotagged tweets coordinates considered as a center-point for ~16 km wide square boxes. This size is arbitrarily chosen to cover the areas nearby to each gauge. These seven at-risk locations were monitored during Hurricane Laura for any updated tweets whose geotag intersected a bounding box, which constituted a “match.” The retrieved tweets were then stored in a MangoDB database which is widely used as an open-source database to store JSON format files. Due to the size of queried data, the Twitter bot filtered the data (>95% of uninterested/mismatched tweets) and only kept those flood related tweets that match the eight keywords mentioned above along with the text, geolocation, author ID, and date.
To identify at-risk locations, FAIS first cycles through a set of USGS web addresses to find river gauge height readings, parsing these flat files using Python web scraping technique and obtaining all the latest river levels. Each river level reading is compared with its respective long term cached average level to identify the highest relative river levels in real-time. The highest river level will then be intersected with watershed polygons as well as geotagged tweets (filtered by Streaming bot) to identify flooded locations in real-time. To update at-risk locations in real-time, a shell script in Python runs on a local computer server, the script is reset every 3 h to update at-risk areas to flooding from the latest national and environmental data sources as well as geotagged data. A period of 15 min was initially chosen as the intended trade-off between tracking the latest at-risk location forecasts. API updates can be varied between 15 min to several hours but based on real-time testing the period extended to 3 h to allow some reaction time from those areas on Twitter. However, the choice of time period depends solely on the project requirements as well as the flooding impact and severity. During Hurricane Laura, the time between a tweet appeared online and visually plotted in the FAIS as being potentially relevant (in terms of location and content) was in the order of few seconds to 2 min, thereby this rapid analysis could provide an early information channel to the stakeholders for emergency management, asset allocation and rescue plan. A web-based console and a visualization tool—GeoJSONLint13—are used in the FAIS application to view results and inspect the polygons. In addition, the prototype was operationally tested during Hurricane Dorian (September 04-06, 2019) in the Carolinas and georeferenced tweets were also gathered in real-time to identify at-risk locations to flooding (see Donratanapat et al., 2020). A list of real-time tweets is presented in Table 2. The tweets were then used to intersect with the USGS gauging stations and watershed boundary to identify at-risk areas (see Figure 7).
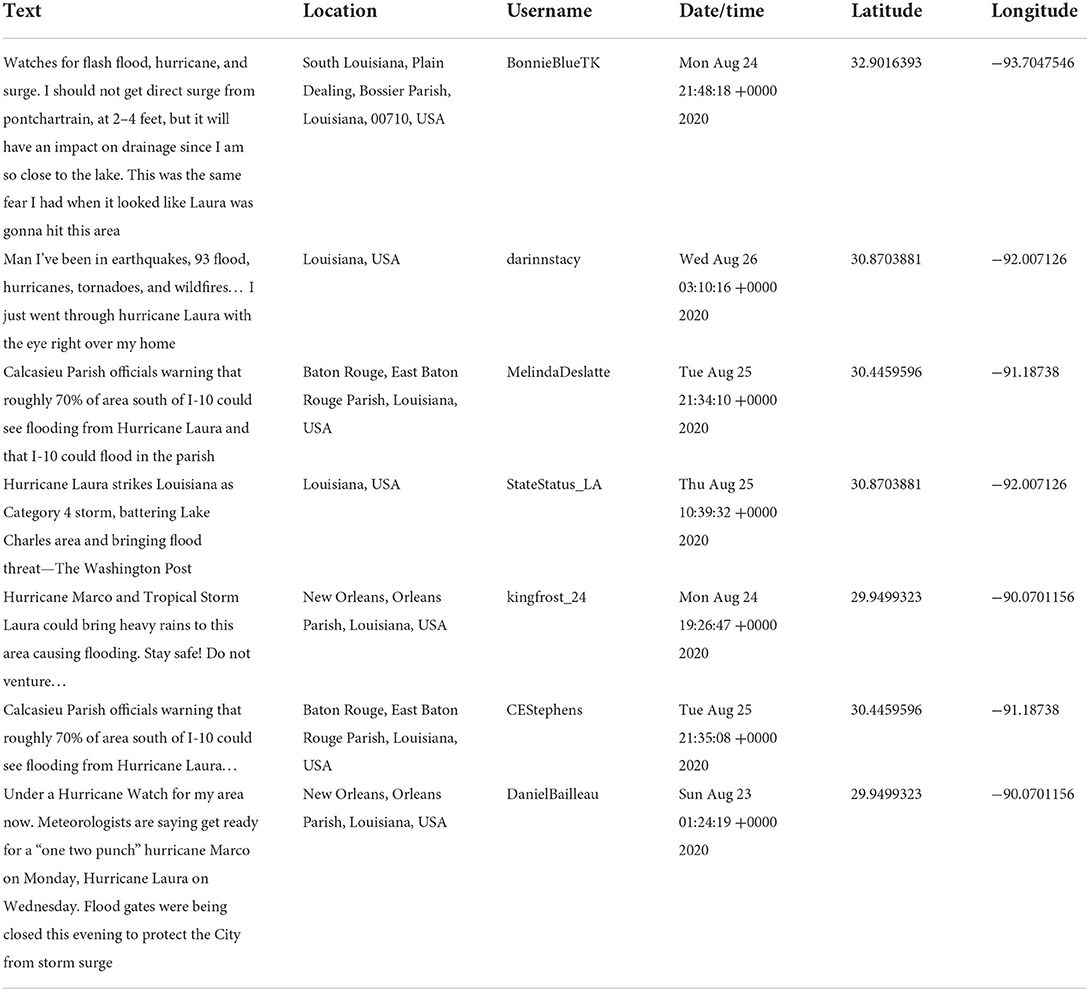
Table 2. The relevant tweets and tweet geolocation and time for 12 at-risk locations in LA during Hurricane Laura flooding.
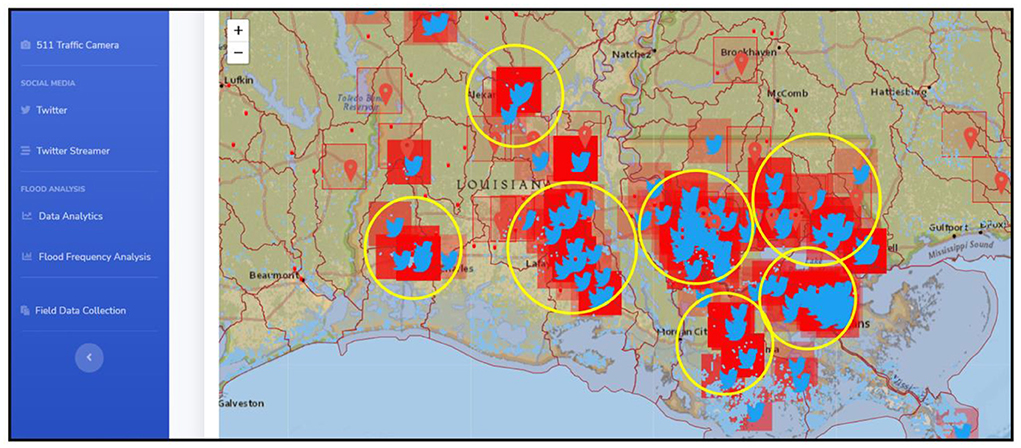
Figure 7. At-risk locations to Hurricane Laura in LA. Yellow circles indicate at-risk locations identified by using collected tweets in real-time that were intersected with the USGS peak flood data as well as the watershed boundary. Note that FAIS streaming approach intersects ≥ 3 tweets with the USGS peak flow rates and disregards <3 tweets for intersection.
Big data analytics
Data analytics section of the FAIS application uses “FloodImageClassification” package for flood image labeling, inundation area calculation, and flood level classification. Four CNN algorithms such as YOLOv3, Fast R-CNN, Mask R-CNN, and SSD MobileNet were programmed in the “FloodImageClassification” package to detect flood labels and estimate flood depth and inundation area. These algorithms encapsulate CNNs in an API to classify images into some categories and assign them sensible labels and scores. Less than eight thousands flood images were first collected from the USGS river web cameras, DOT traffic images, and search engines such as Google and Bing. The data were formatted and split into training and test datasets. The models were trained for 27 epochs with a batch size of 72. The images were partitioned into training and testing sets in the ratio of 9:1. The images present within the training set were resized and normalized before training. Once all the images were resized and normalized, “labelIme” Python package was used to annotate these images with eight different object categories such as “vehicle,” “forest,” “tree,” “traffic sign,” “water vessels,” “residential areas,” and “critical infrastructure.” Annotation of images involves highlighting each of the objects within an image manually using bounding boxes and labeling them appropriately. MAP index was used to determine the performance of each object detection algorithm. Canny edge detection and aspect ratio concepts were also used to calculate flood depth and inundation areas.
Given an input image, images were first resized and converted into a grayscale. Next, the skyline was identified and eliminated from the images. Since both water and skyline have the same color gradient, it is possible the skyline could be detected as a water surface. Therefore, the skyline was eliminated and a portion of images consisting of the water surface was taken into consideration. For each image, the edges of the water surface were first detected, and the associated contour was automatically drawn around the water surface and the area of the contours (i.e., the area of water surface) was calculated. Next, based on the aspect ratio which is calculated by taking into consideration the area of water surface, the floodwater level was estimated. The estimations were then categorized into “shallow,” “moderate,” and “deep” to reflect flood risk conditions. This process is automated in Python to provide the user a seamless procedure to perform data analytics in the FAIS application. This automatics procedure takes on average about 2–3 min to complete. As illustrated in Figures 8–11, it is evident that the CNN models were capable of detecting multiple objects within a single image as it almost detected 90% of the objects precisely. However, object detection models produced different outcomes. Segmentation models such as Mask R-CNN identified the foreground shapes and highlighted the objects using bounding boxes as well as by drawing a mask on the object. This helped in clearly segmenting one object from another one whereas other object detection models such as Fast R-CNN, YOLOv3, and SSD MobileNet highlighted the detected objects using a single bounding box only.
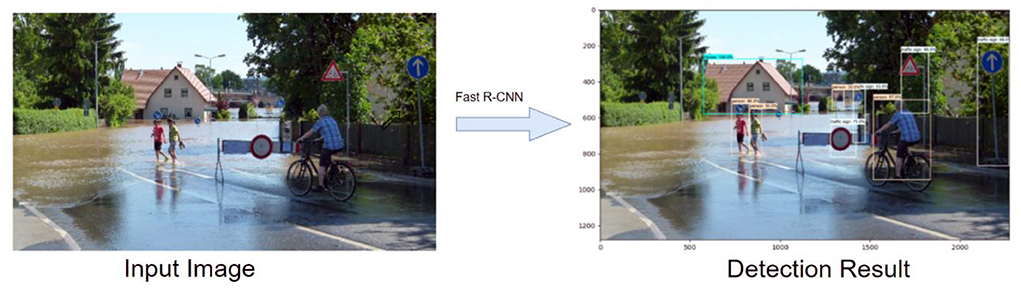
Figure 8. The Fast R-CNN detection results with bounding boxes.
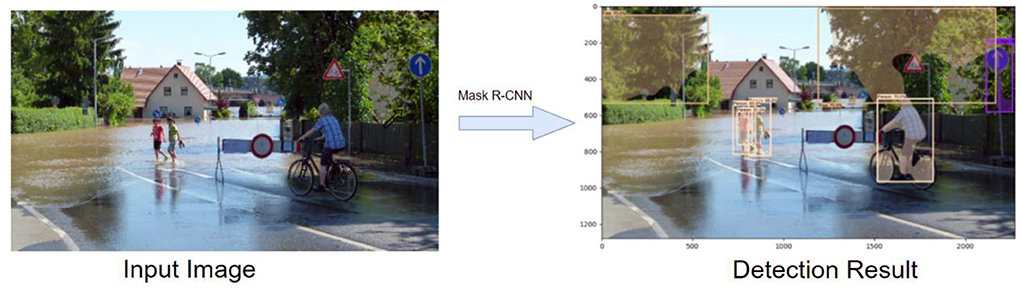
Figure 9. The Mask R-CNN detection results with bounding boxes.
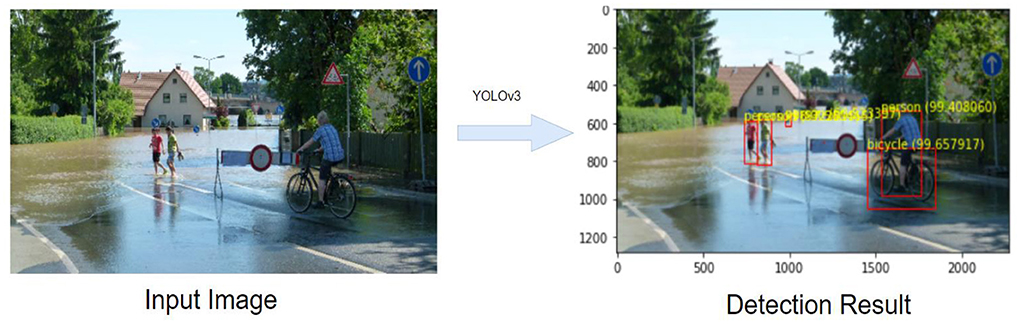
Figure 10. YOLOv3 detection results with bounding boxes.
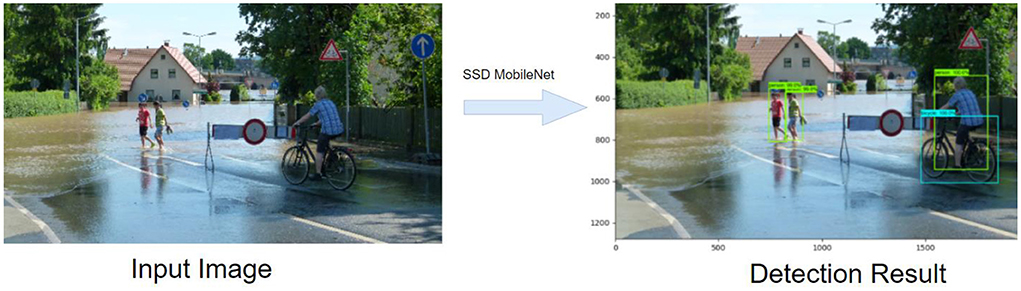
Figure 11. SSD MobileNet detection results with bounding boxes.
The prediction scores (MAP) of different CNN models were calculated for different object categories namely vehicle, person, forest, tree, traffic sign, residential area (i.e., houses), water vessels (i.e., boats, ships, etc.) and critical infrastructure (bridges, dams, etc.) by passing the same set of test images to each of these four CNN models (Table 3). This determined which of these models is the best object detection approach for flood images. Results revealed that Mask R-CNN and Fast R-CNN were particularly skillful in detecting labels and segmenting them, although Mask R-CNN showed better performance in detecting labels. The processing to perform object detection for each CNN algorithm varies between 2 and 4 min depending on the system memory and processor.
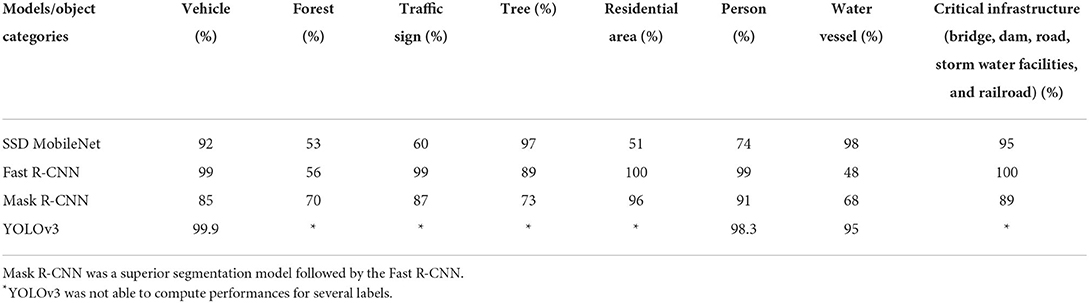
Table 3. The prediction score of different labels using multiple CNNs.
Once the detection results were generated by CNN models, each detected object was removed from the images and the images were reconstructed by filling the void spaces in a plausible manner using exemplar based inpainting (see Criminisi et al., 2003). We used partial convolutions with an automatic mask update to fill in the voids within an image. Image inpainting model substituted convolutional layers with partial convolutions and masked the updates. This algorithm successfully identified the target region which was filled using the surrounding areas of the target region as reference. The filled region was used to calculate floodwater depth and inundation area. As shown in Figure 12, the edges of the water surface (i.e., the drawn contours) was first detected and then the area of the water surface was calculated. To isolate the water surface from the other objects that were highlighted, OpenCV's findContours() function was used to identify the foreground mask shapes and to draw contours around them. Next, the area of each of the contours was calculated, the contour areas were then sorted and only the largest contour was printed over the original image, allowing us to accurately segment and calculate the water surface area (flood inundation area). The area is also calculated based on the pixel dimensions and the number of pixels located in the flooded area. After highlighting the water surface using contours, a bounding box was drawn around the contour to calculate the aspect ratio. The aspect ratio value is used to determine the floodwater level as shown in Figure 12. If the aspect ratio is in a range of 1.27–1.8 the floodwater level is then considered to be low, if the aspect ratio is in a range of 0.54–1.26 the floodwater level is considered to be moderate, and if the aspect ratio is in a range of 0.18–0.54 and less than 0.18 (<0.18) the floodwater level is considered to be high (sever flood risk; see Table 4).
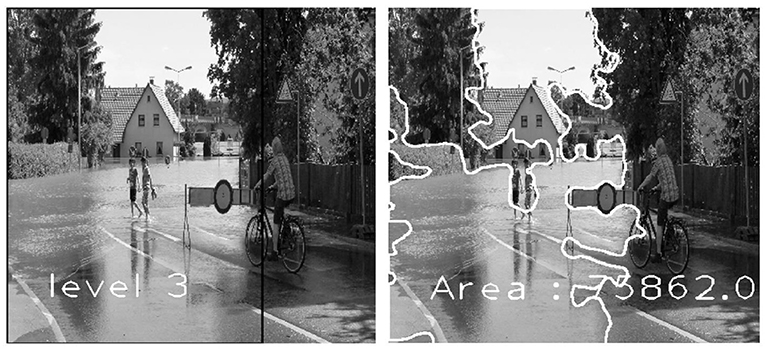
Figure 12. Floodwater depth estimation (Level 3) using canny edge detection and aspect ratio approach along with the calculated area (75862.0 based on pixel width and length dimension).
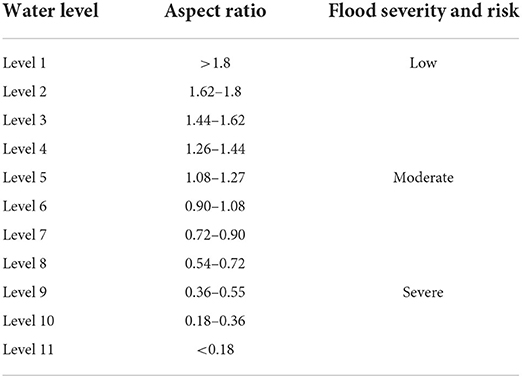
Table 4. Water levels associated with Aspect Ratios and flood severity and risk estimation.
FFA for the USGS 02147500 Rocky Creek at Great Falls, SC
FAIS uses multiple probability distributions such as Normal, Lognormal, Gamma, Gumbel, Pearson Type III, Weibull, and Loglogistic distributions to compute FFA for any given flood gauging station in US. Figure 13 shows FFA results for the USGS02147500 Rocky Creek at Great Falls, SC. Among several probability distributions, Loglogistic distribution was a perfect fit followed by the Weibull distribution. Both log-Pearson type III and log-normal distributions were also showed appropriate fits when the maximum likelihood method was used for parameter estimation. As illustrated, all annual flood data points (overall 64 data points) were bracketed within 95% uncertainty bound using the Loglogistic distribution while the uncertainty bound for the Weibull distribution skillfully bracketed moderate flood rates and showed less performance with respect to low and maximum flood data. Analysis suggests that annual flood peak of ~15,000 cfs for the Rocky Creek represents a design return period of 25-year. The design discharge of a 100-year flood (1% probability) occurring at the USGS02147500 gauging station is >30,000 cfs. This gauge is associated with Lower Catawba basin (hydrologic unit code 03050103) Chester County, SC with a drainage area of 194 square miles which is mostly a rural basin. FFA for this location proved that high peak values made critical contributions to the upper tail of the Loglogistic probability distribution.
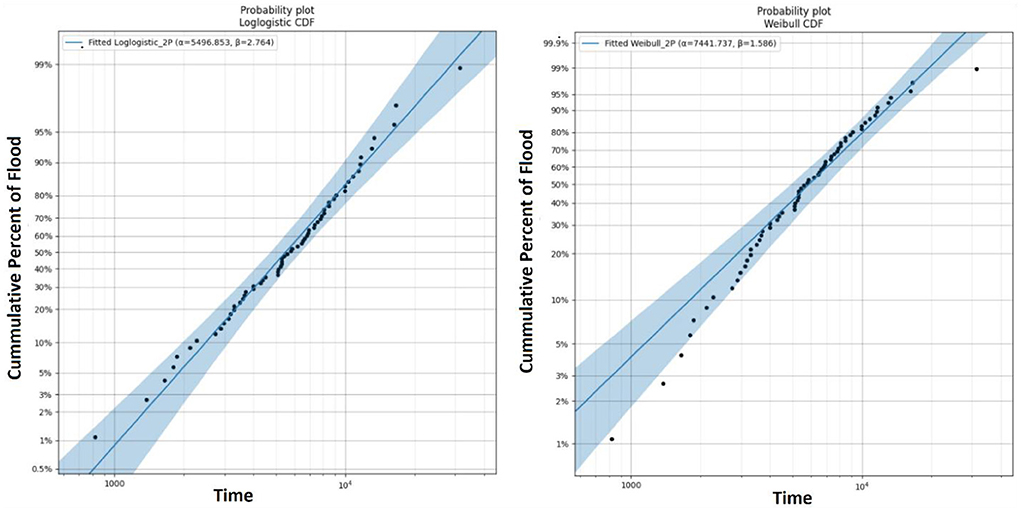
Figure 13. FFA for the USGS 02147500 using Loglogistic and Weibull distributions.
FAIS application also provides a .CSV format file of FFA that can be downloaded from the interface. The use of FAIS application for FFA provides an easy assessment for the design of engineering structures such as culverts, bridges, and dams. With the many challenges facing existing probability distribution fitting and performance calculation for a given design problem, FFA functions, numerical estimation and uncertainty calculation, and graphical capabilities together with its flexibility to fit multiple distributions, can go a long way. This makes FAIS application an ideal tool to assess flood frequencies for any USGS gauging station. It should be noted that FFA builds a predictive model based on existing flood data, so the accuracy is greatly enhanced with a larger dataset (>10 years).
Discussion and future works
This article elaborated on the latest concepts related to AIoT in flood related research, emphasizing the architectures and functionalities of this approach and how these capabilities were used to design FAIS application. AIoT brings AI capabilities and IoT power to flood related research, enhances data management and analytics, and aids in intelligent decision-making process. As AIoT continues to evolve into a computing paradigm endowed with a high computing rigor, it has become apparent that traditional solutions for training, validation, and testing models are no longer appropriate for flood computational challenges brought about by the big data and catchment complexities.
As an AIoT paradigm, FAIS enables real-time flood data gathering and analytics across different domains. This prototype has been driving the confluence of IoT, deep learning, and big data to enable a real-time assessment of domain-inspired intelligent architectures for AI-driven decision making and discovery. FAIS was developed as a national scale prototype for flood data analytics assessment, based on both historical and real-time flood warning and river level information, as well as crowdsourced processing of tweets. This included automated selection and analysis of large volumes of geotagged and relevant social media data, and recent advancement in data analytics algorithms. FAIS application intelligently identifies at-risk areas to flooding in real time and defines the geospatial footprint of a flood event using georeferenced tweets. The application also uses various image processing algorithms to detect labels and calculate flood depth and inundation areas. Overall, FAIS pipeline proved to be a robust and user-friendly AIoT prototype for both real-time and post-event analysis of flooding data at local scale that could help stakeholders for rapid assessment of flood situation and damages. Improved data collection and timely assessment of at-risk locations allow more efficient mutual aid in the operational theater for warnings and evacuations, and more effective search and rescue plans while enabling automatic dispatching of relief resources and evacuation plans.
The versatility of the AIoT approaches brings the intelligence and a new paradigm in flood computing and modeling. AIoT enables data provision as a service and provides controlled access to this data through APIs that ensures fast and accurate analysis of data across catchment scales. As the technologies reach different application sectors due to specific domains and data, the AIoT paradigm will evolve and expand in future heading to significant developments in terms of research and innovation. However, there are several challenges that need to be addresses to see AIoT full potential in flood research and applications. Given the huge number of devices, AIoT requires simultaneous connectivity and functional scalability that have become a concern for real-time application. Other deficiencies such as fault tolerance and data storage and complexities add more challenges to the AIoT application for real-time decision making. Moreover, the current data services do not support the reuse of data exploration processes and the data derived from analytics systems. Limitless analytics service combined with deep learning, data lake and data warehouse to process streaming data, and automated data lifecycle management are promising ways forward. Although, enabling AIoT interoperability for connecting data services and analytics requires solutions that must be realistic and scalable to multiple data platforms with the possibility to plug and play dynamically new analytics tools and AI algorithms.
More effort should be made to leverage AIoT application to better manage flood risk, make timely and effective decisions and forecast, and automate flood forecasting operations. For instance, improving the intelligence of AIoT systems to handle dynamic and complex environments using Edge computing could potentially handle hybrid models and reduce forecasting time by bring decentralized computing power as close as possible to the origin point of the data. In the future, empowered by rapidly developing AI technologies and big data analytics, many fast, smart, and safe AIoT applications are expected to deeply reshape flood related research and applications.
Software and data availability
FAIS-v4.00 application is publicly available at Clemson-IBM cloud service. FAIS python package is also available at the author GitHub account. The data and flood images used to perform this research is available upon request.
Data Availability Statement
The original contributions presented in the study are included in the article/supplementary material, further inquiries can be directed to the corresponding author.
Author Contributions
The author confirms being the sole contributor of this work and has approved it for publication.
Funding
This work was supported by the U.S. National Science Foundation (NSF) Directorate for Engineering under grant CBET 1901646.
Conflict of interest
The author declares that the research was conducted in the absence of any commercial or financial relationships that could be construed as a potential conflict of interest.
Publisher's Note
All claims expressed in this article are solely those of the authors and do not necessarily represent those of their affiliated organizations, or those of the publisher, the editors and the reviewers. Any product that may be evaluated in this article, or claim that may be made by its manufacturer, is not guaranteed or endorsed by the publisher.
Author disclaimer
Any opinions, findings, and discussions expressed in this study are those of the authors and do not necessarily reflect the views of the NSF.
Acknowledgments
The author acknowledges IBM company for providing free credits to deploy and sustain FAIS application.
References
Barker, J. L. P., and Macleod, C. J. A. (2019). Development of a national-scale real-time Twitter data mining pipeline for social geodata on the potential impacts of flooding on communities. Environ. Model. Softw. 115, 213–227. doi: 10.1016/j.envsoft.2018.11.013
Bell, P., Evgeni, B., Justin, C., Ralf, G., Matti, P., Tyler, R., et al. (2021). SciPy User Guide. Available online at: https://docs.scipy.org/doc/scipy/reference/
Canny, J. (1986). “A computational approach to edge detection,” in IEEE Transactions on Pattern Analysis and Machine Intelligence, PAMI-8, 679–698.
Criminisi, A., Perez, P., and Toyama, K. (2003). “Object removal by exemplar-based inpainting,” in Computer Vision and Pattern Recognition, 2003. Proceedings. 2003 IEEE Computer Society Conferenceon, Vol. 2 (Wisconsin, DC: IEEE), II.
De Albuquerque, J. P., Herfort, B., Brenning, A., and Zipf, A. (2015). A geographic approach for combining social media and authoritative data towards identifying useful information for disaster management. Int. J. Geogr. Information Sci. 29, 667–689. doi: 10.1080/13658816.2014.996567
Demir, I., Yildirim, E., Sermet, Y., and Sit, M. A. (2018). FLOODSS: Iowa flood information system as a generalized flood cyberinfrastructure. Int. J. River Basin Manag. 16, 393–400. doi: 10.1080/15715124.2017.1411927
Donratanapat, N., Samadi, S., Vidal, M. J., and Sadeghi Tabas, S. (2020). A national-scale big data prototype for real-time flood emergency response and management. Environ. Model. Softw. 133, 104828. doi: 10.1016/j.envsoft.2020.104828
Feng, Y., and Sester, M. (2018). Extraction of pluvial flood relevant volunteered geographic information (VGI) by deep learning from user generated texts and photos. ISPRS Int. J. Geo Information 7, 39. doi: 10.3390/ijgi7020039
Fries, K.J., and Kerkez, B.. (2018). Using Sensor Data to Dynamically Map Large-Scale Models to Site-Scale Forecasts: A Case Study Using the National Water Model. Water Resources Research, 54, 5636–5653.
He, K., Gkioxari, G., Dollár, P., and Girshick, R. (2017). “Mask r-cnnR-CNN,” in Proceedings of the IEEE International Conference on Computer Vision (Venice: IEEE), 2961–2969.
Kingma, D. P., and Ba, J. (2014). “Adam: a method for stochastic optimization,” in Proceedings of the International Conference on Learning Representations (San Diego, CA).
Liu, W., Anguelov, D., Erhan, D., Szegedy, C., Reed, S., Fu, Y.-C., et al. (2016). “Ssd: single shot multibox detector,” in Computer Vision - ECCV 2016, eds B. Leibe, J. Matas, N. Sebe, and M. Welling (Cham: Springer International Publishing), 21–37.
Pally, R., and Samadi, S. (2022). Application of image processing and convolutional neural networks for flood image classification and semantic segmentation. Environ. Model. Softw. 148, 105285. doi: 10.1016/j.envsoft.2021.105285
Redmon, J., Divvala, S., Girshick, R., and Farhadi, A. (2016). “You only look once: unified, real-time object detection,” in Proceedings of the IEEE Conference on Computer Vision and Pattern Recognition (Las Vegas, NV: IEEE), 779–788. doi: 10.1109/CVPR.2016.91
Reid, M. (2021). A Python Library for Reliability Engineering. Available online at: https://reliability.readthedocs.io/en/latest/About%20the%20author.html
Samadi, S., and Pally, R. (2021). The Convergence of IoT, Machine Learning, and Big Data for Advancing Flood Analytics. European Geophysical Union. Oral Presentation. Available online at: https://meetingorganizer.copernicus.org/EGU21/EGU21-7782.html
Samadi, S., Sadeghi Tabas, S., Wilson, C., and Hitchcock, D. (2021). “Big data analytics for rainfall-runoff modeling: a case study of the cape fear catchment, North Carolina. Book chapter for the AGU/Wiley edited volume,” in Advances in Hydroinformatics: Artificial Intelligence and Optimization for Water Resources, eds D. Solomatine and G. Corzo (IHE Delft for Water Education) (in press).
Singh, V. P. (1996). Entropy-Based Parameter Estimation in Hydrology. Dordrecht: Kluwer Academic Publishers.
Starkey, E., Parkin, G., Birkinshaw, S., Large, A., Quinn, P., and Gibson, C. (2017). Demonstrating the value of community-based ('citizen science') observations for catchment modelling and characterisation. J. Hydrol. 548, 801–817. doi: 10.1016/j.jhydrol.2017.03.019
Sumioka, S. S., Kresch, D. L., and Kasnick, K. D. (1997). Magnitude and Frequency of Floods in Washington. USGS Water Investigations Report 97-4277. Washington, DC.
Keywords: artificial intelligence of things, flood analytics information system, at-risk locations, flood image processing, convolutional neural networks
Citation: Samadi S (2022) The convergence of AI, IoT, and big data for advancing flood analytics research. Front. Water 4:786040. doi: 10.3389/frwa.2022.786040
Received: 29 September 2021; Accepted: 27 June 2022;
Published: 15 July 2022.
Edited by:
Samrat Chatterjee, Pacific Northwest National Laboratory (DOE), United StatesReviewed by:
Hiba Baroud, Vanderbilt University, United StatesSiddharth Saksena, Virginia Tech, United States
Copyright © 2022 Samadi. This is an open-access article distributed under the terms of the Creative Commons Attribution License (CC BY). The use, distribution or reproduction in other forums is permitted, provided the original author(s) and the copyright owner(s) are credited and that the original publication in this journal is cited, in accordance with accepted academic practice. No use, distribution or reproduction is permitted which does not comply with these terms.
*Correspondence: S. Samadi, c2FtYWRpQGNsZW1zb24uZWR1