 Brian Davidson
 Petra Hellegers2
- 1School of Agriculture and Food, The University of Melbourne, Melbourne, VIC, Australia
- 2Water Resources Management Group, Wageningen University & Research, Wageningen, Netherlands
- 3Melbourne School of Engineering, The University of Melbourne, Melbourne, VIC, Australia
In this study, the physical and economic impacts of four policy measures (crop diversification, improved watershed development, canal lining and reducing the level of reliability) all designed to improve bulk water supply, are assessed in a case study of the Musi catchment of India. The aim is to compare the impacts these policy measures have on the amount of bulk water supplied and the net economic returns across a complex multi-nodal catchment. It is argued that because it is policymakers who make decisions regarding these measures, an assessment of the private benefits to a subset of users would not be adequate. Rather, the society wide costs and benefits need to be considered. Using a hydroeconomic model of the catchment it was found that reducing the level of reliability was the most beneficial outcome from both a physical and economic perspective. The other three measures were found to have some adverse impacts on regions not directly affected by the measure.
Highlights
- Reducing the level of reliability across the catchment was found to be more beneficial than either improving crop diversification, watershed development or improving the transmission of bulk water supplies in terms of both water supplied and net economic returns.
- Measures, such as crop diversification, watershed development and improving transmission, introduced to improve the bulk water supplies in one part of a catchment have some wider detrimental physical and economic impact on other parts of the catchments.
- Policy makers need to make decisions about bulk water supplies from the perspective of the whole of society across a catchment, using techniques that do not concentrate on narrow private sectorial interests.
- Policymakers should consider altering the rules and operations of water systems that maintain the level of reliability, reducing them, when considering measures designed to increase the quantity of bulk water supplied.
Introduction
The challenges policymakers face in increasingly water scarce catchments, where there is increased intersectoral competition, burgeoning populations, and climate change concerns, have been well documented (Mekonnen and Hoekstra, 2016; Liu et al., 2017; Veldkamp et al., 2017). In response to concerns about the long-term viability and the sustainability of water use in a catchment, policymakers usually suggest measures1 that are designed to maintain and/or improve bulk water supplies (Kahil et al., 2015; Villanueva and Glenk, 2021). These measures generally fall into one of three categories:
• Improving the efficiency of water delivery by reducing losses, such as lining canals and enhancing reservoirs, which can be thought of as a measure to improvement transmission;
• Harvesting water more intensively through some form of watershed development (hereafter WSD), a supply-side measure; and/or,
• Managing how people use water by encouraging farmers to grow crops that need less water, a demand-side measure more commonly known as crop diversification.
Other measures that could be considered, like improved water markets and better irrigation management, exist; yet it could be argued that within the field of hydrology it would appear those that affect the transmission, supply and demand for water are most favored. Regardless of the approach, the aim of any measure is assumed to improve the supply of bulk water supplies in the part of the catchment where the measure is applied. However small and isolated these measures are, they will have a physical and economic impact throughout a whole catchment. The growth in hydroeconomic modeling over the past two decades (Expósito et al., 2020) would suggest that catchment-wide spatial changes in supply and the values associated with introducing them need to be considered when any of these localized measures are evaluated. Further, the economic returns that occur from these measures need to be considered, along with the hydrological flows. If this is not done, then the benefits these measures are reported to have can only be considered to be partial are will generally be overestimated.
An alternative to these measures, one which is rarely pursued by policymakers, is reducing the level of reliability of bulk water supplies to a catchment. Bulk water supply reliability can be defined as “… the volume of water supplies available to a demand center corresponding to a given probability of flow exceedance. …. It is the result of matching the resource availability with demand subject to resource constraints, priority of supply and infrastructure constraints” (Davidson et al., 2019 p.7). Davidson et al. (2019) and Fadaeizadeh and Shourian (2019) suggest that by reducing the level of reliability in bulk water supplies, are freed up. This water is held in reserve and needed to maintain an existing and higher level of availability; water which can be used to increase annual water allocations. The reticence to do this based on the belief that irrigators and by direct extension societies welfare will suffer (Mesa-Jurado et al., 2012). The cost of this measure is that the supply of water becomes more variable. Thus, the number of periods of water scarcity will increase, even though the total quantity of water availability increases.
What makes reducing the level of reliability of bulk water supplies a legitimate action, like improving water transmission, developing watersheds and crop diversification is that this level of reliability is something policymakers' control. In any system a policymaker can choose to run the system where a very small quantity of bulk water is supplied in (say) 99 years in every 100 years, or a very larger supply of bulk water at (say) 1 year in every 100, or at any level of reliability between these two extremes. Policymakers, once they have decided on a level of bulk water reliability incorporate that in their calculations on how to operate the system, how much to store and how much water to distribute in any year. While changing the rate of reliability (especially reducing it) may well annoy water users, who have made decisions and invested in infrastructure to handle a certain declared level of reliability, there is nothing to stop a policymaker changing the way they operate a system; just as there is nothing to stop them from promoting a change in crop diversity, improving water transmission, or implementing a WSD. Presumably, changing the rate of reliability might even be easier than the other three measures, as the costs of funding the others can be considerable.
Given that any of the four measures could be used to achieve the same outcome, it could be asked which alternative, if any, best achieves society's objectives of increasing bulk water supplies and increase net returns from the system? Comparisons of different projects in this situation are complicated because they usually occur in different parts of a catchment, are each of a different scale and when evaluated need to consider the impacts on all parts of the catchment. It could be (and usually is) the case that making improvements in one part of an interconnected catchment results in water being transferred from some other part of the catchment.
The aim in this paper is to investigate the changes in the physical flows of bulk water and net returns from either developing more supply-side WSD's, getting farmers to change cropping patterns, reducing water losses through improving the delivery of bulk water supply, or by reducing the level of reliability in bulk water supply to a catchment. It should be noted that the assessment conducted in this research is taken from the perspective of the whole of society, not one based on any private group. This is needed as it is assumed that policy makers make decisions with the interests of all stakeholders in mind. The worth of undertaking each of these measures is compared in the Musi catchment in the Krishna Basin in India.
Background
There is a need to clarify who makes the large-scale decisions on measures that are introduced into a catchment. This clarification is important as it has a great bearing on the way an analysis of the worth of a proposed decision is undertaken. In this study policymakers are considered to be the sole decision makers in a catchment. They decide on the level of infrastructure investment in the system and how it is operated. Other decision makers in a catchment, such as irrigators, individual potable water consumers, industrial users, the environmental sector, recreationalists, etc., are all assumed to react to the decisions made by policymakers in their own way deciding on what level of investment they wish to make and what risk they are willing to accept once the policymakers have made their decisions. Given that policymakers determine the reliability and quantity of bulk water supplied, the individual water users make their decisions on what can be called a host of “private” factors that will maximize their own individual utilities. Policymakers cannot base their decisions in a catchment on the same basis as a private water user. Rather, policymakers need to consider what is best for society they serve (Quiggin, 2019). Further, Pielke (2007) would suggest that policymakers need to be fair brokers of what is best for society, not advocates for a particular group within society.
Consequently, policymakers need to take a different approach in assessing a catchment from that adopted by private water users. From an economic perspective policymakers' need to assess costs and benefits that private consumers do not need to consider. Rogers et al. (1998) provide details on the wider issues associated with a social assessment of water. Private investment analysis can be used by private water users to assess the worthwhile nature of investing in water, while policy makers would need to utilize a Cost-Benefit analysis (Sinden and Thampapillai, 1995). Thus, there is a difference between the level of reliability that a whole system operates at, and what can be termed the “dependence” of water users and consumers who react to that level of reliability. That is why studies of catchment wide reliability by Davidson et al. (2011) and Fadaeizadeh and Shourian (2019) come to a different conclusion about reliability to those who assess irrigators dependency on bulk water supplies, such as studies by Mesa-Jurado et al. (2012). The results and findings on dependency will depend greatly on the individual agronomic and hydrological conditions facing irrigators. Further, as suggested above, irrigators and catchment wide policymakers are addressing different questions.
While many benchmarks that can be used to determine whether policymakers succeed in their stated objective of improving water security in a catchment, two would appear to be paramount. The first is a physical measure of the quantity of bulk water supplied in total to the catchment as a whole and to the individual places and nodes within a catchment. The second, whether the choice of a measure returns the greatest net returns (benefits minus costs), both across the catchment and to each of the individual places and nodes to which the bulk water is supplied.
Thus, implementing a new measure should at least result in an increase the water available and net returns in the place where it is put. Yet, this may not satisfy all that is required as in an interconnected catchment the introduced measure may also change the quantity of water reliably supplied elsewhere in the catchment and thus the returns from that water. All these changes, both in the place where they are implemented and elsewhere in the catchment, need to be assessed and compared if the measure is to be fully assessed.
While it could be suggested that the measures with the greatest physical impact and value should be adopted, such advice is only useful if the costs of a measure are fully accounted for.
A catchment is a linked system with a finite quantity of water regulated within it. What this means is that by changing water management and/or use in one part of a catchment may result in a change somewhere else in the system. As water has a value where it is used, changing the distribution of water in a catchment must change the value of the system in the chosen parts of the system the measure is implemented in, as well as in the whole system. Policymakers in advocating for a new measure need to be aware of these changing values (Heinz et al., 2007).
Methods and Data
Hydroeconomic models have become popular tools for assessing the sorts of questions raised in this study. Bekchanov et al. (2017), p. 1, argue that hydroeconomic models, “… integrate the complex interrelationships between hydrologic and economic systems, are effective tools for analyzing …[water scarcity] … issues and for providing appropriate solutions across varied spatial and temporal scales. These models can be powerful tools for examining potential future changes in water resources systems, including the effects of climate change, socioeconomic changes, and infrastructural and policy responses to water resource management challenges.” Expósito et al. (2020) provide an excellent review of the wide range of problems assessed and the different approaches undertaken to model catchments using hydroeconomic models over the past decade. They classify hydroeconomic models according to whether they are;
• Compartmentalized or holistic, where if compartmentalized each component (hydrological, economic, environmental, social, etc.), is on a different platform and the results from one component feed into the others, while in holistic models all components are integrated into one package; and
• Simulated or optimized, where the former are ideal for answering “what if” questions, while the latter address “whats best” questions.
The model used in this research was developed to address the hydrological and economic implications of reallocating water in the Musi sub-basin, a catchment within the Krishna Basin in India. Of concern at the time were the implications of climate change on the basin, the impacts increasing urban demand for water had on the agriculture sector and the effects WSD had on existing large scale irrigation schemes (George et al., 2011a). Expósito et al. (2020) classifies the model as a compartmentalized simulation model designed to address the public issues surrounding water allocation.
Overall, the modeling was based on a network allocation model (REALM) feeding water allocations into a social Cost Benefit economic model, to evaluate both the physical and economic outcomes from different water allocation policies both within a catchment and across the whole catchment. Surface and groundwater models were first applied to assess the resource availability. Then the network allocation model was applied to reconcile the water resources with various demand centers or nodes across the catchment. The demand for water and how users within a node reacts to a change in any exogenous variable or a change in policy is embodied in a demand equation for that water. If more water is available at a particular node then the equilibrium moves down the demand schedule, the rate of movement and its concomitant impact on values is determined by the own-price elasticity of demand for that water at that node. In this model in each of the nodes there are eight different crops grown over two distinct seasons. Initially data on the areas cropped and quantities produced at each node was collected. As the mix of these crops are different at each node and the water requirements of each crop are different then the quantity of water used in each node is different. The amount of water each crop consumes in determined by the Penman-Monteith method of evapotranspiration. Summing these across the node provides the total amount that is used in a region and is the amount that can be allocated through the REALM model (see Table 1 in George et al., 2011b and Appendix B in Davidson et al., 2010 for more details on the mix of crops and water used at each node). To determine the value of these allocations at each node, the Residual Method (Young, 2005) is used to calculate the net unit value for each crop. The residual method accounts for the gross returns from each crop less the costs of production to determine the per unit net value of water. Multiplying the per unit net value of water used in a particular crop by the amount of water used on that crop at each node determines the total net value of water used (Hellegers and Davidson, 2010). To estimate a demand schedule for water in each node the water was ordered from its highest value use to its lowest end use and a regression analysis was used to estimate the own-price elasticity of demand at each node (Davidson and Hellegers, 2011). Using this approach, one where the demand for water is estimated and used, means that an agronomic response model is not required as those effects are embodied in the demand for water function. However, it is assumed that changes in the water used in each node is spread equally over all uses, not on the activity at which the lowest value use. The value of water allocated to different uses in each demand center within the system was estimated and then placed in a social Cost Benefit Analysis to assess the economic consequences policymakers would be interested in of different allocation scenarios (George et al., 2011b).
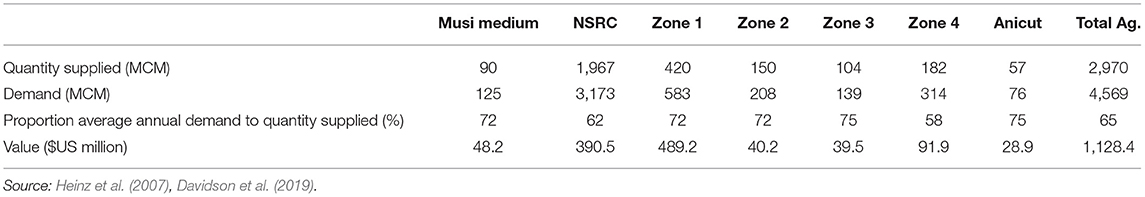
Table 1. The annual quantities of bulk water reliably supplied at the 80% levels of reliability in each region and the net returns for water used in each region.
This model was subsequently refined by Davidson et al. (2019) and used to address questions regarding the impacts different levels of reliability had on the catchment. As the level of reliability is exogenously altered in the model, the water allocations can be changed resulting in the economic values in each part of the catchment changing. One interesting finding from the work on the demand schedules for water in different parts of the catchment was that a lot of water is used to produce subsidized crops (principally rice) in large irrigation schemes. The fact that the rice is subsidized means that in a social Cost Benefit analysis the value these subsidies contribute to the total value need to be excluded from the analysis as they are a transfer. Once the subsidies are excluded, much of the rice is grown at a loss to the system. This finding had a profound impact on the results in Davidson et al. (2019).
The model initially developed by George et al. (2011b) and subsequently refined in Davidson et al. (2019) can be used to address the issues raised in this study. It has a temporal distribution covering the period from 2011 to 2040. It has a spatial distribution (see Figure 1) that includes four dryland regions (Zones 1 to 4), the Musi Medium irrigation system, the Nagajuna Sagar Left Bank (hereafter NSLC or the Left Bank) and Nagajuna Sagar Right Bank (hereafter NSRC or the Right Bank) systems and two river diversion schemes (the Musi Anicut and the Zone 5 Wastewater irrigation system). The model also includes components for Hyderabad City and industrial use.
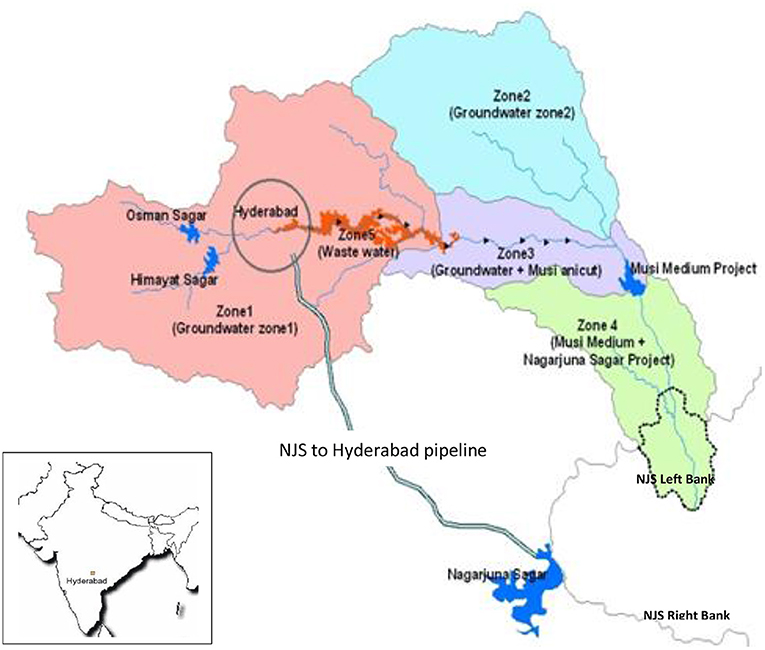
Figure 1. The Musi catchment, India. Source: Adapted from George et al. (2011b).
From an economic perspective the model relies on a social Cost Benefit analysis to assess the economic values, something needed by policymakers if ideal decisions are to be made, not a private investment analysis. The capacity exists to assess not only the more traditional measures considered by policy makers (WSD, crop diversification and improved efficiency of transmission), but also the far more controversial reductions in the level of reliability. The impacts of each of these measures can be simulated and compared over a lengthy period to ascertain the changes in bulk water supplies within and across the whole Musi catchment and the values that are derived from the water supplied.
The initial annual allocations to each demand node at the 80% reliability levels are presented in Table 1, along with the values derived from the bulk water supplied and the extent to which these supplies meet the annual average demand. It should be noted that in all regions the water supplied only accounts for between 58% and 75% of the water demanded in each region. Thus, the catchment can be described as suffering from severe water scarcity, confirming the results of assessments conducted by Van Rooijen et al. (2005) and George et al. (2006). Most of the water used in the catchment is distributed in the large irrigation systems on the Musi. As the allocations of drinking water and industry to the urban regions of Hyderabad receive the highest priority, they remain unaffected by any change. As the Zone 5 Wastewater region receives its supplies from the sewers of Hyderabad, its supply also remains unaffected by any changes to bulk water supply. Furthermore, the Nagajuna Sagar Left Bank is also excluded from this analysis because as Davidson et al. (2019) found that in that region large economic losses were incurred at the 80% level of reliability. Including the NSLC would result in perverse findings where these losses would be reduced as each measure is assessed. This loss occurs because the opportunity cost of water foregone to maintain this level of reliability is greater than the benefits derived from irrigation. In addition, Hellegers and Davidson (2010) found that the value to society of rice production, once the subsidies had been accounted for and excluded, were negative in the region. Therefore, the results from these regions and activities, while remaining part of the model, can be ignored from here on. The data presented in Table 1 represent the “baseline” scenario on which the changes in allocations that result from introducing a new measure can be compared.
Each measure to be simulated in the model operates in different parts of the catchment and the direct costs of implementing each of them are calculated in different ways. In the case of:
• In simulating efficiency improvement in water delivery it was assumed that over the whole period a 10% improvement could be achieved in all irrigation zones (the NSRC, Musi Medium and Musi Anicut);
• In managing crop diversification, it was assumed that reducing rice production by 10% in the Khariff season and 5% in the Rabi season, and replacing them with dryland crops across the whole catchment; and
• Harvesting water more intensively with a WSD, it was assumed that the existing water used in WSD's in the dryland farming Zones (1 to 4) is doubled.
• The levels of reliability across the whole catchment are reduced from 80 to 70%.
Mckinsey (2011) estimates the direct costs of an increase in irrigation transmission efficiency in India to be USc1.7/m3 across all water delivered and a WSD also to be USc1.7/m3 spread across all the water regulated in each affected zone2. The direct cost of changing cropping patterns is equal to the change in the value of the water received for each crop. Hellegers and Davidson (2010) report that the average value of rice grown in the Musi was approximately USc0.7/m3, whereas maize returned USc5.5/m3. A limitation with this approach is that farmers do not make decisions on the average value received for water, alone. To them it is the total net returns per hectare at the margin of their production functions. Assuming that there is some benefit from producing dryland crops over rice, the cost of implementing a change in cropping patterns was set at USc 0.2/m3.
It should be noted that the size of the change of each of these measures is not strictly equivalent, which could lead to the claim that what is being assessed is not comparable. Given the nature of any catchment, no two measures are ever strictly comparable in physical size or impact. Of interest in this study is the direction of any change arising in different regions in the catchment, rather than the actual size. The measures assessed in this study were chosen for illustrative purposes and are assumed to be roughly equivalent in size and scope.
The net changes in the quantity of water arising from a measure can be calculated by taking the new allocations from each demand node after the intervention, from the quantities that were allocated prior to the measure being implemented (which are specified in Table 1). Any changes are expected to have two distinct impacts. First, within the region in which the measure occurs a direct impact is expected, one which should be positive. A second impact may well occur in the region(s) in which the measure is not implemented. This can be called a “redistribution” effect. A combination of the direct and redistribution effects less the direct costs of a measure yields the total impact of a measure over the whole catchment.
In this study average per unit values of water are used, rather than the marginal values, as in many cases the marginal value of the last unit of water used in a place is either zero or (if subsidies are present) negative. While an average value is representative of all water use at a particular point, using these values implies that if the quantity of water used at that point changes it will be spread equally over all uses, not on the activity at which the lowest value use is put to at the margin. The values of water derived if the system is run at the 80% levels of reliability, are derived from Davidson et al. (2019) and are presented in Table 1. It should be noted that while these values are relatively low, especially when compared to the value of water for domestic use (estimated to be USc88.2/m3) and for industrial purposes (USc16.6/m3), they are consistent with the value of water used in agriculture elsewhere in India.
For the sake of brevity in this study, it is assumed that:
• Population and water demand growth is fixed at 2% per annum over the period until 2040.
• The climate over the period is represented by a Q0 Hadley Center scenario, a scenario which results in a wetter than usual outcome.
• The benchmark for water reliability, is set at 80%, except when the reduced level of reliability is simulated.
• That input and output prices do not change over the length of the study.
Results
Physical Impacts
The quantities of bulk water supplied in each of the seven agricultural regions that result from the four measures are presented in Table 2. In the baseline scenario, best described as the current situation, averagely 2,970 MCM per annum are supplied to the catchment. Of all that is supplied, 66% is supplied to the Nagajuna Sagar Right Bank irrigation system. The remaining 34% is spread relatively unevenly across the rest of the catchment, with 14% (or approximately 420 MCM) supplied to Zone 1. Water in Zone 1 is used to produce high-value commodities (fruit and vegetables) to nearby Hyderabad City while low-value crops such as rice tend to dominate production in the Nagajuna Sagar system. The impacts of changes on Nagajuna Sagar Right Banks and Zone 1 regions of the catchment is of greatest interest because of the size of the quantities of water used there.
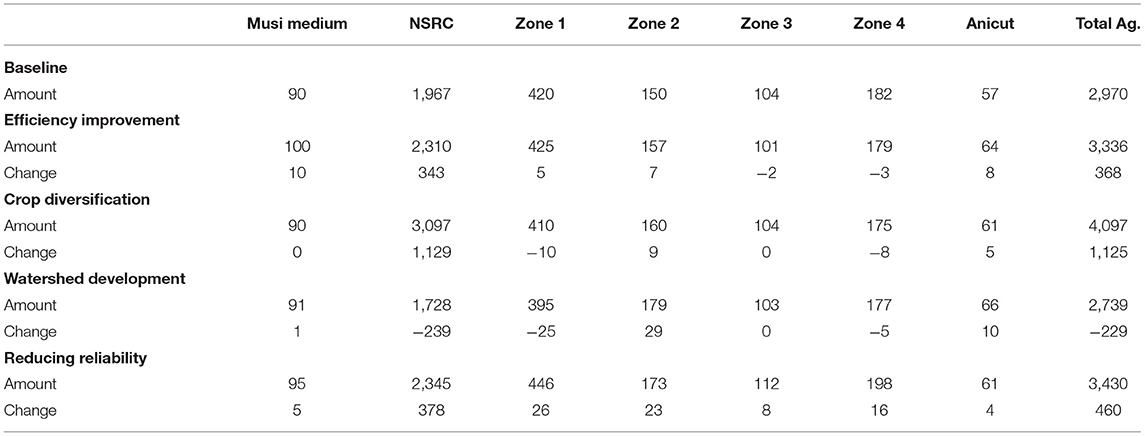
Table 2. The quantity of bulk irrigation supplies distributed in the Musi catchment and the changes within regions from introduced measures (MCM).
Crop diversification measures result in the largest increase in bulk water supplies to the catchment, yielding 4,097 MCM annually. This is an improvement of 38% on the baseline. The regional impacts are mostly felt in the Right Bank of the Nagajuna Sagar System, where water supplies increase by almost 1,129 MCM, a 57% increase on the baseline supplies. In Zone 1 supplies fall by 2% to 410 MCM. Other regions also experience changes, with the Anicut incurring a negative change, while supplies improve in Zone 2.
WSD measures were found to have a detrimental impact on the whole catchment, with the quantities supplied falling by 8% to 2739 MCM per annum. The impacts on the Right Bank of the Nagajuna Sagar system are large, with a loss in bulk water supplies of 12%. In Zone 1 a significant proportion (6%) of its bulk water supplies are reduced, falling to 395MCM per annum. Alternatively, it was found that actions designed to improve WSD have a beneficial impact on the Anicut (of 18%) and Zone 2 (of 19%), which is understandable as these measures were designed to take water away from large scale irrigation operations and deliver them to the smaller components of the catchment. All other regions are mostly unaffected by the change.
Efficiency improvements were found to have a beneficial impact on overall water supplies, increasing it in the whole catchment by 12% to 3,336 MCM per annum. The regions in the catchment that benefit most are the heavily irrigated areas of the Right Bank of the Nagajuna Sagar system, increasing by 17%. The Anicut and the Musi Medium also benefit, to the tune of 14% and 10%, respectively. All other regions, including Zone 1 remain relatively unaffected by the change, falling slightly in Zones 3 and 4.
Reducing the level of reliability from 80% to 70% frees up water in the system that was used to maintain the higher level of reliability. Across the whole catchment bulk water supplies increased by 460 MCM to 3,430 MCM, an improvement of 15% over the 80% reliability level. The quantity of bulk water supplied to all regions increases, with the largest improvements found in the Right Bank of the Nagajuna Sagar system, where bulk water supplies were estimated to be 19% higher. Bulk water supplies also increased by more than 20 MCM in Zones 1 and 2, and less so in all other regions.
Economic Impacts
The changes in the net economic value arising from implementing the four measures are presented in Table 3 If irrigators are encouraged to undertake crop diversification the value of the bulk water supplied improves by $US221 million each year, an increase of 20%, across the whole catchment. Like the distribution of water from this scenario, most changes occur in the Right Bank of the Nagajuna Sagar system, with the total values increasing by 59%. In Zone 2 and the Anicut the changes in value are 7% and 8% higher, respectively, while relatively small losses occur in Zones 1 and 4.
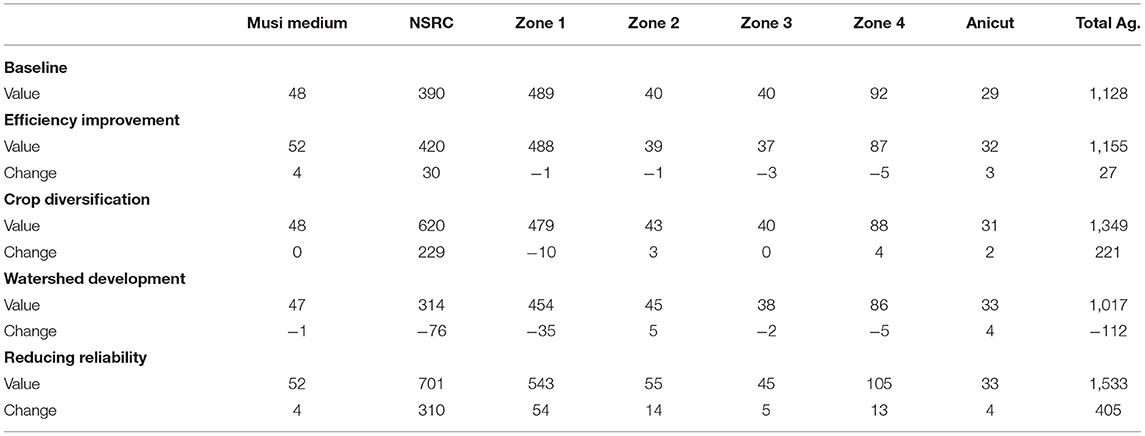
Table 3. The value of bulk irrigation supplies distributed in the Musi catchment and the changes within regions from introduced measures at the 80% level of reliability ($US million).
The overall changes in values that can be attributed to improvements in Watershed Development were found to be detrimental. The total value at the whole of catchment scale was reduced by $US112 million per year, a 10% fall. The reduction in values on the Right Bank of the system were estimated to be $US76 million per year (or 19%). Values in Zone 1 fell by 7% (or $US35 million), and by lesser amounts in Zones 3 and 4 and in the Musi Medium. The gains in the Anicut and Zone 2 were significant when measured in terms of their overall value (13% and 12%, respectively) and relatively small elsewhere.
Investing in efficiency improvements increased total values in the catchment by 2% ($US27 million per year). Most of this gain can be attributed to the increase in water delivered to Right Bank (8%), the Anicut (10%) and in the Musi Medium (8%). The losses in Zones 2, 3 and 4 were 2%, 6% and 5%, respectively, of each region's total returns, while Zone 1 was found to be unaffected by the changes.
The total values of water used in different parts of the Musi catchment at both the 70% and 80% levels of reliability are reported in Table 3. Letting reliability fall from 80% to 70% was estimated to increase the total value of water in the catchment by $US405 million annually (a 36% increase). Most of this gain comes from the Right Bank of the Nagajuna Sagar system with a 79% improvement, and in Zone 2 where total values increased by 36%. The large improvement in the Right Bank of the Nagajuna Sagar system is partially attributable to the increase in bulk water supplies (at 20% see Table 2), a large reduction in the costs associated in withholding so much water back to maintain extremely high rates of reliability and as it is a percentage coming off a relatively low base. All other regions experience an increase in values of between 9% and 14%. Thus, there are no negative impacts arising from reducing the level of reliability in any regions within the catchment.
Implications and Limitations
Given that all regions benefit from a reduction in reliability and the size of all changes are greater than any of the other measures assessed, across the catchment and in all regions within the catchment, then surely reducing reliability, is the superior measure to pursue. Just letting the level of reliability fall by 10% yielded positive economic results in all regions of the catchment and no negative effects in any region within the catchment. While the crop diversification measure resulted in more water being supplied to the catchment, its economic impact was estimated to be far less than that of reducing the level of reliability in the system.
If changing the level of reliability is not considered feasible (for whatever reason) any policymaker comparing the other three measures would encourage policies that lead to greater Crop Diversity, as it yields the next best improvements in both physical and value terms. Yet it does result in a loss in economic benefit in some regions and does not result in an increase in bulk water supplies to all regions (especially Zone 4). While improvements in efficiency were found to be inferior to reducing the level of reliability and crop diversification measures, they were superior to watershed developments which resulted in large economic losses and reductions in bulk water supplies.
Policymakers delving a little deeper into the results would find that any of the measures, except for reducing the level of reliability, undertaken in a connected catchment like the Musi are going to have an impact on regions that are not directly targeted by an individual measure. The size of the impact of a measure in one region on other regions would appear to be directly proportional to the amount of water supplied to each region. Consequently, if policymakers are interested in assessing inter-regional impacts of new interventions, they could restrict themselves to assessing the major water-using regions, rather than all regions. However, while the total values in small regions do not change much, the proportional impact they can have individually can be quite large. Even in a small water using region, like Zones 2, 3 and 4 the changes were in the order of 5% to 10%, quite significant to each individual region despite their small total value.
When it comes to assessing the value of water, the picture is not as clear. Clearly, in value deficit areas (like the Left Bank of the Nagajuna Sagar system which was not included in the analysis) the perverse impacts that may result need to be assessed. It would be easy to suggest that they should be ignored, but these types of regions exist in many irrigation systems. Why they receive such a disproportionate amount of water, and why bulk water supplies are not redistributed to more profitable regions, is a function of the reasons why and the way these systems were initially designed. After they become established, it is extremely difficult to redistribute the water to other regions and users, despite the economic incentives to do so. It should be noted that a measure not assessed in this study was one in which water is redistributed within a catchment. This should be the subject of further research as redistributing water within a catchment may result in greater improvements than lowering the level of reliability. it should be remembered that redistribution policies are extremely difficult to implement and are generally not well received politically. This alone may well explain why analysts and policymakers rarely assess and report the redistribution impacts of a proposed measure.
It was found that in the Musi catchment new measures have a negative impact on existing measures. For instance, it can be concluded that implementing Watershed Developments possibly had a detrimental impact on the flows to the large-scale irrigation schemes, which were set up under an earlier policy regime.
What was surprising was how beneficial reducing reliability turned out to be. Despite the obvious advantages in terms of the values and water gained, implementing a policy of crop diversification has its problems, not the least of which is having some control over the outcome. Getting irrigators to change cropping patterns is difficult. While reducing the level of reliability can result in greater values gained than crop diversification, reducing reliability has the added advantage of being completely within the orbit of control for those who run the systems.
The results and implications presented in this paper need to be tempered by several limitations. To simplify the analysis, only the results that pertain to two levels of reliability were reported. This was the range at which it is thought that the system operates and is close to the financial break-even point. Assumptions regarding the extent and costs of implementing each measure were also made. It is recognized that changing these assumptions would affect the results and consequently possibly the choice between the four measures. However, it is unequivocal that of greatest importance are the choices policymakers need to make regarding the level of reliability.
Conclusions
In this research the total and redistributive impacts that four measures (irrigation efficiency improvements, crop diversification, increasing watershed developments and reducing the level of reliability) have on a catchment were assessed and compared. Questions surrounding this issue are important because policymakers suggest that by undertaking these types of measures the management of water resources in a catchment could be improved especially considering the growing concerns over the impacts' climate change, growing populations and greater intersectoral demand will have on bulk water supplies.
Of the four measures assessed, the best approach would appear to be to reduce the level of reliability in the system. Yet, strangely, this measure is rarely suggested as a solution to the problems' policymakers would appear to be concerned about.
Much of the argument surrounding assessments of these types of measures and their impacts have not been conducted around the core issue of the redistributive effects that could arise within a catchment. Rather, it has been conducted on an assessment of the costs of the measure and the amount of water that could be provided (usually in isolation of the impacts on the rest of the catchment). As the amount of work undertaken using hydroeconomic models attests, to conduct an analysis in isolation of its wider impacts on a catchment will provide an erroneous result from society's perspective. Water within a catchment is a finite resource, use more in one place and less will be available in another. Concomitantly, any measure that redistributes water within a catchment redistributes the returns from water. That redistribution arising from a measure needs to be assessed, especially amongst the regions where water use is greatest.
In the Musi catchment, it was found that promoting crop diversity and increasing irrigation efficiency would increase the quantities of water reliably supplied, and resulted in an economic gain in total, but also had a detrimental impact on some regions within the catchment. Expanding watershed developments would result in a reduction in the quantities of water reliably supplied and were not found to be economically beneficial across the whole catchment and were rarely of great benefit in places where they were introduced. It is possible to direct one of these measures (all except reducing the level of reliability) toward a particular region and it will result in a positive outcome, yet that result is achieved to the detriment of other regions within the catchment. In other words, some quite sizeable redistributions of water and the economic values derived from them will result from any of them.
Most importantly, however, in the Musi, reducing the level of reliability has a far greater beneficial impact on the region and its constituent parts than any of the three measures. Not only that, but because the impacts are all positive in each constituted part of the catchment, the redistribution impacts throughout the catchment are of little concern to policymakers.
Data Availability Statement
The raw data supporting the conclusions of this article will be made available by the authors, without undue reservation.
Author Contributions
BD and BG undertook most of the modeling, while all authors contributed to the conceptualization of the work, the write up and the editorial work involved. All authors contributed to the article and approved the submitted version.
Funding
Funding for the original model came from a ACIAR grant (no. LWR/2007/113) which ended in 2014. Subsequent funding came from Davidson's consulting account.
Conflict of Interest
The authors declare that the research was conducted in the absence of any commercial or financial relationships that could be construed as a potential conflict of interest.
Publisher's Note
All claims expressed in this article are solely those of the authors and do not necessarily represent those of their affiliated organizations, or those of the publisher, the editors and the reviewers. Any product that may be evaluated in this article, or claim that may be made by its manufacturer, is not guaranteed or endorsed by the publisher.
Acknowledgments
This work was the result of efforts undertaken on an ACIAR funded project undertaken in the Krishna Basin in India.
Footnotes
1. ^In this study measures are defined as the projects, actions, policies, and programs of policymakers introduce to address the problems of water scarcity in a catchment.
2. ^At the time the model was constructed $US1 = Rs.60. Thus, USc1.7/m3.
References
Bekchanov, M., Sood, A., Pinto, A., and Jeuland, M. (2017). Systematic review of water-economy modelling applications. J. Water Resour. Plann. Manage. 143, 04017037. doi: 10.1061/(ASCE)WR.1943-5452.0000793
Davidson, B., and Hellegers, P. (2011). Estimating the own-price elasticity of demand for irrigation water in the Musi catchment of India. J. Hydrol. 408, 226–234. doi: 10.1016/j.jhydrol.2011.07.044
Davidson, B., Hellegers, P., George, B., and Malano, H. (2019). The opportunity costs of increasing reliability in irrigation systems. Agric. Water Manage. 222, 173–181. doi: 10.1016/j.agwat.2019.03.005
Davidson, B., Hellegers, P., and Malano, H. (2011). “Reliability, risk and returns to water used for irrigation,” in 9th International Water Resource Economics Consortium (Banff).
Davidson, B., Hellegers, P., and Samad, M. (2010). “Assessing the economic impact of redistributing water within a catchment: a case study of the Musi Catchment in the Krishna Basin in India,” in IWMI Working Paper 139 (Colombo, IWMI).
Expósito, A., Beier, F., and Berbel, J. (2020). Hydro-economic modelling for water-policy assessment under climate change at a river basin scale: a review. Water. 12, 1559. doi: 10.3390/w12061559
Fadaeizadeh, K., and Shourian, M. (2019). Determination of the optimal river basin-wide agricultural water demand quantities meeting satisfactory reliability levels. Water Resour. Manage. 33, 2665–2676. doi: 10.1007/s11269-019-02242-7
George, B., Biggs, T., Malano, H., Gaur, A., and Davidson, B. (2006). “Assessment of water resources in the Musi sub-basin,” in 2nd International Conference on Hydrology and Watershed Management (Hyderabad, India) BS Publishing, Hyderabad.
George, B., Malano, H., Davidson, B., Hellegers, P., Bharati, L., and Massuel, S. (2011a). An integrated hydro-economic modelling framework to evaluate water allocation strategies II: scenario assessment. Agric. Water Manage. 98, 747–758. doi: 10.1016/j.agwat.2010.12.005
George, B., Malano, H., Davidson, B., Hellegers, P., Bharati, L., and Massuel, S. (2011b). An integrated hydro-economic modelling framework to evaluate water allocation strategies I: model development. Agric. Water Manage. 98, 733–746. doi: 10.1016/j.agwat.2010.12.004
Heinz, I., Pulido-Velazquez, M., Lund, J., and Andreu, J. (2007). Hydro-economic modeling in river basin management: implications and applications for the European Water Framework Directive. Water Resour. Manage. 21, 1103–1125. doi: 10.1007/s11269-006-9101-8
Hellegers, P., and Davidson, B. (2010). Determining the disaggregated economic value of irrigation water in the Musi sub-basin in India. Agric. Water Manage. 97, 933–938. doi: 10.1016/j.agwat.2010.01.026
Kahil, M. T., Connor, J. D., and Albiac, J. (2015). Efficient water management policies for irrigation adaptation to climate change in Southern Europe. Ecol. Econ. 120, 226–233. doi: 10.1016/j.ecolecon.2015.11.004
Liu, J., Yang, H., Gosling, S. N., Kummu, M., Flörke, M., Pfister, S., et al. (2017). Water scarcity assessments in the past, present, future. Earth's Fut. 5, 545–559. doi: 10.1002/2016EF000518
Mckinsey (2011). Charting Our Water Future: Economic Frameworks to Inform Decision-Making. 2030 Water Resources Group.
Mekonnen, M. M., and Hoekstra, A. Y. (2016). Four billion people facing severe water scarcity. Sci. Adv. 2, e1500323. doi: 10.1126/sciadv.1500323
Mesa-Jurado, M. A., Martin-Ortega, J., Ruto, E., and Berbel, J. (2012). The economic value of guaranteed water supply for irrigation under scarcity conditions. Agric. Water Manage. 113, 10–18. doi: 10.1016/j.agwat.2012.06.009
Pielke, R. A. J. (2007). The Honest Broker: Making Sense of Science in Policy and Politics. Cambridge: Cambridge University Press. doi: 10.1017/CBO9780511818110
Quiggin, J. (2019). Economics in Two Lessons. Why markets work so well, why they can fail so badly. Princeton NJ, Princeton University Press. doi: 10.1515/9780691186108
Rogers, P., Bhatia, R., and Huber, A. (1998). Water as a Social and Economic Good: How to Put the Principle Into Practice. Global Water Partnership/Swedish International Development Cooperation Agency. Stockholm, Sweden.
Sinden, J. A., and Thampapillai, D. J. (1995). Introduction to Benefit-Cost Analysis. Longman Australia.
Van Rooijen, D. J., Turral, H., and Wade Biggs, T. (2005). Sponge city: water balance of mega-city water use and wastewater use in Hyderabad, India. Irrigat. Drain. 54, S81–S91. doi: 10.1002/ird.188
Veldkamp, T., Wada, Y., Aerts, J., Döll, P., Gosling, S. N., Liu, J., et al. (2017). Water scarcity hotspots travel downstream due to human interventions in the 20th and 21st century. Nat. Commun. 8, 1–12. doi: 10.1038/ncomms15697
Villanueva, A. J., and Glenk, K. (2021). Irrigators' preferences for policy instruments to improve water supply reliability. J. Environ. Manage. 280, 111844. doi: 10.1016/j.jenvman.2020.111844
Keywords: reliability, hydroeconomic assessment, India, demand management, network improvement, watershed development (WSD), policymakers
Citation: Davidson B, Hellegers P, George B and Malano H (2022) Policymakers, Consider Reducing Reliability. Front. Water 4:799139. doi: 10.3389/frwa.2022.799139
Received: 21 October 2021; Accepted: 29 March 2022;
Published: 27 April 2022.
Edited by:
Upali Amarasinghe, International Water Management Institute, Sri LankaReviewed by:
Carlos Gutiérrez-Martín, University of Cordoba, SpainSuhas P. Wani, International Crops Research Institute for the Semi-Arid Tropics (ICRISAT), India
Copyright © 2022 Davidson, Hellegers, George and Malano. This is an open-access article distributed under the terms of the Creative Commons Attribution License (CC BY). The use, distribution or reproduction in other forums is permitted, provided the original author(s) and the copyright owner(s) are credited and that the original publication in this journal is cited, in accordance with accepted academic practice. No use, distribution or reproduction is permitted which does not comply with these terms.
*Correspondence: Brian Davidson, Yi5kYXZpZHNvbkB1bmltZWxiLmVkdS5hdQ==