 Bhekumuzi P. Gumbi
 Brenda Moodley1
 Patrick G. Ndungu
- 1School of Chemistry and Physics, University of KwaZulu-Natal, Durban, South Africa
- 2Department of Chemistry, Mbarara University of Science and Technology, Mbarara, Uganda
- 3Energy, Sensors and Multifunctional Nanomaterials Research Group, Department of Chemical Sciences, University of Johannesburg, Johannesburg, South Africa
In this work, environmental occurrence and risk assessment of pharmaceuticals, personal care products (PPCPs), and stimulants are presented. A quantitative technique is described for ultrasonic-assisted solid-phase extraction (SPE) followed by GC-MS after derivatization of PPCPs; propylparaben, triclosan, carbamazepine, chloramphenicol, and stimulant caffeine. Ultrasonic-assisted extraction together with centrifugation were used to extract sediment samples collected from the Mgeni and Msunduzi rivers. An SPE procedure was used for cleanup and to concentrate selected compounds from diluted aqueous extracts. The final extracts were derivatized and analyzed with GC-MS in selected ion monitoring (SIM) mode. The recoveries of the analytes ranged from 66 to 108%. The method detection limits were (0.08–1.82 ng g−1 for solid and 0.08–10 μg L−1 for liquid) and quantification limits (0.42–5.51 ng g−1 for solid and 0.25–25 μg L−1 for liquid). The optimized method was applied in the evaluation of two rivers over 3 months in KwaZulu-Natal, South Africa. All targeted compounds were present in the environment at concentration levels between not detected to 174 ng g−1 and not detected to 30 μg L−1 for solids and aqueous environmental samples, respectively. A comparison of predicted no environmental effect concentration (PNECs) with measured environmental concentration (MECs) showed that these PPCPs present a high ecological risk to the receiving environment (agricultural lands and households). Our work is close to reality because we used MECs as opposed to using predicted environmental concentration (PECs) values, which are normally calculated from consumption, production of compound per year, and various estimated factors.
Introduction
The presence of emerging contaminants in the environment has raised concerns worldwide. Due to their increased usage and their pharmacokinetic properties, pharmaceuticals, personal care products (PPCPs) can be excreted in the parent form or as metabolites (Albero et al., 2012; Dai et al., 2014). PPCPs' exposure assessments may be conducted through either laborious or exhaustive monitoring programs, which result in measured environmental concentrations (MECs), or using predicted environmental concentrations (PECs) (Bradbury et al., 2004; Ferrari et al., 2004; Celle-Jeanton et al., 2014). The need to know the levels of PPCPs in the environment is critical in understanding the risk on water resources, and planning for suitable interventions to maintain or improve domestic and agricultural water supplies.
The primary source of these contaminants in the environment is through discharge of effluent from wastewater treatment plants (Giger et al., 2003; Albero et al., 2012; Haman et al., 2015). Other pathways are through sludge disposal into landfills and the use of sludge for agricultural purposes (Muñoz et al., 2009; Albero et al., 2012; Uggetti et al., 2012). Leaching and runoff water containing these contaminants from such fields end up in rivers and dams. Fate modeling suggests that PPCPs tend to sorb onto soil or sediment in the environment, and from a biological perspective, do not degrade at a fast-enough rate (Ying et al., 2007; Miller et al., 2008; Liao et al., 2013). Recently, studies have been reported on the occurrence of these contaminants in environmental waters, soil, and sediments (Madikizela and Ncube, 2021; Ncube et al., 2021; Madikizela et al., 2022). Earlier studies showed that the concentration of these compounds in environmental solids ranged from ng kg−1 to μg kg−1. The public impression is that in recent decades, the situation has become alarming since PPCPs have been reported to exist in the environment at a greater concentration than first anticipated. This impression does not consider that many of the compounds that are currently reported to be present in the environment were approved for human use four to five decades ago.
An evaluation of the impact of PPCPs on the environment requires the availability of reliable data in all countries, so there is a demand for new analytical methods that can be used for ecological risk assessment (Ocaña-González et al., 2015). Environmental risk assessment is defined as an attempt to address the concern for the potential impact of individual substances on non-target organisms. This is done by examining both exposure pathways resulting from discharges and/or application of impacted water and the consequences of such contamination on the food chain and function of the ecosystem (Bound and Voulvoulis, 2004; Ferrari et al., 2004; Agerstrand et al., 2015; Pereira et al., 2017). In addition, due to the lack of accepted standard methods for monitoring of PPCPs in the environment, there is a methodological gap in the environmental risk assessment of surface waters (found in dams and rivers) affected by wastewater used for irrigation and drinking in South Africa. Guidelines usually consider only 2 possible pathways for a pollutant to enter the soil compartment (aerial and application of wastewater sludge), and WWTPs in South Africa discharge effluents into rivers which eventually feed into dams. Thus, there is a need to perform risk assessments on the various compartments that come into direct contact with effluent from WWTPs, and to predict the ecological impact on the environment. In South Africa, surface waters are used for irrigation without further purification (Perret, 2002; Speelman et al., 2008; Malan et al., 2014; Muchara et al., 2014). Thus, the introduction of emerging contaminants in agricultural lands through irrigation entails another pathway whereby these compounds can also enter the food chain.
The main objective of this work was to perform a risk assessment of selected PPCPs in the environment in four compartments: sediments, biosolids, and wastewater and freshwater, using the optimized method. This method is based on sample preparation by sonication-assisted extraction followed by detection with GC-MS. Experimental parameters were optimized to achieve the maximum efficiency during analyte extraction and detection and ensuring the suitability of the method to monitor PPCPs over 3 months. The validated method was applied to the analysis of selected compounds in various freshwaters, wastewater effluent, sediments, and biosolids collected from the Mgeni and Msunduzi rivers. Risk characterization was performed by calculating the ratio between measured environmental concentrations (MECs) and predicted no-effect concentrations (PNEC) (MEC/PNEC ratio), where a value above one means that adverse effects are likely to occur, thus calling for risk-reduction measures (Inam et al., 2015).
Experimental
Chemicals and Reagents
Standards triclosan (irgasan), propyl 4-hydroxy-benzoate, caffeine, carbamazepine, and chloramphenicol of high purity (99%) were bought from Sigma-Aldrich (South African). Derivatizing reagent N, O-Bis(trimethylsilyl) trifluoroacetamide (BSTFA), and trimethylsilyl chlorides (TMCs) were used without further treatment. All organic solvents were HPLC grade. Unless stated otherwise, all chemicals were purchased from Sigma-Aldrich (Germany) through Capital Lab Supplies CC (South Africa). All carrier gases, including those used for extraction, were of high purity (99%) and were bought from Afrox (South Africa). Acids and bases used in pH adjustment were of analytical grade and were purchased from Merck (South Africa). Doubly distilled water was obtained from a Bibby Sterilin LTD (United Kingdom) water still. Individual solutions of each analyte were dissolved in methanol. Further dilutions and mixtures of two compounds were made in ethyl acetate. A working standard mixture with a concentration of 10 mg L−1 was prepared weekly by dilution of the stock solutions and used to spike solid samples. Known weights of standards were dissolved in ethyl acetate, and stored in a 2 ml vial bottle in a refrigerator before instrumental analysis.
Internal and surrogate standards: 4,4-di-tert-butylbiphenyl and phenoxyphenol were bought from Sigma-Aldrich (South African). o-Chlorobenzoic acid and cinnamic acid were purchased from BDH chemical Ltd (South Africa).
Apparatus and Instrumentation
Extraction Equipment
Mesh (600–50 μm) used for sieving sediments after grinding was bought from King Test laboratory (South Africa). Sediments were sonicated with a UMC C20 ultrasound bath bought from Ultrasonic Manufacturing Company (South Africa). A Hettich Zetrifugen Rotofix centrifuge was bought from Labotec (South Africa). Extraction manifold and sorbents used for preconcentration and cleaning step (Oasis HLB 6 cc 60 mg) LP were bought from Microsep (South Africa).
Detection Instrument
All measurements were performed in a GC-MS system from Shimadzu QP2010 SE equipped with an autoinjector (AOC-20i) and autosampler (AOC-20s) (Japan). The GC was equipped with a capillary column (intercap 5 Sil MS 0.25 mml. D x 30 M df = 0.25 μm, non-polar) (China).
Sampling
Water and sediments samples were collected along Mgeni and Msunduzi rivers located in Kwa-Zulu Natal, South Africa (Figure 1) (Gumbi et al., 2019). These two rivers pass through towns, agricultural fields, wastewater effluent discharge sites, landfills, hospitals, and villages. Biosolids were collected from two wastewater treatment plants located approximately 80 km apart in two municipalities, Pietermaritzburg and Durban. These are the two biggest cities in the province of Kwa-Zulu Natal.
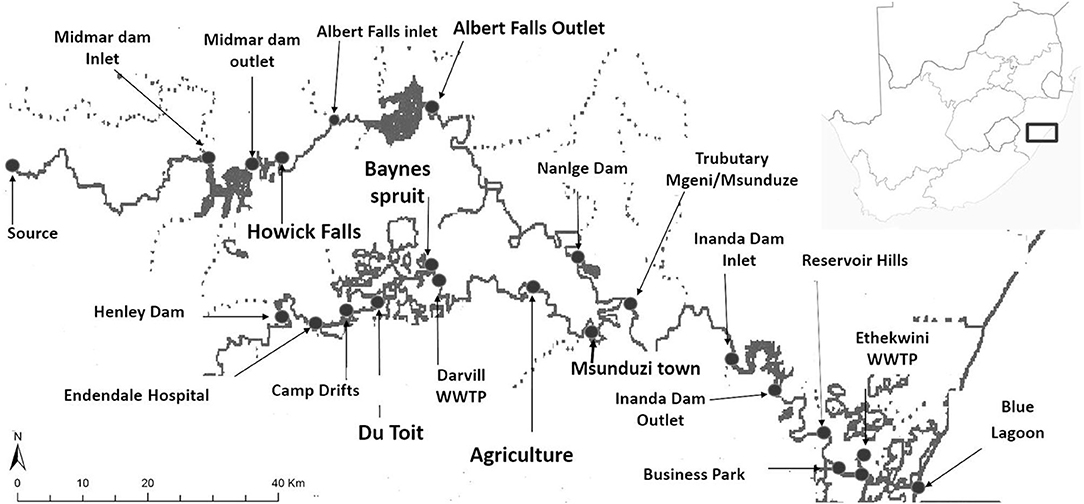
Figure 1. Sampling area of the Mgeni and Msunduzi rivers in KwaZulu-Natal, South Africa. Grab samples were collected at all points and using the developed method described in this work (map was drawn using GIS software shapefile) (Gumbi et al., 2019).
Sediments were sampled from the bank of the river with a stainless-steel spade and transported to the laboratory where the samples were dried under air and sieved through a mesh (600–50 μm). Composite water samples (0.5 L) were taken 1 m apart and collected in 2.5 L amber bottles, kept under 4°C, and transported to the laboratory. While biosolid samples were collected from the inlet and outlet of the wastewater treatment plant grid, the solid samples were homogenized and stored in a cool place below 15°C. The solid samples used in the recovery studies were sediments, biosolids, and acid-washed sand. No preservatives were added except for samples collected after chlorination where sodium thiosulfate was added to prevent further degradation by residual chlorine present in the samples. The samples were stored in a cooler box at 4–6°C and transferred to the laboratory for further analysis.
Extraction Procedure
Extraction of River Water and Wastewater Samples
Surface water and wastewater were extracted with SPE using Oasis HLB cartridge (1 g sorbent per cartridge, 60 μm) at pH 2 adjusted by adding 1 M of diluted sulfuric acid dropwise (final pH was determined using a pH meter). The cartridges were preconditioned with successive additions of 6 ml methanol, and ultrapure water (pH 2 or pH 7). Subsequently, 1 L of the sample was extracted/pre-concentrated using a vacuum manifold at a flow rate of 5 ml min−1. After air-drying the cartridge for 30 min under a gentle stream of nitrogen, the sample was eluted with a total of 9 ml of extraction solution (acetone/ethyl acetate 1:1 6 ml; methanol 1 ml; acetonitrile 1 ml; 1 dichloromethane 1 ml). The eluate was concentrated to dryness under nitrogen at 40°C, and then the residues were re-dissolved with 100 μl of BSTFA derivatizing agent and heated at 70°C for 30 min. Finally, the samples were diluted with acetonitrile and then analyzed with GC-MS. To perform recoveries, 1 L of separate river water, wastewater, and distilled water sample was spiked with 100 and 1,000 μl (10 mg L−1) to make final concentrations of 1 and 10 μg L−1.
Ultrasonic-Assisted Extraction of Sediments and Biosolids
Spiked samples were prepared by adding a 10 μl solution (10 mg L−1) of triclosan, caffeine, chloramphenicol, carbamazepine, and propylparaben in ethyl acetate to an accurately weighed sample (10 g) and the solvents were evaporated in dark conditions overnight below 15°C to prevent degradation of the compounds by light. The concentration of analytes in the samples after drying was 10 ng g−1. The non-spiked samples were also prepared to correctly assess absolute recoveries. Extraction of compounds from sediments, biosolids, and acid-washed sand was carried out by ultrasonic extraction in Teflon centrifuge tubes. Spiked and dried solid samples were transferred into clean 50 ml centrifuge tubes and 10 ml of acetone:ethyl acetate (1:1) was added. The tubes were immersed in an ultrasonic water bath for 20 min and centrifuge for 15 min, in two consecutive extraction steps (10 ml x 2). Fractions were combined and solvents were reduced to 1 ml with a gentle stream of nitrogen. Extracts were diluted with double distilled water and adjusted to pH 2 with sulfuric acid. The sample extracts were passed through an Oasis HLB cartridge at a flow rate of 5 ml min−1, previously conditioned with 3 ml methanol and doubly distilled water. Finally, extracts were evaporated to dryness under a nitrogen stream and followed by derivatization. Samples from the environment were extracted following the same method used to analyze spiked samples.
Derivatization
Extracts were re-dissolved into 100 μl of BSTFA + 1% TMCS, gently mixed while the vial was closed and allowed to react at room temperature for 2 min. Then the mixture was transferred into an oven to react for 30 min at 70°C. After the derivatization process, extracts were diluted up to 0.5 ml volume with ethyl acetate and 2 μl of the derivatized sample extract was auto-injected into the GC-MS.
GC-MS Analysis
The samples were analyzed using a GC-MS (QP2010SE Shimadzu) system and separation was performed on a capillary column. The initial column oven temperature was 70°C, injection port temperature was kept at 250°C, and 2 μl samples were auto-injected in splitless mode. The carrier gas was helium at a constant flow rate of 8.0 ml min−1 and 61.5 KPa pressure. The oven temperature was kept at 70°C for 1 min, then programmed at 30°C min−1 to 190°C (held for 1 min), followed by 15°C min−1 to 230°C (held for 3 min) and finally 30°C min−1 to 270 °C, which was held for 1 min. The transfer line was set at 280°C and the ion source at 200°C. Electron energy for the filament was set at 70 eV. The ITD setting was as follows: mass range 50–850 m/z (full scan only) with a start time of 4 min and end time of 14 min. SIM mode was used for the quantification of analytes. Retention times, major fragment ions, and quantification ions were used to identify compounds of interest in the environmental matrices.
Risk Assessment
A preliminary risk characterization in the different environmental compartments was based on a tiered system outlined by the European Medicine Evaluation Agency (EMEA) and the Food and Drug administration (Stuer-Lauridsen et al., 2000; Bound and Voulvoulis, 2006). The risk quotient (RQ) method is the basic principle globally accepted in the development of environmental risk assessment (ERA) (Quevauviller et al., 1996). A very important information needed in ERA is the concentration range at which a compound studied causes no effect on non-target organisms. These concentrations known as PNEC for the aquatic compartment are estimated from EC50 values obtained with acute toxicity test (algae, daphnia, and fish) and by application of an assessment factor. The evaluation of whether a substance poses a risk to organisms in the environment is based on the comparison of the detected contaminant concentration MEC with its PNEC organism in the environmental compartment.
The presented potential ecological risk is based on the estimation of RQ using the concentration of drug residues found in each compartment. A standard assessment factor (1,000) introduced by Hernando et al. has been adopted because it accounts for all species in the environment compared to other factors (10 or 100) (Hernando et al., 2006; Hendricks et al., 2021). The PNEC in aqueous and solid compartments have been determined following the formula (1) and (2) formulated by Hernando et al. or obtained from the literature (Hernando et al., 2006).
Where PNECaq is the PNEC calculated for the aqueous compartment, Kp is the solid–water partition coefficient, and d is the density of solid.
When the RQ equals or exceeds 1 (MEC/PNEC ≥ 1) then the ecological risk is suspected. In addition, a more descriptive criterion (RQ <0.1 means low risk, 0.1 < RQ <1 means medium risk, RQ > 1 means high risk) that has been employed in the main studies was also used to interpret the obtained RQ values.
Results and Discussion
Sample Preparation
The recovery of analytes from environmental samples in reasonable percentages depends on several factors, such as the type of extraction, cleanup, solvents, ionic strength, or the pH and instruments for detection. Often most factors require evaluation and optimization before determination of contaminants in the environment. Extraction and cleanup of extracts for separation and pre-concentration of analytes of interest are one of the most important steps in multi-residue detection and quantification of emerging contaminants in environmental matrices (Berlioz-Barbier et al., 2014). The applicability of solid-phase extraction (SPE) in the cleanup step for the determination of emerging organic contaminants from environmental samples has been demonstrated in a previous work (Gumbi et al., 2017a). The effect of extract cleanup is briefly demonstrated in this work in Figure 2. The effect of sonication was investigated prior to SPE process to achieve high recoveries. This preliminary evaluation was undertaken using sediments samples spiked at 10 ng g−1 fortification level. The samples were prepared according to the method described above in the experimental section and extracts were obtained with and without sonication. These extracts were derivatized and analyzed with GC-MS. Optimum conditions included sonication and cleanup steps were carried out simultaneously. Carbamazepine and chloramphenicol were not recovered when the sonication was not applied during the extraction. Although caffeine, propyl paraben, and triclosan were extracted without sonication, their yield was very low, lower than acceptable recoveries as shown in Figure 2. Low recoveries were attributed to the time frame required to soak the solid samples in the solvents when extracting without the assistance of ultrasound. In some literature, 24 h were needed for the extraction without sonication (Núñez et al., 2008). In this work, 2 h were used and were comparable to our optimum conditions for extracting these compounds. Also, without cleanup, only propylparaben and triclosan were recovered. These two analyses showed that some compounds can be extracted independently of sonication or a cleanup step. High recoveries, when using ultrasound, have been attributed to the propagation of ultrasound pressure waves through the solvent and resulting cavitation phenomena (Núñez et al., 2008).
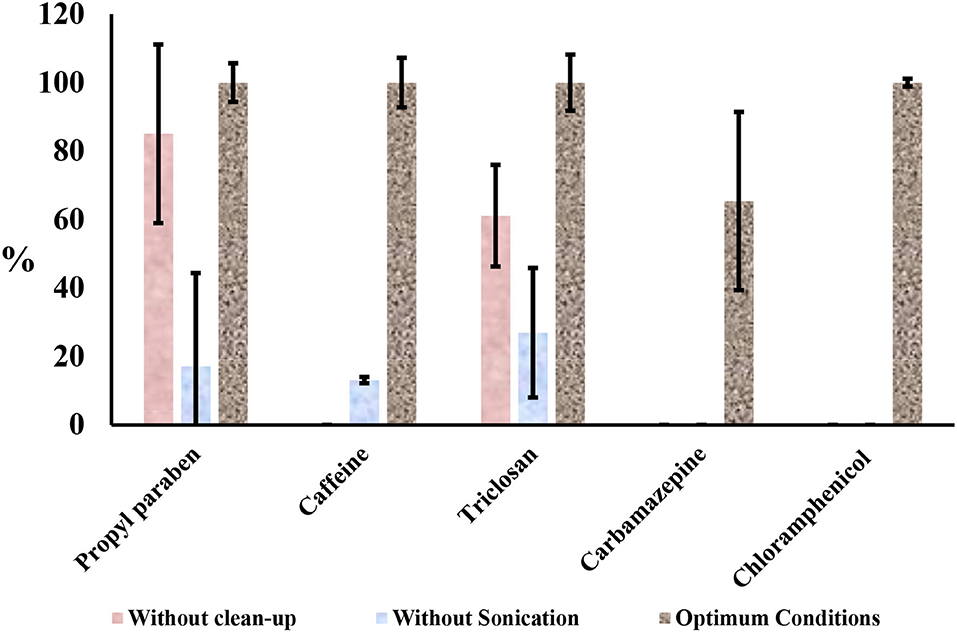
Figure 2. Influence of sonication and cleanup steps in the simultaneous extraction of target compounds from spiked sediments samples at 10 ng g−1.
The mechanical impact of sonic waves can also increase the interaction on the surface area between solid and liquid phases due to the possibility of a size decrease in the solid matrix (Tang et al., 2009). The increased rates of mass transfer will also enhance the rate of solvent being transferred to the solid surface, and the transfer of the soluble component into the organic solvents will be enhanced. However, these proposed mechanisms depend on the ability of the extraction solvent to dissolve and keep all the analytes of interest in the soluble form (Albero et al., 2015). Recoveries can be affected if the analytes can precipitate and partition to solids during centrifugation after sonication. The selection of the most appropriate solvent for extracting the analytes of interest from the matrix of the sample is a basic step in the optimization of any method of extraction (Albero et al., 2015). To find the optimum extraction solvent, three solvents were chosen; methanol, dichloromethane, and optimum solvents mixture (ethyl acetate: acetone 6 ml, methanol 1 ml, acetonitrile 1 ml, and water 2 ml) based on the literature and assayed as shown in Figure 3. Moreover, all these solvents can dissolve all the analytes.
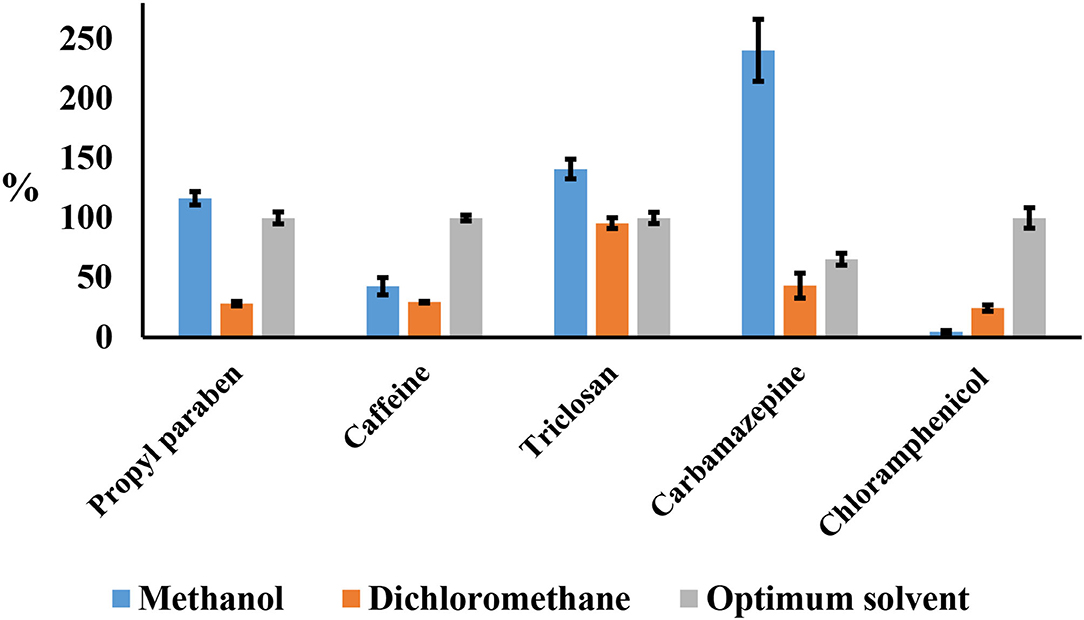
Figure 3. Influence of extraction solvent, methanol, dichloromethane, and optimum solvent (acetone:ethyl acetate).
Methanol was able to extract propylparaben and triclosan with reasonable recoveries. However, methanol showed low recoveries for chloramphenicol and high recoveries for carbamazepine up to 250%. Methanol has normally been avoided as an extraction solvent because of its ability to extract lots of compounds in matrices and even the untargeted compounds, which are difficult to clean (Morales et al., 2005). Methanol extracts might have interfered with derivatization because of the complicated extracts. Dichloromethane showed low recoveries less than 50% except for triclosan with 95%.
Compounds involved in this study had varying pKa values ranging from 7.5 to 14.0. Therefore, their isolation at different pH values needed to be optimized. The aqueous distribution of compounds was investigated using water adjusted at three different pH values (2, 7, and 9) with HCl or NaOH as shown in Figure 4. Ethyl acetate:acetone (1:1), acetonitrile and methanol were used as elution solvents. These solvents are normally employed in the extraction of PCPPs because of their polarity and ability to dissolve all the selected drugs (Gumbi et al., 2017a,b, 2019). Spiked double distilled water (10 μg L−1), aliquots of 200 ml, adjusted to pH 2, 7, and 9 were passed through Oasis HLB at flow rates between 5 and 8 ml min−1. After elution, compounds were silylated and analyzed by GC-MS. Recoveries were determined from the standard solution of the same concentration as corresponding aliquots of different pH values. The recovery values at pH 7 were low for caffeine and triclosan, while recoveries for propylparaben and carbamazepine were observable above 120%. Propylparaben and triclosan had low recoveries at pH 9. These compounds were found to exist in two forms: silyl derivatives and methyl esters at pH 9, which in turn, affected the recoveries because only peak areas from silyl derivatives were used for calculations of percent recoveries. Recoveries at pH 2 were acceptable and ranged from 65 to 108%.
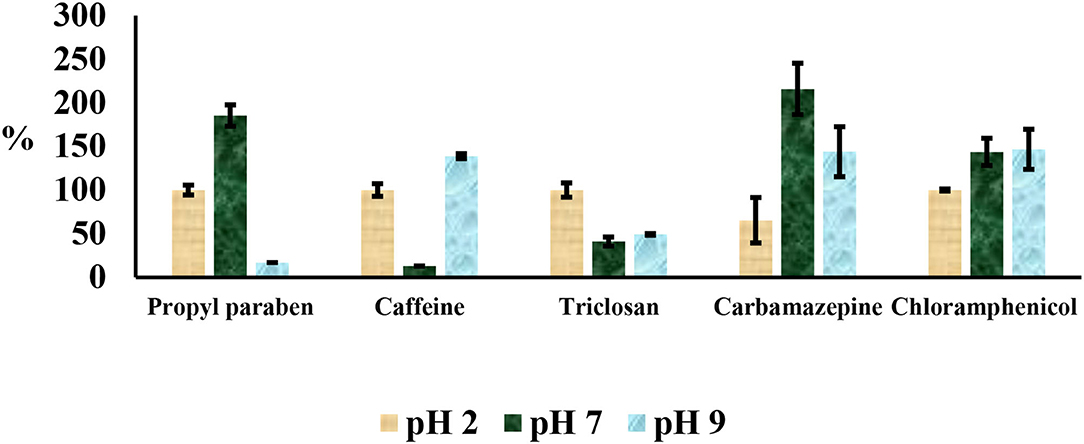
Figure 4. Influence of pH in the water extraction and cleanup step.
Method Validation
Recovery
Recovery of the method was tested by adding known amounts of analytes (1, 10, and 20 ng g−1) in triplicate with different matrices. These fortified samples were allowed to stand for 4 h under a gentle stream of nitrogen to allow solvent evaporation before sonication and centrifuge extraction and extracts were subjected to GC-MS analysis after derivatization. Good recoveries of the compounds were obtained and ranged from 66 to 108% for all compounds. Each compartment was analyzed separately, but the results are reported in range in Table 1. The range of recoveries achieved is similar to that obtained by other authors as shown in Table 1, in line with IUPAC and EPA recommendations (Thompson et al., 2002).
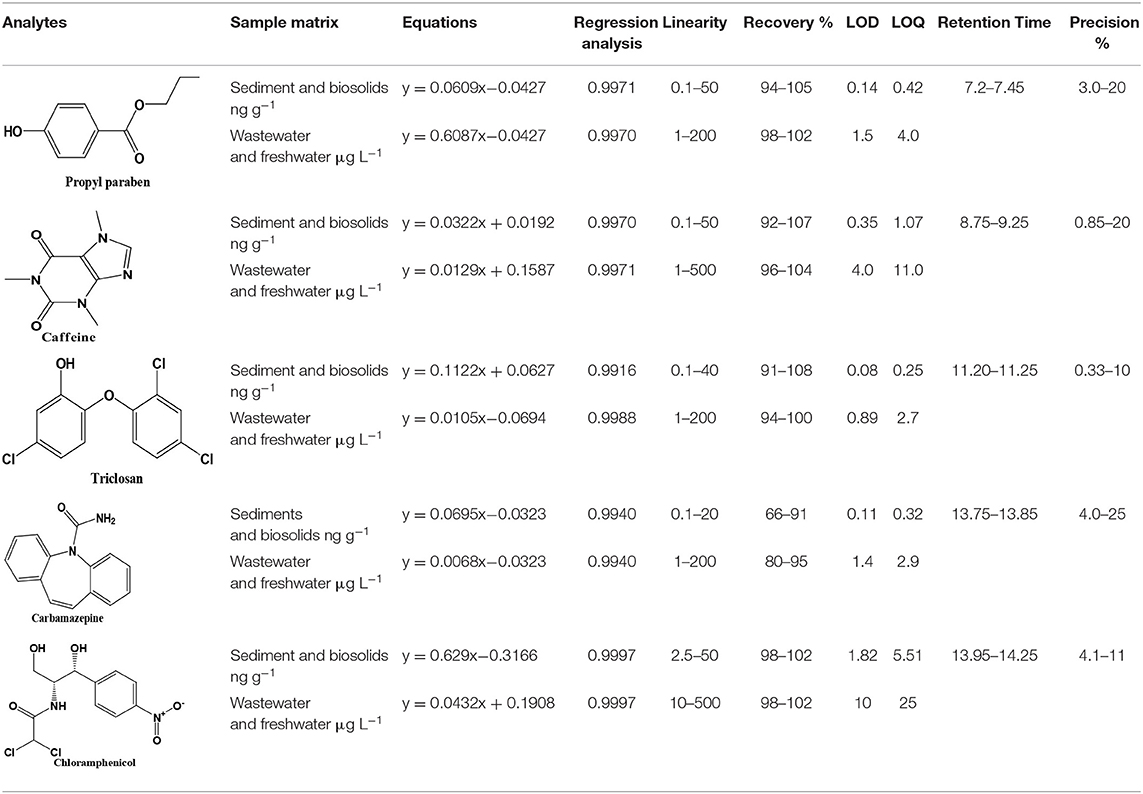
Table 1. Validation data (n = 3), retention time, calibration data, linearity, recovery, detection limits (LOD), quantification limits (LOQ), and repeatability of the studied compounds.
Limits of Detection and Quantification
Limits of detection (LODs) and quantification (LOQs) were determined following IUPAC recommendation which considers these limits as the minimum amount of target analytes concentration that produces a signal-to-noise ratio (S/N) of 3 and 10 times the background chromatographic noise, respectively (Thompson et al., 2002). The S/N was measured at the lowest spiked level in the validation studies. Low limits were obtained due to the selectivity and high sensitivity of the GC-MS-SIM technique, allowing the determination of these PPCPs compounds at environmentally relevant concentration levels. Table 1 shows the LOD and LOQ values corresponding to the extraction by optimized method followed by derivatization-GC-MS analysis. These limits range from 0.14 to 1.9 ng g−1 for LODs and from 0.45 to 5.5 ng g−1 for LOQ. Relatively high limits for chloramphenicol were observed compared to other compounds. This was attributed to the fact that the labile hydrogen was shielded from possible easy derivatization. Nevertheless, the range of LODs and LOQs achieved in this proposed method are less than those reported by other authors (Núñez et al., 2008).
Linearity
A multipoint calibration curve was obtained from a minimum of five extracted and derivatized standard solutions at different concentrations. Good linearity was obtained in the range within 1–200 ng g−1 with correlation coefficients higher than 0.99 for all compounds. These calibration results are summarized in Table 1.
Repeatability or Precision
The precision was determined by analyzing the spiked sediment samples at three different concentration levels. These samples were analyzed within given days. The RSD calculated between 2 days ranged from 0.3 to 25%, less than 32% as recommended by the EPA.
Application to Real Samples
GC-MS has emerged as a useful analytical technique because of its availability in most environmental laboratories in many developing countries. On the other hand, LC-MS/MS, which is a preferred technique for the determination of PPCPs in environmental samples, is still scarce in developing and poorly resourced countries. The LOQs obtained with the proposed method are within the range of those established with LC-MS/MS (Stolker et al., 2004; Chu and Metcalfe, 2007; Yu and Wu, 2011). Although the derivatization step is normally required in GC-MS analysis of PPCPs, this step was optimized in the work described in our published work (Gumbi et al., 2017a). The proposed method was applied for the analysis of sediments, biosolids, wastewater, and freshwater samples from two rivers in South Africa. The mean concentration of targeted PCPPs obtained from triplicate analysis were presented in Tables 2–4.
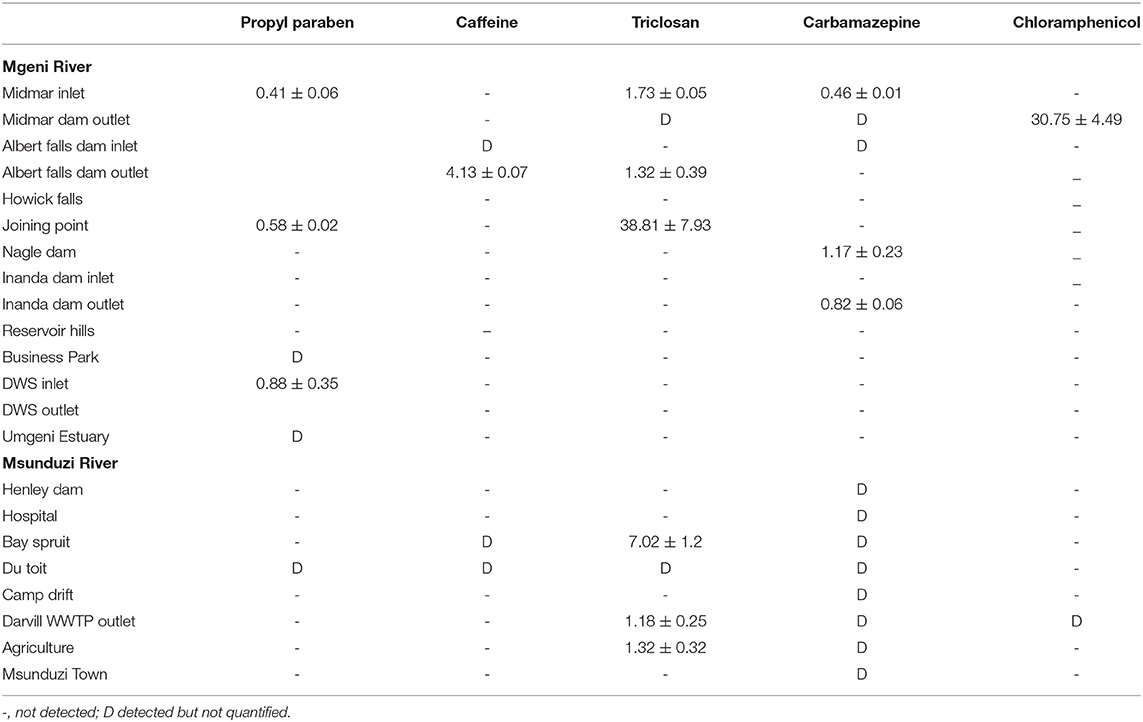
Table 2. Concentration of the studied compounds (ng g−1) in sediments collected in Mgeni and Msunduzi rivers in May.
Distribution of Target Drugs in Sediments and Biosolids
The sediment samples were collected over 3 months (May, July, and August) from Mgeni and Msunduzi rivers. PCPP concentrations were determined in sediment samples. The levels found expressed as ng g−1 dry weight are given in Tables 2–4.
In all the analyzed samples, propylparaben was the predominant contaminant and this is expected since it is a water-based preservative commonly used in food and PPCPs. In addition, propylparaben occurs naturally and is found in some plants and insects. Propylparaben was found at all the sampling sites at levels from not detected to 31.81 ng g−1. The highest concentration of propylparaben was detected in July and the lowest levels were observed at 3 of the 22 sites in May and 6 of the 22 sites in July (Table 3).
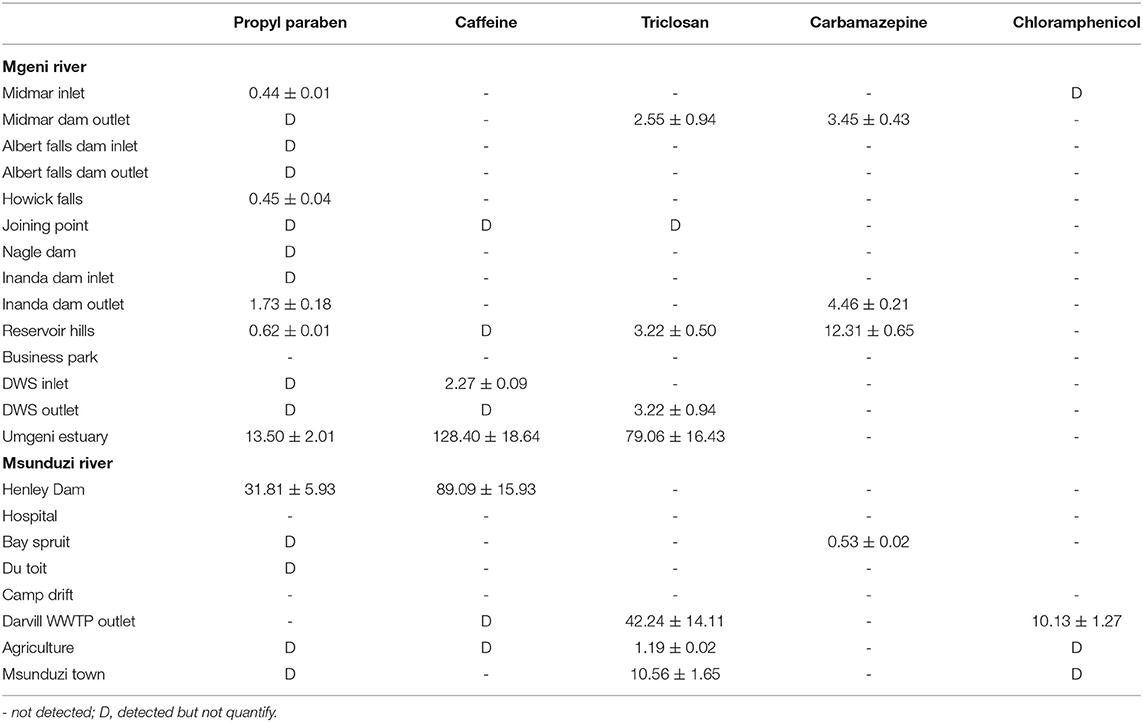
Table 3. Concentration of the studied compounds (ng g−1) in sediments collected in Mgeni and Msunduzi rivers in July.
Propylparaben was found to occur more in the Mgeni river compared to the Msunduzi river. Given the path of the Mgeni river, this might suggest even natural sources contribute to a load of propylparaben in these rivers, while the Msunduzi river passes mostly through urbanized areas. The concentration level of propylparaben found in this study is higher than those found in Japan (nd−2.84 ng g−1) and the United States (nd−3.52 ng g−1), and lower than those reported in Korea (nd−64.5 ng g−1) (Yu and Wu, 2011; Liao et al., 2013).
Caffeine concentration levels were higher than the other compounds analyzed, approaching 174 ng g−1 in the sample collected at Durban WWTPs in August (Table 4), followed by Mgeni estuary 128 ng g−1 and Henley Dam 90.00 ng g−1 (Table 3). The results of this study showed higher concentrations of unmetabolized caffeine in both rivers. The increased concentration levels of caffeine may be associated with high consumption of coffee, tea, and soft drinks as well as the improper disposal of these items. The relevance of these findings is that if caffeine is present in water, numerous pathogens and biologically active PPCPs are likely to be present as well. Determination of many pathogens is both difficult and technologically not feasible to monitor in environmental samples.
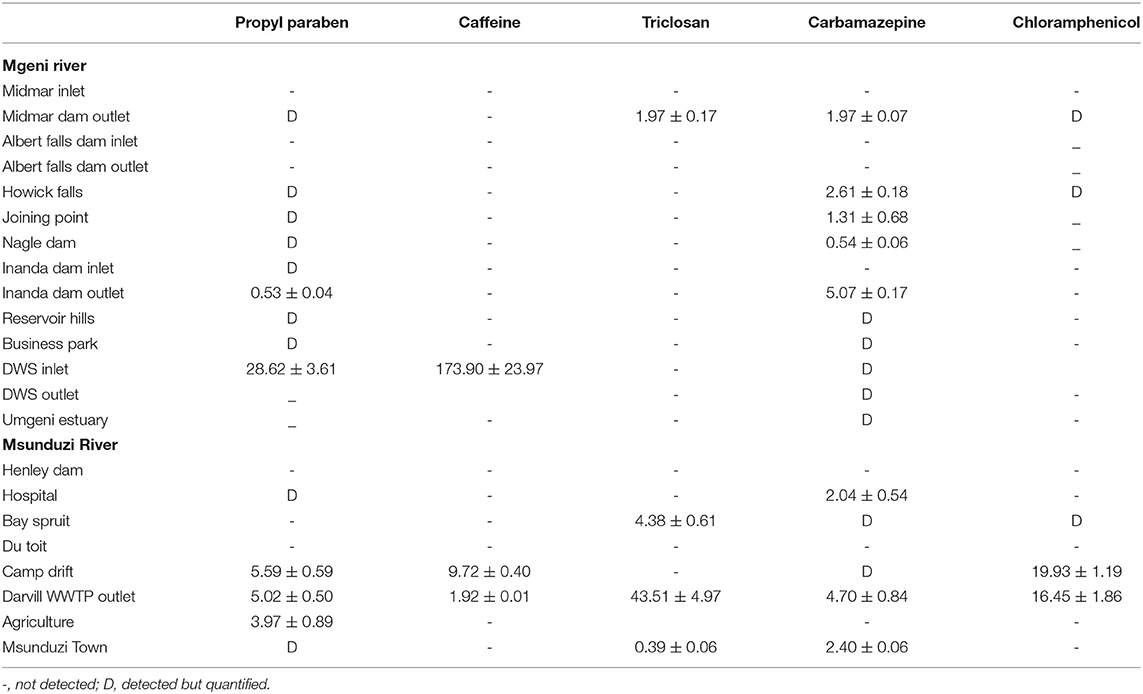
Table 4. Concentration of the studied compounds (ng g-1) in sediments collected in Mgeni and Msunduzi rivers in August.
Triclosan is employed as an antimicrobial agent in various medical and consumer care products. Triclosan was found in both rivers at many sites and its concentration ranged from not detected to 79.10 ng g−1. The triclosan compound had the second-highest concentration recorded in this study. The incorporation of triclosan in a vast array of products resulted in it being discharged to WWTPs (Durban, 42.00 ng g−1 in July) and then into sediments (Mgeni Estuary, 79.00 ng g−1 in July). Triclosan is a relatively stable, hydrophobic, and non-volatile compound, (Kow 4.9) expected to adsorb in particulate matter and accumulate into sediments. However, low concentration levels were observed in May and August, which was attributed to the photochemical degradation of triclosan. Because of reduced daylight and the amount of light reaching the South African environment in July compared to other months, with temperatures below 20°C and not favoring degradation of triclosan, it was detected in high concentration in July.
Carbamazepine was not found in most sites but was detected in all sites in Msunduzi river in May (Table 2). This trend was attributed to the fact that carbamazepine undergoes extensive metabolism and thirty-three metabolites of carbamazepine have been identified from human and rat urine. Carbamazepine is not stable in its current form, and since it is used exclusively by humans, this anthropogenic drug in the environment represents human pollution (Ramaswamy, 2015). Therefore, it has been targeted in rivers and found to occur in many parts of the world. In this work, it was found to range from not detected to 12.31 ng g−1, the lowest concentration quantified among selected compounds.
Chloramphenicol was quantified in a few sites compared to other compounds since approximately 80% of the compound is metabolized and excreted as glucuronide, after administration. Some studies have shown that the metabolite glucuronide can convert back to the bioactive chloramphenicol in manure (Lai et al., 1995). Moreover, chloramphenicol is used as a broad-spectrum antibiotic by humans in exceptional cases only, such as meningitis (Tang et al., 2009). Nevertheless, its toxicity has led many studies to target it in the environment. The use of chloramphenicol in animal medicine is completely forbidden by the European Union because it causes damage to bone marrow in humans. In this study, chloramphenicol ranged from not detected to 19.93 ng g−1. These results are presented in Tables 2–4.
Distribution of Target Drugs in Freshwater and Wastewater
Freshwater samples were collected from Mgeni and Msunduzi rivers in KwaZulu-Natal, South Africa, during the month of May, July, and August. Wastewater was collected from two WWTPs in Durban and Pietermaritzburg municipalities. The presented mean concentrations and standard deviations of freshwater and wastewater are results of triplicate extraction and analysis of each sample with the developed method. Tables 5 and 6 present these mean concentrations of PPCPs found in water (dams and river water) and wastewater. The concentration ranged from a very quantifiable level to below the LOD. Measurable levels of propylparaben, caffeine, and triclosan were observed in the Mgeni and Msunduzi rivers and demonstrate the contamination of fresh (natural) waters in South Africa by PPCPs.
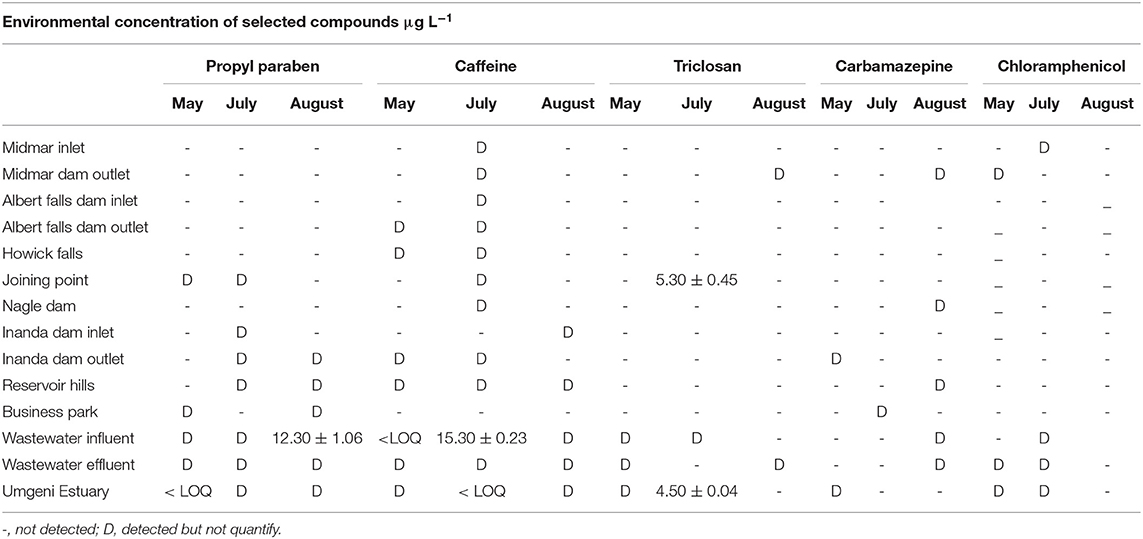
Table 5. Concentration (μg L−1) of personal care products and pharmaceuticals in fresh water and wastewater along the Mgeni river.
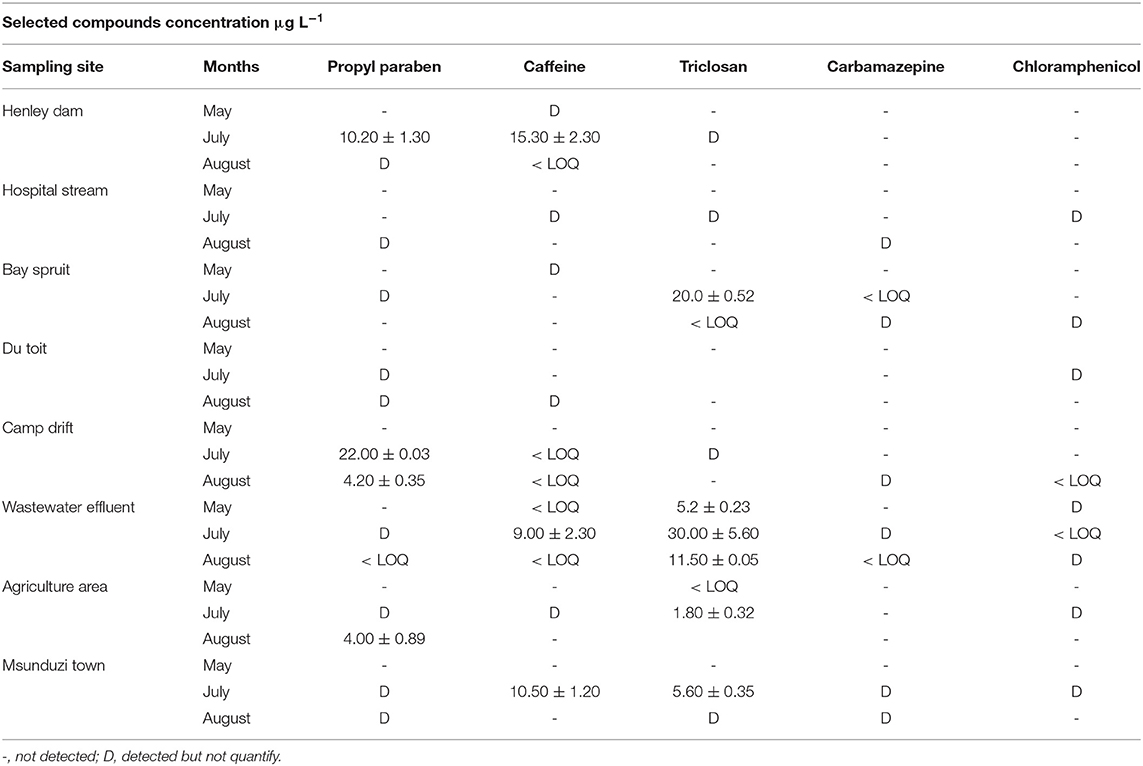
Table 6. Concentration (μg L−1) of personal care products and pharmaceuticals in fresh water and wastewater along the Msunduzi river.
In Mgeni river and Ethekwini WWTP, all target PPCPs compounds were detected in July as presented in Table 5. Most PPCPs were quantified in Ethekwini wastewater WWTP compared to the Mgeni river. The highest concentration of propylparaben was found in August at EThekwini WWTP influent at 12.30 μg L−1. There was no significant variation observed for propylparaben concentration. Caffeine was detected in almost all sampling sites except for the business park. The highest concentration of caffeine was also found in Ethekwini WWTP at 15.30 μg L−1 in July. Triclosan was detected in a few sampling sites but was the only compound found at a quantifiable level at the sampling point after the Msunduzi river joined the Mgeni river and at the Mgeni estuary. Triclosan was found at 5.3 and 4.5 μg L−1 concentration levels at the joining point and Mgeni estuary, respectively. The Msunduzi river might have contributed to a load of triclosan at the joining point and caused it to be high. The Mgeni estuary is a recreational site where many people get together for braais (bar-b-que's) and some national sports events are held at the site, which makes it vulnerable to contamination. Concentration levels of carbamazepine and chloramphenicol were found to be below the quantification limit at all sites. These compounds belong to the group of prescription drugs and consumption of antibiotic is controlled in South Africa. However, their detection in the environmental surface waters used as a source in agricultural irrigation poses a threat to the development and spread of antibiotic resistance genes. In the Msunduzi river and Darvill WWTP, PPCPs were found in high concentration compared to the Mgeni river. Msunduzi is directly exposed to contamination because it is surrounded by informal settlements.
Propylparaben's highest concentration was found in Camp drift at 22.00 μg L−1, followed by Henley Dam with 10.20 μg L−1, and the lowest quantifiable concentration of 4.00 μg L−1 was found at the agricultural area sampling site as shown in Table 6. At this point, subsistence farming takes place. Villagers irrigate their gardens and farms by collecting water directly from the Msunduzi river.
The highest concentration of caffeine was found at the Henley Dam at 15.30 μg L−1 followed by the Msunduzi Town sampling site 10.50 μg L−1. Triclosan occurred at a high concentration in the Darvill wastewater effluent. Carbamazepine and chloramphenicol were not quantified in the Msunduzi river as well. These drugs are not seasonal like a flu medication, and depend on the population of people prescribed for these compounds.
Risk Assessment Investigation
The Mgeni and Msunduzi rivers were found to receive a variety of organic waste from the informal settlement, urban areas, farms, industries, and municipality sewage. Both subsistence and commercial farms rely on the surface water stored in the five dams found along these rivers for irrigation. In addition, villagers along these rivers use surface water without further treatment for their daily needs. Wastewater effluent discharged from WWTPs in South Africa is not tested or regulated for the levels of emerging contaminants. Biosolids in WWTPs are normally pre-concentrated, put through a process of biological inactivation, and later used for agricultural purposes or landfills rehabilitation. This has been widely recognized as another pathway for the introduction of PPCPs into the environment (Uggetti et al., 2012; Thomaidi et al., 2016). This work was undertaken to develop a rapid risk assessment method for the evaluation of PPCPs in the four compartments of the environment (freshwater, wastewater, biosolid, and sediments). Most classes of PPCPs have been represented as antibiotic drugs (chloramphenicol), antiepileptic drugs (carbamazepine), personal care products (propylparaben and triclosan), and stimulants drugs (caffeine). Recently, caffeine has been used as an indicator of environmental pollution by human excreta. In addition, the presence of caffeine in the environment indicates the potential existence of other emerging contaminants including pathogenic compounds.
The highest measured concentration of PPCPs residues in the environmental compartment was used to predict the ecological risk (Table 7). The species and organisms used to obtain the ecological risk quotient in Table 7 were zebra fishes, daphnia, and invertebrate (Choi et al., 2008; Harada et al., 2008; Dai et al., 2014; Zhou et al., 2014). These species are normally accepted for ecological risk prediction in the environment globally. Hazard quotient or RQ values for this study (0.01–600) were within the ratio range reported elsewhere (0.001–123628) (Aguirre-Martínez et al., 2013; Ramaswamy, 2015)–. All studied contaminants showed potential ecological risk in the environment when freshwater or biosolids are used for human consumption purposes. Since this is a preliminary study, further ERA studies are recommended.
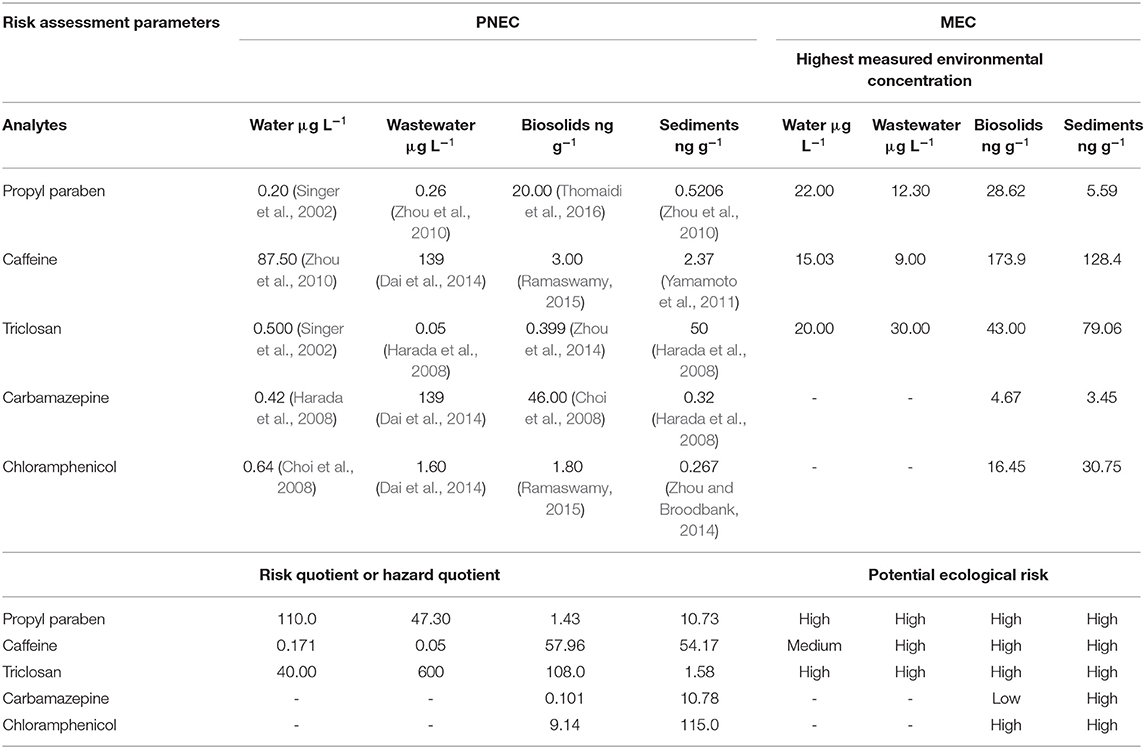
Table 7. Potential ecological risk [in terms of RQ (MECs/PNECs)] of selected PPCPs in water, wastewater, biosolids, and sediments using maximum MEC detected.
Conclusion
A method for the determination of propylparaben, triclosan, caffeine, carbamazepine, and chloramphenicol, in four environmental compartments, namely water, wastewater, biosolids, and sediments, based on ultrasonic-assisted extraction followed by GC-MS after derivatization was developed. The use of ultrasonic extraction followed by sample cleanup with SPE provides low LOQs in sediments at trace levels. The proposed method has been properly validated, and the suitability of the procedure for analysis of PPCPs in compartments has been shown by established precision of less than 25%. Several environmental samples from different parts of KwaZulu-Natal were analyzed and all the targeted PPCPs were detected in the environment. The levels ranged from not detected to 174 ng g−1 in and 22 μg L−1 in solid and aqueous samples, respectively. Risk assessment of these contaminants in the environment showed high potential ecological risk. More ERA studies are recommended to determine the extent of ecological risk in these compartments, as they are important for agricultural security in the region and to prevent further human exposure. Detection of an antibiotic (chloramphenicol) shows that there is a need to regulate irrigation water and fertilizers (compost or biosolids) to minimize the risk of antibiotic resistance. This is the first simultaneous detection and risk assessment of PPCPs in Africa by GC-MS.
Data Availability Statement
The raw data supporting the conclusions of this article will be made available by the authors, without undue reservation.
Author Contributions
Project conceptualization, acquisition of funding, and project administration were done equally by BM, GB, and PN. The selection of the sampling points and the sampling campaign were done by BG, BM, GB, and PN. BG under the supervision of GB, BM, and PN carried out the experimental, including method development, data workup, and analysis. BG prepared the first draft of the manuscript. BG, BM, GB, and PN improved the manuscript and contributed equally to various drafts. All authors approved the submission of the final draft.
Funding
This research was funded by the Water Research Commission of South Africa (Project No. K5/2215//3). BG gratefully acknowledges the National Research Foundation of South Africa for bursary support.
Conflict of Interest
The authors declare that the research was conducted in the absence of any commercial or financial relationships that could be construed as a potential conflict of interest.
Publisher's Note
All claims expressed in this article are solely those of the authors and do not necessarily represent those of their affiliated organizations, or those of the publisher, the editors and the reviewers. Any product that may be evaluated in this article, or claim that may be made by its manufacturer, is not guaranteed or endorsed by the publisher.
Acknowledgments
We acknowledge the School of Chemistry and Physics at the University of KwaZulu-Natal for access to facilities to carry out this research.
References
Agerstrand, M., Berg, C., Bjorlenius, B., Breitholtz, M., Brunstrom, B., Fick, J., et al. (2015). Improving environmental risk assessment of human pharmaceuticals. Environ. Sci. Technol. 49, 5336–5345. doi: 10.1021/acs.est.5b00302
Aguirre-Martínez, G. V., Buratti, S., Fabbri, E., DelValls, A. T., and Martín-Díaz, M. L. (2013). Using lysosomal membrane stability of haemocytes in Ruditapes philippinarum as a biomarker of cellular stress to assess contamination by caffeine, ibuprofen, carbamazepine and novobiocin. J. Environ. Sci. 25, 1408–1418. doi: 10.1016/S1001-0742(12)60207-1
Albero, B., Pérez, R. A., Sánchez-Brunete, C., and Tadeo, J. L. (2012). Occurrence and analysis of parabens in municipal sewage sludge from wastewater treatment plants in Madrid (Spain). J. Hazard. Mater. 239, 48–55. doi: 10.1016/j.jhazmat.2012.05.017
Albero, B., Sánchez-Brunete, C., García-Valcárcel, A. I., Pérez, R. A., and Tadeo, J. L. (2015). Ultrasound-assisted extraction of emerging contaminants from environmental samples. TrAC - Trends Analyt. Chem. 71, 110–118. doi: 10.1016/j.trac.2015.03.015
Berlioz-Barbier, A., Vauchez, A., Wiest, L., Baudot, R., Vulliet, E., and Cren-Oliv,é, C. (2014). Multi-residue analysis of emerging pollutants in sediment using QuEChERS-based extraction followed by LC-MS/MS analysis. Analyt. Bioanalyt. Chem. 406, 1259–1266. doi: 10.1007/s00216-013-7450-8
Bound, J. P., and Voulvoulis, N. (2004). Pharmaceuticals in the aquatic environment - a comparison of risk assessment strategies. Chemosphere. 56, 1143–1155. doi: 10.1016/j.chemosphere.2004.05.010
Bound, J. P., and Voulvoulis, N. (2006). Predicted and measured concentrations for selected pharmaceuticals in UK rivers: Implications for risk assessment. Water Res. 40, 2885–2892. doi: 10.1016/j.watres.2006.05.036
Bradbury, S. P., Feijtel, T. C., and Leeuwen, C. J. V. (2004). Peer reviewed: meeting the scientific needs of ecological risk assessment in a regulatory context. Environ. Sci. Technol. 23, 463–470. doi: 10.1021/es040675s
Celle-Jeanton, H., Schemberg, D., Mohammed, N., Huneau, F., Bertrand, G., Lavastre, V., et al. (2014). Evaluation of pharmaceuticals in surface water: Reliability of PECs compared to MECs. Environ. Int. 73, 10–21. doi: 10.1016/j.envint.2014.06.015
Choi, K., Kim, Y., Jung, J., Kim, M. H., Kim, C. S., Kim, N. H., et al. (2008). Occurrences and ecological risks of roxithromycin, trimethoprim, and chloramphenicol in the Han River, Korea. Environ. Toxicol. Chem. 27, 711–719. doi: 10.1897/07-143.1
Chu, S., and Metcalfe, C. D. (2007). Simultaneous determination of triclocarban and triclosan in municipal biosolids by liquid chromatography tandem mass spectrometry. J. Chromatogr. A. 1164, 212–218. doi: 10.1016/j.chroma.2007.07.024
Dai, G., Huang, J., Chen, W., Wang, B., Yu, G., and Deng, S. (2014). Major pharmaceuticals and personal care products (PPCPs) in wastewater treatment plant and receiving water in Beijing, China, and associated ecological risks. Bull. Environ. Contamin. Toxicol. 92, 655–661. doi: 10.1007/s00128-014-1247-0
Ferrari, B., Mons, R., Vollat, B., Fraysse, B., Paxeus, N., Lo Giudice, R., et al. (2004). Environmental risk assessment of six human pharmaceuticals: are the current environmental risk assessment procedures sufficient for the protection of the aquatic environment? Environ. Toxicol. Chem. 23, 1344–1354. doi: 10.1897/03-246
Giger, W., Alder, A. C., Golet, E. M., Kohler, H. P. E., McArdell, C. S., Molnar, E., et al. (2003). Occurrence and fate of antibiotics as trace contaminants in wastewaters, sewage sludges, and surface waters. Chimia. 57, 485–491. doi: 10.2533/000942903777679064
Gumbi, B. P., Moodley, B., Birungi, G., and Ndungu, P. G. (2017a). Detection and quantification of acidic drug residues in South African surface water using gas chromatography-mass spectrometry. Chemosphere. 168, 1042–1050. doi: 10.1016/j.chemosphere.2016.10.105
Gumbi, B. P., Moodley, B., Birungi, G., and Ndungu, P. G. (2017b). Assessment of nonsteroidal anti-inflammatory drugs by ultrasonic-assisted extraction and GC-MS in Mgeni and Msunduzi river sediments, KwaZulu-Natal, South Africa. Environ. Sci. Pollut. Res. 24, 20015–20028. doi: 10.1007/s11356-017-9653-6
Gumbi, B. P., Moodley, B., Birungi, G., and Ndungu, P. G. (2019). Target, Suspect and Non-Target Screening of Silylated Derivatives of Polar Compounds Based on Single Ion Monitoring GC-MS. Int. J. Environ. Res. Public Health. 16, 4022. doi: 10.3390/ijerph16204022
Haman, C., Dauchy, X., Rosin, C., and Munoz, J. F. (2015). Occurrence, fate and behavior of parabens in aquatic environments: a review. Water Res. 68, 1–11. doi: 10.1016/j.watres.2014.09.030
Harada, A., Komori, K., Nakada, N., Kitamura, K., and Suzuki, Y. (2008). Biological effects of PPCPs on aquatic lives and evaluation of river waters affected by different wastewater treatment levels. Water Sci. Technol. 58, 1541–1546. doi: 10.2166/wst.2008.742
Hendricks, N., Olatunji, O. S., and Gumbi, B. P. (2021). Quantification and ecological risk assessment of colloidal fullerenes nanoparticles in sediments by ultrasonic-assisted pressurized liquid extraction and high performance liquid chromatography. Nanomaterials. 11, 3319. doi: 10.3390/nano11123319
Hernando, M. D., Mezcua, M., Fernández-Alba, A. R., and Barcel,ó, D. (2006). Environmental risk assessment of pharmaceutical residues in wastewater effluents, surface waters and sediments. Talanta. 69, 334–342. doi: 10.1016/j.talanta.2005.09.037
Inam, E., Offiong, N. A., Kang, S., Yang, P., and Essien, J. (2015). Assessment of the occurrence and risks of emerging organic pollutants (eops) in ikpa river basin freshwater ecosystem, niger delta-Nigeria. Bull. Environ. Contamin. Toxicol. 95, 624–631. doi: 10.1007/s00128-015-1639-9
Lai, H. T., Liu, S. M., and Chien, Y. H. (1995). Transformation of chloramphenicol and oxytetracycline in aquaculture pond sediments. J. Environ. Sci. Health A. 30, 1897–1923. doi: 10.1080/10934529509376311
Liao, C., Lee, S., Moon, H.-B., Yamashita, N., and Kannan, K. (2013). Parabens in sediment and sewage sludge from the United States, Japan, and Korea: spatial distribution and temporal trends. Environ. Sci. Technol. 47, 10895–10902. doi: 10.1021/es402574k
Madikizela, L. M., and Ncube, S. (2021). Occurrence and ecotoxicological risk assessment of non-steroidal anti-inflammatory drugs in South African aquatic environment: What is known and the missing information? Chemosphere. 280, 130688. doi: 10.1016/j.chemosphere.2021.130688
Madikizela, L. M., Nuapia, Y. B., Chimuka, L., Ncube, S., and Etale, A. (2022). Target and suspect screening of pharmaceuticals and their transformation products in the klip river, South Africa, using ultra-high-performance liquid chromatography-mass spectrometry. Environ. Toxicol. Chem. 41, 437–447. doi: 10.1002/etc.5265
Malan, M., Müller, F., Cyster, L., Raitt, L., and Aalbers, J. (2014). Heavy metals in the irrigation water, soils and vegetables in the Philippi horticultural area in the Western Cape Province of South Africa. Environ. Monitor. Assess. 187, 4085. doi: 10.1007/s10661-014-4085-y
Miller, T. R., Heidler, J., Chillrud, S. N., Delaquil, A., Ritchie, J. C., Mihalic, J. N., et al. (2008). Fate of triclosan and evidence for reductive dechlorination of triclocarban in estuarine sediments. Environ. Sci Technol. 42, 4570–4576. doi: 10.1021/es702882g
Morales, S., Canosa, P., Rodríguez, I., Rub,í, E., and Cela, R. (2005). Microwave assisted extraction followed by gas chromatography with tandem mass spectrometry for the determination of triclosan and two related chlorophenols in sludge and sediments. J. Chromatogr. A. 1082, 128–135. doi: 10.1016/j.chroma.2005.05.059
Muchara, B., Ortmann, G., Wale, E., and Mudhara, M. (2014). Collective action and participation in irrigation water management: A case study of Mooi River Irrigation Scheme in KwaZulu-Natal Province, South Africa. Water SA. 40, 699–708. doi: 10.4314/wsa.v40i4.15
Muñoz, I., Gómez-Ramos, M. J., Agüera, A., Fernández-Alba, A. R., García-Reyes, J. F., and Molina-Díaz, A. (2009). Chemical evaluation of contaminants in wastewater effluents and the environmental risk of reusing effluents in agriculture. TrAC Trends Analyt. Chem. 28, 676–694. doi: 10.1016/j.trac.2009.03.007
Ncube, S., Nuapia, Y. B., Chimuka, L., Madikizela, L. M., and Etale, A. (2021). Trace detection and quantitation of antibiotics in a south african stream receiving wastewater effluents and municipal dumpsite leachates. Front. Environ. Sci. 9, 365. doi: 10.3389/fenvs.2021.733065
Núñez, L., Tadeo, J. L., García-Valcárcel, A. I., and Turiel, E. (2008). Determination of parabens in environmental solid samples by ultrasonic-assisted extraction and liquid chromatography with triple quadrupole mass spectrometry. J. Chromatogr. A 1214, 178–182. doi: 10.1016/j.chroma.2008.10.105
Ocaña-González, J. A., Villar-Navarro, M., Ramos-Payán, M., Fernández-Torres, R., and Bello-López, M. A. (2015). New developments in the extraction and determination of parabens in cosmetics and environmental samples: a review. Analyt. Chim. Acta. 858, 1–15. doi: 10.1016/j.aca.2014.07.002
Pereira, A., Silva, L. J. G., Lino, C. M., Meisel, L. M., and Pena, A. (2017). A critical evaluation of different parameters for estimating pharmaceutical exposure seeking an improved environmental risk assessment. Sci. Total Environ. 603, 226–236. doi: 10.1016/j.scitotenv.2017.06.022
Perret, S. R. (2002). Water policies and smallholding irrigation schemes in South Africa: a history and new institutional challenges. Water Policy. 4, 283–300. doi: 10.1016/S1366-7017(02)00031-4
Quevauviller, P., van der Sloot, H. A., Ure, A., Muntau, H., Gomez, A., and Rauret, G. (1996). Conclusions of the workshop: harmonization of leaching/extraction tests for environmental risk assessment. Sci. Total Environ. 178, 133–139. doi: 10.1016/0048-9697(95)04805-7
Ramaswamy, B. R. (2015). “Environmental risk assessment of personal care products,” in M. S. Díaz-Cruz and D. Barceló, eds. Personal Care Products in the Aquatic Environment (Springer International Publishing, Cham) p. 139–163. doi: 10.1007/698_2014_297
Singer, H., Muller, S., Tixier, C., and Pillonel, L. (2002). Triclosan: occurrence and fate of a widely used biocide in the aquatic environment: field measurements in wastewater treatment plants, surface waters, and lake sediments. Environ. Sci. Technol. 36, 4998–5004. doi: 10.1021/es025750i
Speelman, S., D'Haese, M., Buysse, J., and D'Haese, L. (2008). A measure for the efficiency of water use and its determinants, a case study of small-scale irrigation schemes in North-West Province, South Africa. Agric. Syst. 98, 31–39. doi: 10.1016/j.agsy.2008.03.006
Stolker, A. A. M., Niesing, W., Fuchs, R., Vreeken, R. J., Niessen, W. M. A., and Brinkman, U. A. T. (2004). Liquid chromatography with triple-quadrupole and quadrupole-time-of-flight mass spectrometry for the determination of micro-constituents - A comparison. Analyt. Bioanalyt. Chem. 378, 1754–1761. doi: 10.1007/s00216-003-2485-x
Stuer-Lauridsen, F., Birkved, M., Hansen, L. P., Lutzhoft, H. C. H., and Halling-Sorensen, B. (2000). Environmental risk assessment of human pharmaceuticals in Denmark after normal therapeutic use. Chemosphere. 40, 783–793. doi: 10.1016/S0045-6535(99)00453-1
Tang, C. M., Huang, Q. X., Yu, Y. Y., and Peng, X. Z. (2009). Multiresidue determination of sulfonamides, macrolides, trimethprim, and chloramphenicol in sewage sludge and sediment using ultrasonic extraction coupled with solid phase extraction and liquid chromatography-tandem mass spectrometry. Chin. J. Anal. Chem. 37, 1119–1124. doi: 10.1016/S1872-2040(08)60120-6
Thomaidi, V. S., Stasinakis, A. S., Borova, V. L., and Thomaidis, N. S. (2016). Assessing the risk associated with the presence of emerging organic contaminants in sludge-amended soil: a country-level analysis. Sci. Total Environ. 548, 280–288. doi: 10.1016/j.scitotenv.2016.01.043
Thompson, M., Ellison, S. L., and Wood, R. (2002). Harmonized guidelines for single-laboratory validation of methods of analysis (IUPAC Technical Report). Pure Appl. Chem. 74, 835–855. doi: 10.1351/pac200274050835
Uggetti, E., Ferrer, I., Nielsen, S., Arias, C., Brix, H., and Garcia, J. (2012). Characteristics of biosolids from sludge treatment wetlands for agricultural reuse. Ecol. Eng. 40, 210–216. doi: 10.1016/j.ecoleng.2011.12.030
Yamamoto, H., Tamura, I., Hirata, Y., Kato, J., Kagota, K., Katsuki, S., et al. (2011). Aquatic toxicity and ecological risk assessment of seven parabens: Individual and additive approach. Sci. Total Environ. 410, 102–111. doi: 10.1016/j.scitotenv.2011.09.040
Ying, G. G., Yu, X. Y., and Kookana, R. S. (2007). Biological degradation of triclocarban and triclosan in a soil under aerobic and anaerobic conditions and comparison with environmental fate modelling. Environ. Pollut. 150, 300–305. doi: 10.1016/j.envpol.2007.02.013
Yu, Y., and Wu, L. S. (2011). Comparison of four extraction methods for the analysis of pharmaceuticals in wastewater. J. Chromatogr. A. 1218, 2483–2489. doi: 10.1016/j.chroma.2011.02.050
Zhou, H., Wu, C., Huang, X., Gao, M., Wen, X., Tsuno, H., et al. (2010). Occurrence of selected pharmaceuticals and caffeine in sewage treatment plants and receiving rivers in Beijing, China. Water Environ. Res. 82, 2239–2248. doi: 10.2175/106143010X12681059116653
Zhou, H., Zhang, Q., Wang, X., Ma, L., and Zhan, Y. (2014). Systematic screening of common wastewater-marking pharmaceuticals in urban aquatic environments: implications for environmental risk control. Environ. Sci. Pollut. Res. 21, 7113–7129. doi: 10.1007/s11356-014-2622-4
Keywords: ultrasonic, derivatization, GC-MS, personal care products, pharmaceutical
Citation: Gumbi BP, Moodley B, Birungi G and Ndungu PG (2022) Risk Assessment of Personal Care Products, Pharmaceuticals, and Stimulants in Mgeni and Msunduzi Rivers, KwaZulu-Natal, South Africa. Front. Water 4:867201. doi: 10.3389/frwa.2022.867201
Received: 31 January 2022; Accepted: 19 April 2022;
Published: 01 June 2022.
Edited by:
Yun-Ya Yang, Andes Ag, Inc., United StatesReviewed by:
Vimbai Mhuka, O Summit International College, South AfricaChijioke Olisah, Nelson Mandela University, South Africa
Copyright © 2022 Gumbi, Moodley, Birungi and Ndungu. This is an open-access article distributed under the terms of the Creative Commons Attribution License (CC BY). The use, distribution or reproduction in other forums is permitted, provided the original author(s) and the copyright owner(s) are credited and that the original publication in this journal is cited, in accordance with accepted academic practice. No use, distribution or reproduction is permitted which does not comply with these terms.
*Correspondence: Patrick G. Ndungu, cG5kdW5ndUB1a3puLmFjLnph; Bhekumuzi P. Gumbi, Z3VtYmliQHVrem4uYWMuemE=