 King Kuok Kuok1*
 Mohd. Elfy Mersal1
 Po Chan Chiu2Mei Yun Chin1
 Md. Rezaur Rahman3
 Muhammad Khusairy Bin Bakri4
- 1Faculty of Engineering, Computing and Science, Swinburne University of Technology Sarawak Campus, Kuching, Sarawak, Malaysia
- 2Faculty of Computer Science and Information Technology, Universiti Malaysia Sarawak, Kota Samarahan, Sarawak, Malaysia
- 3Faculty of Engineering, Universiti Malaysia Sarawak, Kota Samarahan, Sarawak, Malaysia
- 4Composites Materials and Engineering Center, Washington State University, Pullman, WA, United States
This study focuses on the impact of climate change on Sarawak River flow due to heavy rainfall and the backflow of sea level. The sea level around Sarawak is expected to rise at 3.6 mm/year. When surface runoff meets seawater backflow, especially during king tides, determining the flood inundation level at low-lying regions along the Sarawak River is critical to prepare appropriate mitigation measures. The hydrodynamic model was developed using Infoworks River Simulation (RS) software. The flow of the Sarawak River is modeled from Git Station to Muara Tebas port. Various data are input into the hydrodynamic model for calibration and validation, including boundary conditions, river networks, ground models, river cross-section, water level, and rainfall data. The simulation was carried out for the years 2050 and 2080. The flood maps were generated to depict flood depth, extent, and submerged areas. In 2020, the backflow of seawater did not overwhelm Kuching City, which is located within the Sarawak River Basin. However, many low-lying locations along Sarawak River are expected to be inundated by 2050, with the flood depth ranging from 1 to 4 m. In 2080, the average increment of flood depth is predicted to be 1 m especially for low-lying areas compared to year 2050. Hence, the relevant authorities must take proactive efforts to manage the growing flood challenges caused by climate change, particularly in low-lying areas.
Introduction
Due to an increase in greenhouse gases, the earth's climate has been altering with a continual rise in temperature. These greenhouse gases are produced by human activities such as deforestation and industrial activities. The thermal expansion of saltwater caused by rising global temperatures has increased sea levels worldwide, melting land-based ice and ice sheets in Greenland and Antarctica. According to the National Oceanic and Atmospheric Administration (NOAA), the present rate of sea level rise is 3.6 mm/year, which is 2.5 times higher than the average worldwide sea increase rate in the twentieth century (Lindsey, 2020).
According to the National Hydraulic Research Institute of Malaysia (NAHRIM), Sarawak's temperature increment from 1969 to 2009 is 0.6°C (Lindsey and Dahlman, 2020). From 1993 to 2010, the rate of sea level rise, according to satellite altimetry, ranges from 2.73 to 7.00 mm/year (NAHRIM, 2019). This shows the impact of climate change to the sea level rise in Sarawak. The capital city of Sarawak is Kuching, which experiences a tropical humid rainforest climate all year long. Sea level rise in Kuching might be disastrous, submerging lowland peat, mangrove swamps, and low-lying settlements. Furthermore, the riverbanks may also be submerged due to seawater intrusion into the river. Sea level rise may cause negative consequences for the economy and individuals' safety.
Sea level has been steadily rising in recent years due to climate change. Various studies have been conducted in the Mekong Delta, Vietnam (Vu et al., 2018; Minderhoud et al., 2019), Klang and Kuala Langat Districts, Malaysia (Ruzaini and Aslinda, 2018), Jakarta, Indonesia (Takagi et al., 2016), and Bangkok, Thailand, to investigate the impact of sea level rise owing to climate change (Dutta, 2011). The sea level in Sarawak is expected to rise, with a mean rise of 0.115 to 0.291 m in 2040 and a mean rise of 0.432 to 1.064 m in 2100, according to the assimilation of global mean sea level predictions from Atmosphere-simulations to satellite altimeter readings along with the subject coastlines (Ercan et al., 2013; Erban et al., 2014).
As sea levels rise, low-lying regions near the coast will be at risk of flooding. Besides, sea level rise will significantly affect the outflow from the Sarawak River basin. Since 2000, the only outflow from Sarawak's river basin has been controlled and managed at the Kuching Barrage and Shiplock, located at the river's mouth (Kuok and Chiu, 2012). The Kuching Barrage and Shiplock have several roles, including regulating and controlling the water level upstream of the barrage, vessel passage, and imposing fines or tolls on vessels passing through the barrage or shiplock (Kuok et al., 2021). The Kuching Barrage and Shiplock are part of the Sarawak River Regulation Scheme (SRRS), a large-scale civil engineering project in Kuching, Sarawak, Malaysia. This is Southeast Asia's first three-in-one infrastructure project that combines barrage, shiplock, and bridge within a project.
The telemetry system collects real-time water and rainfall data based on a Sarawak River computational model has been installed within the river system. The collected and predicted discharge and water level data are the two primary pieces of information used to determine when to open the barrage gates. In the future, as sea levels increase, it will be difficult to predict how the Barrage, Shiplock, and outflow from the Sarawak River basin would function, especially after heavy rains. The impact of the backflow of the sea water into the Sarawak River basin is unknown due to the rising sea level. Therefore, this research is initiated to determine the areas that would be inundated owing to the backflow of constantly rising seawater combined with extreme heavy rainfall inside the river basin using a hydrodynamic simulation software called Infoworks River Simulation (RS). The research aims are to (a) generate the flood maps in Kuching city for the years 2050 and 2080 due to backflow of sea level rise plus extreme heavy rainfall using Infoworks RS, and (b) analyze the areas that will be inundated by flood in 2050 and 2080. This is important to predict the extent and depth of flood and the operation of Kuching Barrage and Shiplock due to the ever-rising sea level.
Study area
The selected study area is Kuching City and its surrounding. Kuching is located in southern region of Sarawak as presented in Figure 1A. The city covers 431 km2 and has 705,000 people (Sarawak Government, 2020). The western portion of Kuching is mainly covered with lowland peat, whereas mangrove swamps mostly cover the eastern part (Sarawak Government, 2020).
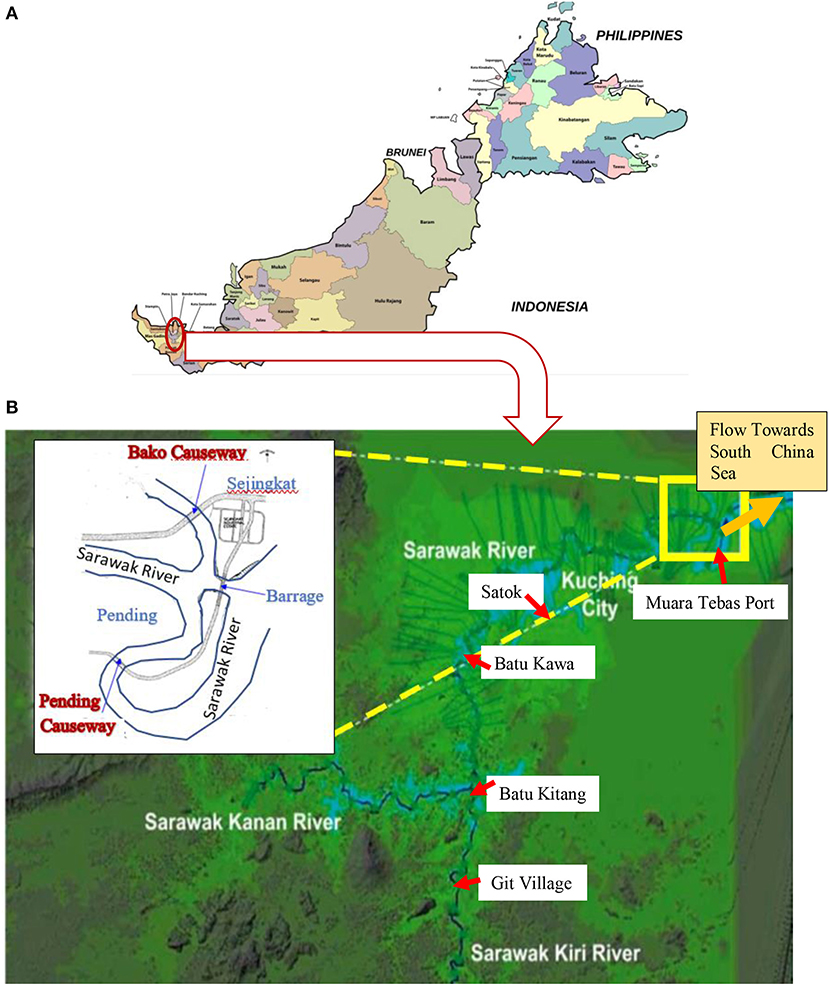
Figure 1. River system of the Sarawak River basin. (A) Locality map of Sarawak River basin. (B) Locality of rainfall and water level stations (Kuok et al., 2021).
Kuching City has an average elevation of 5 m above mean sea level and has an average annual rainfall level of 4200 mm with 250 rainy days per year (Kuok and Chiu, 2020). The average precipitation for January, February, March, April, May, June, July, August, September, October, November and December are found to be 692, 535, 365, 266, 256, 206, 185, 215, 285, 345, 365, and 485 mm, respectively. On average, January is the wettest month with 692 mm of precipitation, and July is the driest month with 185 mm of precipitation (Kuok and Chiu, 2020).
Kuching is situated downstream of the Sarawak River basin, with the confluence of minor streams including Maong, Bintangor, Padungan, Sekama, Bintawa, and Biawak rivers (Kuok et al., 2017). The Sarawak River discharges into the South China Sea near Pending through the Kuching Barrage's water gates (Lai et al., 2019). The Sarawak River is 120 km long and has a catchment area of 1,500 km2. Sarawak River is divided into two main tributaries in the upper catchment: Sarawak Kanan River and Sarawak Kiri River. Sarawak River Regulation Scheme (SRRS) was established in 1997 to avoid fluvial and tidal floods in Kuching and the surrounding areas (Abdillah et al., 2013). SRRS was built by the Sarawak State Government to regulate the water flow in and out of the Sarawak River to safeguard Kuching city from increasing sea levels. Currently, Kuching Barrage is the only outlet from the basin, and two rivers were creeked in order to construct the Bako and Pending causeways, as seen in Figure 1B.
Kuching is situated on the south bank of the Sarawak River. The Sarawak River is an essential source of water and transportation for the inhabitants of southwestern Sarawak. The river is also used for water-related sports, such as the yearly Sarawak Regatta, which draws visitors worldwide. Many historical buildings and amenities may be found along the Sarawak Rive, including the Astana, the official residence of the Governor of Sarawak, the New Sarawak State Legislative Assembly Building, and Fort Margherita. Five bridges were constructed to cross the Sarawak River including Satok Bridge, Tan Sri Sulaiman Daud Bridge, Tun Salahuddin Bridge, Pending and Bako Causeways, and Jalan Keruing Bridge. Aside from that, two pedestrian bridges, the rebuilt Satok suspension bridge and the Darul Hana S-curve Bridge near the Kuching waterfront, were built to connect the north and south Sarawak River banks.
In this study, the water level from Git village at upper steam to Kuching Barrage and shiplock at the river mouth are investigated, covering Maong river, Matang Jaya, Bintawa/Pending, and Bako. Git village is a small village, mostly covered with virgin jungle. The Maong River is a tributary of the Sarawak River, connected to the Sarawak main river about a half-kilometer from Kuching's city center. Matang Jaya is a mixed development area in Matang, Kuching. There are around 2,000 residential dwellings and commercial shop lots in the area. Other nearby housing estates are MetroCity, Taman Lee Ling, Taman Matang Avenue, Taman Matang Baru, Taman Matang Jaya 2, Taman Pah Tah, Taman Peony, Taman Sri Perkasa, Taman Syn Syn and Taman Yen Yen. Some nearby schools are SK Matang Jaya, SK Petra Jaya, SM Al Amin Kuching, SM Sains Kuching Utara, and SR Islam Al Amin Kuching.
Pending, meanwhile, is a district in Kuching, Sarawak, Malaysia, administered by the Kuching South City Council. It is home to many local fishermen, mostly of Chinese ethnicity. Pending light industrial, PRIMA homes, residential estates, and commercial shop lots are also located there. On the other hand, Bako is known for having Sarawak's oldest National Park. The park is about 37 km from the city of Kuching. The proboscis monkeys are the major attraction of this national park. This national park also has beach vegetation, cliff vegetation, heath forest, mangrove forest, mixed dipterocarp forest, grasslands vegetation, peat swamp forest, and seven full ecosystems.
Methodology
The impact of sea level rise on Kuching City was studied using the Infoworks RS hydrodynamic modeling software. LiDAR data, rainfall, and river cross-sections were acquired from the (Department of Irrigation and Drainage (DID), 2020). Sarawak for model construction, while sea level data was extracted from the Sarawak Marine Department's 2020 Sarawak Tide Tables booklet and the iHydro website. LiDAR data is essential in determining Kuching City's ground elevation. The highest King Tide data for 2020 was extracted from the tidal book used in the model simulation.
Meanwhile, rainfall and water level data from the Sarawak River basin were retrieved from DID Sarawak's Online Hydrological Telemetry System. The rainfall stations used for in this study are Git village, Batu Kitang, Batu Kawa, Satok and Muara Tebas as presented in Figure 1B. For model simulation, the rate of sea level rise until 2080 is estimated to be 3.6 mm/year (Lindsey, 2019). All of the information gathered was used to create a hydrodynamic model starting from Kampung Git Station to Muara Tebas Port. The discharge rating curve calculation in Eq. 1 was used to transform the stage-time data for Kampung Git station into flow-time data [Department of Irrigation and Drainage (DID), 2020].
Where Q is the discharge flow rate (m3/s), H is the river stage (m). The flow chart for the research methodology is presented in Figure 2.

Figure 2. Flow chart for research methodology.
Hydrodynamic modeling was developed in InfoWorks RS to generate the flood map. The hydrodynamic model was fed with various data obtained from DID Sarawak, including boundary conditions, river networks, and DEM ground model with 30 m resolution, land use, hourly rainfall and water level data. A total of 155 river cross-sections spanning over 47 Km were input into the model, with initial manning roughness coefficients of 0.095 and 0.12 for the riverbed and riverbank, respectively. Subsequently, LiDAR data was then imported as a Ground Model TIN. In InfoWork RS, thematic guidelines were used to represent the elevation with different colors. The river network was built using the “node” and “link” functions in Infoworks.
The data used for model calibration was extreme heavy rainfall and king tide events on 10 January 2020 and validated with extreme heavy rainfall and king tide events on 4 November 2020. The maximum rainfall intensity recorded for extreme heavy rainfall on 10 January 2020 was 85.5 mm/h, with 50 years average recurrence interval (ARI), as presented in Figure 3. The calibration process began with the extraction of Sarawak River discharge from Git village, Batu Kitang, Batu Kawa, and Satok, and then fine-tuning the manning roughness coefficients for riverbed and riverbank until the calibrated runoff matched the observed runoff as closely as feasible. The calibrated hydrodynamic model was validated by inputting a new rainfall data set on 4 November 2020.
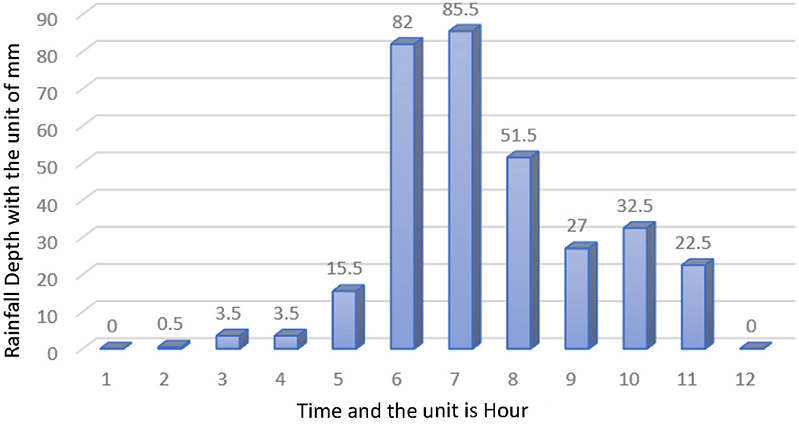
Figure 3. Extreme heavy rainfall with 50-year ARI on 10 Jan 2020.
The simulations were run for the years 2050 and 2080 after setting the lower boundary at the Muara Tebas Port, the upper boundary at the Kampung Git Station and inputting all of the relevant data. For model simulation, the stage time data value at Muara Tebas Port, which is located in a coastal zone and is influenced by tides, was increased by 36 mm or 0.036 m for every 10 years. Muara Tebas Port was selected due to its accessibility to LiDAR data and proximity to the sea. Every 10 years, the hydrodynamic model is assessed to see if there are any notable alterations in flood maps, which display the flood tab on the geoplan theme. The flood map is used to determine which areas of Kuching City have been affected by flooding as a result of increasing sea levels combined with excessive heavy rainfall.
Three simulated scenarios were created to compare the existing flood situation in Kuching City in 2020 to the anticipated years of 2050 and 2080. The main purpose is to assess which parts of Kuching City are prone to flooding and how sea level rise would affect Kuching City's flood coverage. To study the impact of sea level rise to river flow within the Sarawak River basin, all of the gates at the Kuching Barrage are assumed to be fully opened. Following are the three primary scenarios that were investigated:
a) Scenario 1: flood map for the year 2020 with sea level of 5.9 m and extreme heavy rainfall.
b) Scenario 2: flood map for the year 2050 with sea level of 6.008 m and extreme heavy rainfall.
c) Scenario 3: flood map for the year 2080 with sea level of 6.116 m and extreme heavy rainfall.
Results and discussion
Sea level along the Sarawak River was compared, as well as the extent of inundated areas due to projected sea level rise from 2020 to 2050 and 2080. This were accomplished by focusing on the main areas along the Sarawak River in Kuching City, including Tanjong Bako village, Bintawa, Pending, Matang Jaya, and Sungai Maong. To simulate the worst-case scenario, the barrage gates are assumed to be fully opened and allowing backflow of seawater.
Figure 4A shows a flood map for Muara Tebas Port for 2020. Regarding the present King Tide sea level, Figure 4A demonstrates that no location in Kuching City along the Sarawak River was inundated in 2020. According to the flood map, water is still flowing within the river channel and there is no overflow. Even with a King Tide Sea level of 5.9 m, which is the maximum water level recorded for Muara Tebas Port in 2020 Sarawak Tide Tables book, Kuching City is not facing any serious inundation or floods owing to backflow of seawater. The Kuching Barrage has no spillage on the 2020 flood map, showing that it can still support the current sea level.
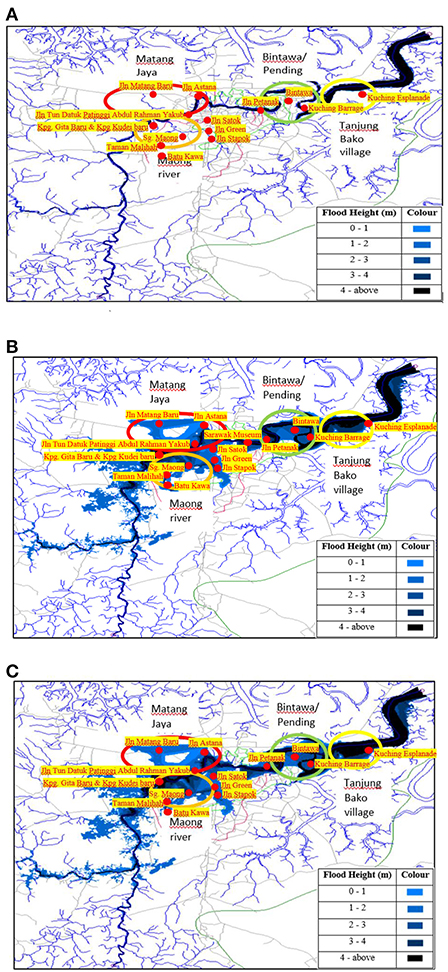
Figure 4. Flood Map generation for Years 2020, 2050, and 2080. (A) Flood Map for the Year 2020. (B) Flood Map for the Year 2050. (C) Flood Map for the Year 2080.
The water level in the river segment increased dramatically when the Kuching Barrage gate was opened in conjunction with the increase in sea level by 2050. When the water level rises above the riverbank, there will be spillage and flooding in the surrounding areas. Figure 4B shows that many areas in Kuching City along the Sarawak River, especially the low-lying areas, are expected to be flooded by 2050. As a result of sea level rise, flood levels of 1 to 2 m have been estimated in the areas of Jalan Astana, Jalan Green, Jalan Satok, Jalan Stapok, Jalan Tun Datuk Patinggi Haji Abdul Rahman Yakub, Sungai Maong, Matang Jaya. Figure 4B shows that locations near the Kuching Barrage, such as the Kuching Isthmus and the Bintawa area, will be swamped by water levels up to 2 m by the year 2050. Meanwhile, the maximum flood height of 3 m has been predicted at Jalan Petanak and Jalan Kampung Tanjong Bako. The Kuching Esplanade is expected to be severely flooded by 2050, with flood levels reaching 3 m and stretching 1.5 km inland. The Sarawak Museum that is located at higher ground, is also expected to be flooded for 1 m height.
By 2050, flood levels in Sungai Maong are anticipated to reach 3 m. The floodwaters from Sungai Maong, a little minor creek, are expected to reach Richmond Hill and Batu Kawa. The highest water level of 4.153 m is estimated at Jalan Batu Kawa by 2050. Generally, the backflow of sea level rise is expected to bring greater impact on low-lying areas such as Sungai Maong and Jalan Kampung Tanjong Bako areas, that are expected to face substantial flooding.
Figure 4C presents the flood map by 2080. The simulation results show that the inundated level in 2080 is predicted to be deeper compared to 2050. Flood levels are anticipated to rise to 4 m in low-lying areas such Jalan Kampung Tanjung Bako, up from 3 m in 2050. Meanwhile, water levels are anticipated to rise from 1 m in 2050 to 2 m in 2080, for Pending and Bintawa areas. The area close to Jalan Astana was predicted to have a 1 m rise in flood depth when compared to the flood map from 2050. Generally, the low-lying areas are expected to experience 1 m flood depth increment from 2050 to 2080. Table 1 shows the comparison of flood height and affected area for 2050 and 2080.
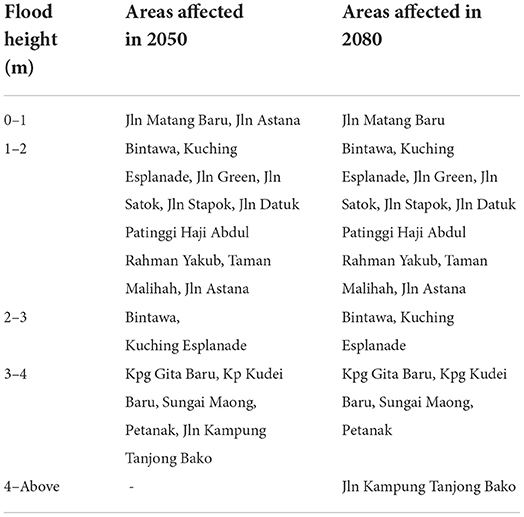
Table 1. Flood height and affected areas.
Conclusions
The global average sea level has risen as a result of climate change. This research has successfully studied the effect of backflow of seawater cum extreme heavy rainfall in the Sarawak River basin when the barrage gates are extensively opened. According to the generated maps, many low-lying regions within the Sarawak River basin will be submerged by 2050 and 2080 when the barrage gates are fully opened. Compared to 2050, the flood map for 2080 revealed an increase in maximum flood extent and depth at low-lying areas along Sarawak River. In general, this study found that the average flood depth increment in 2080 is 1 m compared to 2050. As a result, relevant authorities must adopt proactive mitigation measures to protect the wonderful land of Kuching from catastrophic floods caused by climate change.
The potential mitigation measures are:
a) To construct bunds in the coastal area and river bank to prevent the floods.
b) To construct a high-capacity pumping station to pump the excess water within the river basin into the South China Sea.
c) Reconstruct more enormous barrage gates to prevent seawater from flowing into Sarawak River Basin.
Data availability statement
The raw data supporting the conclusions of this article will be made available by the authors, without undue reservation.
Author contributions
KK is responsible to lead the project. MM and PC are responsible for hydrodynamic model development. MC is responsible for extracting the data from InfoBanjir online portal. MR is responsible to edit the manuscript. MB was proofreading the manuscript. All authors contributed to the article and approved the submitted version.
Conflict of interest
The authors declare that the research was conducted in the absence of any commercial or financial relationships that could be construed as a potential conflict of interest.
The reviewer CB declared a shared affiliation with authors PC and MR to the handling editor at the time of review.
Publisher's note
All claims expressed in this article are solely those of the authors and do not necessarily represent those of their affiliated organizations, or those of the publisher, the editors and the reviewers. Any product that may be evaluated in this article, or claim that may be made by its manufacturer, is not guaranteed or endorsed by the publisher.
References
Abdillah, N., Teo, F. Y., Jusoh, A. M., Fauzi, M. F., Hassan, A. M. M., Darus, A., et al. (2013). “Model assessment of water quality in Sarawak River, Malaysia,” in Proceedings of 35th IAHR World Congress, 1–9.
Department of Irrigation and Drainage (DID) (2020). Sarawak Hydrological Yearbook 2020, Vol. 47. Sarawak: Department of Irrigation and Drainage Sarawak.
Dutta, D. (2011). An integrated tool for assessment of flood vulnerability of coastal cities to sea-level rise and potential socio-economic impacts: a case study in Bangkok, Thailand. Hydrol. Sci. J. 56, 805–823. doi: 10.1080/02626667.2011.585611
Erban, L. E., Gorelick, S. M., and Zebker, H. A. (2014). Groundwater extraction, land subsidence, and sea-level rise in the Mekong Delta, Vietnam. Environ. Res. Lett. 9, 084010. doi: 10.1088/1748-9326/9/8/084010
Ercan, A., Bin Mohamad, M. F., and Kavvas, M. L. (2013). The impact of climate change on sea level rise at Peninsular Malaysia and Sabah–Sarawak. Hydrol. Process. 27, 367–377. doi: 10.1002/hyp.9232
Kuok, K. K., and Chiu, P. C. (2012). Particle swarm optimization for calibrating and optimizing Xinanjiang model parameters. Int. J. Adv. Sci. Appl. 3, 115–123. doi: 10.14569/IJACSA.2012.030917
Kuok, K. K., and Chiu, P. C. (2020). Optimal rainwater harvesting tank sizing for different types of residential houses: pilot study in Kuching, Sarawak. J. Eng. Sci. Technol. 15, 541–554.
Kuok, K. K., Chiu, P. C., and Chin, M. Y. (2021). Sarawak River flow behaviour after matang bypass channel construction during low tide using Infoworks River Simulation (RS). J. Environ. Prot. 12, 36–48. doi: 10.4236/jep.2021.121004
Kuok, K. K., Chiu, P. C., and Mersal, M. E. (2017). Investigation of Sarawak River Kiri Sedimentation before and after bengoh dam construction. Int. J. Geol. Agric. Environ. Sci. 5, 9–12.
Lai, W. Y., Kuok, K. K., Gato-Trinidad, S., and Ling, K. X. (2019). A study on sequential k-nearest neighbor (SKNN) imputation for treating missing rainfall data. Int. J. Adv. Trends Comput. Sci. Eng. 8, 363–368. doi: 10.30534/ijatcse/2019/05832019
Lindsey, R. (2019). Climate Change: Global Sea Level. National Oceanic and Atmospheric Administration (NOAA), National Ocean Service. Silver Spring. Available online at: https://www.climate.gov/news-features/understanding-climate/climate-change-global-sea-level (accessed May 1, 2022).
Lindsey, R. (2020). Climate Change: Global Sea Level. National Oceanic and Atmospheric Administration. Available online at: https://www.climate.gov/news-features/understandingclimate/climate-change-global-sea-level#:~:text=From%202018%20to%202019%2C%20global,0.24%20inches%20(6.1%20millimeters) (accessed March 18, 2020).
Lindsey, R., and Dahlman, L. (2020) Climate Change: Global Temperature. National Oceanic Atmospheric Administration. Available online at: https://www.climate.gov/news-features/understanding-climate/climate-change-global-temperature (accessed March 18, 2020).
Minderhoud, P. S. J., Coumou, L., Erkens, G., Middelkoop, H., and Stouthamer, E. (2019). Mekong delta much lower than previously assumed in sea-level rise impact assessments. Nat. Commun. 10, 1–13. doi: 10.1038/s41467-019-11602-1
NAHRIM (2019). Impact of Climate Change to Sea Level Rise in Malaysia. Coastal and Oceanography Research Centre. Available online at: https://www.iges.or.jp/sites/default/files/inline-files/12_NAHRIM%20Impact%20of%20Climate%20Change_1.pdf (accessed March 15, 2020).
Ruzaini, M. A. H., and Aslinda, N. A. (2018). Impact of sea level rise due to climate change: case study of Klang and Kuala Langat Districts. Int. J. Eng. Technol. 10, 59–64. doi: 10.7763/IJET.2018.V10.1035
Sarawak Government (2020). Sarawak Population. Available online at: https://www.sarawak.gov.my/web/home/article_view/240/175/ (accessed March 11, 2020).
Takagi, H., Mikami, T., and Esteban, M. (2016). Projection of coastal floods in 2050 Jakarta. Urban Clim. 17, 135–145. doi: 10.1016/j.uclim.2016.05.003
Keywords: sea level rise, climate change, Infoworks River Simulation (RS), flood map, flood depth
Citation: Kuok KK, Mersal ME, Chiu PC, Chin MY, Rahman MR and Bakri MKB (2022) Climate change impacts on sea level rise to flood depth and extent of Sarawak River. Front. Water 4:870936. doi: 10.3389/frwa.2022.870936
Received: 07 February 2022; Accepted: 25 October 2022;
Published: 11 November 2022.
Edited by:
Chow Ming Fai, Monash University Malaysia, MalaysiaReviewed by:
Siti Fatin Mohd Razali, Universiti Kebangsaan Malaysia, MalaysiaCharles Bong, Universiti Malaysia Sarawak, Malaysia
Su Kong Ngien, Universiti Malaysia Pahang, Malaysia
Copyright © 2022 Kuok, Mersal, Chiu, Chin, Rahman and Bakri. This is an open-access article distributed under the terms of the Creative Commons Attribution License (CC BY). The use, distribution or reproduction in other forums is permitted, provided the original author(s) and the copyright owner(s) are credited and that the original publication in this journal is cited, in accordance with accepted academic practice. No use, distribution or reproduction is permitted which does not comply with these terms.
*Correspondence: King Kuok Kuok, a2t1b2tAc3dpbmJ1cm5lLmVkdS5teQ==