 Laura De Simone Borma1*
 Wilian Carlo Demetrio1
 Ranieli Dos Anjos De Souza2,3
 Anne Verhoef4
 Alberto Webler5Renata Gonçalves Aguiar5
- 1Division of Impact, Adaptation and Vulnerability (DIIAV) of the National Institute for Space Research (INPE), Sao Jose dos Campos, São Paulo, Brazil
- 2Division of Earth Observation (DIOTG) of the National Institute for Space Research (INPE), Sao Jose dos Campos, São Paulo, Brazil
- 3Space Research Group (GREES) of the Federal Institute of Education, Science and Technology of Rondônia (IFRO), Colorado do Oeste, Brazil
- 4Department of Geography and Environmental Science, The University of Reading, Reading, United Kingdom
- 5Department of Environmental Engineering, Federal University of Rondonia (UNIR), Ji-Paraná, Brazil
The present work aimed to investigate the potential sources of water for plants in an area of evergreen forest located in western Amazonia (Rebio Jaru). We used a natural abundance of water isotopes—δ2H and δ18O—to trace the main source of water to plants at the beginning of the dry period (May 2016) and at the end of the dry period/transition to the wet period (October 2016) following a severe El Niño drought (ENSO 2015/16). Soil samples were collected in a soil profile up to 4 m depth. Plant samples from 18 trees (14 species) were collected in May and in October 2016. Rainwater and river water samples were collected between September 2015 and February 2017. We found that, at the end of the dry period/transition to the wet period (i.e., October 2016), the average plant xylem signal was more enriched (δ2H: −20.0 ± 8.1‰; δ18O: −1.13 ± 1.88‰) than in May 2016 (δ2H: −36.7 ± 5.6‰; δ18O: −3.50 ± 1.30‰), the onset of the dry period. The averaged isotopic soil signal in May 2016 (δ2H: −35.4 ± 5.90‰; δ18O: −5.19 ± 0.70‰) is slightly more depleted than in October (δ2H: −27.6 ± 13.8‰; δ18O: −4.35 ± 1.73‰) and, in general, more depleted than the xylem signal. In the dual isotope space, the xylem signal at the beginning of the dry period follows the rainfall signal of the wet period, while the xylem signal at the end of the dry period/transition to the wet period follows the signal of the dry season rainfall, suggesting that plants mostly transpire recent rainwater. Contrary to what was expected, we did not find evidence in the xylem signal of the water stored in the soil pores, which suggests that to meet to the water demands of the dry period, plants do not use the water from past periods stored in the soil layers.
Introduction
An improved understanding of how the Amazon forest behaves under seasonal and prolonged droughts is crucial to help predict the future of the Amazon forest when it faces a drier and warmer climate, as is projected to occur as a result of local and global anthropogenic drivers (Seneviratne et al., 2013; Berg et al., 2016). Observations at several Amazonian experimental sites indicate dry-season evapotranspiration rates (ET) and forest productivity comparable to, or even exceeding, wet season values (Shuttleworth, 1988; Restrepo-Coupe et al., 2013; Wu et al., 2017). Some studies also suggest that Amazon forests are resilient to extreme droughts (Saleska et al., 2016), thus contradicting current perceptions and simulation results from most Earth system models, which show a decrease in ET and productivity during the dry season and drought periods, as a result of limited water availability (Christoffersen et al., 2014).
In the Amazon, the deep root water uptake (deep-RWU) has been widely identified to explain the forest resilience to droughts (Nepstad et al., 1994; Jipp et al., 1998; Bruno et al., 2006) and the maintenance of relatively high ET values during seasonal dry periods (Shuttleworth, 1998). It has been proposed that the larger trees, which have the highest transpiration rates, would be mainly responsible for the higher ET rates (Kunert et al., 2017). However, challenging deep-RWU as a mechanism of resilience to droughts, some studies have shown that the larger trees, which potentially have the deeper root systems, presented higher mortality rates during experimental (Nepstad et al., 2007) and natural extreme droughts (Phillips et al., 2010). In fact, in experiments where the wet season rainfall was suppressed by plastic panels placed above the canopy, the larger trees (diameter at breast height, DBH > 10 cm) and the lianas presented the higher mortality rates after 2 years of rainfall exclusion (Nepstad et al., 2007).
Severe droughts are part of the natural climate pattern of the Amazon (Marengo, 2004) and their occurence can be used to increase our understanding of the Amazon forest's response to droughts. Long-term meteorological measurements suggest that the 2015/2016 El Niño drought was the warmest observed to date period in the Amazon basin (Jiménez-Muñoz et al., 2016). In the Biological Reserve of Jaru (Rebio Jaru—RJA site), a very seasonal experimental site located in the southwestern Amazon, Souza et al. (2022) investigated the forest response to the 2015/2016 El Niño drought by measuring enhanced vegetation indices (EVI), green chromatic coordinate (Gcc) vegetation indices, and plant physiological traits, such as the potential at which plants lose 50% of the hydraulic conductance (P50), turgor loss point (πTLP), and hydraulic safety margin (HSM), which characterizes plant resistance to droughts (Sperry et al., 2002). They found that the tropical forest at this experimental site is formed by species with low to moderate resilience to droughts. However, only a small reduction in the EVI (from 0.52 to 0.48; dimensionless) was found during the dry period of the 2015/16 El Niño drought (May 2016 to October 2016) (Souza et al., 2022). It suggests that the sampled trees have mechanisms to deal with severe droughts, without a significant impact on the canopy structure and, consequently, on ET rates and photosynthesis (Souza et al., 2022). However, questions still arise about the potential sources of water that maintain elevated ET rates at this site and the Amazon forest in general.
The natural abundance of heavy water isotopes (2H and 18O) has been used to infer the potential water sources for plant transpiration (Ehleringer and Dawson, 1992) and, more recently, to track the movement of water in the vadose zone (Sprenger et al., 2016). To investigate the potential water sources which sustain elevated EVI and the ET rates in the Rebio Jaru site, during the dry period of the 2015/2016 El Niño drought, we used the natural abundance of stable isotopes of water—2H and 18O. The use of water isotopes to trace plant water sources is usually less common in tropical humid regions such as the Amazon forest than in arid regions (Sprenger et al., 2016; Sohel et al., 2021). This is because, in these environments, the soil isotopic signal is usually diluted by frequent infiltration of rain waters with different isotopic signatures; making the distinction between plant water sources stemming from different layers in the soil profile difficult (Sprenger et al., 2016). Here, we had the advantage that samples were taken during the dry period when rainfall amount and rainwater infiltration in the soil was strongly reduced. We combined information on soil physical properties, soil moisture, natural abundance of water isotopes at the wet-to-dry (WTD) transition period (May 2016) and at the dry-to-wet (DTW) transition period (October 2016), and leaf water potential at midday (ψmd) to test the hypothesis that, to attend the atmospheric and plant water demands of the dry period, plants take up water from the deeper soil layer (i.e., >1 m depth). We discuss the obtained results in terms of potential sources of water for plants, and the role of the water stress in the stem in the enrichment of the plant xylem observed in the peak of the dry period.
Materials and methods
Study area
The study site is located at Jaru Biological Reserve (Rebio Jaru), 10°11′11.4″S; 61°52′29.9″W, a national conservation area in the Rondônia state, Amazonas, at situated around 290 km from Porto Velho, the capital. The Rebio Jaru has a total area of 353,163 ha (IBAMA, 2007). Inside the reserve, flux tower was installed, owned by the LBA (Large Biosphere-Atmosphere Experiment in Amazonia) and operating since 1999 (Webler et al., 2007). At around 80 m far from the LBA flux tower was installed, in 2016, a permanent plot composed of 25 subplots of 20 × 25 m (Da Silva, 2021). Our soil and plant samples were collected from one of these subplots.
Rebio Jaru Reserve contains a forest characterized by a dense evergreen forest. The canopy average height is 20 ± 6.7 m, with emergent trees of about 44 m. Based on NOAA's 34-year historical series, the site's average annual rainfall is 1,923 mm, with a dry period of 5 months typically occurring between May and September (Sombroek, 2001). In terms of rainfall pattern, this site is considered one of the most seasonal LBA sites, with a longer dry period than the other LBA sites (Restrepo-Coupe et al., 2013).
Samples collection
Disturbed and undisturbed soil samples were collected from a soil profile up to 4 m deep (at 0.05, 0.1, 0.15, 0.2, 0.4, 0.8, 1.2, 1.6, 2, 3, and 4 m). Undisturbed soil samples were used to determine soil water retention curves (SWRCs), while disturbed soil samples were used to determine the soil physical properties and for isotopic analysis. Plant samples for isotopic analyses were collected from 18 individuals from 14 different plant species located in the study area (Supplementary Table 1) (Souza et al., 2022). For isotopic analysis, soil and plant samples were collected in two periods—May 2016 and October 2016. To collect soil samples in these two different periods, we used two different pits <5 m apart. To avoid evaporation and fractionation, for each tree, we used suberized twig segments (i.e., 1–2 cm diameter), from which we removed the bark before storing the sample to avoid mixing between the phloem and xylem water. Plant and soil samples were quickly sealed in vials, tightly wrapped with parafilm, kept refrigerated in the field, and frozen in the laboratory until water extraction. Rainwater samples were collected during rainfall events between September 2015 and October 2016. Seven water samples were collected in the Machado River (March and June), 1.2 km away from the EC flux tower. Rainfall samples were not mixed, so the data presented here refer to event-specific values and not to averaged monthly values.
Environmental conditions
To characterize the environmental conditions during the experiment, we used precipitation (P) and soil moisture (θ) data obtained from the EC flux tower between September 2015 and October 2016. Precipitation amounts were automatically measured by a rain gauge (Environmental Measurements Ltd.—Arg 100). Soil moisture content was measured using Timing Domain Reflectometers (TDR), installed at 0.2, 0.4, 0.6, 0.8, and 1 m depths. These data were collected and treated by the LBA office at Rebio Jaru. Evapotranspiration data were obtained from MODIS (Muler, 2018). The dry period, that is, months where P < 100 mm (Sombroek, 2001), occurred between May and September (2016) (Figure 1A). The driest month in our sampling period was July 2016, when no rainfall was registered. The lowest soil moisture conditions along the first meter of the soil profile were recorded in September 2015 and September 2016 (Figure 1B). In the present work, isotopic measurements in soil and xylem water were performed in May and October 2016, which are considered, respectively, as the WTD and the DTW transition periods.
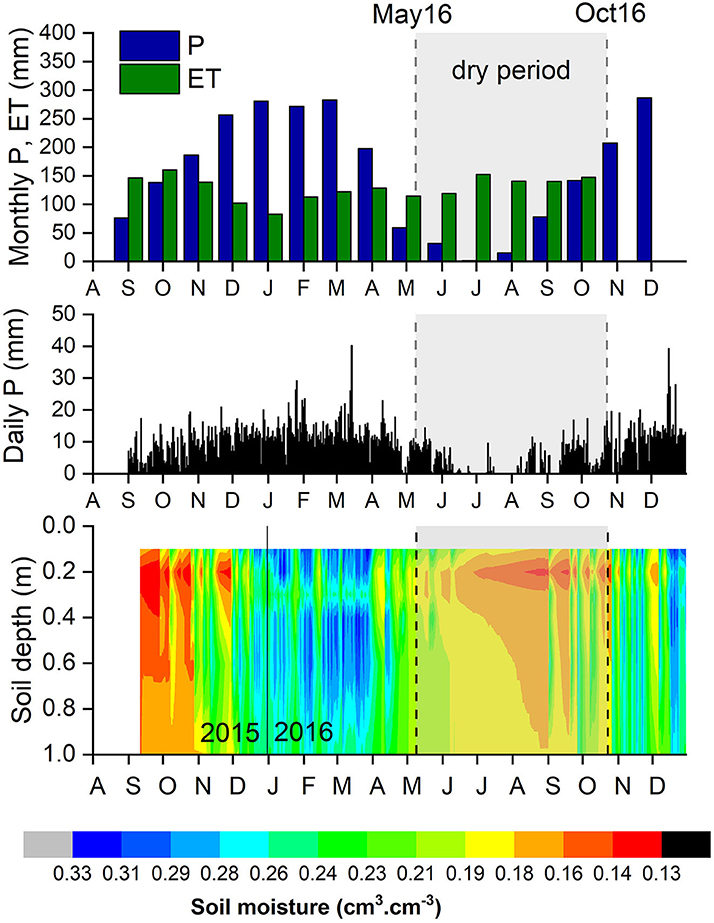
Figure 1. Environmental conditions in the study area from September 2015 to December 2016. (A) Averaged monthly precipitation (P, mm; blue bars) and ET rates (mm; green bars). (B) Daily precipitation rates (mm), and (C) soil water content (θ, cm3cm−3) at the upper meter of the soil profile. ET data from MODIS (MOD16A2; Souza et al., 2022); monthly and daily P, and θ obtained from the LBA data from the Rebio Jaru EC flux tower.
Soil physical properties and plant traits
The measured soil physical properties comprise: (i) soil texture, determined according to the Bouyoucos method (Bouyoucos, 1927; Gee and Bauder, 1986); (ii) soil dry bulk density, ρd, determined from the ratio of the mass of oven-dried soil (at 105°C for 48 h) and the volume of the soil core samples; (iii) soil-water retention curves (SWRCs), obtained using a tension table (for soil suctions of 0, 1, 2, 4, 6, 10, 30, 50, 100, and 500 kPa) and pressure chamber (for 1,500 kPa), and (iv) total porosity (φ), determined by 1 – ρd/ρs, with the density of soil particles, ρs, taken as 2.65 g cm−3.
Soil cation exchange capacity (CEC) was obtained by the sum of exchangeable contents of Ca, Mg, Al (extracted by KCl 1 mol L−1), and K (Mehlich−1) following standard methodologies (Teixeira et al., 2017). Soil organic matter was obtained using the Walkley–Black method (Walkley and Black, 1934).
The SWRCs for each soil layer were fitted using the van Genuchten (1980) equation
where θ is the volumetric water content (cm3 cm−3), and θs and θr are the saturated and residual water content (cm3 cm−3), respectively; h is the soil suction (hPa), and α (hPa−1) and n are empirical parameters. The van Genuchten parameters required in Equation (1) (θs, θr, α, n) were found by fitting 9 h-θ data-pairs (one set for each sampled layer) with the excel solver (non-linear least-squares fitting) to find the best adjustment between the observed and the estimated soil moisture. Parameters were calculated for each layer, with r2-values >0.97 for all layers (Supplementary Table 2).
Total plant-available water (TAW), in cm3 cm−3, was calculated as the difference between the volumetric water content at the field capacity (θFC) and the water content at the permanent wilting point (θPWP), with FC taken at a suction, h, of 33 kPa and PWP at a suction of 1,500 kPa (1.5 MPa). From the fitted SWRCs (Supplementary Figure 1) for each soil depth, we derived four classes of pore sizes: macropores (Ma, equivalent pore diameter, ϕ, > 300 μm), mesopores (Me, 300 < ϕ < 50 μm), micropores (Mi, 50 < ϕ < 0.2 μm), and cryptopores (Cr, ϕ < 0.2 μm) (Teixeira et al., 2017).
According to the capillarity equation (Washburn, 1921; Rowell, 1994):
where h is the suction in (Pa) and r is the pore radius in m, for macroporosity, h < 1 kPa; mesoporosity 1 < h < 6 kPa; microporosity 6 < h < 1,500 kPa, and for Cr, h > 1,500 kPa. According to Rowell (1994), soil pores diameters (ϕ) of 50 μm or larger (i.e., Ma+Me; h < 6 kPa) corresponds to the “transmission pores” (Tr), while ϕ between 50 and 0.2 μm (i.e., Mi + Cr; h > 6 kPa) refers to water “storage pores” (St pores). To compare the soil's physical properties along the 4 m soil profile, we computed TAW and pore size distributions as a percentage of the total porosity (φ).
Plant traits such as tree height (H, m) and circumference at breast height (CBH, cm) were measured with a tape measure. Circumference at breast height was transformed into DBH (cm) by dividing CBH by π. The leaf water potential at midday (ψmd, MPa), which is an indicator of plant water stress, was measured with a Scholander camera (PMS Instruments Co., Albany, NY, USA). These measurements were taken in October 2016, the DTW transition period.
Isotopic analysis
The isotopic ratios of H (δ2H) and O (δ18O) (Coplen, 2011) of the collected and extracted waters were analyzed by laser absorption spectroscopy using a Picarro Li2130. We used two different standards—PLRM1 (δ2H: 16.9‰ and δ18O: 1.65‰) and PLRM2 (δ2H: −123.1‰ and δ18O: −16.52‰)—and one Quality Control (δ2H: 46‰ and δ18O: 7.25‰), previously calibrated with the V-SMOW (Vienna Standard Mean Ocean Water).
Deuterium excess (d-excess) was calculated according to (Dansgaard et al., 1964):
Soil and plant water samples were extracted using the cryogenic distillation method. To prevent the influence of organic contamination in the isotopic results, we immersed activated charcoal for 48 h in the extracted soil and plant water samples. Besides that, the Picarro CRDS L2130-i instrument used has a built-in software—Post Process Chemcorrect—that flags any sample with organic contamination. If samples flag once, they are re-analyzed; and if they flag two times, isotopic analysis is done in the isotope ratio mass spectrometry (IRMS). During our study, no sample was required to be re-analyzed or transferred to the IRMS.
Data analysis
In the dual-isotope space (δ2H × δ18O), we used analysis of covariance (ANCOVA) to identify differences among the slopes of Global Meteorological Water Line (GMWL), Local Meteorological Water Line (LMWL), River Water Line (RWL), Plant Water Line (PWL), and Soil Water Line (SWL) on the dual isotopic space. We used Pearson's correlation to test the correlation between plant traits such as DBH, H, ψmd, soil physical properties (i.e., TAW and soil porosity), and δ18O and δ12H.
Results
Soil physical properties
Our results point to a very clayey soil, with clay content >60% along the entire 4 m profile, and sand content of ~30%, except at 2 and 2.4 m, where sand content decreases to values between 20% and 30% (Table 1). The soil presents a relatively high bulk density (ρd) > 1.3 g cm−3, with a distinctly denser layer (ρd > 1.65 g cm−3) occurring at 1.2 m depth (Table 1). Total soil porosity (Φ) is high relatively, with the lowest value (0.4 cm3 cm−3) occurring at 4 m depth. The soil porosity is mostly (>50%) formed by Cr pores (i.e., pores with ϕ < 0.2 μm; Table 2) where water is retained at suctions >1.5 MPa (Rowell, 1994). Consequently, this soil presents a high water retention capacity, with θPWP > 0.3 cm3 cm−3 for most of the soil layers and St pores >70% along the entire 4-m soil profile. The highest values of θPWP and St pores occur between 1.6 and 3 m depths (Figure 2; Table 2). Van Genuchten parameters for each layer are presented in Supplementary Table 2.
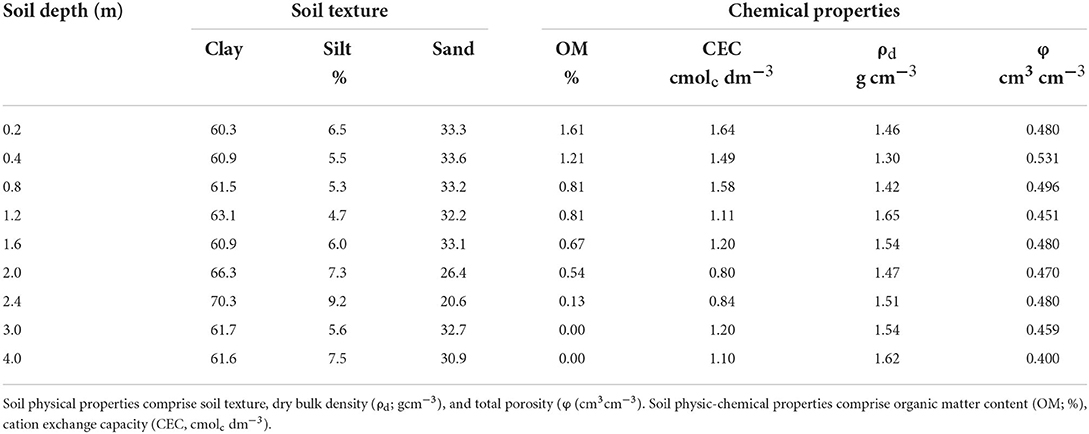
Table 1. Physical and physic-chemical soil properties along the upper 4 m of the soil profile.
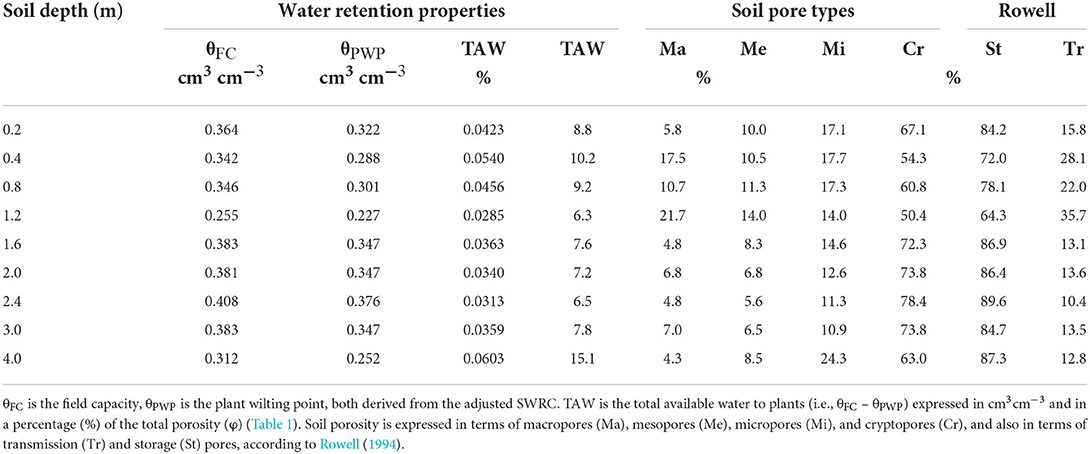
Table 2. Soil properties, expressed in terms of water retention properties and soil porosity for the upper 4 m of the soil profile.
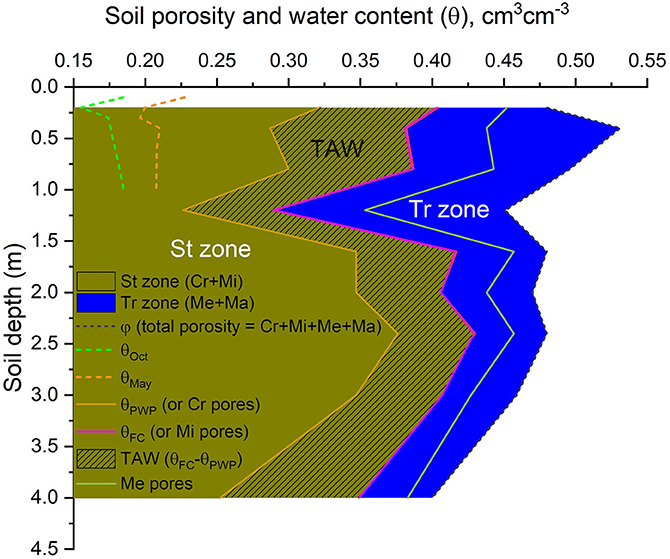
Figure 2. Soil properties expressed in terms of soil porosity, water content (θ), and plant water availability) for the upper 4 m of the soil profile. The yellow area is the storage (St) zone, which comprises the Cr (orange solid line) and Mi (pink solid line) pore sizes, and the blue area is the transmission (Tr) zone, which comprises the Me (in green) and Ma pores. Total porosity (φ; black dotted line) comprises the sum of Cr, Mi, Me, and Ma pores. In terms of water availability conditions, θFC is the field capacity, and coincides with Mi pores (pink solid line), θPWP is the plant wilting point and coincides with the Cr pores (orange solid line), and TAW is the total available water to plants (i.e., θFC – θPWP; yellow dashed area). It is also shown soil moisture conditions (cm3 cm−3) at the upper meter of the soil profile, in May 2016 (dashed line in green) and in October 2016 (dashed line in orange) based on EC flux tower data from LBA. Data used are presented in Table 2.
Isotopic analysis
During our sampling period, the isotopic signal of rainfall water ranged between −82.2 and 36.7‰ for δ2H and between −10.1 and 12.2‰ for δ18O (Figures 3A,B; Table 3). δ2Hxylem ranged from −46.6 to −27.3‰ and δ18Oxylem ranged from −5.0 to −0.2‰ in May, while in October, xylem water presented more enriched values for both water isotopes, with δ2H ranging from −35.9 to −9.6 ‰ and δ18O from −3.7 to 2.4‰. Similar behavior was observed for soil water signals with enriched values in the dry season, ranging from −42.9 to −27.5‰ and −46.3 to −10.8‰ for δ2H; and from −6.2 to −4.2‰ and −6.7 to −2.2 ‰ for δ18O in May and October, respectively (Table 3). Analysis based on single isotopic data (δ2H and δ18O; Figures 3A,B, respectively; Table 3) showed dry season rainfall (measured in May, June 2016, and October 2016), and throughfall isotopic water signals being more enriched than the wet season rainfall (measured in March, April, and December 2016, and January and February 2017), for both δ2H and δ18O. In May 2016, δ2Hxylem was in the range of δ2Hsoil, however, δ18Oxylem was more enriched than δ18Osoil (Table 3). In October 2016, δ2Hxylem plotted in the range of the more depleted δ2Hsoil, but, as in May 2016, δ18Oxylem is outside the range of δ18Osoil.
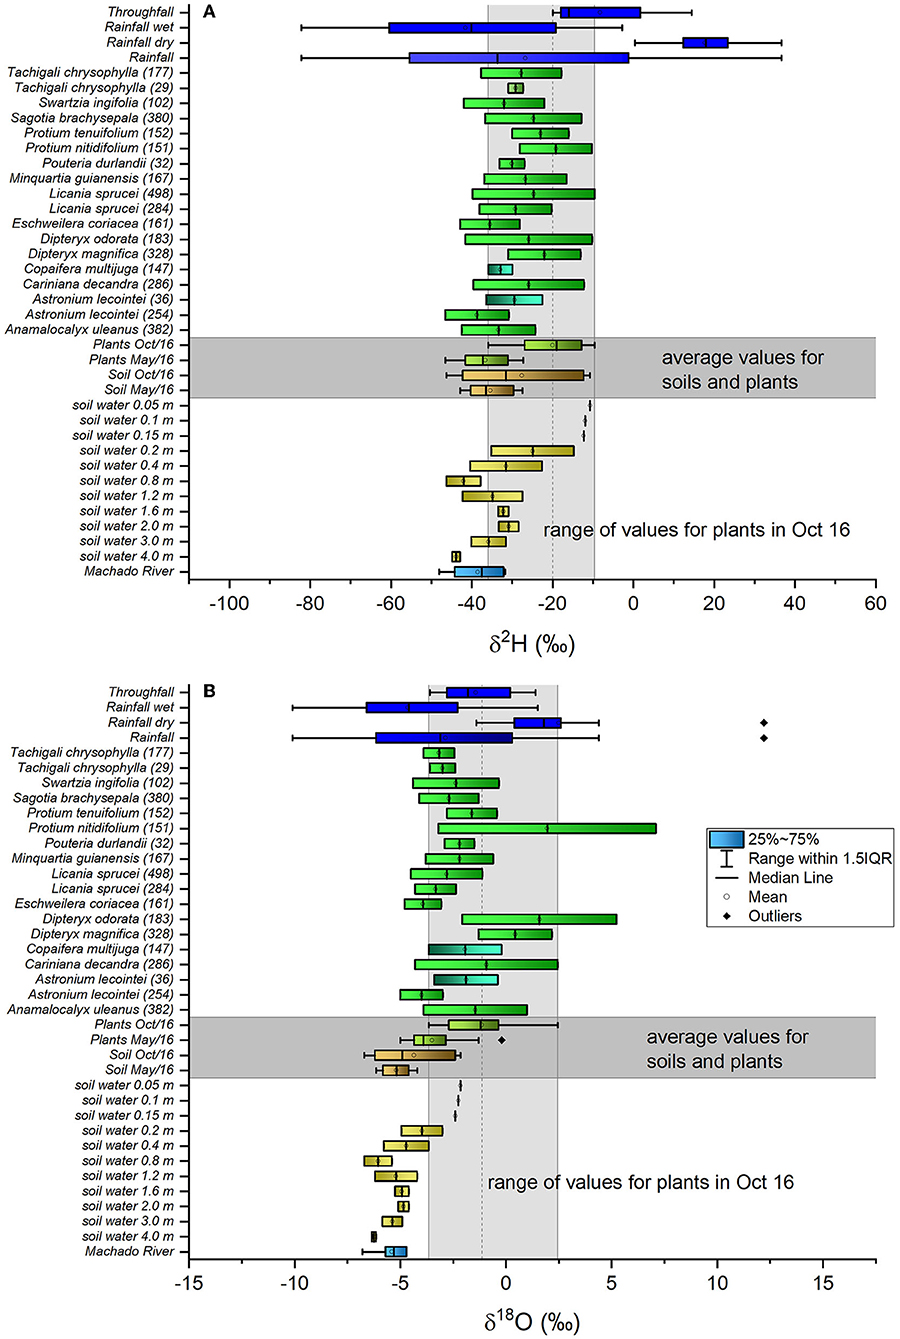
Figure 3. Boxplot charts for δ2H (A) and δ18O (B) signals for the rainfall (all periods, wet and dry periods, and throughfall) (in bright blue), xylem water (in May 2016 and October 2016) for all sampled trees (in green), soil water at various depths (in yellow), and river water (in blue–green) samples. It is also shown the averaged values of all xylem water signals (in green), and for all soil water signals (in brown) for May 2016 and October 2016. May 2016 is considered the wet-to-dry (WTD) transition period, and October 2016 is the dry-to-wet (DTW) transition period. The boxplots show median (black line), 1st and 3rd quartiles (box), max/min observations (upper and lower lines), and the outliers (black points), when present.
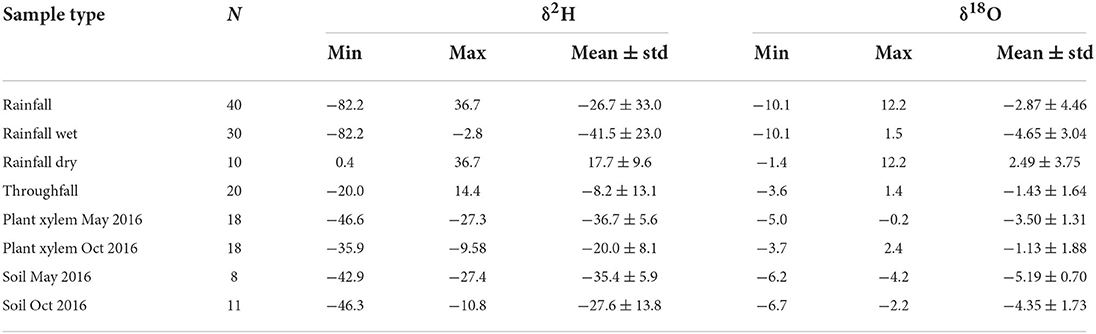
Table 3. Minimum (Min), maximum (Max) and average (Mean) values (including standard deviation, ± std) for all the isotopic data measured, where N is the number of samples.
In the dual isotope space (Figure 4), SWLwet plotted along the GMWL and LMWL in the wet period (LMWLwet, p > 0.05; Supplementary Table 3), while PWLwet, measured in May 2016, followed the LMWLwet (Δslope = 0.24; p = 0.930) and the throughfall water line (Δslope = 0.34; p = 0.853; Supplementary Table 3). In October 2016, PWLdry better agreed with the LMWLdry (Δslope = 1.28; p = 0.37), and deviated from the LWMLwet, in response to the higher enrichment of the δ18Oxylem in relation to the δ2Hxylem. However, some trees presented an isotopic signal that followed the LWMLwet. These trees were marked in bold, in Supplementary Table 3.
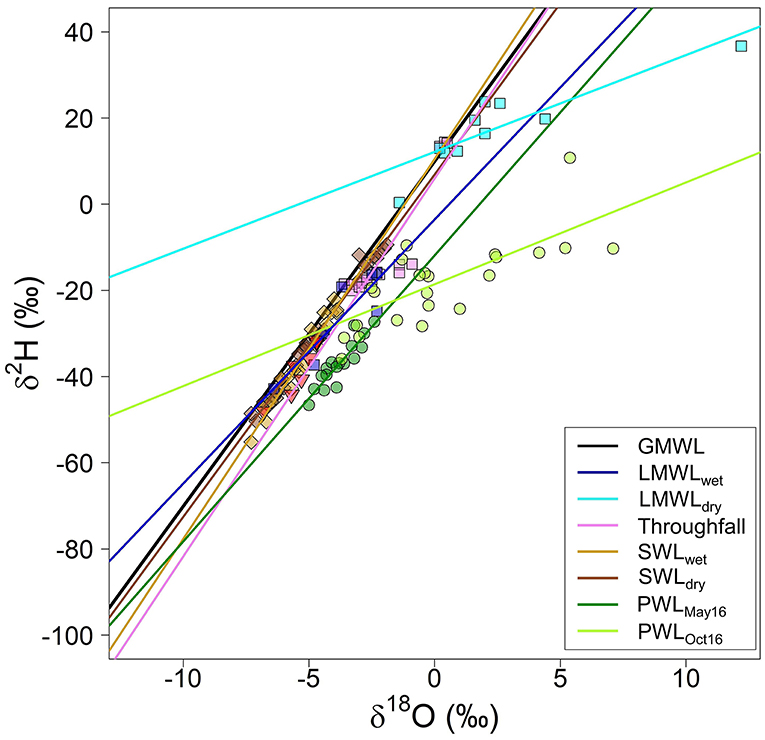
Figure 4. Dual isotope plot of the global meteorological water line (GMWL), local meterological water line for the wet (LMWLwet) and the dry periods (LMWLdry, taken in May, June and October 2016), and throughfall; soil water line that comprise the isotopic soil signal at different soil depths in May 2016 (SWLMay16) and in October 2016 (SWLOct16); plant water line that comprises the isotopic signal of the xylem in May 2016 (PWLMay16) and in October 2016 (PWLOct16). May 2016 corresponds to the wet-to-dry (WTD) transition period, and October 2016 corresponds to the dry-to-wet (DTW) transition period.
Isotopic signal and correlation analysis
The variability of the isotopic signal along the soil profile showed that the isotopically enriched layers were found in the upper 0.15 m. The soil water became more depleted with depth, approximating to the Machado river water at around 3 m depth, and even more depleted than the river water at 4 m depth (Figures 3A,B).
Correlation coefficients between soil physical properties [soil texture, pore sizes (Ma, Me, Mi, and Cr pores), θFC and θPWP, and TAW] presented negative r-Pearson (−0.82 and −0.76 for δ2H and δ18O, respectively) for TAW and Mi, in May 2016 (Supplementary Table 5). It means that the larger the TAW and Mi, the lower (i.e., the most depleted) the isotopic signal. In October 2016, the DTW transition period, the larger positive correlations were found for the percentage of Cr pores, respectively, 0.43 and 0.35 for δ2H and δ18O (Supplementary Table 5), which means that an enriched isotopic signal, in October 2016, shows a better correlation with Cr pores than with other pore sizes or soil physical properties.
Correlation analysis between plant traits and isotopic signal showed no significant correlation between isotopic signal (δ2H and δ18O) and plant height (H) or DBH (Supplementary Table 4). However, we found a significant negative correlation (r-Pearson of −0.5 and −0.7), respectively, for δ2H and δ18O with ψmd, both measured in October 2015 (Supplementary Table 4). It suggests that the higher (i.e., more negative) the plant water potential, the more enriched the isotopic signal.
Discussion
Potential sources of water for plants
Our isotopic results show that the wet season rainfall was isotopically more depleted than the dry season rainfall, a pattern that can be attributed to the rainfall amount effect (Araguás-Araguás et al., 2000). In the dual isotope space, the agreement between GMWL and LMWLwet, GMWL and throughfall, and GMWL and SWLOct (Supplementary Table 3) suggests that the rainfall of past events would be mainly responsible for the soil water recharge. Considering the hypothesis that to meet the plant-atmospheric water demands of the dry period, trees uptake the more depleted water from the past wet periods, stored in the deeper soil layers; we would expect a more depleted xylem signal as the dry season progresses. However, contrary to this, we found xylem water more enriched in October 2016, end of the dry period/transition to wet period, than in May 2016, the beginning of the dry period. Besides, instead of following the isotopically depleted soil signal of the deeper soil layers, the xylem signal is isotopically more enriched and shows a better agreement with the recent rainfall. This pattern can be observed in dual isotope space (Figure 4) and in the ANCOVA analysis (Supplementary Table 3). These results suggest that instead of using the water stored in the soil layers, to meet the plant-atmospheric water demands of the dry period, trees are using a more recent water, which is the rainfall dropped in the past recent events. In May 2016, beginning of the dry period, trees used water from the past wet season rainfall while in October 2016, the peak of the dry period/transition to the wet period, trees used the more enriched water from the dry period.
These results agree with the results found by Miguez-Macho and Fan (2021), who found that in a global survey of studies based on isotope data, 70% of plants used water from the recent rainfall, while 18% use water from the past rainfall events stored in the soil layers. The plant dependence on the recent rainfall events challenges the deep-RWU as a mechanism of forest resilience to droughts. The fact that instead of relying on the water from past events stored in the soil, the maintenance of transpiration rates relies on a more recent rainwater, could explain the high mortality rates of the larger trees during severe droughts that have been registered in the Amazon forest (Nepstad et al., 2007; Phillips et al., 2010; Esquivel-Muelbert et al., 2020). These results can be of great concern considering the perspectives of increase in length and severity of the dry season rainfall, as a result of local and global climate changes (Wright et al., 2017; Gatti et al., 2021). However, it is important to note that the Amazon forest comprises a very huge and diverse ecosystem, and more research is needed to generalize the behavior found here to all the Amazon forest environments, and for more severe dry periods.
Uncertainties in the results and another potential explanation for xylem isotopic enrichment
Despite statistical analysis (ANCOVA, methods) indicating the existence of significant similarity between PWLOct and LMWLdry slopes (Δslope = −0.11; p = 0.873; Supplementary Table 3), visually it is possible to observe a displacement in both lines so that PWLOct plots below the LMWLdry (Figure 4). This displacement is a result of the pronounced enrichment of the δ18O in relation to the δ2H (Figures 3A,B), a pattern which can be also observed in the d-excess (Supplementary Figure 2).
The relationship between δ2H and δ18O, expressed in terms of the d-excess (Equation 3), has been used as an indicator of evaporative enrichment (Sprenger et al., 2016). Some works have considered d-excess <-10‰ as an indicator of evaporative enrichment of the rainfall water (Kern et al., 2020). Despite tree waters being sampled, stored, and analyzed following the same procedure, in October 2016—peak of the dry period—we found a pronounced enrichment in the δ18O (i.e., d-excess <-10‰) for 7 of the 18 sampled trees; Swartzia ingifolia, Dipterix odorata, Dipterix magnifica, Copaifera multijuga, Cariniana decandra, Astronium lecontei, and Anamalocalyx uleanus (Supplementary Figure 3). Four of these trees presented moderate resistance to drought (Dipterix odorata, Cariniana decandra, Astronium lecontei, and Anamalocalyx uleanus) and one (Swartzia ingifolia) presented low resistance to drought, according to Souza et al. (2022). For the other species, resistance to drought (using πTLP as a proxy) was not determined (Souza et al., 2022). However, other species that also presented moderate resistance to drought according to Souza et al. (2022) did not present a pronounced δ18O enrichment as the dry season progresses. This is the case for Sagotia brachysepala, Pouteria durlandi, and Licania sprucei (Supplementary Figure 3). Based on this, we did not find a relationship between the pronounced enrichment in the xylem isotopic signal and the plant resistance to drought. We also did not find any correlation between enriched xylem isotopic signal in October 2016 and tree H or DBH (Supplementary Table 4). However, the strong correlation between the enriched signal and the ψmd, both measured in October 2016 (Supplementary Table 4) suggests that an enriched xylem signal is more pronounced in trees submitted to higher water stress (ψmd > 2 MPa). According to Martín-Gómez et al. (2017), under low water availability and high evaporative demand, stem water loss via evaporation can create significant isotopic enrichment of stem water (Martín-Gómez et al., 2017). That is because, when leaf transpiration is limited, it reduces the input of non-enriched fresh water, allowing for cumulative evaporative enrichment. However, in our study, given the maintenance of relatively high ET rates and EVI along the dry period (i.e., between May and October 2016)—as presented in Souza et al. (2022)—we conclude that the isotopic enrichment of the xylem signal is more a result of the dry season rainwater uptake than of a limitation of the transpiration rates and stem water flow as the dry season progresses, as proposed to Martín-Gómez et al. (2017).
It is also important to note that we did not find an overlap between the soil water signal and xylem signal for any of the both sampled periods (i.e., in May and in October 2016). Very fine resolution soil moisture measurements performed in central Amazon show a very wet layer developed in the upper 5 cm of the soil layer during droughts (Negrón-Juárez et al., 2020). Further investigation is needed to consider if there is a missing source of water for soil layers that were not sampled and could also explain the enriched xylem isotopic signal.
Conclusion
Knowledge of how rainforests cope with droughts can be leveraged to assess how a changing climate may impact these ecosystems. Deep (>1 m) soil water, stored during the previous wet season, has been regarded as playing a critical role in the maintenance of relatively high ET rates in Amazonia. However, taller and larger trees, which potentially have deep roots, are the most vulnerable to severe droughts, casting doubt on this hypothesis. Using naturally abundant stable water isotopes together with soil physical data and ecophysiological plant traits—H, DBH, and ψmd–we found that recently infiltrated water is crucial for sustaining plant transpiration during the dry periods. These results challenge deep-RWU theory and the use, by the plants, of the water from past rainfall events stored in the soil layer. In other words, it means that the dependence of the Amazon forest on the dry-season rainfall could make the Amazon forest more vulnerable to droughts than previously thought, in particular, with the prospect of the dry-season lengthening and projected decreases in the dry season rainfall. When using the natural abundance of water isotopes as tracers of the source of transpired water, caution is needed for processes that may cause enrichment in the xylem signal, or the existence of missing sources not sampled. In our case, the pronounced enrichment of the xylem water in the dry period suggests that plants are using the more enriched rainwater of the dry period. However, it is also possible that some trees may have branches where the stem water flow ceased due to water stress at the end of the dry period. The reduction of the stem flow may cause isotopic enrichment and biases in the identification of the source of the water transpired by plants. However, it is important to note that, in the study site, the maintenance of the elevated ET rates and the EVI during the dry period do not point to huge water stress in the sampled trees.
Data availability statement
The raw data supporting the conclusions of this article will be made available by the authors, without undue reservation.
Author contributions
LB, WD, and AV wrote the paper and performed soil physics and isotopic analysis. RS performed work experiments, plant traits, and remote sensing analysis. AW and RA performed field experiments and maintenance of the LBA experimental site at Rebio Jaru. All authors contributed to the article and approved the submitted version.
Funding
This research was supported by the FAPESP grant (2013/50531-2).
Acknowledgments
We thank the Large Biosphere-Atmosphere (LBA) Program, coordinated by the National Institute for Amazon Research (INPA), for data availability, logistical support, and infrastructure during field campaigns.
Conflict of interest
The authors declare that the research was conducted in the absence of any commercial or financial relationships that could be construed as a potential conflict of interest.
Publisher's note
All claims expressed in this article are solely those of the authors and do not necessarily represent those of their affiliated organizations, or those of the publisher, the editors and the reviewers. Any product that may be evaluated in this article, or claim that may be made by its manufacturer, is not guaranteed or endorsed by the publisher.
Supplementary material
The Supplementary Material for this article can be found online at: https://www.frontiersin.org/articles/10.3389/frwa.2022.886558/full#supplementary-material
References
Araguás-Araguás, L., Froehlich, K., and Rozanski, K. (2000). Deuterium and oxygen-18 isotope composition of precipitation and atmospheric moisture. Hydrol. Process. 14, 1341–1355. doi: 10.1002/1099-1085(20000615)14:8<1341::AID-HYP983>3.0.CO;2-Z
Berg, A., Findell, K., Lintner, B., Giannini, A., Seneviratne, S. I., Van Den Hurk, B., et al. (2016). Land-atmosphere feedbacks amplify aridity increase over land under global warming. Nature Clim. Change 6, 869–874. doi: 10.1038/nclimate3029
Bouyoucos, G. J. (1927). A rapid method for mechanical analysis of soils. Science 65, 549–551. doi: 10.1126/science.65.1692.549
Bruno, R. D., da Rocha, H. R., de Freitas, H. C., Goulden, M. L., and Miller, S. D. (2006). Soil moisture dynamics in an eastern Amazonian tropical forest. Hydrol. Process. 20, 2477–2489. doi: 10.1002/hyp.6211
Christoffersen, B. O., Restrepo-Coupe, N., Arain, M. A., Baker, I. T., Cestaro, B. P., Ciais, P., et al. (2014). Mechanisms of water supply and vegetation demand govern the seasonality and magnitude of evapotranspiration in Amazonia and Cerrado. Agric. For. Meteorol. 191, 33–50. doi: 10.1016/j.agrformet.2014.02.008
Coplen, T. B. (2011). Guidelines and recommended terms for expression of stable-isotope-ratio and gas-ratio measurement results. Rapid Commun. Mass Spectrom. 25, 2538–2560. doi: 10.1002/rcm.5129
Da Silva, J. O. (2021). Distribuição Espacial dos atributos físicos do solo em uma Reserva Biológica no bioma Amazônia. Ji-Parana.
Dansgaard, W., Daansgard, W., and Dansgaard, W. (1964). Stable isotopes in precipitation. Tellus. 6n, 436–468. doi: 10.3402/tellusa.v16i4.8993
Ehleringer, J. R., and Dawson, T. E. (1992). Water uptake by plants: perspectives from stable isotope composition. Plant Cell Environ. 15, 1073–1082. doi: 10.1111/j.1365-3040.1992.tb01657.x
Esquivel-Muelbert, A., Phillips, O. L., Brienen, R. J. W., Fauset, S., Sullivan, M. J. P., Baker, T. R., et al. (2020). Tree mode of death and mortality risk factors across Amazon forests. Nat. Commun. doi: 10.1038/s41467-020-18996-3
Gatti, L. V., Basso, L. S., Miller, J. B., Gloor, M., Domingues, L. G., Cassol, H. L. G., et al. (2021). Amazonia as a carbon source linked to deforestation and climate change. Nature 595, 388–393. doi: 10.1038/s41586-021-03629-6
Gee, G. W., and Bauder, J. W. (1986). “Methods of soil analysis. Part I,” in Particle-size Analysis, ed A. Klute (Madison, WI: American Society of Agronomy and Soil Science Society of America), 383–411. doi: 10.2136/sssabookser5.1.2ed.c15
IBAMA (2007). Avaliação Ecológica Rápida para Revisão do Plano de Manejo da Reserva Biológica do Jaru, Brasilia, DF.
Jiménez-Muñoz, J. C., Mattar, C., Barichivich, J., Santamaría-Artigas, A., Takahashi, K., Malhi, Y., et al. (2016). Record-breaking warming and extreme drought in the Amazon rainforest during the course of El Niño 2015–2016. Sci. Rep. 6:33130. doi: 10.1038/srep33130
Jipp, P. H., Nepstad, D. C., Cassel, D. K., and Reis De Carvalho, C. (1998). Deep soil moisture storage and transpiration in forests and pastures of seasonally-dry Amazonia. Clim. Change 39, 395–412. doi: 10.1023/A:1005308930871
Kern, Z., Hatvani, I., Czuppon, G., Fórizs, I., Erdélyi, D., Kanduč, T., et al. (2020). Isotopic ‘altitude' and ‘continental' effects in modern precipitation across the adriatic–Pannonian region. Water 12:1797. doi: 10.3390/w12061797
Kunert, N., Aparecido, L. M. T., Wolff, S., Higuchi, N., dos Santos, J., de Araujo, A. C., et al. (2017). A revised hydrological model for the Central Amazon: the importance of emergent canopy trees in the forest water budget. Agric. For. Meteorol. 239, 47–57. doi: 10.1016/j.agrformet.2017.03.002
Marengo, J. A. (2004). Interdecadal variability and trends of rainfall across the Amazon basin. Theor. Appl. Climatol. 78, 79–96. doi: 10.1007/s00704-004-0045-8
Martín-Gómez, P., Serrano, L., and Ferrio, J. P. (2017). Short-term dynamics of evaporative enrichment of xylem water in woody stems: implications for ecohydrology. Tree Physiol. 37, 511–522. doi: 10.1093/treephys/tpw115
Miguez-Macho, G., and Fan, Y. (2021). Spatiotemporal origin of soil water taken up by vegetation. Nature 598, 624–628. doi: 10.1038/s41586-021-03958-6
Muler, R. A. S. (2018). Analysis of Seasonal and Interannual Response of Forest Dynamics using MODIS/MAIAC Sensor Data and in situ Measurements in a Forest Fragment in the southwest Amazon. INPE.
Negrón-Juárez, R., Ferreira, S. J. F., Mota, M. C., Faybishenko, B., Monteiro, M. T. F., Candido, L. A., et al. (2020). Calibration, measurement and characterization of deep soil moisture dynamics in a Central Amazonian tropical forest. Vadose Zone J. 19:e20070. doi: 10.1002/vzj2.20070
Nepstad, D. C., De Carvalho, C. R., Davidson, E. A., Jipp, P. H., Lefebvre, P. A., Negreiros, G. H., et al. (1994). The role of deep roots in the hydrological and carbon cycles of Amazonian forests and pastures. Nature 372, 666–669. doi: 10.1038/372666a0
Nepstad, D. C., Tohver, I. M., David, R., Moutinho, P., and Cardinot, G. (2007). Mortality of large trees and lianas following experimental drought in an amazon forest. Ecology 88, 2259–2269. doi: 10.1890/06-1046.1
Phillips, O. L., van der Heijden, G., Lewis, S. L., López-González, G., Aragão, L. E. O. C., Lloyd, J., et al. (2010). Drought-mortality relationships for tropical forests. New Phytol. 187, 631–646. doi: 10.1111/j.1469-8137.2010.03359.x
Restrepo-Coupe, N., da Rocha, H. R., Hutyra, L. R., da Araujo, A. C., Borma, L. S., Christoffersen, B., et al. (2013). What drives the seasonality of photosynthesis across the Amazon basin? A cross-site analysis of eddy flux tower measurements from the Brasil flux network. Agric For. Meteorol. 182–183, 128–144. doi: 10.1016/j.agrformet.2013.04.031
Saleska, S. R., Wu, J., Guan, K., Araujo, A. C., Huete, A., Nobre, A. D., et al. (2016). Dry-season greening of Amazon forests. Nature 531, E4–E5. doi: 10.1038/nature16457
Seneviratne, S. I., Wilhelm, M., Stanelle, T., Van Den Hurk, B., Hagemann, S., Berg, A., et al. (2013). Impact of soil moisture-climate feedbacks on CMIP5 projections: first results from the GLACE-CMIP5 experiment. Geophys. Res. Lett. 40, 5212–5217. doi: 10.1002/grl.50956
Shuttleworth, W. J. (1988). Macrohydrology - the new challenge for process hydrology. J. Hydrol. 100, 31–56. doi: 10.1016/0022-1694(88)90180-1
Shuttleworth, W. J. (1998). Evaporation from Amazonian rainforest. Proc. R. Soc. B Biol. Sci. (1988). B223, 321–346. doi: 10.1098/rspb.1988.0024
Sohel, M. S. I., Grau, A. V., McDonnell, J. J., and Herbohn, J. (2021). Tropical forest water source patterns revealed by stable isotopes: a preliminary analysis of 46 neighboring species. For. Ecol. Manage. 494:119355. doi: 10.1016/j.foreco.2021.119355
Sombroek, W. (2001). Spatial and temporal patterns of Amazon rainfall. Ambio. 30, 388–396. doi: 10.1579/0044-7447-30.7.388
Souza, R. D. A., Moura, V., Paloschi, R. A., Aguiar, R. G., Webler, A. D., Borma, L. D. S., et al. (2022). Assessing drought response in the Southwestern Amazon forest by remote sensing and in situ measurements. Remote Sens. 14:1733. doi: 10.3390/rs14071733
Sperry, J. S., Hacke, U. G., Oren, R., and Comstock, J. P. (2002). Water deficits and hydraulic limits to leaf water supply. Plant, Cell Environ. 25, 251–263. doi: 10.1046/j.0016-8025.2001.00799.x
Sprenger, M., Leistert, H., Gimbel, K., and Weiler, M. (2016). Illuminating hydrological processes at the soil-vegetation-atmosphere interface with water stable isotopes. Rev. Geophys. 54, 674–704. doi: 10.1002/2015RG000515
Teixeira, P. C., Donagemma, G. K., Fontana, A., and Teixeira, W. G. (2017). Manual de Métodos de Análise de Solo, 3rd Edn. Brasilia, DF: Embrapa.
van Genuchten, M. T. A. (1980). Closed-form equation for predicting the hydraulic conductivity of unsaturated soils. Soil Sci. Soc. Am. J. 44, 892–898. doi: 10.2136/sssaj1980.03615995004400050002x
Walkley, A., and Black, I. A. (1934). An examination of the degtjareff method for determining soil organic matter, and a proposed modification of the chromic acid titration method. Soil Sci. 37, 29–38. doi: 10.1097/00010694-193401000-00003
Washburn, E. W. (1921). The dynamics of capillary flow. Phys. Rev. 17:273. doi: 10.1103/PhysRev.17.273
Webler, A. D., Aguiar, R. G., and Aguiar, L. J. G. (2007). Características da precipitação em área de floresta primária e área de pastagem no Estado de Rondônia. Ciên. Nat. 2007, 55–58. doi: 10.5902/2179460X9755
Wright, J. S., Fu, R., Worden, J. R., Chakraborty, S., Clinton, N. E., Risi, C., et al. (2017). Rainforest-initiated wet season onset over the southern Amazon. Proc. Natl. Acad. Sci. U.S.A. 114, 8481–8486. doi: 10.1073/pnas.1621516114
Keywords: Amazon forest, plant transpiration, root water uptake, droughts, water isotopes
Citation: Borma LDS, Demetrio WC, Souza RDAD, Verhoef A, Webler A and Aguiar RG (2022) Dry season rainfall as a source of transpired water in a seasonal, evergreen forest in the western Amazon region inferred by water stable isotopes. Front. Water 4:886558. doi: 10.3389/frwa.2022.886558
Received: 28 February 2022; Accepted: 16 August 2022;
Published: 23 September 2022.
Edited by:
Matthias Sprenger, Berkeley Lab (DOE), United StatesReviewed by:
Laura Andrea Benegas Negri, Centro Agronomico Tropical de Investigacion y Ensenanza Catie, Costa RicaJia Hu, University of Arizona, United States
Copyright © 2022 Borma, Demetrio, Souza, Verhoef, Webler and Aguiar. This is an open-access article distributed under the terms of the Creative Commons Attribution License (CC BY). The use, distribution or reproduction in other forums is permitted, provided the original author(s) and the copyright owner(s) are credited and that the original publication in this journal is cited, in accordance with accepted academic practice. No use, distribution or reproduction is permitted which does not comply with these terms.
*Correspondence: Laura De Simone Borma, bGF1cmEuYm9ybWFAaW5wZS5icg==