 Jean-Sebastien Barbier1*
 Rachid Dris1*
 Caroline Lecarpentier2
 Vivien Raymond2Karine Delabre2Sylvie Thibert3
 Bruno Tassin1
 Johnny Gasperi4
- 1Laboratoire eau environnement et systemes urbains (LEESU), Université Paris-Est Créteil, Créteil, France
- 2Veolia Eau d'Île de France, Nanterre, France
- 3Syndicat des Eaux d'Île de France, Paris, France
- 4Laboratoire eau environnement (LEE), Université Gustave Eiffel, Bouguenais, France
Microplastics (MP) have been detected in almost all matrices, including drinking water, and assessing the contamination of drinking water with this type of pollution is of the utmost sanitary importance. This study aims to evaluate MP contamination of inlet river water and drinking water at three drinking water treatment plants (DWTPs) in the Paris region in France. Each plant performs water treatment processes that are efficient for particulate matter removal such as coagulation-flocculation, sand filtration, and granular activated carbon filtration. One of the plants also has a parallel water treatment file that uses microfiltration and nanofiltration processes. This file was investigated to assess its efficiency compared to the others. To our knowledge, this study is the first to investigate MP contamination in a DWTP using nanofiltration processes. The drinking water distribution network was also investigated, with samples taken at three network points. Microplastics contamination of sizes 25–5,000 μm was characterized using micro-Fourier transform infrared spectroscopy (μ-FTIR) in large volume samples (500 L) with complete mapping of each sample. Concentrations ranging from 7.4 to 45.0 MP/L were found in inlet water while concentrations ranging from blank level (0.003 MP/L) to 0.260 MP/L were found in outlet drinking water (overall removal rate above 99%). Polyethylene, polypropylene, and polyethylene terephthalate were the main polymers found both at the inlet and outlet, but ratios varied significantly at the outlet. No MP were detected in four out of the six samples from the nanofiltration file, and were not found to have significantly different concentrations compared to blank level. Concentrations in the distribution network were higher overall than at the corresponding DWTP outlet, although a high degree of variation between samples was observed. Our results suggest that membrane processes of microfiltration and nanofiltration are more efficient than typical treatment processes, and also that a MP re-contamination within the distribution network itself might occur.
Introduction
Global plastic production has reached 367 million tons in 2020 (Plastics Europe, 2021). The same year, Borrelle et al. estimated that 11% of plastic waste produced in 2016 had already been released into the aquatic environment (Borrelle et al., 2020). Microplastics (MP) are often defined as polymerized solid particles, insoluble in water between 1 μm and 5 mm in size (Eerkes-Medrano et al., 2015). However, a worldwide consensus on a precise definition and recommendations for a common definition is required (Hartmann et al., 2019; California Environmental Protection Agency, 2020). Primary MP are particles specifically manufactured in this form, such as industrial abrasives or the microbeads used in cosmetics. Secondary MP are derived from the physical or chemical fragmentation of larger plastics in the environment, and generally represent the main fraction (Eerkes-Medrano and Thompson, 2018). Microplastics are now considered ubiquitous in the environment. They have been described in various matrices: seawater (Ivar do Sul and Costa, 2014), surface water (Free et al., 2014), karstic water (Panno et al., 2019), wastewater (Leslie et al., 2017), sediment (Su et al., 2016), air (Dris et al., 2016), biota (Rochman et al., 2014), bottled water (Mason et al., 2018; Schymanski et al., 2018), and tap water (Kosuth et al., 2018; Pivokonsky et al., 2018).
In many countries, water treatment plants and their distribution network provide the main source of domestic water. This water is used, depending on the countries in the world, for different purposes, including cooking and drinking. Its potential contamination may increase human exposure to MPs through ingestion, the consequences of which on human health are still being studied. Several toxicity pathways have been identified in animal models such as oxidative stress (Deng et al., 2017), metabolism and immune function disruption (Deng et al., 2017; Wen et al., 2018), or vector of microorganisms and toxic chemicals (Kirstein et al., 2016; Zhu et al., 2018). Human cell uptake has also been demonstrated (Schirinzi et al., 2017; Triebskorn et al., 2019). While there is currently no evidence of major human health risk, human exposure to smaller microplastics needs to be better understood (SAPEA, 2019; Prata et al., 2020). To this date, relatively few studies quantified MP in drinking water treatment plants (DWTPs). Water treatment by DWTP may involve different processes depending on the raw water type treated, with groundwater typically requiring fewer treatment steps than surface water. While DWTPs were not designed specifically for MP removal, typical treatment processes such as coagulation–flocculation or sand filtration have properties that should be efficient for MP removal (Kankanige and Babel, 2020a; Shen et al., 2020). Also, those processes are analogous to the ones used in wastewater treatment plants. In this context, their efficiency for MP removal have been demonstrated in many studies (Lv et al., 2019; Alavian Petroody et al., 2020; Ren et al., 2020; Tadsuwan and Babel, 2022). Currently published studies on DWTPs found concentrations varying by several orders of magnitude (Danopoulos et al., 2020). These discrepancies can be explained in part by the wide array of DWTPs characteristics and inlet water types, but also by the variation in MP sampling and analysis methods, size range quantified, or even experiment and report quality (Koelmans et al., 2019; Kooi and Koelmans, 2019). As a result, findings cannot be easily compared, and the need for method and quality harmonization has been expressed by the scientific community (Primpke et al., 2020; Provencher et al., 2020). It has recently been demonstrated that the issue of size ranges gaps can be overcome using power law size relationship to allow for inter-comparison (Kooi et al., 2021).
Studies that could analyze particles down to a size of 1 μm using Raman spectroscopy or scanning electron microscopy typically found higher concentrations in drinking water than those with higher size limits such Fourier-transform infrared (FTIR) spectroscopy or optic microscopy (which typically have size limits ranging between 20 and 100 μm). Studies using Raman spectroscopy often found that MP < 10 μm made up the main fraction of detected MP (Pivokonsky et al., 2018; Tong et al., 2020; Wang et al., 2020). Pivokonsky et al. (2018) studied three anonymous Czech DWTPs using river water and reported a removal rate of 70–86% with average concentration in drinking water ranging from 443 ± 10 to 628 ± 28 MP/L. In their 2020 study, they studied two additional Czech DWTPs. They found an average of 1,296 ± 35 MP/L in raw river water and 151 ± 4 MP/L in the produced drinking water in the first, 23 ± 2 and 14 ± 1 MP/L in the second. Wang et al. (2020) reported an average of 930 ± 71 MP/L in an advanced DWTP in China, with a total removal efficiency ranging from 80 to 90%. In contrast, Mintenig et al. studied six DWTPs in Germany supplied by groundwater sources and reported between 0 and 0.0007 MP/L (Mintenig et al., 2019). It is important to keep in mind that this study had a size limit of 20 μm compared to the size of 1 μm of the previous three studies mentioned. With a lower limit of 25 μm, Johnson et al. found an average of 0.0022 MP/L in 8 British and Welsh DWTPs (Johnson et al., 2020), with a corresponding removal rate of 99.99%. The regulation of MP contamination levels in drinking water is either non-existent or in progress in most countries, in part due to the lack of standardization and comparable data. In France, where this study was carried out, standards on drinking water MP content are at the draft stage.
This study aims to investigate the effectiveness of MP removal in the context of three large French DWTPs supplying a large part of the Paris region. The goals were to determine raw water and drinking water MP contents to assess removal rate. We also hypothesized that MP contamination may occur inside the distribution network itself. Thus, we sampled three network points to compare with DWTP exit level. On top of that, this study aims to investigate MP contamination at the nanofiltration file used by one of the DWTPs. Our hypothesis was that the efficiency of the nanofiltration file for MP removal would be higher than in a conventional file. To our knowledge, MP removal in a DWTP by microfiltration then nanofiltration processes has never been investigated and thus this study provides some of the first pieces of data on this topic.
Materials and methods
Sampling sites
Three DWTPs in the Paris region were investigated (Figure 1). The Choisy-le-Roi (abbreviated Choisy) DWTP uses inlet water from the Seine river. It produces around 300,000 m3/d of drinking water on average, for around 1.9 million inhabitants. The Neuilly-sur-Marne (abbreviated Neuilly) DWTP uses inlet water from the Marne river. It produces approximately 315,000 m3/days of drinking water on average for around 1.8 million inhabitants. The Mery–sur–Oise (abbreviated Mery) DWTP uses inlet water from the Oise river. It produces around 165,000 m3/days of drinking water on average for around 0.9 million inhabitants. All three DWTPs use exclusively river water (from the Seine, Marne, and Oise rivers), pumped from 2 m to 3 m below the surface. The Mery DWTP has an outdoor storage basin where the pumped water settles for 2 days on average before being pumped again for treatment. The water treatment techniques used in common in all three plants are as follows: Screening, coagulation-flocculation, settling, sand filtration, ozonation, granular activated carbon filtration, UV treatment, and chlorination. This treatment line will be referred to as “conventional” file. On top of this, the Mery plant has an additional parallel water treatment file later referred to as “nanofiltration” file that uses coagulation-flocculation, sand and anthracite bi-layered filter, micro-filtration, and nano-filtration processes. This second file typically produces 70% of the plant's total drinking water output, with variations based on production needs. Three water distribution network points (Villejuif, Saclay, and Jouy-en-Josas) belonging to the Choisy DWTP network were also investigated for potential MP contamination inside the network itself. The Villejuif point is a drinking water reservoir with a capacity of ~50,000 m3, about 6 km away from the Choisy DWTP. The Saclay point is at the outlet of a reservoir with a capacity of ~1,000 m3, about 25 km away from the Choisy DWTP. Finally, the Jouy-en-Josas point (abbreviated Jouy) is a lift-pumping station about 25 km away from the Choisy DWTP. Villejuif is at a short distance from the plant, while Saclay and Jouy were chosen as network points at the farthest distance from the outlet. A summary of the processes per DWTP and sample materials can be found in Table 1.
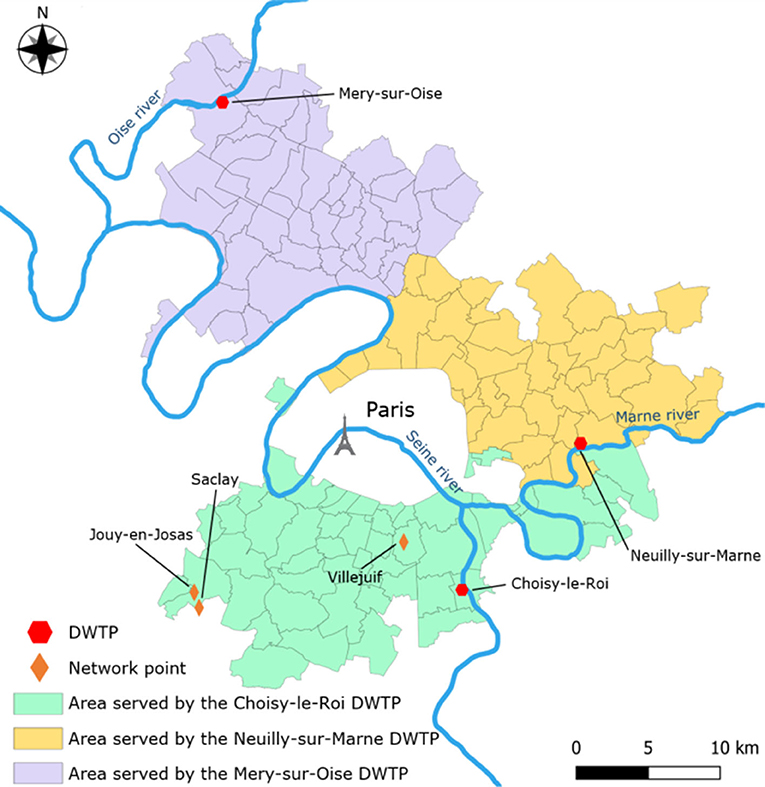
Figure 1. Map of the sampling sites and area served by the drinking water treatment plants.
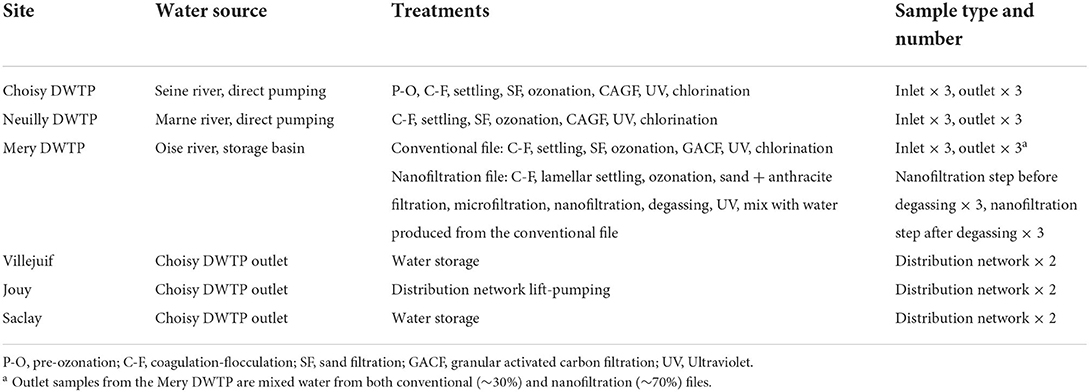
Table 1. Description of DWTP processes and sampling per site.
Sampling methods
Sampling took place between October 2020 and May 2021. Inlet water and produced drinking water (later referred to as outlet samples) were each sampled 3 times per DWTP studied. Significant rain occurred the days before sampling (from ~4 mm to 8 mm) for the second inlet sample from each station. Detailed sampling dates and raw water parameters can be found in Supplementary material 1. Drinking water network distribution points (network samples) were each sampled twice. From the Mery DWTP, 6 additional samples were taken at the nanofiltration file. The microfiltration step has a 7 μm particle threshold, and the following nanofiltration step has a 400 Dalton threshold (which can be roughly estimated as a 1 nm threshold). The nanofiltration process involves having the water run through a polymeric membrane at high pressure (8–15 bars). During the process, water hardness is reduced due to retention of calcium and magnesium cations by the membranes. CO2 is formed by the shift in the calco–carbonic balance. The carbon dioxide (CO2) is then released from the system by a degassing step. While the microfiltration and nanofiltration steps should theoretically remove all MP > 25 μm, this degassing step introduces filtered air, which was identified as a possible MP. Additionally, the nanofiltration membrane itself and some of the tubing are made of plastic and their weathering may introduce unwanted MP, warranting investigation. Three samples were taken before the degassing process and three after the degassing process.
Due to the differences in suspended solids content, separate sampling strategies were developed for inlet samples and outlet samples. Inlet samples contain a large number of particles (including MP) and organic matter in comparison with outlet water. The higher effort required for sample filtration and MP extraction along with the higher expected MP concentration led to a lower volume chosen for inlet water (6 L) compared to outlet water (500 L).
Inlet water was sampled at in-plant sampling taps using 6 L × 1 L glass bottles with metal lids. The taps are connected to the inlet water pumps, after the screening process. The taps used for sampling inlet water in each DWTP are always running, so no flushing procedure was necessary. As soon as they were filled, each bottle was covered with an aluminum foil.
Outlet water was sampled in-plant on built-in sampling taps. A stainless steel, 47-mm filter holder (Merck Millipore®) was used, containing a 47-mm diameter stainless steel filter with 10 μm mesh size. The use of a 10-μm cutoff is the most favorable condition for high volume filtration while keeping particles > 25 μm. Lower-sized mesh would cause filter clogging issues while higher-sized mesh would cause particles with a minor dimension ~ 10 μm but a major dimension > 25 μm to be more easily lost (such as microfibers). The tap was flushed for approximately 2 min, then connected to the filter holder. Polytetrafluoroethylene (PTFE) strips were wrapped around the filter connections to the pipes to ensure the device's water tightness. A water meter was connected to the end of the device to measure the volume sampled. Between 500 L and 560 L per outlet sample were filtered this way. This volume range was chosen as the highest before clogging issues would occur. The main advantage of this sampling method is that the device itself contains no plastic and allows to minimize contamination risks. The only plastic material used was PTFE, which was not investigated in this study. Detailed sampling materials and protocol can be found in Supplementary material 2.
Sample processing
Upon return to the laboratory, all samples were stored in a cold room in the dark at 4°C. Preliminary tests showed that inlet water contained mostly organic particles while drinking water contained mostly mineral particles. Separate MP extraction methods were developed accordingly.
The glass bottles containing the inlet water samples were first filtered onto a 47 mm stainless steel filter with a 10-μm mesh. The bottles were rinsed 3 times to minimize the chance of MP sticking to the glass. The filter content was then resuspended in a 1 L beaker using 100 ml filtered water and ultrasonication for 1 min. The filter was then rinsed 3 times to ensure that all particles were removed. The beaker was put on a heating plate and filtered H2O2 (50%) was added to reach a 300 ml 30% H2O2 solution concentration. Temperature was set at 45°C. A magnetic PTFE fish was used for stirring at 300 rpm. The digestion time was set to 24 h. The digested sample was then vacuum-filtered onto a 25-mm diameter aluminum oxide filter (Whatman Anodisc, 0.02 μm pore size) and stored in a glass petri dish until μ-FTIR measurements. In the event of clogging during vacuum-filtration, the sample was arbitrarily split on as many filters as necessary and all filters were analyzed.
Drinking water samples were first retrieved from the sample holder, then resuspended from the 47 mm stainless steel filter in approximately 200 ml of NaI solution with a 1.65 g/cm3 density using an ultrasonic bath for 1 min. The filter was then rinsed 3 times using NaI (~30 ml per rinsing) to ensure that as many particles as possible were removed. The ~300 ml of NaI solution were then placed into a 1 L separator funnel. The beaker used to transfer to the funnel was then also rinsed 3 times with NaI which was then poured in the funnel. The sample was left to settle in the solution for 24 h. The top one-fourth supernatant layer, which contained the MP, was then recovered in a beaker. The funnel was rinsed with NaI which was added to the same beaker to ensure optimal MP recovery. The supernatant solution was then vacuum-filtered on a 25-mm aluminum oxide filter. In the event of clogging, the sample was arbitrarily split on as many filters as necessary and all filters were analyzed.
Micro-fourier transform infrared spectroscopy measurements
Fourier transform infrared spectroscopy measurements were performed using a Nicolet iN10 MX FTIR microscope (Thermo Fisher Scientific, USA) equipped with a linear plane array (8 × 2) Mercury Cadmium Telluride (MCT) detector, using transmission mode. A complete mapping of the filtration area (~19 mm, 100% of the sample) of the 25-mm aluminum oxide filter was carried out using a pixel size (spatial resolution) of 25 μm × 25 μm. The spectral range was set to 4,000–1,200 cm−1 with a spectral resolution of 8 cm−1 and one scan per spectrum. Thus, the size limit of this study was set to 25 μm. Preliminary tests showed polymer matching differences below 1% between 1, 4, or 16 co-added scans, hence this choice of tradeoff between analysis quality and speed. The spectra maps were analyzed using the siMPle software (version 1.0.1, Aalborg University, Denmark and Alfred Wegener Institute, Germany). The default matching weight of 0.5 for spectra's first derivative and 0.5 for spectra's second derivative was used, and the Aalborg University (AAU) pipeline was chosen for data processing. The default siMPle MP library was used for MP matching and particle measurements.
To better examine the effect of nanofiltration on MP contamination, IR Spectra from the nanofiltration membrane's polymeric layers were gathered. Infrared spectra from DWTP sampling taps tubing were also collected. These spectra were acquired using a Nicolet iS5 ATR-FTIR (Thermo Fisher Scientific, USA) with a diamond crystal. The spectral range for collection was 4,000–400 cm−1 with a spectral resolution of 8 cm−1 and 16 co-added scans.
For shape detection, we used siMPle's size measurements: any particle with a major axis 5 times longer or more than the minor axis was counted as fiber. Any other shape was counted as fragment. All results reported as MP include both MP fragments and MP fibers. With this fiber detection method, any curled-up fiber would be detected as contiguous pixels which would then be labeled as fragments. Only long or straight fibers could be identified in this manner. On top of this, as MP fibers are commonly thinner than 25 μm, it is possible that their IR signal was too weak to be detected. This means that our analysis method has two biases that under-reports fibers. Also, since smaller particles tend to have weaker IR absorbance, they have a lower general signal-to-noise ratio. Consequently, their matching score with the database tends to be lower and may fall below the detection threshold. This leads to potential under-reporting of the smaller-sized MP. Since μ-FTIR measurements were done by mapping, particle detection is only done on a pixel-by-pixel basis. In our method, the pixel size was 25–25 μm. This means that to belong in our lowest major axis size class (25–50 μm), a MP particle needs to fit on a single pixel. Any particle in between pixels could be registered as 2 pixels-long, and belong to the 50–75-μm class. Thus, we likely overestimate the size of the smaller MPs. This pixel approach also means that any <25-μm MP with an IR signal above detection threshold would be registered as 25 μm in size. In practice, since our filter mesh size for sample treatment was 10 μm, it is possible that MP in the 10–24-μm range were detected and labeled as 25-μm long.
Quality assurance and quality control
To minimize possible MP contamination on field and within the laboratory, strong quality assurance measures were taken. All aluminum foil and all glassware used (including petri dishes) were burnt at 525°C before use. On field, aluminum foil was used to ensure minimal contamination from airborne sources. All glass bottles were covered in aluminum foil which was only removed for the duration of the sampling. All filter holders were pre-wrapped in aluminum foil and stored in cardboard boxes before sampling, and wrapped again then stored back as soon as the sampling was completed. The filter holders were not opened at any point during fieldwork. Once at the lab, samples were kept in a cold room (4°C) in the dark until processing. In the lab, cotton lab coats were worn. All processing aside from density separation settling phase were carried out under a fume hood. All reagents used were filtered using GF/F glass fiber filters (Whatman) with a 0.7-μm pore size. Filtered reagents were stored in glass bottles with an aluminum foil sheet between the neck and the lid. For raw water samples, the rinsing procedure for stainless steel filters and any glassware used was a first rinsing with GF/F filtered water (~30 ml), then a second one using GF/F filtered ethanol (50%, ~30 ml), and a third one using GF/F filtered water again (~30 ml). For drinking water samples, all three rinsing steps used GF/F filtered NaI (3 × ~30 ml) instead to ensure NaI content could be recycled for future use. NaI density was checked before each use and adjusted to 1.65 g/cm3 if needed. Stainless steel filters were one-use to avoid possible contamination from a previous sample. While the plastic use was avoided as much as possible, it was not possible to completely remove it from processing steps. Nitrile lab gloves were used during H2O2 digestion processing. Polyethylene wash bottles were used for NaI, ethanol, and water rinsing. Contamination was assessed using systematic blank samples. Each set of inlet water samples had a parallel procedural lab blank; a similar 1-L glass bottle was rinsed using the same procedure as the samples. In the same manner, each drinking water sample had a parallel procedural blank sample with a similar filter holder and stainless steel filter. These filter holders were plugged to the DWTP drinking water sampling tap for 2 min with no water running, then removed. Blank samples were stored, processed, and analyzed using the same protocol as the actual samples in a rigorous way.
For inlet water samples, four blanks were processed. No MP were found in two of them. A total of 18 PE and 1 polypropylene (PP) fragments were found in the first contaminated one, and 1 PE fragment in the second. Contamination concentration was calculated assuming the blanks' sample volume was identical to the raw water sample volume (6 L). This way, mean total MP contamination was calculated at 0.8 MP/L, which is negligible compared to sample concentration. For drinking water samples, 12 blanks were processed. Microplastic contamination was found in 6 of them, with up to 6 MP fragments in the most contaminated one. Three polymer types were found: PE, followed by PP and polyacrylamide (PA). Contamination concentration was calculated as described above, with a sample volume of 500 L. This way, mean contamination per blank was 0.003 MP/L. The material of the plastic tubing system between the main outlets and the sampling point was confirmed by ATR-FTIR measurements to be mostly polyurethane (PU) and polyvinyl chloride (PVC), both of which are absent from blanks and in very low proportions in the samples themselves. Thus, we can conclude that external piping did not contribute to contamination. Raw blank data are described in Supplementary material 1 for concentrations and Supplementary material 3 for individual MP data.
Statistical analysis
Due to the overall low number of samples, non-parametric tests were used. Kruskal–Wallis and Wilcoxon rank sum tests were performed to assess differences between sites and files, using the statistics package in R. We considered p < 0.05 to be a significant difference, and p < 0.1 to be weak evidence of a difference. Principal component analysis (PCA) of MP concentration in the inlet waters MP content was performed using the FactoMineR (Lê et al., 2008), factoextra (Kassambara and Mundt, 2020), and ggplot2 (Wickham, 2016) packages. The PCA results can be seen in Supplementary material 4.
Results and discussion
Microplastics content at DWTP inlet
Microplastics were found in all of the nine inlet samples. Across all 3 rivers, from 39 MP/L to 215 MP/L were found (Figure 2). Concentrations for each site were statistically higher than blanks (p < 0.05). The concentrations in the three samples from the Choisy DWTP were 11.4, 22.0, and 22.5 MP/L. The MP concentrations in Neuilly's inlet water were 43.0, 32.4, and 45.0 MP/L. Lastly, the concentration in the Mery DWTP inlet water were 17.8, 9.4, and 7.8 MP/L. Across all samples, 10 different plastic polymers have been detected as follows: Polyethylene terephthalate (PET), PE, PP, PVC, polystyrene (PS), PA, PU, polyvinyl acetate (PVAC), and acrylonitrile butadiene styrene (ABS). The most commonly found polymer was PET (52.3%), followed by PE (31.7%) and PP (13.1%). The detail of polymer concentration per sample per site can be seen in Figure 2. MP particles' major axis size ranged from 25 μm (the size limit of this study) to 1,271 μm, with a median of 128 μm and an interquartile range (Q3–Q1) of 103 μm. The overall MP shape distribution was 94.7% fragments and 5.3% fibers at Choisy, while only fragments were detected on the Neuilly and Mery sites. Microplastic data for all samples and blanks from this study can be accessed in Supplementary material 1 for individual sample concentrations and Supplementary material 3 for individual MP data.
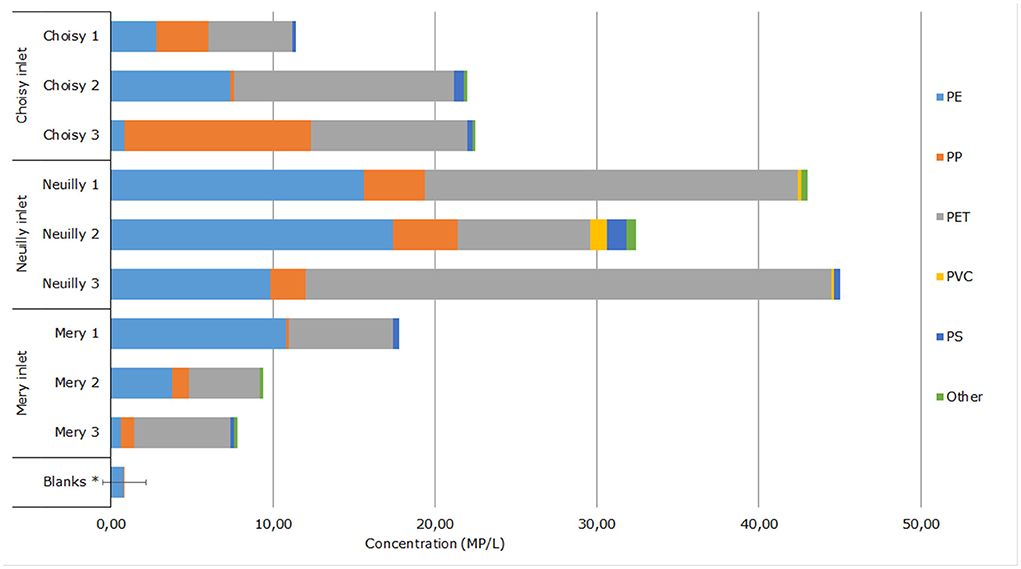
Figure 2. Microplastic concentrations and polymer distributions in inlet water. *n = 4, mean ± standard deviation.
Across the 3 sites, MP content in the inlet water was within the order of magnitude of 5–50 MP/L. All samples from Neuilly have a higher MP concentration than those from Choisy and Mery. This could suggest that the Marne river is likely more contaminated by MP than the Seine river and the Oise river. This is partially corroborated by other research that already showed that the Marne river has a higher fiber concentration (>80 μm) than the Seine River over a 19-month period (Dris et al., 2018). Wilcoxon test was performed and found weak evidence of Neuilly inlet having a higher concentration than Choisy and Mery (p < 0.1). On the other hand, no statistical difference was found between Choisy and Mery inlets. At both sites, the MP concentration was almost double between the lowest and highest-concentrated samples. These variations could be due to the long-spanning sampling campaign, as river flow, rain level, and water quality were different from sample to sample. However, no significant effect of monitored water quality parameters on concentration was found (rain events, total organic carbon, ammonium, turbidity). Water parameters are detailed in Supplementary material 1. Temporal evolution of MP concentration in the Seine has been demonstrated before. High variability on suspended fiber content (anthropogenic and natural) was previously observed by Dris et al. in the Marne and Seine river (Dris et al., 2018). Treilles et al. studied MP concentration variations during rain events in the Seine river and found MP concentration in the same order of magnitude as this study. They also found that MP concentration was around 6 times higher between the peak concentration point and the end of flood events (Treilles et al., 2021).
The polymer ratio found are overall in accordance with the available literature, with PE, PP, and PET being frequently among the highest represented polymers (Pivokonsky et al., 2018; Johnson et al., 2020; Kankanige and Babel, 2020a). These ratios vary greatly from study to study (Danopoulos et al., 2020). Polymer ratios were consistent at all three DWTPs inlets and across samples, with PET first, followed by PP then PE. However, the ratio of PET is higher than reported in most studies on freshwater (Li et al., 2020). While Dris et al. demonstrated that no fiber (>80 μm) gradient was present within the water column of the Seine, a possible explanation could be that the inlet water pumps supplying the studied DWTP are below the surface, and that the MP content is different than at surface-level river water, especially for high density MP such as PET. Samples were taken at taps located in the plant, after water pumping and screening. This means the MP content is possibly different from that of surface water.
Microplastics content at DWTP outlet
Microplastics were found in all of the 9 drinking water samples collected from the 3 DWTPs. A total of 239 MP were detected, ranging from 1 to 130 MP per sample. For the 3 Choisy outlet samples, concentrations of 0.002, 0.013, and 0.022 MP/L were found. Polypropylene was the most commonly found polymer (47.4%), followed by PE (42.1%) and PS (5.3%). No other polymer was identified. Concentrations measured at the Neuilly outlet were 0.260, 0.026, and 0.008 MP/L. Polyethylene was the most found polymer (64.6%) followed by PP (13.0%), PET (10.2%), and PA (5.4%). At the Mery outlet, concentrations found were 0.040, 0.090, and 0.012 MP/L. Polypropylene was the main polymer found (33.8%) followed by PET (23.9%), PE (21.1%), and PVC (9.9%). Across all sites, seven different polymers were detected: PE, PP, PVC, PET, PS, PA, and PVAC. The major dimension size of microplastics ranged from 25 to 383 μm, with a median of 81 μm and an interquartile range of 68 μm. All MP shapes were fragments. No fiber was found at any of the DWTPs outlet samples. Using Kruskal–Wallis and Wilcoxon test, we found significant differences between each site outlet concentrations and blanks (p < 0.05), but no significant statistical difference between the sites.
The MP concentrations in DWTP outlet water varied from sample to sample at each site. Both at Mery and Neuilly outlets, one sample in particular had a much higher MP concentration than the other two. One at 0.090 MP/L at Mery and one at 0.260 MP/L at Neuilly. While this would require more data to confirm, this suggests that MP concentrations at the outlet may vary a lot over time. Overall, these outlet concentrations are significantly different from inlet levels (p < 0.01), two to three orders of magnitude lower. This would translate into a removal efficiency of at least 99%, which would need to be confirmed with further investigations. From this data, none of the three DWTPs appear to be underperforming compared to the others. The removal rates for DWTP using similar technologies were reported in the previous studies and ranged from an average of 57.2% during rainy season in Thailand (Kankanige and Babel, 2020a) to 99.99% in England and Wales (Johnson et al., 2020). However, direct comparison of removal rates cannot be performed as studied MP sizes and methodology differ between each study.
Regarding the polymers found, the ratios are varied compared to the inlet (Figure 3). At the Choisy outlet, PE and PP ratios were about equal. At the Neuilly outlet, PE was dominant while PP and PET were about equal. At the Mery outlet, PP was in slightly higher proportion than PE and PET. It is worth noting, however, that the overall polymeric ratios at Choisy and Mery are strongly influenced by their highest concentration sample. Compared to inlet content, the main difference is a much lower ratio of PET across all three outlets. This suggests a difference in removal rate compared to other polymers. A size difference between PET and other polymers at the inlet was investigated, and PET had no significantly different size distribution compared to PE and PP. Thus, the discrepancy in removal rate is not related to this parameter. Each treatment step would need to be studied individually to assess more precisely if one in particular affects PET particles. Perhaps its high density compared to other common plastic polymers plays a role in its removal rate. Another element that could induce polymer ratio variations is that MP contamination could be introduced within the plant material itself rather than from the inlet water. During some treatment steps, the water is in contact with the air or the plant material for a prolonged time, and some of the plant tubing themselves are comprised of several types of plastic.
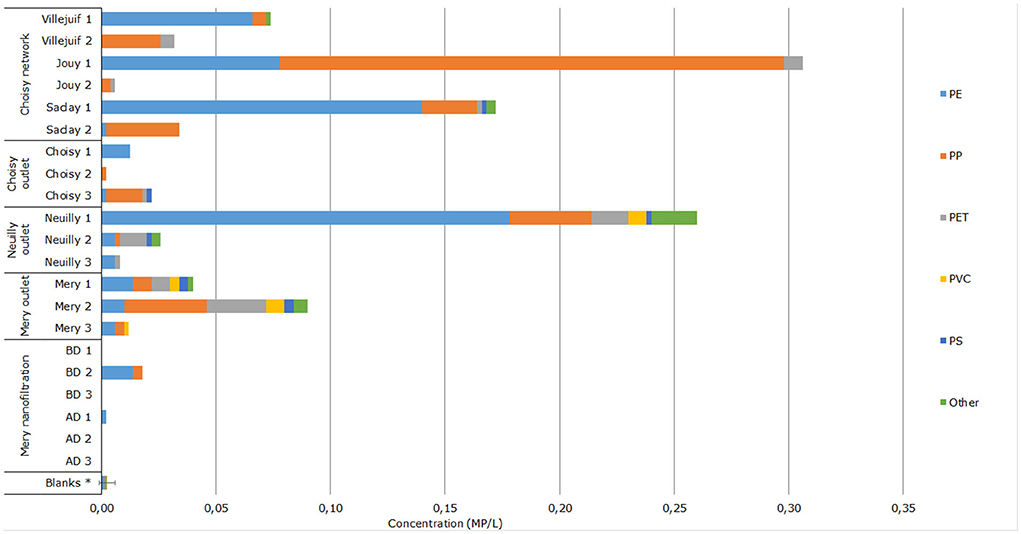
Figure 3. Microplastic concentration and polymer distribution in outlet water and distribution network. BD, Before degassing step; D, After degassing step. *n = 12, mean ± standard deviation.
As shown in Figure 4, the MP sizes found at the outlet are smaller overall than at the inlet (median 128 μm for inlets, 81 μm for outlets) which is expected since the water treatment chain at each DWTP involve filtration steps which should be efficient especially on larger particles (Kankanige and Babel, 2020a). Moreover, we found that MP belonging to the 25–100 μm classes represent the largest group in outlet samples while MP in the higher size classes above 100 μm are the largest group in inlet samples (Figure 4).
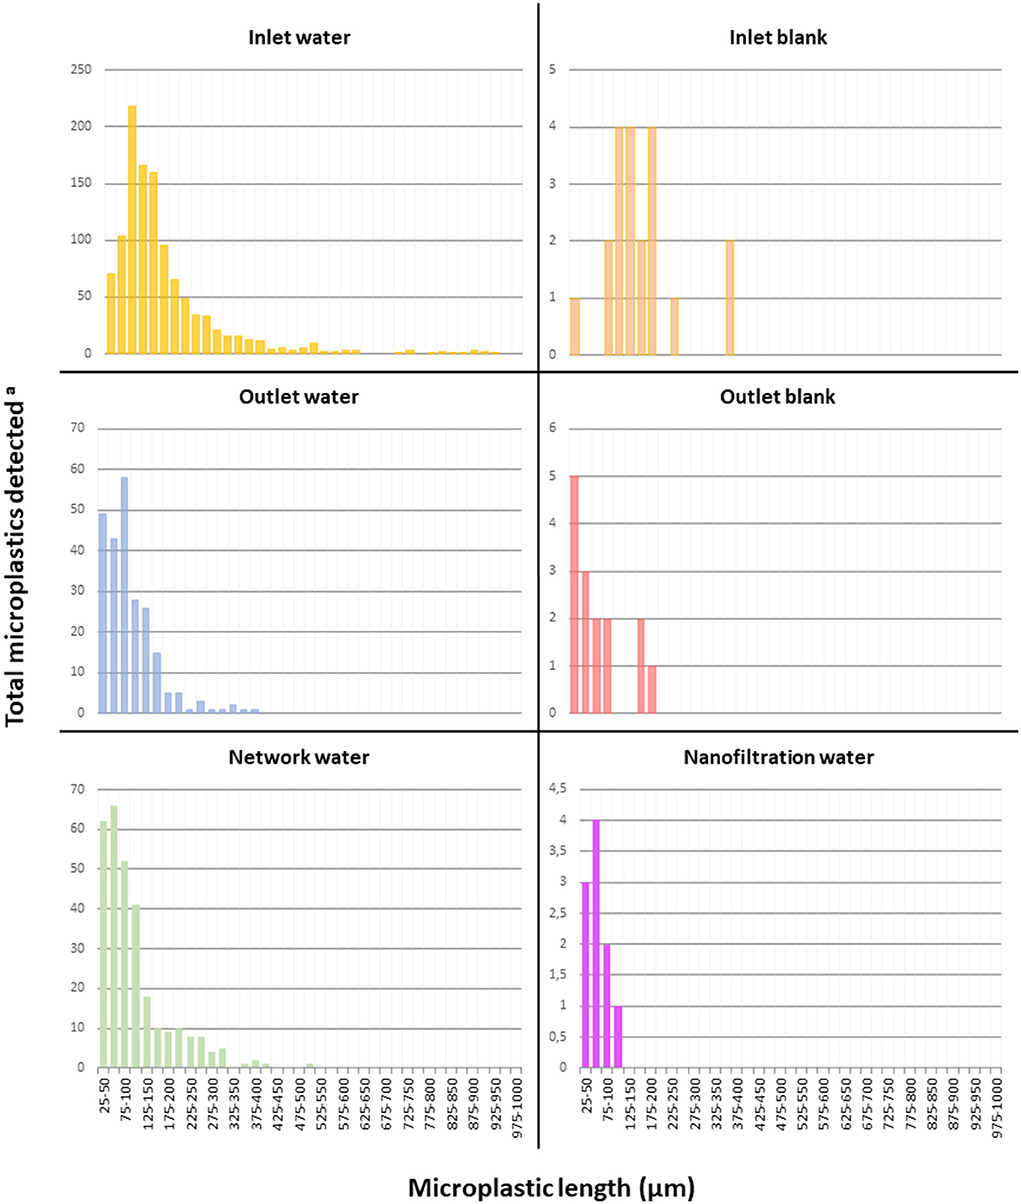
Figure 4. Microplastic size distribution per sample type. aSum of detected microplastics across all samples for each sample type and length range. Inlet water: n = 9; Inlet blank: n = 4; Outlet water: n = 9; Outlet blank: n = 12; Network water: n = 6; Nanofiltration water n = 6.
Microplastics content in the nanofiltration file from the Mery DWTP
Six samples were taken within the nanofiltration file: three after the water went through the nanofiltration polymeric membrane (before degassing) and three right after the degassing process where CO2 is removed and filtered air is introduced into the system. No MP were detected in four out of the six samples (MP concentration <0.001 MP/L). Out of the two samples with MP detected, one was before the degassing step, and one after the degassing step. Seven PE and two PP particles were found in the contaminated sample before the degassing step, for a calculated concentration of 0.018 MP/L. One PE particle were found in the contaminated sample after the degassing step, for a calculated concentration of 0.002 MP/L. Using Wilcoxon test, no significant difference was found between the nanofiltration samples before degassing, after degassing, and blanks. MP median size was 60 μm, with an interquartile range of 40 μm, which is lower than outlet. The concentrations found are significantly below (p < 0.05) that of Mery's outlet, which is made on average of 70% nanofiltration file water and 30% conventional file water. This suggests that the nanofiltration file is efficient at removing MP, with a higher removal rate than the conventional file. It is also suggested that the air injected in the system during this step does not contribute significantly to the overall MP in the drinking water. A limitation of the study is the sample size and statistical analysis. More samples would be required to gather stronger statistical evidence to support these hypotheses. Interestingly, no MP specific to the nanofiltration membrane (polypiperazine-amide and polysulfone) were found in any sample. Therefore, the nanofiltration membrane itself does not appear to contribute to MP contamination.
Microplastics content in Choisy's DW distribution network
Microplastics were found in both samples from each of the three DW distribution network points investigated. The MP concentrations ranged from 0.006 to 0.306 MP/L, with large discrepancies between samples. At the Villejuif reservoir, the closest point from the outlet (6 km), concentrations of 0.032 and 0.074 MP/L were found. At the Jouy lift-pumping station, which is about 25 km away from the outlet, concentrations of 0.006 and 0.306 MP/L were found. At the Saclay reservoir, also about 25 km away from the outlet, concentrations of 0.034 and 0.172 MP/L were found. Five out of the six samples investigated had a higher MP concentration than all Choisy DWTPs outlet samples, but weak evidence was found that overall concentrations in network samples are higher than Choisy outlet samples (p < 0.1). This suggests a possible MP re-contamination inside the water distribution network itself. The two further points also appear to have a higher MP content, but that cannot be statistically confirmed. The sample size in this study is too small to perform more detailed statistical analysis and demonstrate a significant concentration difference.
Microplastics size distributions were consistent with that of Choisy outlet. The MP size ranged from 25 to 515 μm, with a median of 81 μm and an interquartile range of 65 μm, while the median at the outlet was 81 with an interquartile range of 89. Again, all MP were fragments and no fiber was found. The polymer ratios were also consistent with that of Choisy outlet. Polypropylene and PE were in almost equal proportions (50.0 and 45.9%, respectively, compared to 47.4 and 42.1% at the outlet) with PET representing 2.9% of the total (5.3% at outlet). This could imply similar contamination sources. It is possible that the concentration gaps observed are in part due to heterogeneity in MP concentration over time on top of differences between locations. Ideally, additional samples from all three DWTPs network would be needed to extend our observations to the whole network. However, the effort required to process each sample is very time consuming. Therefore, we chose to focus our efforts on a single DWTP network.
From our data, human exposure in the supplied part of the Paris region can be very roughly estimated. Assuming a 2-L daily consumption of drinking water per adult as recommended by the World Health Organization (WHO, 2019), our results from the most contaminated sample would lead to a highest possible exposure of 0.6 MP/day, or 212 MP/year for sizes 25–5,000 μm. However, the results presented in this study are preliminary and more data is required to determine exposure via drinking water in a robust manner. In comparison, MP intake estimations by Mohamed Nor et al. (2021), which are based on rescaled concentrations on the full MP size continuum, report a median for tap water in the range of 50 MP/day for adults (Mohamed Nor et al., 2021).
Study limitations, inter-comparability, and further research points
This study reports MP occurrence in drinking water over six sites. Particular care was given to quality control, with strong contamination minimization measures. The methodology developed for drinking water allowed for high volume samples (500–560 L). With the use of μ-IRTF mapping strategies, we were able to analyze 100% of every filter from each sample. This allowed us to avoid relying on the typical sub-sampling and extrapolation strategies which have a lower degree of accuracy. As a consequence, the results presented for each sample should be a good reflection of the MP contamination in the drinking water of the studied sites, for the 25–5000 μm size range.
While this study indicates a minor presence of MP in drinking water, its methodology also comes with limitations. The minimum size of the detectable microplastic was set at 25 μm, which is intrinsic to our method of analysis with FTIR mapping with a 25 μm × 25 μm pixel size. Literature so far has shown that smaller sizes of microplastics are prevalent in drinking water, with exponential increase in relative numbers the smaller the size range (Kooi et al., 2021). Thus, higher concentrations are to be expected when investigating MP content in the 1 25 μm size range. In the method presented with this study, we chose to use an open-source software (siMPle) for MP detection, with default settings and an open-source spectra database. Spectra that resulted in a match were systematically reported as MP. This means that we did not filter out potential false positive results. While a spectrum check by users would likely lower false positive rates, the intent was to reduce human interpretation to the minimum to avoid user biases and allow for inter-comparability with other studies. The raw data can easily be reinterpreted in the future if a systematic method for false positive detection becomes available for the microplastic research community.
This study only processed a limited number of samples per site, and a larger number of samples would be required to gather statistical evidence to support the hypotheses presented. While already high, the sample volume of 500 L per sample could also have been a limiting factor since several samples gave results in the same order of magnitude as our blanks. Increasing the volume was not possible with our current method due to clogging issues and analysis time constraints. Only a very limited number of particles were found in several samples, which leads to a high degree of uncertainty regarding data significance. Ideally, several cubic meters of drinking water would need to be filtered to gather enough MP particles for statistically significant data at this size range (Koelmans et al., 2019).
Across all samples, discrepancies in MP content in drinking water was observed. While the limitations described above could be partially responsible for this, it is also possible that variations over time exist. Temporal variation was not evaluated in the scope of this study and warrants further investigations. It is likely that seasonal influence played a role in the presented results since the sampling took place across several seasons. However, the low number of samples and varying span of time between sampling made seasonal parameters investigation difficult. While our results hint at potential network contamination, no clear MP source could be found. Additional studies would be needed to assess the differences between the DWTP water and the actual exposure at the consumer's tap. It would also be interesting to investigate which fraction of the MP found at the outlet come from the river water, and which fraction come from weathering of plastic material or the air within the plant itself. Another aspect that would be important to explore is the leaching from microplastic found in drinking water. It has been shown that various additives and pollutants undergo complex sorption/desorption processes in a water matrix, which play a role in the risk associated with microplastic pollution (Do et al., 2022). Further research on leaching is required to quantify this risk.
Several studies have demonstrated MP exposure from drinking water. However, due to discrepancies in methodologies, it is difficult to compare most of them to this study. Indeed, differences in size limitations, sample volume, and quantitative and qualitative analysis strategies make comparison a complex task. Mintenig et al. (2019) and Johnson et al. (2020) also performed μ-FTIR analyses with roughly the same size range. Mintenig et al. found extremely low concentrations both at inlet and outlet. The studied DWTP all used underground water sources though, unlike this study which is only based on DWTPs that use river water. Johnson et al. investigated both DWTPs that used groundwater and surface water. In the case of surface water, they only found MP above their limit of quantification (LOQ) in 1 sample out of 29 with a concentration of 1.6 MP/m3. This limit was calculated as 10 × blank standard deviation, or 3 particles detected. In their study, blank mean was subtracted from the raw sample count for each polymer. This rigorous approach to blank contamination means that a significant amount of MP per sample is required to report a quantitative result. The reported LOQ in outlet water for PE and PP was 23 MP/m3. If applied to our study, this method would lead us to also report no quantifiable plastic on most of our samples.
Studies using μ-Raman spectroscopy, which can reach a lower size limit of 1 μm, typically find far higher overall MP concentrations than reported in this study, but the above 25-μm fraction is generally negligible compared to the 1–25 μm fraction. It is worth noting that studies based on Raman spectroscopy tend to have much smaller sample volumes (1 L in most cases) due to the effort and time needed during the analysis step. On top of this, only a fraction of the sample is analyzed. Therefore, the absence of larger particles in Raman spectroscopy-based studies is not necessarily in contradiction with the results from this study. The latest μ-FTIR-based technologies are able to improve the pixel resolution lower than 10 μm using Focal Plane Array detectors, thus improving the smallest size of MP than can be analyzed. For instance, Cincinelli et al. were able to process microplastic samples using μ-FTIR with a pixel resolution of 5.5 × 5.5 μm (Cincinelli et al., 2021).
Fewer studies have been published on bottled drinking water, and the inter-study comparison issues mentioned above are still present. Their results so far could tend to suggest that bottled water contains more MP than DWTP water, and that the bottle itself would be the main MP source, but it is too early to draw conclusions (Oßmann et al., 2018; Schymanski et al., 2018; Zuccarello et al., 2019; Kankanige and Babel, 2020b). Rescaling of concentrations to the full MP size continuum for both types of drinking water sources, along with other exposition sources, was performed by Mohamed Nor et al. (2021). They report medians in the same order of magnitude of 102-103 MP/L for bottled and tap water. While the quantification of human exposure to MP is still an ongoing topic, the risk associated to this exposure also remains an urgent topic of research. Our understanding of hazards linked to MP for human health is still lacking, and both areas will require further work before reaching a scientific consensus.
Data availability statement
The datasets presented in this study can be found in online repositories. The names of the repository and accession numbers can be found in the Supplementary material.
Author contributions
J-SB, RD, JG, BT, CL, KD, ST, and VR contributed to the conception, design, development, follow-up of the study, and manuscript revisions. J-SB and VR performed the water sampling. J-SB performed the experiments, data analyses, and first draft of the manuscript. All authors contributed to the article and approved the submitted version.
Funding
This work was funded by the SEDIF (Syndicat des Eaux D'Île de France) with a grant awarded to the UPEC (Université Paris-Est Créteil).
Acknowledgments
The authors would like to thank and acknowledge the support of the PRAMMICS Platform of the OSU-EFLUVE (UAR3653) for the access and usage of the μ-FTIR and ATR-FTIR tools. We would like to thank Gabriela Bernicard, Alexandre Bourdet, Johanna Bourreau, and Bastien Gabelotaud for their help and support during the sampling process. We would also like to thank Sinimar Awwad for her contribution during her internship.
Conflict of interest
The authors declare that the research was conducted in the absence of any commercial or financial relationships that could be construed as a potential conflict of interest.
Publisher's note
All claims expressed in this article are solely those of the authors and do not necessarily represent those of their affiliated organizations, or those of the publisher, the editors and the reviewers. Any product that may be evaluated in this article, or claim that may be made by its manufacturer, is not guaranteed or endorsed by the publisher.
Supplementary material
The Supplementary Material for this article can be found online at: https://www.frontiersin.org/articles/10.3389/frwa.2022.886703/full#supplementary-material
References
Alavian Petroody, S. S., Hashemi, S. H., and van Gestel, C. A. M. (2020). Factors affecting microplastic retention and emission by a wastewater treatment plant on the southern coast of Caspian Sea. Chemosphere 261:128179. doi: 10.1016/j.chemosphere.2020.128179
Borrelle, S. B., Ringma, J., Law, K. L., Monnahan, C. C., Lebreton, L., McGivern, A., et al. (2020). Predicted growth in plastic waste exceeds efforts to mitigate plastic pollution. Science 369, 1515–1518. doi: 10.1126/science.aba3656
California Environmental Protection Agency (2020). State Water Board Addresses Microplastics in Drinking Water to Encourage Public Water System Awareness. Available online at: https://www.waterboards.ca.gov/press_room/press_releases/2020/pr06162020_microplastics.pdf (accessed June 9, 2022).
Cincinelli, A., Scopetani, C., Chelazzi, D., Martellini, T., Pogojeva, M., and Slobodnik, J. (2021). Microplastics in the Black Sea sediments. Sci. Tot. Environ. 760:143898. doi: 10.1016/j.scitotenv.2020.143898
Danopoulos, E., Twiddy, M., and Rotchell, J. M. (2020). Microplastic contamination of drinking water: a systematic review. PLoS ONE 15:e0236838. doi: 10.1371/journal.pone.0236838
Deng, Y., Zhang, Y., Lemos, B., and Ren, H. (2017). Tissue accumulation of microplastics in mice and biomarker responses suggest widespread health risks of exposure. Sci. Rep. 7:46687. doi: 10.1038/srep46687
Do, A. T. N., Ha, Y., and Kwon, J.-H. (2022). Leaching of microplastic-associated additives in aquatic environments: a critical review. Environ. Pollut. 305:119258. doi: 10.1016/j.envpol.2022.119258
Dris, R., Gasperi, J., Rocher, V., and Tassin, B. (2018). Synthetic and non-synthetic anthropogenic fibers in a river under the impact of Paris Megacity: sampling methodological aspects and flux estimations. Sci. Tot. Environ. 618, 157–164. doi: 10.1016/j.scitotenv.2017.11.009
Dris, R., Gasperi, J., Saad, M., Mirande, C., and Tassin, B. (2016). Synthetic fibers in atmospheric fallout: a source of microplastics in the environment? Mar. Pollut. Bull. 104, 290–293. doi: 10.1016/j.marpolbul.2016.01.006
Eerkes-Medrano, D., and Thompson, R. (2018). “Chapter 4 - Occurrence, fate, and effect of microplastics in freshwater systems,” in Microplastic Contamination in Aquatic Environments, ed E. Y. Zeng (Elsevier), 95–132.
Eerkes-Medrano, D., Thompson, R. C., and Aldridge, D. C. (2015). Microplastics in freshwater systems: a review of the emerging threats, identification of knowledge gaps and prioritisation of research needs. Water Res. 75, 63–82. doi: 10.1016/j.watres.2015.02.012
Free, C. M., Jensen, O. P., Mason, S. A., Eriksen, M., Williamson, N. J., and Boldgiv, B. (2014). High-levels of microplastic pollution in a large, remote, mountain lake. Mar. Pollut. Bull. 85, 156–163. doi: 10.1016/j.marpolbul.2014.06.001
Hartmann, N. B., Hüffer, T., Thompson, R. C., Hassellöv, M., Verschoor, A., Daugaard, A. E., et al. (2019). Are we speaking the same language? Recommendations for a definition and categorization framework for plastic debris. Environ. Sci. Technol. 53, 1039–1047. doi: 10.1021/acs.est.8b05297
Ivar do Sul, J. A., and Costa, M. F. (2014). The present and future of microplastic pollution in the marine environment. Environ. Pollut. 185, 352–364. doi: 10.1016/j.envpol.2013.10.036
Johnson, A. C., Ball, H., Cross, R., Horton, A. A., Jürgens, M. D., Read, D. S., et al. (2020). Identification and quantification of microplastics in potable water and their sources within water treatment works in England and Wales. Environ. Sci. Technol. 54, 12326–12334. doi: 10.1021/acs.est.0c03211
Kankanige, D., and Babel, S. (2020a). Contamination by ≥6.5 μm-sized microplastics and their removability in a conventional water treatment plant (WTP) in Thailand. J. Water Process Eng. 40:101765. doi: 10.1016/j.jwpe.2020.101765
Kankanige, D., and Babel, S. (2020b). Smaller-sized micro-plastics (MPs) contamination in single-use PET-bottled water in Thailand. Sci. Tot. Environ. 717:137232. doi: 10.1016/j.scitotenv.2020.137232
Kassambara, A., and Mundt, F. (2020). factoextra: Extract and Visualize the Results of Multivariate Data Analyses. Available online at: https://CRAN.R-project.org/package=factoextra (accessed June 4, 2022).
Kirstein, I. V., Kirmizi, S., Wichels, A., Garin-Fernandez, A., Erler, R., Löder, M., et al. (2016). Dangerous hitchhikers? Evidence for potentially pathogenic Vibrio spp. on microplastic particles. Mar. Environ. Res. 120, 1–8. doi: 10.1016/j.marenvres.2016.07.004
Koelmans, A. A., Mohamed Nor, N. H., Hermsen, E., Kooi, M., Mintenig, S. M., and De France, J. (2019). Microplastics in freshwaters and drinking water: critical review and assessment of data quality. Water Res. 155, 410–422. doi: 10.1016/j.watres.2019.02.054
Kooi, M., and Koelmans, A. A. (2019). Simplifying microplastic via continuous probability distributions for size, shape, and density. Environ. Sci. Technol. Lett. 6, 551–557. doi: 10.1021/acs.estlett.9b00379
Kooi, M., Primpke, S., Mintenig, S. M., Lorenz, C., Gerdts, G., and Koelmans, A. A. (2021). Characterizing the multidimensionality of microplastics across environmental compartments. Water Res. 202:117429. doi: 10.1016/j.watres.2021.117429
Kosuth, M., Mason, S. A., and Wattenberg, E. V. (2018). Anthropogenic contamination of tap water, beer, and sea salt. PLoS ONE 13:e0194970. doi: 10.1371/journal.pone.0194970
Lê, S., Josse, J., and Husson, F. (2008). FactoMineR: an R package for multivariate analysis. J. Stat. Softw. 25, 1–18. doi: 10.18637/jss.v025.i01
Leslie, H. A., Brandsma, S. H., van Velzen, M. J. M., and Vethaak, A. D. (2017). Microplastics en route: field measurements in the Dutch river delta and Amsterdam canals, wastewater treatment plants, North Sea sediments and biota. Environ. Int. 101, 133–142. doi: 10.1016/j.envint.2017.01.018
Li, C., Busquets, R., and Campos, L. C. (2020). Assessment of microplastics in freshwater systems: a review. Sci. Tot. Environ. 707:135578. doi: 10.1016/j.scitotenv.2019.135578
Lv, X., Dong, Q., Zuo, Z., Liu, Y., Huang, X., and Wu, W.-M. (2019). Microplastics in a municipal wastewater treatment plant: fate, dynamic distribution, removal efficiencies, and control strategies. J. Clean. Prod. 225, 579–586. doi: 10.1016/j.jclepro.2019.03.321
Mason, S. A., Welch, V. G., and Neratko, J. (2018). Synthetic polymer contamination in bottled water. Front. Chem. 6:407. doi: 10.3389/fchem.2018.00407
Mintenig, S. M., Löder, M. G. J., Primpke, S., and Gerdts, G. (2019). Low numbers of microplastics detected in drinking water from ground water sources. Sci. Tot. Environ. 648, 631–635. doi: 10.1016/j.scitotenv.2018.08.178
Mohamed Nor, N. H., Kooi, M., Diepens, N. J., and Koelmans, A. A. (2021). Lifetime accumulation of microplastic in children and adults. Environ. Sci. Technol. 55, 5084–5096. doi: 10.1021/acs.est.0c07384
Oßmann, B. E., Sarau, G., Holtmannspötter, H., Pischetsrieder, M., Christiansen, S. H., and Dicke, W. (2018). Small-sized microplastics and pigmented particles in bottled mineral water. Water Res. 141, 307–316. doi: 10.1016/j.watres.2018.05.027
Panno, S. V., Kelly, W. R., Scott, J., Zheng, W., McNeish, R. E., Holm, N., et al. (2019). Microplastic contamination in karst groundwater systems. Groundwater 57, 189–196. doi: 10.1111/gwat.12862
Pivokonsky, M., Cermakova, L., Novotna, K., Peer, P., Cajthaml, T., and Janda, V. (2018). Occurrence of microplastics in raw and treated drinking water. Sci. Tot. Environ. 643, 1644–1651. doi: 10.1016/j.scitotenv.2018.08.102
Plastics Europe (2021). Plastics - the Facts 2021 ∙ Plastics Europe Plastics Europe. Available online at: https://plasticseurope.org/knowledge-hub/plastics-the-facts-2021/ (accessed June 9, 2022).
Prata, J. C., da Costa, J. P., Lopes, I., Duarte, A. C., and Rocha-Santos, T. (2020). Environmental exposure to microplastics: an overview on possible human health effects. Sci. Tot. Environ. 702:134455. doi: 10.1016/j.scitotenv.2019.134455
Primpke, S., Christiansen, S. H., Cowger, W., De Frond, H., Deshpande, A., Fischer, M., et al. (2020). Critical assessment of analytical methods for the harmonized and cost-efficient analysis of microplastics. Appl. Spectrosc. 74, 1012–1047. doi: 10.1177/0003702820921465
Provencher, J. F., Covernton, G. A., Moore, R. C., Horn, D. A., Conkle, J. L., and Lusher, A. L. (2020). Proceed with caution: the need to raise the publication bar for microplastics research. Sci. Tot. Environ. 748:141426. doi: 10.1016/j.scitotenv.2020.141426
Ren, P., Dou, M., Wang, C., Li, G., and Jia, R. (2020). Abundance and removal characteristics of microplastics at a wastewater treatment plant in Zhengzhou. Environ. Sci. Pollut. Res. 27, 36295–36305. doi: 10.1007/s11356-020-09611-5
Rochman, C. M., Kurobe, T., Flores, I., and Teh, S. J. (2014). Early warning signs of endocrine disruption in adult fish from the ingestion of polyethylene with and without sorbed chemical pollutants from the marine environment. Sci. Tot. Environ. 493, 656–661. doi: 10.1016/j.scitotenv.2014.06.051
Schirinzi, G. F., Pérez-Pomeda, I., Sanchís, J., Rossini, C., Farré, M., and Barceló, D. (2017). Cytotoxic effects of commonly used nanomaterials and microplastics on cerebral and epithelial human cells. Environ. Res. 159, 579–587. doi: 10.1016/j.envres.2017.08.043
Schymanski, D., Goldbeck, C., Humpf, H.-U., and Fürst, P. (2018). Analysis of microplastics in water by micro-Raman spectroscopy: release of plastic particles from different packaging into mineral water. Water Res. 129, 154–162. doi: 10.1016/j.watres.2017.11.011
Shen, M., Song, B., Zhu, Y., Zeng, G., Zhang, Y., Yang, Y., et al. (2020). Removal of microplastics via drinking water treatment: current knowledge and future directions. Chemosphere 251:126612. doi: 10.1016/j.chemosphere.2020.126612
Su, L., Xue, Y., Li, L., Yang, D., Kolandhasamy, P., Li, D., et al. (2016). Microplastics in Taihu Lake, China. Environ. Pollut. 216, 711–719. doi: 10.1016/j.envpol.2016.06.036
Tadsuwan, K., and Babel, S. (2022). Microplastic abundance and removal via an ultrafiltration system coupled to a conventional municipal wastewater treatment plant in Thailand. J. Environ. Chem. Eng. 10:107142. doi: 10.1016/j.jece.2022.107142
Tong, H., Jiang, Q., Hu, X., and Zhong, X. (2020). Occurrence and identification of microplastics in tap water from China. Chemosphere 252:126493. doi: 10.1016/j.chemosphere.2020.126493
Treilles, R., Gasperi, J., Gallard, A., Saad, M., Dris, R., Partibane, C., et al. (2021). Microplastics and microfibers in urban runoff from a suburban catchment of Greater Paris. Environ. Pollut. 287:117352. doi: 10.1016/j.envpol.2021.117352
Triebskorn, R., Braunbeck, T., Grummt, T., Hanslik, L., Huppertsberg, S., Jekel, M., et al. (2019). Relevance of nano- and microplastics for freshwater ecosystems: a critical review. TrAC Trends Anal. Chem. 110, 375–392. doi: 10.1016/j.trac.2018.11.023
Wang, Z., Lin, T., and Chen, W. (2020). Occurrence and removal of microplastics in an advanced drinking water treatment plant (ADWTP). Sci. Tot. Environ. 700:134520. doi: 10.1016/j.scitotenv.2019.134520
Wen, B., Zhang, N., Jin, S.-R., Chen, Z.-Z., Gao, J.-Z., Liu, Y., et al. (2018). Microplastics have a more profound impact than elevated temperatures on the predatory performance, digestion and energy metabolism of an Amazonian cichlid. Aquat. Toxicol. 195, 67–76. doi: 10.1016/j.aquatox.2017.12.010
WHO (2019). Microplastics in Drinking-Water. Available online at: http://edepot.wur.nl/498693 (accessed October 18, 2019).
Wickham, H. (2016). ggplot2: Elegant Graphics for Data Analysis. Springer-Verlag New York. Available online at: https://ggplot2.tidyverse.org. doi: 10.1007/978-3-319-24277-4
Zhu, D., Chen, Q.-L., An, X.-L., Yang, X.-R., Christie, P., Ke, X., et al. (2018). Exposure of soil collembolans to microplastics perturbs their gut microbiota and alters their isotopic composition. Soil Biol. Biochem. 116, 302–310. doi: 10.1016/j.soilbio.2017.10.027
Keywords: microplastic, drinking water, river water, nanofiltration, water network, FTIR spectroscopy
Citation: Barbier J-S, Dris R, Lecarpentier C, Raymond V, Delabre K, Thibert S, Tassin B and Gasperi J (2022) Microplastic occurrence after conventional and nanofiltration processes at drinking water treatment plants: Preliminary results. Front. Water 4:886703. doi: 10.3389/frwa.2022.886703
Received: 28 February 2022; Accepted: 08 July 2022;
Published: 17 August 2022.
Edited by:
Rafael Trevisan, Centre de Bretagne, Institut Français de Recherche pour l'Exploitation de la Mer, FranceReviewed by:
David Chelazzi, University of Florence, ItalyThiago Lopes Rocha, Universidade Federal de Goiás, Brazil
Scott Coffin, California Water Resources Control Board, United States
Copyright © 2022 Barbier, Dris, Lecarpentier, Raymond, Delabre, Thibert, Tassin and Gasperi. This is an open-access article distributed under the terms of the Creative Commons Attribution License (CC BY). The use, distribution or reproduction in other forums is permitted, provided the original author(s) and the copyright owner(s) are credited and that the original publication in this journal is cited, in accordance with accepted academic practice. No use, distribution or reproduction is permitted which does not comply with these terms.
*Correspondence: Jean-Sebastien Barbier, amVhbi1zZWJhc3RpZW4uYmFyYmllckBsc2NlLmlwc2wuZnI=; Rachid Dris, cmFjaGlkLmRyaXNAdS1wZWMuZnI=