 Ali Mohammad Rezaie
 Anisul Haque
- 1Department of Civil Engineering, University of Asia Pacific, Dhaka, Bangladesh
- 2Institute of Water and Flood Management, Bangladesh University of Engineering and Technology, Dhaka, Bangladesh
Bangladesh's vulnerability to storm surge and success in reducing their impacts on the coastal communities are well-known. However, global warming is expected to increase both the frequency and the intensity of tropical cyclones. Also, the country still lacks in good quality data and information that can offer enhanced services to effectively design coastal defense systems and adapt to climate changes. This study developed a storm surge inundation model and database using the available tropical cyclones' database and simulated inundation for the past 31 cyclones in the Bay of Bengal, near the coastal regions of Bangladesh. The model uses a suite of Delft3D hydrodynamic and Delft Dashboard cyclone models. The model was calibrated and validated for two major cyclones, namely Sidr and Aila, using the available data for different bed roughness, track sources, and wind drag coefficient conditions. The results suggested that spatially varying bed roughness and wind varying drag conditions provide a more reliable prediction of inundation over the coast. The results also show that historical track data from Indian Meteorological Department optimize the model performances. The inundation database indicates that depending on the intensity and location, tropical cyclones can cause the maximum inundation of 1–5 m in the coastal lands of Bangladesh. More than 70% of the storms lead to the maximum inundation of more than 2 m, and about 25 and 7% of the storms can cause the maximum inundation of more than 3 and 4 m, respectively. The study also discusses the potential applications and shares insights on the implications of the inundation database that can offer improved information for enhanced climate services in Bangladesh. The database can be advanced with information about sectoral loss and damage as well as citizen science that will not only provide necessary information to design coastal protection structures and emergency measurements but also contribute to build long-term climate adaptation plans in the data-scarce region.
Introduction
The World Meteorological Organization (WMO) estimated that tropical cyclones (TCs) caused an average of $78 million (USD) damages and 50 causalities on a daily basis in the past 50 years where one TC event (Bhola cyclone) killed ~300,000–500,000 people in 1970 in Bangladesh (WMO, 2022). From 1877 to 1977, a total of 154 TCs hit the country (Dasgupta et al., 2014), and 26 TCs from 1960 to 2016 had a wind speed of more than 117 km/h (MoEFCC, 2018; Dasgupta et al., 2019). The increase in severity and frequency of these events is also evident in Bangladesh with an estimated death of over a million in the past 500 years (Hadi et al., 2021). For example, from the early seventeenth century to the late eighteenth century, only three major cyclones affected the country, while the numbers are 13 and 51 in the first and second half of the nineteenth century, respectively (MoEFCC, 2018). In addition to high death tolls, which have been significantly reduced in the past few decades (Haque et al., 2012), TCs and storm surge cause substantial socioeconomic, infrastructural, and environmental damages in Bangladesh. Cyclone Gorki in 1991 damaged about 1.75 million households and 470 km of coastal embankments, while cyclone Sidr in 2007 affected about 7 million people's livelihood with an estimated $70.3 and $19.3 million of damages to coastal polders and livestock, respectively. Cyclone Aila with an estimated $270 million of damages in assets in 2009 inundated large agricultural land and homeland with severe salinity intrusion in both surface and groundwater, which still affects the agricultural production in many places (Brecht et al., 2012; Dasgupta et al., 2014; MoEFCC, 2018). As per national planning documents, the country is hit by severe cyclones once every 3 years on average and deficit in climate adaptation finance, for TC can reach up to $25 billion (MoEFCC, 2009, 2018). In addition, sea-level rise (SLR) of 0.26–0.54 m can increase the storm surge inundation by 31–53% from the present situation in the coastal areas of Bangladesh (Jisan et al., 2018). A 2°C rise in sea surface temperature with a 0.3 m rise in sea level can also exacerbate the flood risk by 15% and increase the flood depth by 22% from the present condition (Karim and Mimura, 2008). Therefore, it is highly required to develop robust understanding, information, and analysis of the storm characteristics and storm surge inundation in the region to prepare a resilient coastal region of Bangladesh.
The recent WMO report (Cullmann et al., 2020) stressed the importance of and need for early warning and water-related database for enhanced climate services; however, the country lacks good-quality observational hydro-meteorological data, especially in the coastal region (Rezaie et al., 2019; Khan et al., 2021b). Coastal communities in Bangladesh are also willing to invest on improved climate data and warning systems (Ahsan et al., 2020). While capacity development, data collection, and management are considered essential for meeting the climate adaption and service needs (Cullmann et al., 2020), numerical modeling of storm surge inundation can offer large datasets in data-poor areas. Multiple numerical models have been developed and applied over the past decades to simulate the physical processes of cyclone-induced storm surge and forecasting peak surge in the coastal regions of Bangladesh. Several numerical models (Das, 1972; Johns and Ali, 1980; Dube, 1985; Murty et al., 1986) were developed in the early 1970s to 1990s to simulate the physical processes of cyclones and forecast surge heights in the Bay of Bengal. Most of these models have successfully predicted the storm surge; however, their predictions were limited to forecasting the peak surge height along the coastline. The later models (Flather, 1994; Rao et al., 1997; Madsen and Jakobsen, 2004; Karim and Mimura, 2008) focused on improving the surge forecast height along the coastline and estimated the surge-induced inundation over the coastal regions of Bangladesh. For operational purposes, the Bangladesh Meteorological Department (BMD) used a numerical storm surge model (the IIT model) and regression models (STP and STEEPER) (Debsarma, 2009; Debsarma et al., 2014) to predict the maximum surge height and cyclone track information, respectively. Recent studies (Mashriqui et al., 2006; Deb and Ferreira, 2016; Mamnun et al., 2020) applied advanced circulation (ADCIRC) and atmospheric (WRF) models to simulate storm surge in the region. Jisan et al. (2018), Tanim and Akter (2019), and Tanim and Goharian (2021) also simulated the storm surge inundation using Delft3D; however, the studies only looked at two tropical cyclones. Studies by Khan et al. (2021a) proposed a multi-model inundation forecasting system using synthetic storms. Thus, the current modeling practices have significantly advanced the overall understanding and delineation of the tropical cyclone and associated storm surge. However, a majority of these studies focused on the information from one or two real storms or only on modeling the surge heights along the coast. In addition, recent studies have shown the importance of relevant parameterization for wind forcing in simulating storm surge in the East Asia (Yu et al., 2019; Hsiao et al., 2020; Chang et al., 2021). For example, Hsiao et al. (2020) and Chang et al. (2021) applied temporally and spatially varying wind fields to improve the hindcast of storm surge. Yu et al. (2019) simulated the highest storm tide level for the past 122 storm surges in Taiwan, which not only generated a large surge database but also offered useful insights into the design and development of coastal flood protection infrastructure.
Therefore, this study advances the existing literature with the development of a storm surge inundation database using a storm surge inundation model for the past 31 tropical cyclones in the Bay of Bengal. The storm surge inundation model is developed for the coastal regions of Bangladesh using coupled Delft3D and Delft Dashboard. The model is simulated for the past 31 storms to originate the development of a cyclone and storm surge inundation database that can provide enhanced climate services in the country. The study also delineates complex processes for implementation and parameterization of the storm surge model in Bangladesh. The results analyze potential storm surge and inundation characteristics in Bangladesh. In addition, estimated socioeconomic impacts are evaluated for enhanced climate service and adaptation. Thus, the study advances the existing literature by offering a holistic analysis of the application of numerical modeling for the development of an inundation database that can improve early warning systems in the short term and can offer long-term benefits for coastal flood protection infrastructure development, emergency, and land use plans. Furthermore, the model development process can assist in parameterization and advancement of coastal modeling in Bangladesh.
Coastal Zone and Modeling in Bangladesh
Bangladesh has about 710-km-long coastline with a total of 19 coastal districts (12 interior and 7 exterior, depending on the exposure to sea) in the coastal zone of the country (PDO-ICZMP, 2003). The region is also divided into three major estuarine systems, namely, eastern, central, and western (Ali, 1999).
The eastern zone is mostly comprised of Chittagong coastal plain, while the central part is an active zone due to continuous land subsidence and accretion process (Brammer, 2014; Rezaie et al., 2019). In addition, about 90% of the combined upstream flow from the Ganges, Brahmaputra, and Meghna rivers flow through this region via the Lower Meghna River (Rezaie et al., 2014). The western region has a relatively flat topography with many small rivers, channels, and distributaries. The largest mangrove, Sundarbans is also situated in this region, which offers multiple environmental and socioeconomic benefits to the region as well as to the country (Figure 1). The entire coastal region is vulnerable to many natural and climatic disasters, such as storm surge and tidal flooding, salinity intrusion, river erosion, SLR, and waterlogging. The region covers 32% of the total landmass with about 38 million people (Iftekhar and Islam, 2004; BBS., 2014). A total of 139 polders (peripheral embankments) are constructed, and several coastal afforestation programs are implemented in the past few decades in the region to protect the lives and livelihood of the coastal population from the natural disasters. The region is hit by tropical cyclones almost every year during the pre-monsoon (April–May) and post-monsoon (October–November) seasons. In addition to the low and flat terrain and numerous rivers, the triangular entrance to the Bay of Bengal, wide and shallow continental shelf, high tidal range, and strong tide–surge interaction exacerbate the flooding and inundation due to storm surge (Ali, 1999; Debsarma, 2002; Chowdhury, 2004). Thus, modeling the physical processes and storm surge in this dynamic coastal region is challenging.
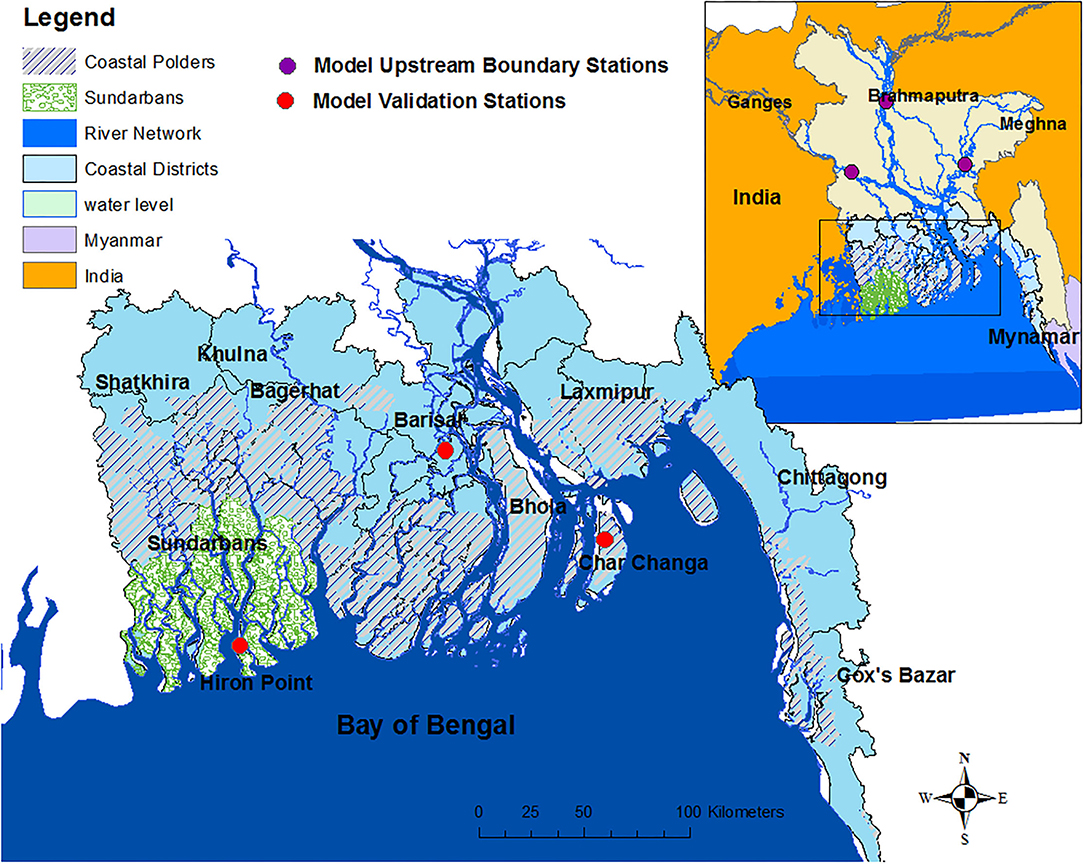
Figure 1. Study area: coastal areas (districts) and major features (Sundarbans, polders) of Bangladesh in in Ganges Brahmaputra Meghna Basin (model upstream boundary and validation locations are given in purple and red circles, respectively).
Materials and Methods
A storm surge model of Delft3D is a coupled model of two modules: Delft3D Flow (hydrodynamic) model and the Delft Dashboard cyclone model. In the coupled model, the cyclone wind velocity is computed in Delft Dashboard and used in the Delft 3D flow module by using wind drag co-efficient, Cd. The following sections describe the processes involved in model preparation, parameterization, calibration, and validation.
Hydrodynamic Model
Delft3D is a multidimensional hydrodynamic model that is widely used to simulate hydrodynamic, morphodynamic, and storm surge processes in the coastal areas (Sao, 2008; Condon and Veeramony, 2012; Vatvani et al., 2012; Sakib et al., 2015; Jisan et al., 2018; Matin et al., 2020). The hydrodynamic model, Delft3D Flow, solves shallow water equations for the unsteady flow to calculate water surface elevation and flow velocity in two and three dimensions. It simulates the system of equations consisting of the horizontal equations of motion, the continuity equation, and the transport equations on a rectangular, curvilinear, or spherical grid (Deltares, 2014a). The model forcing includes discharge, tide, and velocity at the open boundaries and wind stress at the free water surface. The model solves the continuity (Equation 1) and momentum (Equations 2–3) equations in the ξ and η directions in Cartesian coordinates for calculating surface water elevation, total depth, and velocities (Deltares, 2014a).
In equations (1–3), ζ is the surface elevation where d + ζ calculates the total water depth from the datum or reference plane; U and V are the depth-averaged velocities and u and v are the flow velocities in the ξand η directions; and and are the coefficients to convert from curvilinear to rectangular/Cartesian coordinates. In addition, P, F, and M address the pressure gradients, horizontal Reynolds stress, and flow contributions from external sources or sinks, respectively, in the ξand η directions, while υV represents the coefficient of eddy viscosity and Q is the discharge of water. Additional model parameters and equations are given in the Flow manual (Deltares, 2014a).
In this study, the model domain consists of the rivers, estuaries, coastal floodplain of Bangladesh including the major coastal districts such as Khulna, Bagerhat, Barisal, Chittagong, and Cox's Bazar as well as the coastal mangrove forest, Sundarbans of Bangladesh part (shown in Figure 1). Figure 2 shows the model domain, boundary locations, grid resolutions, and bathymetry. River discharge at three upstream locations is used as the upstream boundary, while the downstream boundary is applied in the open ocean which is prepared using tidal harmonic analysis. As the combined outflow from the Ganges–Padma, Brahmaputra–Jamuna, and Surma–Meghna river systems contributes to the total inflow in the coastal regions, the upstream discharge boundaries are selected in these rivers based on the availability of data. The time-series discharge data at the three upstream boundaries were taken from BWDB discharge stations, Hardinge Bridge in the Ganges Padma River, Bahadurabad Transit in the Brahmaputra–Jamuna River, and Bhairab Bazar in the Surma Meghna River (Figure 2). The model is extended into the Bay of Bengal up to the coast of India at Bhubaneshwar, Odisha, in the west and Sittwe coast of Myanmar in the east as downstream boundary (Figure 2). The downstream open ocean harmonic tidal data were generated using NAOTIDE model (Matsumoto et al., 2000) including 16 major tidal constituents (M2, S2, K1, O1, N2, P1, K2, Q1, M1, J1, OO1, 2N2, Mu2, Nu2, L2, and T2).
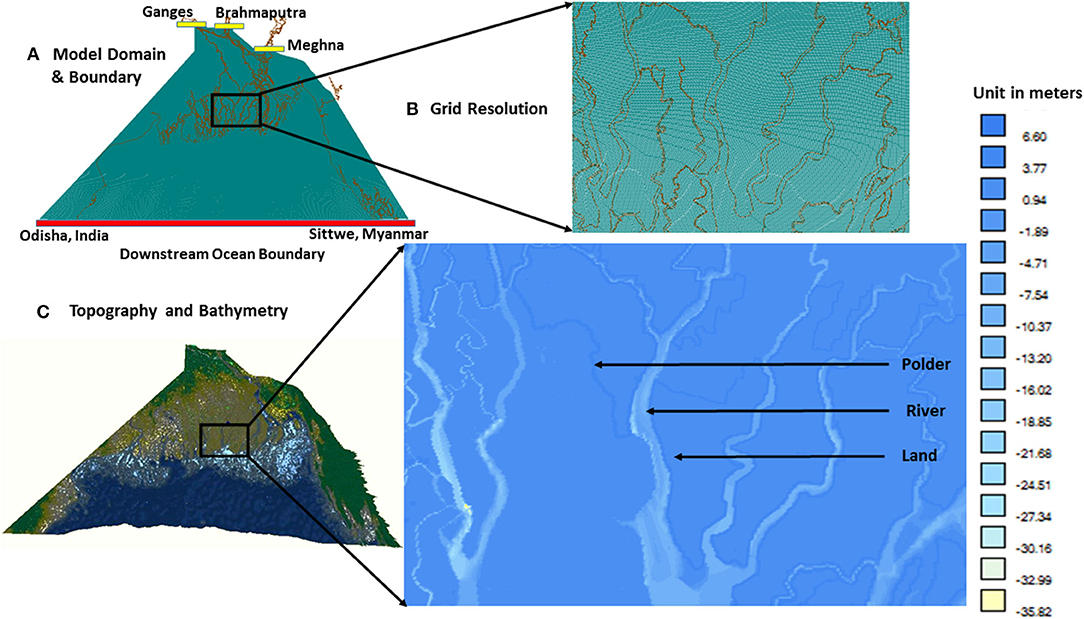
Figure 2. (A) Model domain and boundary (upstream stations are yellow and downstream is red); (B) grid resolution; (C) model bathymetry with the detailed representation of coastal features such as polder, river, and land.
Accessing the bathymetric, topographic, and discharge data to build the model was the biggest challenge in the study as observational data in the coastal regions of Bangladesh are scarce. Thus, this study combined data from different sources to prepare the model bathymetry data (land, river, and ocean). Land elevation data are taken from the 50-m-resolution FINN map data developed from the land survey by Bangladesh Inland Water Transport Authority (BIWTA) (BISR, 2009; Dasgupta et al., 2010), while the ocean bathymetry data of the Bay of Bengal are taken from the open-access 30-arc-second General Bathymetric Chart of the Oceans (GEBCO) data (Weatherall et al., 2015). The river depth for the major rivers is taken from the measured cross-sectional data from Bangladesh Water Development Board (BWDB) and the ESPA Deltas project (ESPA, 2012). In case of missing and unrealistic data in some rivers, interpolations are taken from the nearby-station cross-sectional data. The polder locations and heights are collected from the BWDB polder database. For grid preparation, several options (curvilinear, spherical, and rectangular) were applied to optimize the simulation results and discretization of complex riverine and estuarine systems in the coastal zone of Bangladesh. After testing different gridding techniques, finally a conical-shaped rectangular grid (Figure 2) converging toward the upstream direction was used so that the coastal rivers, estuaries, and land are discretized with finer grids (about 200 m in the river areas), while the ocean area has the comparatively coarse grid resolution (about 1.5 km length). In a spherical coordinate system, the total number of grid points in the x-direction is 866, and in the y direction, it is 1,243. The gird was able to discretize all major coastal rivers and estuaries in the coastal region. In order to optimize the computation time, efficiency, and model, pre- and post-processing river channels with a width of <100 m are not discretized. Also, the percentage of flow contributed by these rivers is minimal in comparison with that of the total inflow in the coastal zone (Rezaie et al., 2014). In addition, a time step of 5 min is used to optimize the model simulations where initial conditions for water levels were set to zero.
For model calibration, constant and spatially varying Manning's roughness parameters are applied for the river bed, land and vegetation, and ocean floor. For each condition, the modeled water-level data are compared with the hourly tidal gauge data from three BIWTA station data. They are Charchanga station at 91°03'E longitude and 22°13'N latitude in the Shahbazpur Channel on the Lower Meghan Estuary, Barisal station at 90°21'E longitude and 22°40'N latitude in the Barisal River in the central estuarine system, and Hiron Point station at 89°28'E longitude and 21°47'N latitude in the Passur River near Sundarbans (shown in Figure 1). The calibration exercise for both hydrodynamic and storm surge models followed the formula in equation 4 (Haque et al., 2016):
where is the observed data at any time and is the modeled data at that same time step. The equation allows the evaluation of the performance of the model with the measured values at any time instance T where 100% reliability value shows that the model results completely align with the measured ones. Figure 3 shows the different roughness conditions and their respective model reliability values (Complete details of roughness are provided in Supplementary Table A). The Manning's N values of 0.015 for the Lower Meghna estuary, 0.021 for the rest of the rivers in the coastal zone, 0.025–0.04 from floodplain to highly vegetated areas as well as varying roughness from 0.02 to 0.00025 were applied from shallow water to the deep ocean, providing the best roughness conditions and reliability performance for the model. These values are similar to the roughness values applied in the past studies (Jisan et al., 2018; Tanim and Akter, 2019; Khan et al., 2021b).
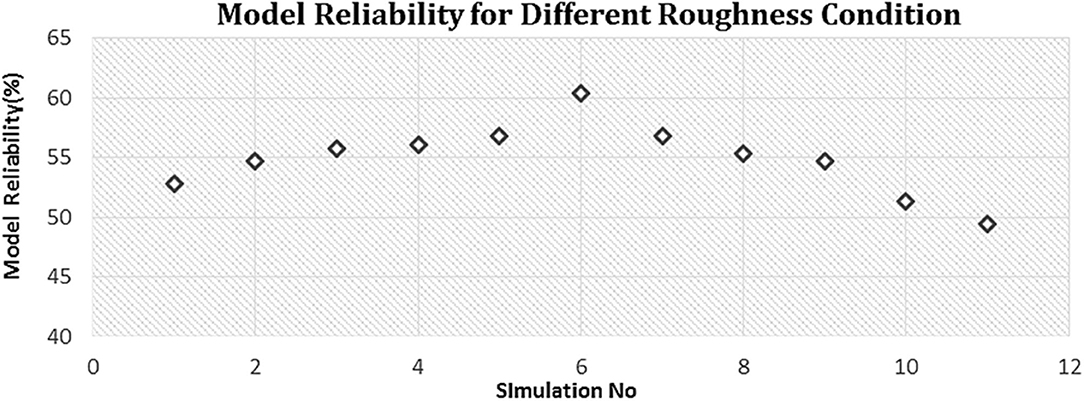
Figure 3. Performance of the hydrodynamic model with different roughness conditions.
Storm Surge Model
After preparing and validating the hydrodynamic model, the storm surge inundation model was implemented in the Delft Dashboard by applying the atmospheric forcings to generate cyclone wind and pressure field in the model (Van Ormondt et al., 2020). This allows the provision of all Delft3D files and generates the atmospheric forcings using the Wind Enhance Scheme (WES) (Deltares, 2014b).
WES follows the Holland (1980) approach, given in Equations 5 and 6, to compute the wind and pressure field due to a tropical cyclone. Vg and Pdrop are the geostrophic wind and pressure drop, respectively; Rω is the radius of maximum wind; r is the distance from cyclone center; f is the Coriolis parameter; and ρ is the air density. A and B are the Holland parameters calculated from empirical relations between wind speed, pressure drop, and radius of maximum wind (Holland, 1980, 2008). WES applies an improved version of the Holland method by applying asymmetry with a translation speed of the storm center movement and using rotational wind speed. Further details about the wind field calculation can be found in the WES documentation (Deltares, 2014b). It should also be noted that the simplistic Holland model may provide relatively inaccurate results, and a combination of parametric and global reanalysis models may offer improved wind forcing (Yu et al., 2019). However, the advantage of the parametric model is that the parameters can be tuned to reproduce the real cyclone accurately, in which the global wind source data may not reproduce. Thus, in this study, the wind forcing is parameterized to simulate the storm surge due to TC. In addition, the parametric wind model is widely used for simulating TC-induced storm surge in Bangladesh using Delft3D, especially in areas with poor observational records (Azad et al., 2018; Jisan et al., 2018; Tanim and Akter, 2019; Tanim and Goharian, 2021). Previous studies have found more accurate results using the Holland model (Azad et al., 2018; Jisan et al., 2018; Tanim and Akter, 2019). Thus, this study also used the advanced Holland approach for simulating storm surge for the past TCs in Bangladesh where the detailed atmospheric observations and information are inadequate. In future studies, a combination of global reanalysis and parametric wind model can offer further insights into reproducing advanced wind forcing due to TCs in the Bay of Bengal.
WES computes 2D surface winds and pressure field around the specified location of a tropical cyclone center on a moving circular “spider” web grid. The shear stress (τs) due to the cyclone wind field is calculated in the model using air pressure density, wind speed at one or different heights, and wind drag coefficient (Cd), shown in velocity equation 7 (Deltares, 2014a). Further details about the wind and pressure field calculation and resultant shear stress are given in the WES and Flow manuals (Deltares, 2014a,b). Based on the accessibility and availability of available historical cyclone track and intensity data in the Bay of Bengal, a total of 31 tropical cyclones in the past 20 years from 1995 to 2015 are simulated in this study. The storm surge model was further validated for the available track sources and different wind drag coefficient conditions.
Historical track information is collected from the Joint Typhoon Warning Center (JTWC), Unisys Corporation (American global information technology), and Indian Meteorological Department (IMD). JTWC provides the cyclone track data for the past 70 years, while the UNISYS track data are available up to the last 20 years for the northern Indian Ocean. IMD also provides the best track data for the Bay of Bengal which is referred by the BMD officials as they validate their own prediction with IMD track data. To optimize the model performance, the storm surge model was calibrated for two track sources, namely, JTWC and IMD data, for cyclones Sidr (2007) and Aila (2009). Sidr is considered as super-cyclonic storm with a wind speed of more than 223 km/hr and Aila has an average maximum wind speed of 120 km/h where both cyclones caused the severest socioeconomic and environmental damages in the coastal areas of Bangladesh. Thus, calibrating the storm surge model for cyclones Sidr and Aila represents an envelope of all cyclones modeled for the study.
From the calibration exercise on different data sources, both cyclones' simulations for multiple roughness conditions, the IMD best track data show a higher average reliability than JTWC. Figure 4 shows the average mode reliability values for cyclone Sidr and Aila tracks from JTWC and IMD sources. Thus, IMD track data are used for simulating a total of 31 TCs to develop the storm surge inundation database. Madsen and Jakobsen (Madsen and Jakobsen, 2004) both track data for modeling the 1991 cyclone and presented that the JTWC tracks predicted a higher maximum wind speed than the one used by the BMD.

Figure 4. Average track reliability for JWTC and IMD for cyclones Sidr and Aila.
After selecting the track source, the models were further calibrated for the wind drag coefficient, Cd in Equation 7, which is a crucial parameter for estimating the transfer of momentum from wind to water surface due to tropical cyclones (Smith and Banke, 1975; Wu, 1982; Vatvani et al., 2012; Peng et al., 2013; Peng and Li, 2015). Earlier studies (Smith and Banke, 1975; Garratt, 1977) suggested that Cd linearly increases with the wind speed, while relatively later studies indicated that Cd values are constant or consistently increase with a surface wind speed up to a limit and decrease with a further increase in a wind speed (Kim et al., 2008; Zhihua et al., 2010; Vatvani et al., 2012). Vatvani et al. (2012) proposed that Cd values increase up to 30 ms−1 and decrease afterward, which aligns well with a study by the BMD official (Debsarma, 2009) suggesting increasing Cd values (2–3 × 10⁻³) from 10 to 30 ms−1 of a wind speed of TCs in the Bay of Bengal. Based on the discussions from past literature, this study calibrated the model for Sidr and Aila cyclones under four Cd conditions: (1) constant values; (2) Cd increasing with varying wind speeds; (3) Cd values increasing linearly up to a wind speed of 30 ms−1 and then decreasing with a further increase in the associated wind speed; and (4) Cd values (0.6 × 10⁻³ and 7.23 × 10⁻³) proposed in Delft Dashboard at 0 and 30 ms−1 (Van Ormondt et al., 2020).
The model performance was poor (35–45% reliable) for the first condition and was not considered in the calibration processes. In Figures 5, 6, the later three conditions and the respective reliability for the model are shown for cyclones Sidr and Aila, respectively. It should be noted that the Cd values in the X-axis of these figures are shown in the scale of 10−3 for a wind speed of 0, 30, and >30 ms−1. In addition, Delft Dashboard default Cd values are 0.6 × 10⁻³ and 7.23 × 10⁻³ at 0 and 30 ms−1, respectively (Van Ormondt et al., 2020). The calibration practices due to different Cd conditions suggest that the fourth Cd condition, varying Cd values at 0 and 30 ms−l, proposed by Delft Dashboard offers the optimum model performance. Thus, these Cd values are applied to simulate the rest of the selected tropical cyclones. Finally, the comparison between validated model water level due to cyclones Sidr and Aila for the IMD track and optimum Cd conditions and observed water level at the selected validation stations is shown in Figures 7, 8, respectively. The validation stations are selected based on the data availability during the storm period and are shown in Figure 1.
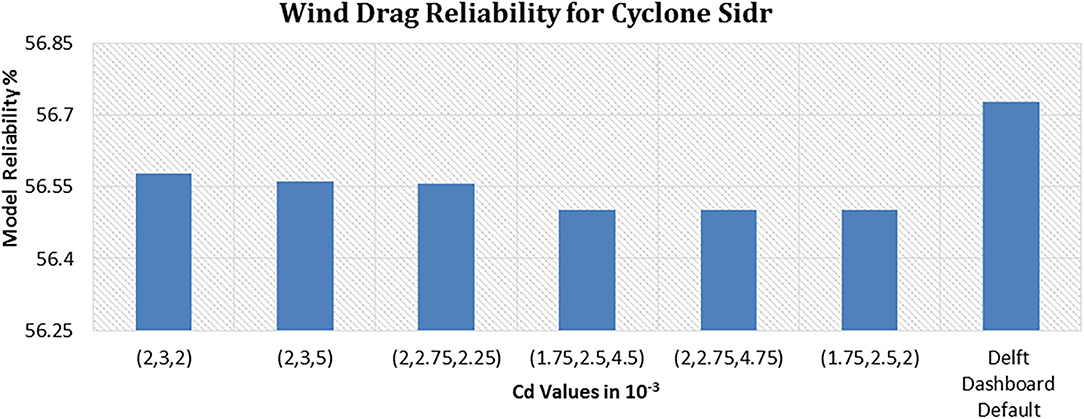
Figure 5. Average model reliability due to different wind drag conditions for cyclone Sidr.

Figure 6. Average model reliability due to different wind drag conditions for cyclone Aila.
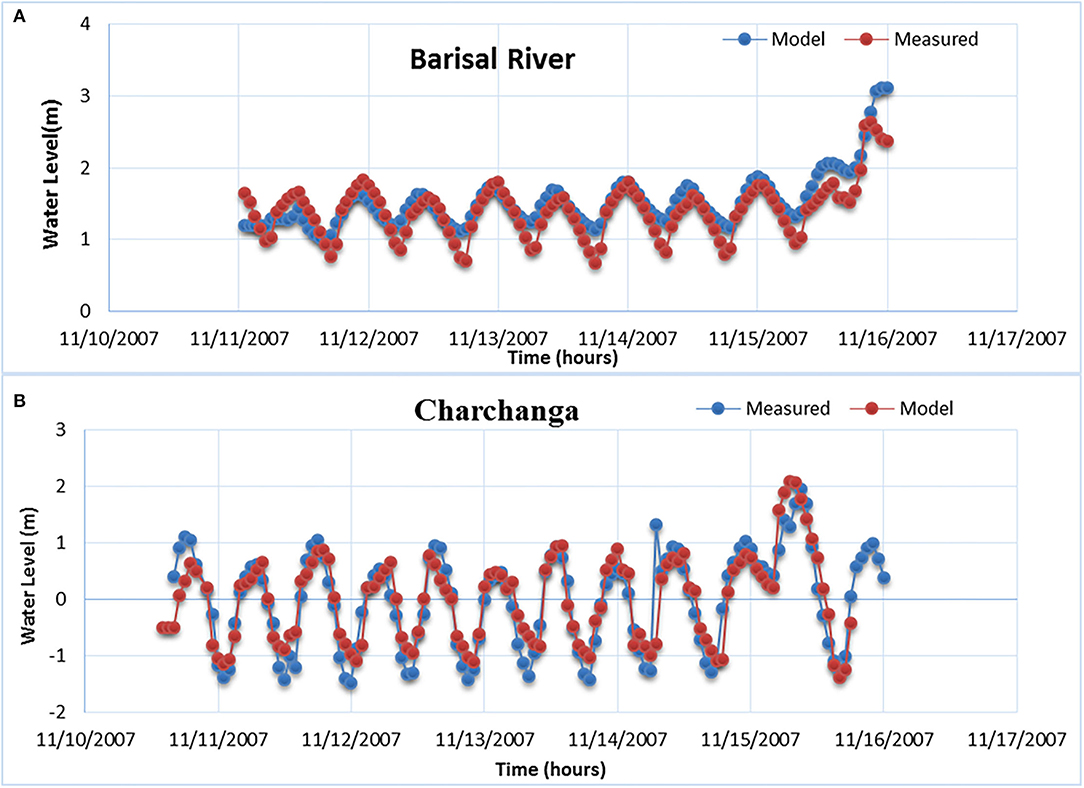
Figure 7. Model validation (comparison between modeled and hourly observed data) for cyclone Sidr at Charchanga (A) and Barisal River (B) stations.
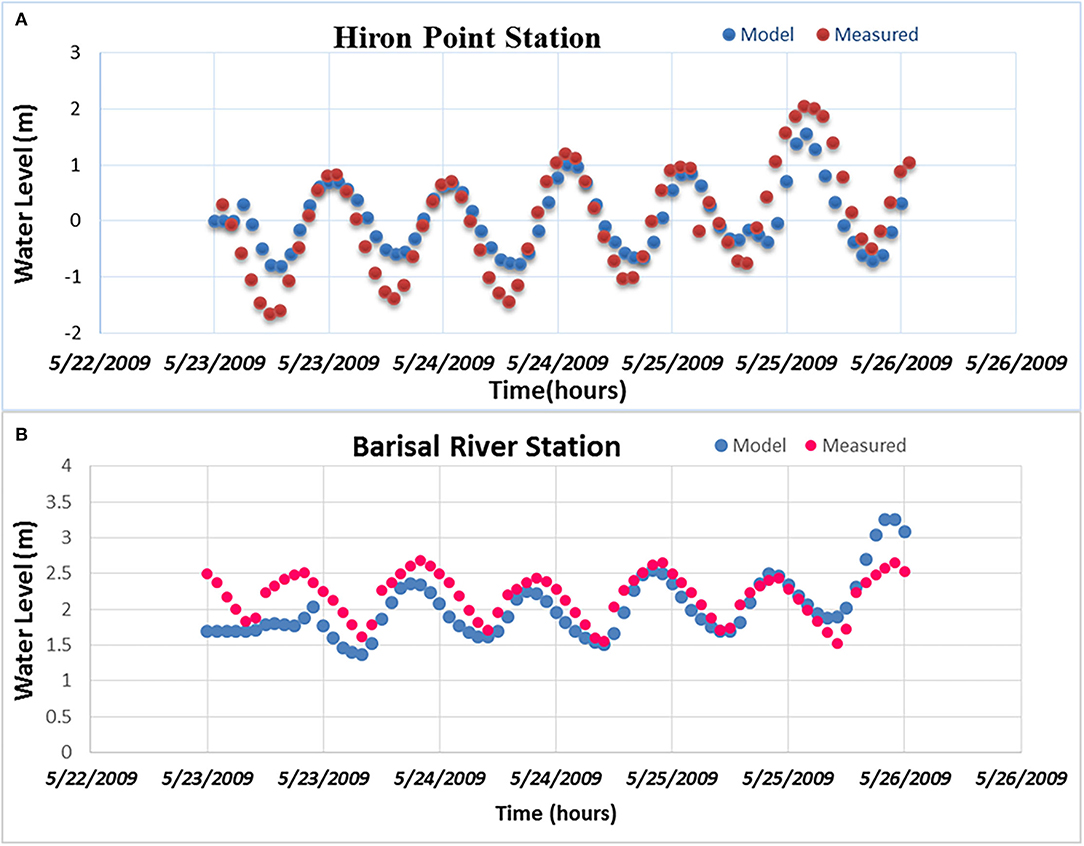
Figure 8. Model validation (comparison between modeled and hourly observed data) for cyclone Aila at the Hiron Point (A) and Barisal River (B) stations.
From validation, it can be seen that the observed tidal level and ranges align well with the simulated results. For example, the peak water levels at the Barisal and Char Change stations during cyclone Sidr, which hit near the Khulna–Satkhira coast of Bangladesh, were matched with the simulated peaks. For Aila (2009), which hit the western coast of Bangladesh near the Sundarbans, peak water levels at the Barisal River and Hiron Point stations showed good alignments with the modeled water levels. However, the simulated water levels for both cyclones at the Barisal River stations were slightly higher (0.2–0.4 m) than the observed records. This difference may occur due to the data resolution and could be improved with the availability of accurate river bathymetry data which are not available at this point.
Preparation of Inundation Database
After validating the model parameters for two major cyclones, the coupled Delft3D flow and Delft Dashboard simulated a total of 31 tropical cyclones in the Bay of Bengal to prepare an inundation database. The selection of cyclones for model simulation was based on data availability and coherence with other model data sources (topography, boundary data, etc.). As most of the model data are from 1995 to 2015, the study simulated tropical cyclones that hit the Bay of Bengal within the 20-year range. For most of the cyclonic cases, the upstream time-series boundary condition data for cyclones hit before 1991 were missing. Also, some of the cyclones did not have enough and proper track and intensity data to model them. From the model results, the “x-coordinate,” “y-coordinate,” and “water depth (m)” (xyz) for all grid points during respective landfall time are exported to obtain the simulated inundation. Consequently, the xyz data are imported in ArcGIS to calculate the maximum inundation height through subtracting the elevation data.
Results: Storm Surge Inundation Database
The study prepared a detailed inundation map for a total of 31 past cyclones, and the simulated information was geospatially analyzed to calculate the maximum inundation depth. Figure 9 shows the track and landfall locations of the selected cyclones in the coastal regions of Bangladesh and the Bay of Bengal. Combining the cyclone landfall location and intensity information with the simulated maximum flood depth, the storm surge inundation database is prepared for the coastal regions of Bangladesh. The inundation database is shown in Table 1, which provides cyclone landfall locations along with their relative position with Meghna Estuary, intensity (maximum wind speed and pressure drop), and simulated maximum inundation heights.
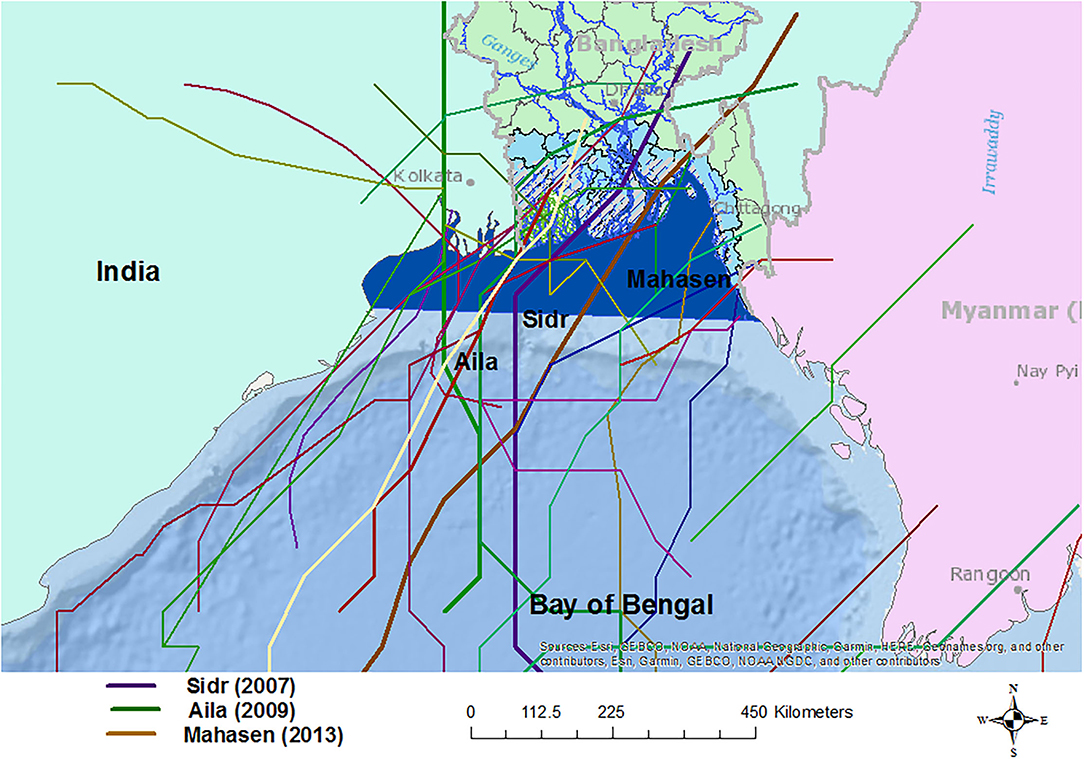
Figure 9. Track and landfall locations of the simulated cyclones in the coastal regions of Bangladesh and in the Bay of Bengal (Sidr, Aila, and Mahasen tracks are highlighted).
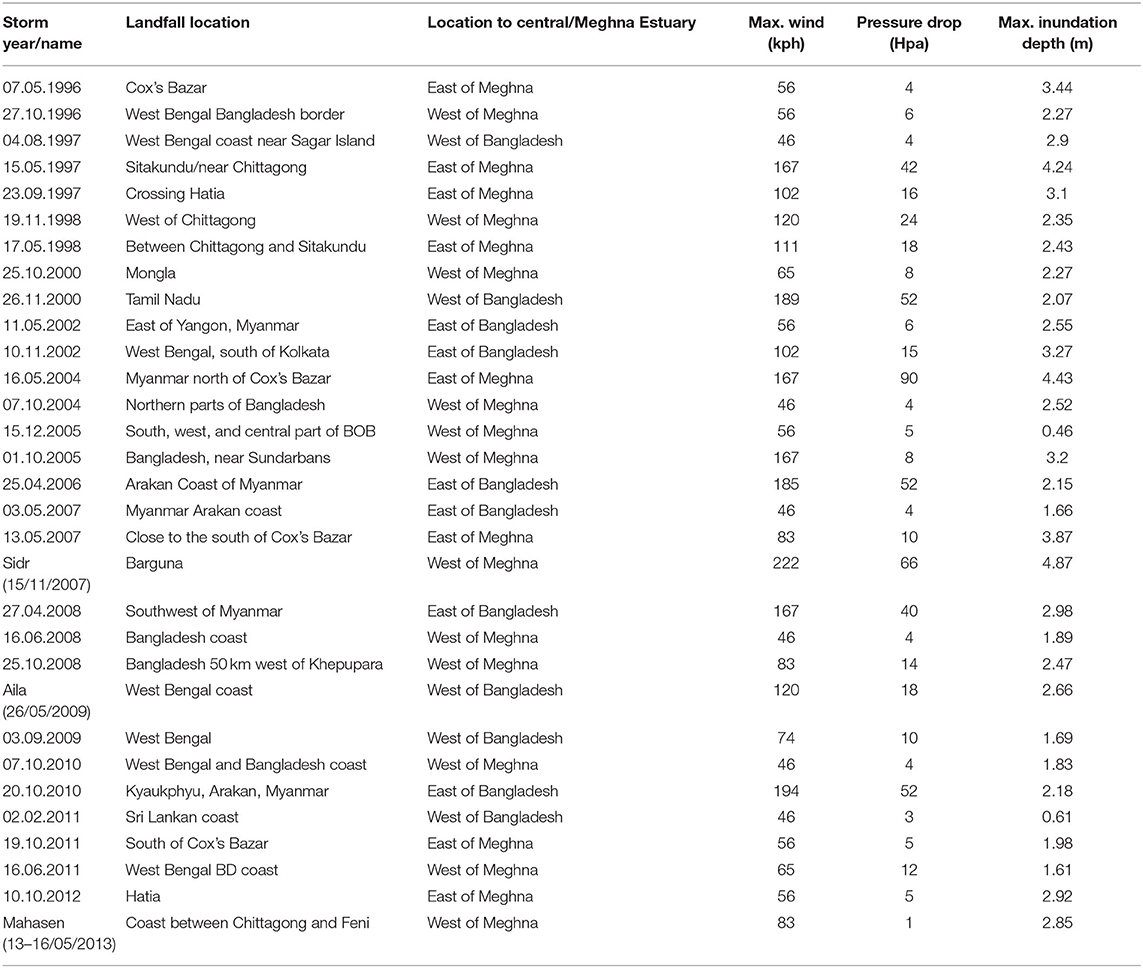
Table 1. The inundation database with cyclone date, landfall location, intensity, and simulated maximum inundation.
From the database, it can be seen that from 1996 to 2013, the maximum sustained wind speed for cyclones hitting the coastal regions of Bangladesh varied within a range of 40–230 Kph. Also, the pressure drop has a wide variability from 1 to 90 Hpa. The resultant simulated maximum inundation depth shows that the maximum inundation can reach up to 5 m depending on the intensity and landfall location of the cyclone. The results show that in the coastal areas, 10% of the cyclones can cause more than 4 m flood inundation, while about 25% of them can cause 3 m or more inundation. A majority of the tropical cyclones, i.e., more than 70% of the cyclones, caused more than 2 m inundation in the coastal regions of Bangladesh. Figure 10 shows the variation of cyclone intensity and simulated maximum inundation depth for the selected 31 cyclones in Bangladesh. It is also evident from Figure 10 that pressure variation and drop may play an insignificant role in the physical processes driving the surge inundation. This also aligns well with the findings from previous studies that a wind stress mostly accounts (80–85%) for the TC-generated surge heights (Ali, 1996; Kurian et al., 2009; Needham and Keim, 2011).
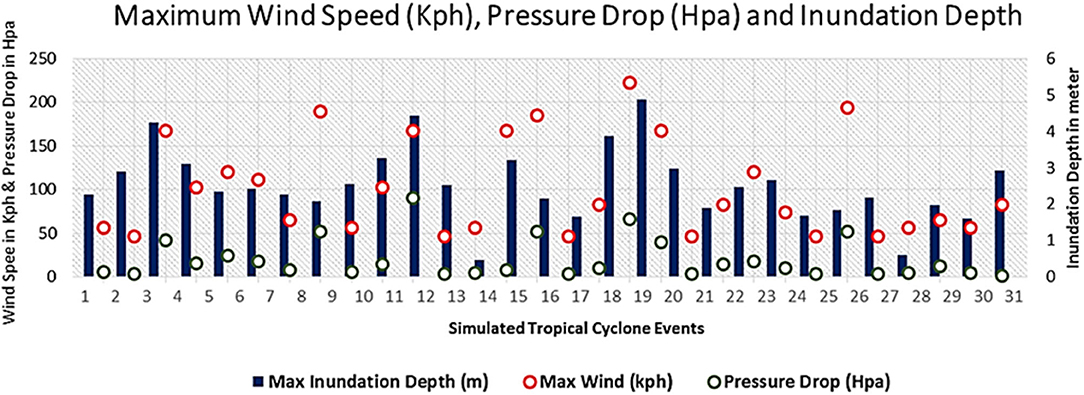
Figure 10. Maximum wind speed (Kph), pressure drop (Hpa), and simulated inundation depth (in meter in the secondary axis on the right side) for the selected tropical cyclones in Bangladesh.
While the intensity of the storm plays a significant role in an inundation depth in the affected areas, inundation largely varies with landfall locations. The results show that in terms of landfall location, 35% of the tropical storms hit outside the boundary of Bangladesh (45% at the west and 55% at the east of the country) and the remaining stroke inside the country at different coastal zones of Bangladesh. Among the inside cyclones, 60% of them made landfall in areas that are in the west of the Lower Meghna estuary (central zone), whereas 40% hit in the eastern side of this central estuary. Almost 60% of all selected cyclones hit in the western side of the country, considering the Meghna Estuary in the center. In addition, the major cyclones Sidr (2007), Aila (2009), and Mahasen (2013) from the last two decades also hit in the western side of the country. From the simulated inundation for cyclone Sidr, the results found up to 8–9 m of surge height along the shoreline during the landfall. The model result showed that areas near the Barguna District experienced about 3–5 m inundation and Satkhira district had inundation of 1.5–2.5 m due to cyclone Sidr. The simulated inundation maps for cyclones Sidr and Aila are shown in Figures 11, 12, respectively.
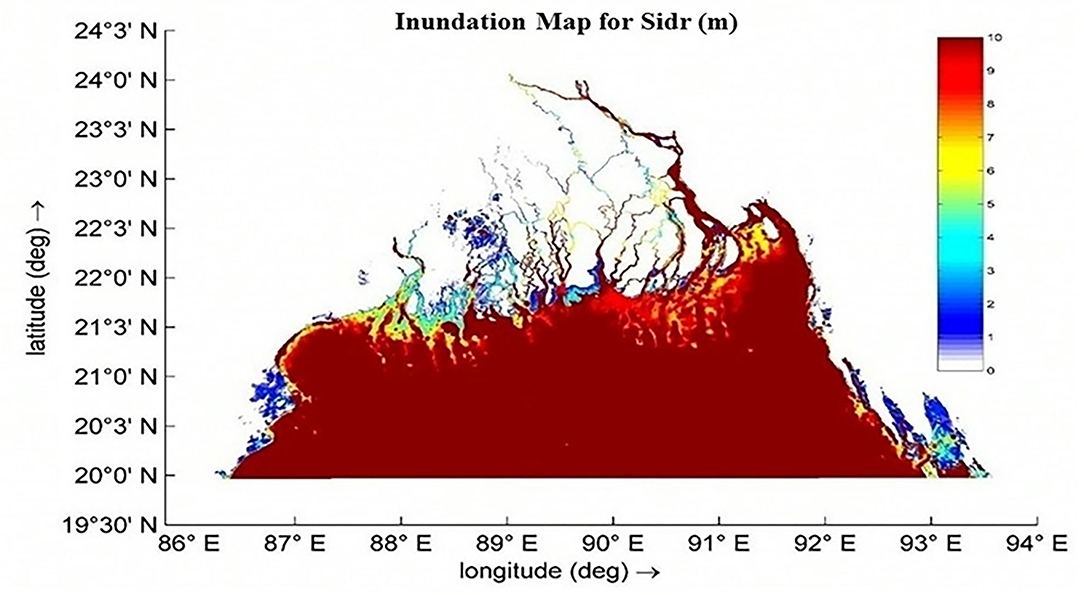
Figure 11. Simulated storm surge inundation due to cyclone Sidr during landfall time.
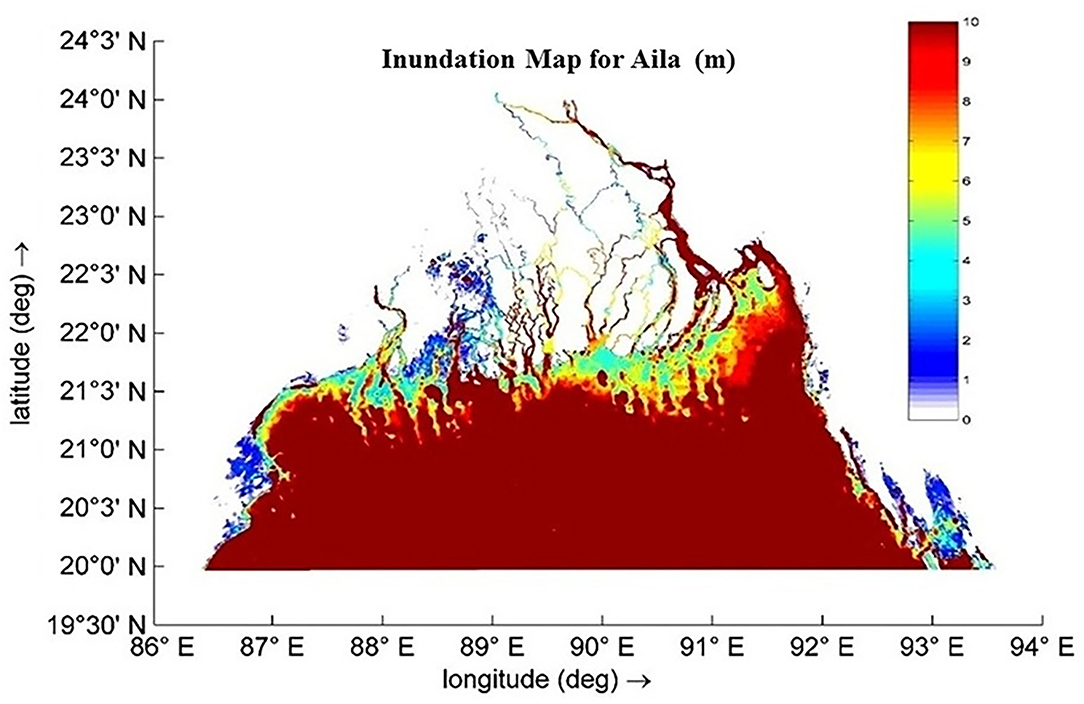
Figure 12. Simulated storm surge inundation due to cyclone Aila during landfall time.
Aila formed in the southern Bay of Bengal on May 22, 2009, intensified as a severe cyclonic storms, and passed through the west of Bangladesh with about 120 km per hour wind speed. Thus, it affected both the West Bengal in India and in the western coastal part of Bangladesh. The results found that Aila caused about 2.5 m flooding in the coastal districts near Sundarbans, while the simulated surge height along the coastline varied from 4.5 to 6 m.
Discussion: Application and Implication
The development of storm surge inundation model for the coastal region indicates that the model performance varies with a couple of important parameters such as the bed roughness or Manning's N in this case, cyclone track data source as well as wind drag coefficient values. For Bangladesh coasts, a set of spatially varying roughness values of different rivers and floodplain (0.015 for the Lower Meghna estuary, 0.021 for the rivers in the rest of the central coastal zone and western coastal zone, and from 0.02 to 0.00025 applied from the coast to the deep ocean) are selected to optimize the model performance. This also aligns well with model parameterization by recent studies (Tanim and Akter, 2019; Khan et al., 2021b) that applied 0.02 value for ocean with a higher depth and 0.01 value for the rivers. The land roughness values applied in this study slightly varied as these two studies applied the global data, whereas this study used the national dataset. Thus, future models can apply these data to compare and optimize the model performance and results to simulate more accurate inundation at the coastal areas of Bangladesh. Both of these past studies used JTWC for cyclone track which this study found more accurate than other global track data sources. However, the best track data from IMD showed better calibration and results than JTWC for computing the wind forces due to tropical cyclones. Varying wind drag coefficients such as 0.00063 for 0 ms−1 wind speed and 0.00723 for 30 ms−1 also optimized the model calibration. There are multiple ways to incorporate wind forcing in a storm surge model; however, using drag coefficient is a common practice in Delft3D (Azad et al., 2018; Tanim and Akter, 2019; Tanim and Goharian, 2021). To the best of our knowledge, none of the relevant studies from the past provided additional details on the wind drag values. Thus, the drag parameters from this study can provide an elementary basis for applying varying drag values to further improve the model performance with different wind forcings and sources. Also, due to the absence of measured maximum and spatial extent of land inundation, the study was unable to validate the modeled inundation. Previous studies such as Lewis et al. (2013) estimated a range of 4.3–6.2 m of surge height in the coastline for cyclone Rahman et al. (2011) suggested 1.9–6.68 m. Also, a modeling study by IWM (GoB, 2008) simulated a surge height of 5.5–6 and 3.5 m at the outfall of the Baleshwar River and at Hiron Point, respectively. Sarkar et al. (2013) found the maximum surge value of 4.20 and 3.85 m for the central and western coastal zone, respectively. The third national communication of climate change reported 3–5.5 m high storm surges for cyclone Sidr (MoEFCC, 2018). Thus, the simulated peak water levels at different river stations and maximum flood inundation (4.87 m; given in result section) are coherent with the previous study results. In addition, this study did not simulate the very recent cyclone events such as Amphan (2020) and Yaas in 2021. While both cyclones hit outside the coastal regions of Bangladesh, the estimated surge heights range from 2 to 5 m and 2 to 3 m for Amphan and Yaas, respectively (Khan et al., 2021b; Paul and Chowdhury, 2021). These estimated ranges are also within the range of the surge inundation height proposed in the inundation database. Thus, it also shows that the database in this study is able to cover a wide range of future cyclones in this region.
The proposed inundation database (Table 1) utilizes the existing and available national and global information with the simulated inundation data which can be extracted for generating union-level inundation information. This has multiple implication and future application for Bangladesh and countries with similar socioeconomic, natural, and environmental settings. First, the database provides necessary information to effectively design coastal infrastructure for climate adaptation and long-term coastal land use planning. Coastal polders are one of the major infrastructures in Bangladesh for protecting the communities from storm surge and coastal flooding. While construction of these polders in 1960s initially resulted in increased agricultural productivity, they later posed several environmental and social concerns related to prolonged waterlogging, reduced sedimentation in the low floodplain, and increased riverbed siltation in the poldered areas (Rezaie et al., 2013, 2019; Paszkowski et al., 2021). The polder design considers a conventional return period approach which does not address the risk and costing associated with storm surge, which can alter the required polder heights at places (Zaman and Mondal, 2020). A storm surge inundation database can, thus, provide relevant information to update and upgrade the design and construction of these coastal polders.
Second, the database can provide important local-level climatic information to communities and stakeholders from emergency management and agricultural sectors. The mortality rate due to tropical cyclones in Bangladesh has significantly reduced in the past few decades (Haque et al., 2012). For example, the casualty in 1970 and 1991 cyclones was ~0.3 and 0.1 million people which was about a couple of thousands for cyclones Sidr and Aila in 2007 and 2009, respectively. The latter two cyclones caused about an estimated 2,300 and 270 billion USD worth of economic losses (Dasgupta et al., 2010). A majority of the economic damages of cyclone Sidr were on the agriculture, housing, and construction sectors (Haque and Jahan, 2016). Thus, an inundation database with simulated information can provide essential services for reducing crop damage, enhancing agricultural production, and diversifying agricultural and cropping patterns in the coastal regions of Bangladesh. A recently developed hydrological modeling system is currently providing similar important services to the farmers in the flash flood-prone regions of Bangladesh (Biswas et al., 2020). Future research with high-resolution and discretized hydrodynamic modeling can offer advanced inundation information for the coastal communities in the country. Similarly, the inundation database will allow architects and construction communities to adapt their building design and locations for developing resilient infrastructure. In the South Asian countries, the National Meteorological and Hydrological Services (NMHSs) have also established South Asian Climate Outlook Forum (SASCOF) to offer improved climate information for long-term policy planning and implementation (Srinivasan et al., 2019).
Finally, the inundation database can be expanded with the help of citizen science or crowd source science which will allow communities and stakeholders to verify the modeled information with local observations and add on sectoral data and attributes to the database. Local information on estimated damage on flooding, agriculture, livelihood, and housing will not only strengthen the application of the database but also allow the scientific communities to improve and tailor their modeling results accordingly. Experts on climate modeling and services recently recommended stocktaking the needs for such information and applying transdisciplinary approach to link modeling with the communities (Hewitt et al., 2021). Local perception and knowledge of weather-related and climate disasters can also improve the design of climate services (Clifford et al., 2020). Thus, an advanced and dynamics inundation database can provide critical information on how tropical cyclones and their impacts are changing over time as well as incorporate local information for enhanced climatic information and services to the data-scarce regions.
Conclusion
Bangladesh's exposure and vulnerability to tropical cyclone and storm surge are well-known. The country has also taken multiple hard and soft measures such as coastal polders, plantations, multipurpose shelter, and improved emergency communication systems that significantly reduced the casualty from tropical cyclones. However, challenges still persist in minimizing the economic loss and damages as well as delineating the storm surge inundation information in the data-scarce coastal regions of Bangladesh. This study develops a storm surge model and inundation database using the available and simulated data for the past 31 tropical cyclones. The modeling approach shows that spatially varying land roughness parameterization and wind varying drag conditions provide better results in delineating the physical processes in surge propagation inside the land. The results also demonstrated that IMD track sources simulate higher reliability in modeling storm surge in the coastal regions of Bangladesh. Further improvement in high-resolution hydrodynamic time series, cyclone location and intensity, land use, and topographic data will upgrade the model performance. In addition, the study used a parametric wind model which may not accurately represent the actual wind forcing due to TCs. However, the wind model can be parameterized to reproduce the real cyclone accurately, in which the global wind source data may not reproduce. Thus, future research on improved parameterization and a combination of global wind data and parametric model can offer enhanced understanding and representation of TC-induced wind forcing in the Bay of Bengal. While the model forcing, parameterization, and performance can be improved with advancement of better quality and long-term observational dataset, the development of storm surge inundation database can provide essential climate services to data-scarce regions. Future research can also enhance the database by populating it with simulating more recent cyclone such as Amphan (2020) and Yaas (2021) and can be advanced with simulation of future TCs. Also, applying unstructured mesh can increase the chances of advanced discretization of the coastal features in Bangladesh. The inundation database suggests surge-induced maximum inundation can vary from 1 to 5 m in the coastal regions of Bangladesh with more than 70% of the past cyclones causing more than 2 m inundation. The results can provide necessary climatic and disaster data and information to communities and stakeholder for enhanced coastal zone management and climate services. The database can be advanced with further improvement high-resolution modeling approach and expanded with sectoral- and community-based information on loss and damage. Finally, this study strives to demonstrate that advancement in computational techniques will not only compliment the current emergency management system but also assist policymakers, executive organizations, and communities to make informed choices for taking effective measures to alleviate the storm surge-induced damages and adapt with the impacts of climate change in Bangladesh.
Data Availability Statement
The raw data supporting the conclusions of this article will be made available by the authors, without undue reservation.
Author Contributions
AR was involved in the conceptualization, design, data acquisition, model development, analysis, results, and manuscript draft preparation and revisions. AH contributed to the overall supervision, design, data acquisition, analysis, results, and manuscript revisions. All authors contributed to the article and approved the submitted version.
Conflict of Interest
The authors declare that the research was conducted in the absence of any commercial or financial relationships that could be construed as a potential conflict of interest.
Publisher's Note
All claims expressed in this article are solely those of the authors and do not necessarily represent those of their affiliated organizations, or those of the publisher, the editors and the reviewers. Any product that may be evaluated in this article, or claim that may be made by its manufacturer, is not guaranteed or endorsed by the publisher.
Acknowledgments
The authors acknowledge the research support from the ESPA Deltas project (Grant reference code: NEJ0027551). In addition, the authors express their sincere gratitude to the members of Delta modeling research team for their kind support in data collection and model development.
Supplementary Material
The Supplementary Material for this article can be found online at: https://www.frontiersin.org/articles/10.3389/frwa.2022.887631/full#supplementary-material
References
Ahsan, M. N., Khatun, A., Islam, M. S., Vink, K., Ohara, M., and Fakhruddin, B. S. H. M. (2020). Preferences for improved early warning services among coastal communities at risk in cyclone prone south-west region of Bangladesh. Prog. Disaster Sci. 5:100065. doi: 10.1016/j.pdisas.2020.100065
Ali, A. (1996). Vulnerability of bangladesh to climate change and sea level rise through tropical cyclones and storm surges. Water Air. Soil. Pollut. 92, 171–179. doi: 10.1007/BF00175563
Ali, A. (1999). Climate change impacts and adaptation assessment in Bangladesh. Clim. Res. 12, 109–116. doi: 10.3354/cr012109
Azad, A. S. M., Mita, K. S., Zaman, M. W., Akter, M., Asik, T. Z., Haque, A., et al. (2018). Impact of tidal phase on inundation and thrust force due to storm surge. J. Mar. Sci. Eng. 6:110. doi: 10.3390/jmse6040110
BBS. (2014). Population and Housing Census-2011. Bangladesh Bur. Stat. 2, 163–164. Available online at: http://www.bbs.gov.bd/site/page/47856ad0-7e1c-4aab-bd78-892733bc06eb/Population-and-Housing-Census
BISR (2009). I and Volume-I : Tsunami and Strom Surge Inundation of the Coastal Area of Bangladesh Volume-I : Tsunami and Strom Surge Inundation of the Coastal Area of Vol. 1. Dhaka.
Biswas, N. K., Hossain, F., Bonnema, M., Aminul Haque, A. M., Kumar Biswas, R., Bhuyan, A., et al. (2020). A computationally efficient flash flood early warning system for a mountainous and transboundary river basin in Bangladesh. J. Hydroinformatics 22, 1672–1692. doi: 10.2166/hydro.2020.202
Brammer, H. (2014). Bangladesh's dynamic coastal regions and sea-level rise. Clim. Risk Manag. 1, 51–62. doi: 10.1016/j.crm.2013.10.001
Brecht, H., Dasgupta, S., Laplante, B., Murray, S., and Wheeler, D. (2012). Sea-level rise and storm surges: high stakes for a small number of developing countries. J. Environ. Dev. 21, 120–138. doi: 10.1177/1070496511433601
Chang, T. Y., Chen, H., Hsiao, S. C., Wu, H. L., and Chen, W. B. (2021). Numerical analysis of the effect of binary typhoons on ocean surface waves in waters surrounding Taiwan. Front. Mar. Sci. 8:749185. doi: 10.3389/fmars.2021.749185
Clifford, K. R., Travis, W. R., and Nordgren, L. T. (2020). A climate knowledges approach to climate services. Clim. Serv. 18:100155. doi: 10.1016/j.cliser.2020.100155
Condon, A., and Veeramony, J. (2012). “Development and validation of a coastal surge and inundation prediction system,” in OCEANS. MTS/IEEE: Harnessing the Power of the Ocean (2012). p. 1–8. doi: 10.1109/OCEANS.2012.6404834
Cullmann, J., Dilley, M., Egerton, P., Fowler, J., Grasso, V. F., Honoré, C., et al. (2020). State of Climate Services. Geneva: World Meteorological Organization. Available online at: https://library.wmo.int/doc_num.php?explnum_id=10385
Das, P. K. (1972). Prediction model for storm surges in the Bay of Bengal. Nature 239, 211–213. doi: 10.1038/239211a0
Dasgupta, S., Huq, M., Khan, Z. H., Ahmed, M. M. Z., Mukherjee, N., Khan, M. F., et al. (2010). Vulnerability of Bangladesh to Cyclones in a Changing Climate: Potential Damages and Adaptation Cost. Policy Research working paper; no. WPS 5280. World Bank. Available online at: https://openknowledge.worldbank.org/handle/10986/3767
Dasgupta, S., Huq, M., Khan, Z. H., Ahmed, M. M. Z., Mukherjee, N., Khan, M. F., et al. (2014). Cyclones in a changing climate: the case of Bangladesh. Clim. Dev. 6, 96–110. doi: 10.1080/17565529.2013.868335
Dasgupta, S., Islam, M. S., Huq, M., Khan, Z. H., and Hasib, M. R. (2019). Quantifying the protective capacity of mangroves from storm surges in coastal Bangladesh. PLoS ONE. 14:e0214079. doi: 10.1371/journal.pone.0214079
Deb, M., and Ferreira, C. M. (2016). Simulation of cyclone-induced storm surges in the low-lying delta of Bangladesh using coupled hydrodynamic and wave model (SWAN + ADCIRC). J. Flood Risk Manag. 11, 750–765. doi: 10.1111/jfr3.12254
Debsarma, S. K. (2009). Simulations of storm surges in the Bay of Bengal. Mar. Geod. 32, 178–198. doi: 10.1080/01490410902869458
Debsarma, S. K., Rahman, M., and Nessa, F. F. (2014). “Simulation of cyclone 'aila-2009' by using wrf-arw model and numerical storm surge model,” in Monitoring and Prediction of Tropical Cyclones in the Indian Ocean and Climate Change, eds U. C. Mohanty, M. Mohapatra, O. P. Singh, B. K. Bandyopadhyay, and L. S. Rathore (Dordrecht: Springer). doi: 10.1007/978-94-007-7720-0_23
Deltares (2014b). Wind Enhance Scheme for Cyclone Modelling, User Manual. Available online at: https://content.oss.deltares.nl/delft3d/manuals/Delft3D-WES_User_Manual.pdf
Deltares. (2014a). Delft3D-FLOW User Manual. Deltares. Available online at: https://content.oss.deltares.nl/delft3d/manuals/Delft3D-FLOW_User_Manual.pdf
Dube, S. K. (1985). The numerical simulation of storm surges along the Bangladesh coast. Dyn. Atmospheres Oceans 9, 121–133. doi: 10.1016/0377-0265(85)90002-8
ESPA (2012). Assessing Health, Livelihoods, Ecosystem Services and Poverty Alleviation in Populous Deltas | Ecosystems Services for Poverty Alleviation (ESPA). (accessed February 17, 2022).
Flather, R. A. (1994). A storm surge prediction model for the Northern Bay of Bengal with application to the cyclone disaster in april 1991. J. Phys. Oceanogr. 24, 172–190. doi: 10.1175/1520-0485(1994)024<0172:ASSPMF>2.0.CO;2
Garratt, J. R. (1977). Review of drag coefficients over oceans and continents. Mon. Weather Rev. 105, 915–929. doi: 10.1175/1520-0493(1977)105<0915:RODCOO>2.0.CO;2
GoB. (2008). Cyclone Sidr in Bangladesh Damage, Loss and Needs Assessment For Disaster Recovery and Reconstruction. Dhaka: Government of Bangladesh assisted by International Development Community with Financial Support from the European Commission. Available online at: http://fpmu.gov.bd/agridrupal/content/damage-loss-and-needs-assessment-disaster-recovery-and-reconstruction
Hadi, T., Islam, M. S., Richter, D., and Fakhruddin, B. (2021). (SHM) Seeking Shelter: the factors that influence refuge since Cyclone Gorky in the Coastal Area of Bangladesh. Prog. Disaster Sci. 11:100179. doi: 10.1016/j.pdisas.2021.100179
Haque, A., and Jahan, S. (2016). Regional impact of Cyclone Sidr in Bangladesh: a multi-sector analysis. Int. J. Disaster Risk Sci. 7, 312–327. doi: 10.1007/s13753-016-0100-y
Haque, A., and Sumaiya Rahman, M. (2016). Flow distribution and sediment transport mechanism in the estuarine systems of Ganges- Brahmaputra-Meghna Delta. Int. J. Environ. Sci. Dev. 7, 22–30. doi: 10.7763/IJESD.2016.V7.735
Haque, U., Hashizume, M., Kolivras, K. N., Overgaard, H. J., Das, B., and Yamamoto, T. (2012). Reduced death rates from cyclones in Bangladesh: what more needs to be done? Bull. World Health Organ. 90, 150–156. doi: 10.2471/BLT.11.088302
Hewitt, C. D., Guglielmo, F., Joussaume, S., Bessembinder, J., Christel, I., Doblas-Reyes, F. J., et al. (2021). Recommendations for future research priorities for climate modeling and climate services. Bull. Am. Meteorol. Soc. 102, E578–E588. doi: 10.1175/BAMS-D-20-0103.1
Holland, G. (2008). A revised hurricane pressure-wind model. Mon. Weather Rev. 136, 3432–3445. doi: 10.1175/2008MWR2395.1
Holland, G. J. (1980). An analytical model of the wind and pressure profiles in hurricanes. Mon. Weather Rev. 108, 1212–1218. doi: 10.1175/1520-0493(1980)108<1212:AAMOTW>2.0.CO;2
Hsiao, S. C., Chen, H., Wu, H. L., Chen, W. B., Chang, C. H., Guo, W. D., et al. (2020). Numerical simulation of large wave heights from Super Typhoon Nepartak (2016) in the eastern waters of Taiwan. J. Mar. Sci. Eng. 8:217. doi: 10.3390/jmse8030217
Iftekhar, M. S., and Islam, M. R. (2004). Managing mangroves in Bangladesh: a strategy analysis. J. Coast Conserv. 10:139–146. doi: 10.1007/BF02818950
Jisan, M. A., Bao, S., and Pietrafesa, L. J. (2018). Ensemble projection of the sea level rise impact on storm surge and inundation at the coast of Bangladesh. Nat. Hazards Earth Syst. Sci. 18, 351–364. doi: 10.5194/nhess-18-351-2018
Johns, B., and Ali, M. A. (1980). The numerical modelling of storm surges in the Bay of Bengal. Q. J. R. Meteorol. Soc. 147, 2850–2873. doi: 10.1002/qj.49710644702
Karim, M. F., and Mimura, N. (2008). Impacts of climate change and sea-level rise on cyclonic storm surge floods in Bangladesh. Glob. Environ. Change 18, 490–500. doi: 10.1016/j.gloenvcha.2008.05.002
Khan, J. U., Durand, F., Emanuel, K., Krien, Y., Testut, L., and Islam, A. K. M. S. (2021a). Storm Surge Hazard Over Bengal Delta : A Probabilistic-Deterministic Modelling Approach. doi: 10.5194/nhess-2021-329
Khan, Md. J. U., Durand, F., Bertin, X., Testut, L., Krien, Y., Islam, A. K. M. S., et al. (2021b). Towards an efficient storm surge and inundation forecasting system over the Bengal delta: chasing the Supercyclone Amphan. Nat. Hazards Earth Syst. Sci. 21, 2523–2541. doi: 10.5194/nhess-21-2523-2021
Kim, K. O., Yamashita, T., and Choi, B. H. (2008). Coupled process-based cyclone surge simulation for the Bay of Bengal. Ocean Model. 25, 132–143. doi: 10.1016/j.ocemod.2008.07.001
Kurian, N. P., Nirupama, N., Baba, M., and Thomas, K. V. (2009). Coastal flooding due to synoptic scale, meso-scale and remote forcings. Nat. Hazards 48, 259–273. doi: 10.1007/s11069-008-9260-4
Lewis, M., Bates, P., Horsburgh, K., Neal, J., and Schumann, G. (2013). A storm surge inundation model of the northern Bay of Bengal using publicly available data. Q. J. R. Meteorol. Soc. 139, 358–369. doi: 10.1002/qj.2040
Madsen, H., and Jakobsen, F. (2004). Cyclone induced storm surge and flood forecasting in the northern Bay of Bengal. Coast Eng. 51, 277–296. doi: 10.1016/j.coastaleng.2004.03.001
Mamnun, N., Bricheno, L. M., and Rashed-Un-Nabi, M. (2020). Forcing ocean model with atmospheric model outputs to simulate storm surge in the Bangladesh coast. Trop. Cyclone Res. Rev. 9, 117–134. doi: 10.1016/j.tcrr.2020.04.002
Mashriqui, H. S., Kemp, G. P., Van Heerden, I., Westerink, J., Yang, Y. S., and Ropers-Huilman, B. D. (2006). Experimental storm surge forecasting in the Bay of Bengal. WIT Trans. Ecol. Environ. 88, 397–406. doi: 10.2495/CENV060381
Matin, N., Ahtesham Hossain Raju, K. M., and Ataur Rahman, M. (2020). Analysis of wave characteristics along the Coast of Bangladesh using a coupled wave-hydrodynamic Delft3D model of the Bay of Bengal. IOP Conf. Ser. Earth Environ. Sci. 527:012013. doi: 10.1088/1755-1315/527/1/012013
Matsumoto, K., Takanezawa, T., and Ooe, M. (2000). Ocean tide models developed by assimilating TOPEX/POSEIDON altimeter data into hydrodynamical model: a global model and a regional model around Japan. J. Oceanogr.56, 567–581. doi: 10.1023/A:1011157212596
MoEFCC. (2018). Third National Communication of Bangladesh to the United Nations Framework Convention on Climate Change. Available online at: http://unfccc.int/resource/docs/natc/yemnc2.pdf
Murty, T. S., Flather, R. A., and Henry, R. F. (1986). The storm surge problem in the bay of Bengal. Prog Oceanogr. 16, 195–233. doi: 10.1016/0079-6611(86)90039-X
Needham, H., and Keim, B. D. (2011). Storm Surge: Physical Processes and an Impact Scale. Recent Hurricane Research-Climate, Dynamics, and Societal Impacts. IntechOpen. Available online at: https://www.intechopen.com/download/pdf/15338
Paszkowski, A., Goodbred, S., Borgomeo, E., Khan, M. S. A., and Hall, J. W. (2021). Geomorphic change in the Ganges–Brahmaputra–Meghna delta. Nat. Rev. Earth Environ. 2, 763–780. doi: 10.1038/s43017-021-00213-4
Paul, S., and Chowdhury, S. (2021). Investigation of the character and impact of tropical cyclone Yaas: a study over coastal districts of West Bengal, India. Saf. Extreme Environ. 3, 219–235. doi: 10.1007/s42797-021-00044-y
Peng, S., and Li, Y. (2015). A parabolic model of drag coefficient for storm surge simulation in the South China Sea. Sci. Rep. 5:15496. doi: 10.1038/srep15496
Peng, S., Li, Y., and Xie, L. (2013). Adjusting the wind stress drag coefficient in storm surge forecasting using an adjoint technique. J. Atmos. Ocean Technol. 30, 590–608. doi: 10.1175/JTECH-D-12-00034.1
Rahman, M. M., Paul, G. C., and Hoque, A. (2011). A cyclone induced storm surge forecasting model for the coast of bangladesh with application to the cyclone sidr'. Int. J. Math. Modell. Comput. 1, 77–86. Available online at: https://www.sid.ir/en/journal/ViewPaper.aspx?id=227777
Rao, Y. R., Chittibabu, P., Dube, S. K., Rao, A. D., and Sinha, P. C. (1997). Storm surge prediction and frequency analysis for Andhra coast of India. MAUSAM. 48, 555–566. doi: 10.54302/mausam.v48i4.4322
Rezaie, A. M., Ferreira, C. M., and Rahman, M. R. (2019). Storm surge and sea level rise: Threat to the coastal areas of Bangladesh. In: Maggioni V, and Massari C. editor. Extreme Hydroclimatic Events and Multivariate Hazards in a Changing Environment. Elsevier Inc. p. 317–42. doi: 10.1016/B978-0-12-814899-0.00013-4
Rezaie, A. M., Islam, T., and Rouf, T. (2013). “Limitations of institutional management and socio-economic barriers of Tidal River Management, a seminatural process to save bhabodaho from water-logging problem,” in Advances in River Sediment Research, eds S. Fukuoka, H. Nakagawa, T. Sumi, and H. Zhang (London: Taylor & Francis Group), 2173–2183.
Rezaie, A. M., Sumaiya, S., Alam, S., Ahmed, I., Ahmed. M. H Kadir, M. N., et al. (2014). Computation of discharge and flow volume for different flooding scenario in the lower meghna estuary, in Proceedings of the 2nd International Conference on Civil Engineering for Sustainable Development (Khulna), 14–16. Available online at: http://www2.kuet.ac.bd/iccesd2014/proceedings/
Sakib, M., Nihal, F., Haque, A., Rahman, M., and Ali, M. (2015). Sundarban as a buffer against storm surge flooding. World J. Eng. Technol. 3, 59–64. doi: 10.4236/wjet.2015.33C009
Sao, N. T. (2008). Storm surge predictions for Vietnam coast by Delft3D model using results from RAMS model. J. Water Resour. Environ. Eng. 6, 39–47. Available online at: https://citeseerx.ist.psu.edu/viewdoc/download?doi=10.1.1.538.1971&rep=rep1&type=pdf
Sarkar, N. C., Islam, A., and Debsarma, S. K. (2013). A numerical simulation of severe cyclone Sidr-2007. GANIT J. Bangladesh Math. Soc. 32, 43–54. doi: 10.3329/ganit.v32i0.13645
Smith, S. D., and Banke, E. G. (1975). Variation of the surface drag coefficient with wind speed. Q. J. R. Meteorol. Soc. 101, 665–673. doi: 10.1002/qj.49710142920
Srinivasan, G., Anshul, A., and Mitesh, S. (2019). Enhancing climate services in South Asia. Mausam 70, 725–730. doi: 10.54302/mausam.v70i4.213
Tanim, A. H., and Akter, A. (2019). Storm-surge modelling for cyclone Mora in the northern Bay of Bengal. Proc. Inst. Civ. Eng. Marit. Eng. 172, 73–94. doi: 10.1680/jmaen.2019.1
Tanim, A. H., and Goharian, E. (2021). Developing a hybrid modeling and multivariate analysis framework for storm surge and runoff interactions in urban coastal flooding. J. Hydrol. 595:125670. doi: 10.1016/j.jhydrol.2020.125670
Van Ormondt, M., Nederhoff, K., and Van Dongeren, A. (2020). Delft dashboard: a quick set-up tool for hydrodynamic models. J. Hydroinformat. 22, 510–527. doi: 10.2166/hydro.2020.092
Vatvani, D., Zweers, N. C., Van Ormondt, M., Smale, A. J., De Vries, H., and Makin, V. K. (2012). Storm surge and wave simulations in the Gulf of Mexico using a consistent drag relation for atmospheric and storm surge models. Nat. Hazards Earth Syst. Sci. 12, 2399–2410. doi: 10.5194/nhess-12-2399-2012
Weatherall, P., Marks, K. M., Jakobsson, M., Schmitt, T., Tani, S., Arndt, J. -E., et al. (2015). A new digital bathymetric model of the world's oceans. Eath Space Sci. 8, 331–345. doi: 10.1002/2015EA000107
WMO (2022). World's Deadliest Tropical Cyclone Was 50 Years Ago | World Meteorological Organization. Available online at: https://public.wmo.int/en/media/news/world's-deadliest-tropical-cyclone-was-50-years-ago (accessed February 17, 2022).
Wu, J. (1982). Wind-stress over sea surface from breeze to hurricane. J. Geophys. Res. 87, 9704–9706. doi: 10.1029/JC087iC12p09704
Yu, Y. C., Chen, H., Shih, H. J., Chang, C. H., Hsiao, S. C., Chen, W. B., et al. (2019). Assessing the potential highest storm tide hazard in Taiwan based on 40-year historical typhoon surge hindcasting. Atmosphere 10:346. doi: 10.3390/atmos10060346
Zaman, S., and Mondal, M. S. (2020). Risk-based determination of polder height against storm surge Hazard in the south-west coastal area of Bangladesh. Prog. Disaster Sci. 8:100131. doi: 10.1016/j.pdisas.2020.100131
Keywords: storm surge, coastal modeling, inundation database, Bangladesh, climate services, Delft3D
Citation: Rezaie AM and Haque A (2022) Development of Storm Surge Inundation Model and Database for Enhanced Climate Services in Bangladesh. Front. Water 4:887631. doi: 10.3389/frwa.2022.887631
Received: 01 March 2022; Accepted: 06 June 2022;
Published: 04 July 2022.
Edited by:
Poulomi Ganguli, Indian Institute of Technology Kharagpur, IndiaReviewed by:
Wen-Cheng Liu, National United University, TaiwanWei-Bo Chen, National Science and Technology Center for Disaster Reduction (NCDR), Taiwan
Copyright © 2022 Rezaie and Haque. This is an open-access article distributed under the terms of the Creative Commons Attribution License (CC BY). The use, distribution or reproduction in other forums is permitted, provided the original author(s) and the copyright owner(s) are credited and that the original publication in this journal is cited, in accordance with accepted academic practice. No use, distribution or reproduction is permitted which does not comply with these terms.
*Correspondence: Ali Mohammad Rezaie, cmV6YWllMDZidWV0QGdtYWlsLmNvbQ==