 Ritusmita Goswami
 Nikita Neog
 Ritu Thakur2†
- 1Centre for Ecology, Environment and Sustainable Development, Tata Institute of Social Sciences, Guwahati, India
- 2North Eastern Regional Institute of Water and Land Management, Tezpur, India
In recent times, the contamination of groundwater in the north-eastern states of India has become a reason for concern. The lack of appropriate irrigation water management hinders the practice of sustainable agriculture. Hence, it is vital to understand the groundwater quality for the proper planning and management of groundwater resources to ascertain its use for drinking and irrigation purposes. This study was conducted in the districts of Biswanath Chariali and Sonitpur, Assam, India, to evaluate the groundwater quality and its suitability for irrigation and drinking purpose. Fifty-six water samples were collected from various sources across the two districts and analyzed for general physicochemical parameters and heavy metals namely arsenic (As) and iron (Fe). Groundwater suitability was evaluated by comparing the results of the physicochemical analysis with Indian Standards, and the results revealed the mean concentrations of the cations were observed in the order Na+>Ca2+>Mg2+>K+ whereas the anions in the order of Cl−>. Furthermore, several parameters were considered for assessing the groundwater suitability for irrigation namely sodium adsorption ratio (SAR), sodium percentage (Na%), magnesium adsorption ratio (MAR), permeability index (PI), and Kelly's index (KI). All parameters suggested the water to be suitable for irrigation except for MAR values which implied unsuitability. Moreover, high Fe and As were detected with 95 and 25% of the total, respectively, exceeding the WHO permissible limit for drinking water. The highest concentration of As (0.08 mgL−1) was observed in Tewaripal, Biswanath Chariali, and Fe (32.20 mgL−1) in Gereki, Biswanath Chariali. Gibbs plot discerned the aquifers' underlying hydrogeochemical processes such as silicate, carbonate, ion exchange, and reverse ion exchange processes predominated the region. A significant positive correlation was observed between As and which may indicate a common source of origin for both and maybe pinpoint the contribution of anthropogenic activities toward As enrichment. Overall, the study revealed that although the groundwater is apt for irrigation in regard to SAR, Na%, MAR, PI, and KI, however, As and Fe concentrations suggest otherwise. The outcome of the study may be helpful to the farmers, and policymakers in planning and management of the groundwater resources.
Introduction
Water scarcity and sustainable irrigation water management have been identified as global challenges for the development of sustainable agriculture to meet global food requirements (Movilla-Pateiro et al., 2020). Water naturally contains dissolved salts (Abdel-Fattah et al., 2020; Allen and MacAdam, 2020), but the concentration and properties of these salts are dependent on the source of water and its chemical composition. In recent years, the concern and awareness for irrigation water quality have elevated and novel advances have been fostered for the sustainable management of resources (Shirmohammadi et al., 2020).
Groundwater is the primary source of water in the north-eastern states of India, accounting for 88% of clean drinking water, particularly in rural areas with a large population (Jain et al., 2010). Rapid withdrawal of groundwater has been observed in recent years to meet the increasing demand for potable water and irrigation water (Arslan, 2017; Jain and Vaid, 2018; Abdel-Fattah et al., 2020). Because mineral elements have a direct impact on soil and plants, the suitability of groundwater for irrigation is determined by its properties and concentrations (Singh et al., 2009; Rawat et al., 2018; Abdel-Fattah et al., 2020). Excessive salts inhibit plant growth by interfering with their absorbing process (Rawat et al., 2018). Moreover, human health and socioeconomic development are severely threatened by the contamination of groundwater; thereby, it is vital to investigate and understand the hydrochemical characteristics and groundwater quality for sustainable planning and management of the groundwater resources to ensure its safe use for drinking, irrigation, and domestic and industrial purposes (Jain and Vaid, 2018).
Arsenic (As) and iron (Fe) poisoning of groundwater has been observed in several districts of Assam, raising concerns about the potential health effects of exposure and As toxicity to residents (Kumar et al., 2016a; Patel et al., 2019; Goswami et al., 2020, 2022). The districts of Jorhat, Lakhimpur, Nalbari, and Nagaon in Assam have reported the highest concentration of As (Singh, 2004; Kumar et al., 2017; Patel et al., 2019; Goswami et al., 2020, 2022). Groundwater samples from Nagaon, Kamrup Metropolitan (M), and West Karbi Anglong districts revealed high fluoride (F−) concentrations (Gogoi et al., 2021). Goswami et al. (2020) reported severe non-carcinogenic health effects and potential risk of a carcinogenic effect on adults and children due to As and Fe exposure through drinking water in Majuli, Assam. Significantly high concentrations of As in the Diphu and Lakhimpur districts of Assam have also been reported (Kumar et al., 2016a; Patel et al., 2019). Hence, it is essential to monitor the As contamination in the groundwaters of Biswanath Chariali and Sonitpur districts to investigate the extent of exposure in these regions. High As concentrations reported from the neighboring areas highlighted the spatial variability of As concentration. Monitoring the groundwater will help us to track current and emerging issues to ascertain compliance with drinking water regulations and irrigation standards and also detect any alterations in trends occurring in aquifers over a long period. Moreover, it plays a significant role for researchers and scientists in predicting and investigating the aquifer characteristics and determining its impact on human health.
This study was carried out in Assam's Biswanath Chariali and Sonitpur districts to assess groundwater quality and suitability for irrigation and drinking, as the region is exclusively dedicated to tea cultivation, which involves the use of fertilizers, that could pose a serious threat to water quality. The region's economy is primarily agrarian, with the bulk of the inhabitants reliant on income from agriculture and allied sectors, either directly or indirectly (District Irrigation Plan). The total geographical area of the districts is 5,32,400 ha, and the gross cropped area is 2,51,719 ha (District Irrigation Plan). Three varieties of seasonal paddy are cultivated namely Ahu (autumn rice), Sali (winter rice), and Boro (summer rice). Tea, bananas, areca nuts, jute, coconut, pineapple, potato, sugarcane, and mustard are also widely grown crops. Although paddy agriculture in the region is primarily dependent on rainfall, the State Irrigation and Agricultural Departments have made shallow tube wells available to farmers to encourage them to utilize groundwater resources. Assam's Irrigation Department is in charge of putting various irrigation programs into action (Central Ground Water Board, 2013). The region's gross irrigated area is estimated to be 74,174 ha (District Irrigation Plan). Although irrigation's full potential has yet to be realized, irrigation practices have improved and are being adopted, making it critical to evaluate the quality of irrigation water in the region.
The goal of this study was to (i) assess the physicochemical properties of groundwater and determine the groundwater drinking quality in the Biswanath Chariali and Sonitpur areas and (ii) assess the irrigation suitability of groundwater using various irrigation indices such as sodium adsorption ratio (SAR), percentage sodium (Na %), Kelly's index (KI), permeability index (PI), and magnesium adsorption ratio (MAR). The findings of this study will reveal the level of As contamination and exposure in groundwater for people of Biswanath Chariali and Sonitpur districts, highlighting potential health hazards, and contributing to more sustainable water resource management.
Physiography and geology of the study area
The districts of Sonitpur and Biswanath Chariali are located in the agro-climatic zone in the central part of Assam bounded by Arunachal Pradesh on the north, Darrang district on the west, and Lakhimpur district on the east. To the south of these two districts stands the Brahmaputra River flowing east-west direction. With an area of 1415.185 sq. km, the Biswanath district is located between the 23°30′ N and 27°01′ N latitudes and 92°16′E and 93°43′E longitudes. Meanwhile, the Sonitpur district lies on 26°51′ N and 92°51′ E covering an area of 2,077 sq. km. (Central Ground Water Board, 2013). Physiographically, the entire region can be divided into three major groups viz., the hilly tract, the foothill area, and the extensive Brahmaputra floodplains. The hilly tracts are comprised of the Siwalik sediments of the Lesser Himalayas; meanwhile, the foothill region is characterized by older terrace deposits. The alluvial floodplain consists of younger and old alluvial deposits. The younger alluvial soils are inundated during occasional floods, consequently receiving considerable silt deposits. The river Brahmaputra governs the main drainage system of both districts (Central Ground Water Board, 2013).
Materials and methods
Sampling and analysis
The water samples were collected from 56 sampling sites in clean polypropylene bottles from Sonitpur and Biswanath Chariali districts, in the central Brahmaputra floodplain region, Assam, India (Figures 1, 2). The water samples collected were from sources used for drinking and irrigation requirements to evaluate their quality concerning their application in irrigation and for drinking. The Global Positioning System (GPS) was used for recording the coordinates of the sampling sites. Physicochemical parameters [electrical conductivity (EC), dissolved oxygen (DO), pH, turbidity, salinity, and total dissolved solids (TDS)] were determined in the field using the multiparameter probe (Systronics). The bottles were sealed airtight and stored following the APHA (2012) protocols. Various parameters such as total alkalinity (TA), total hardness (TH), chloride (Cl−), sulfate (), phosphate (), bicarbonate (), calcium (Ca2+), magnesium (Mg2+), sodium (Na+), potassium (K+), F−, Fe, inorganic arsenic (iAs) along with calculation of irrigation water quality indices like sodium percentage (Na%), sodium absorption ratio (SAR), permeability index (PI), Kelly's index (KI), magnesium adsorption ratio (MAR), and Irrigation Water Quality Index (IWQI) were calculated to assess the suitability of water for irrigation. Spectrophotometric methods were used to estimate Cl−, F−, , and content, and titrimetric methods were used to determine TA, TH, and . Na+ and K+ were estimated using the flame photometer. Ca2+ and Mg2+ were determined through the atomic absorption spectrophotometry method. As and Fe were estimated through atomic absorption spectroscopy (AAS) (Thermo scientific ICE 3000) with hollow cathode lamps (iCE™ 3000 Series) implementing Atomic Spectroscopy Standards for As and Fe estimation. Determination of various irrigation water quality parameters was done as follows.

Figure 1. Map of the study region indicating the sampling sites.
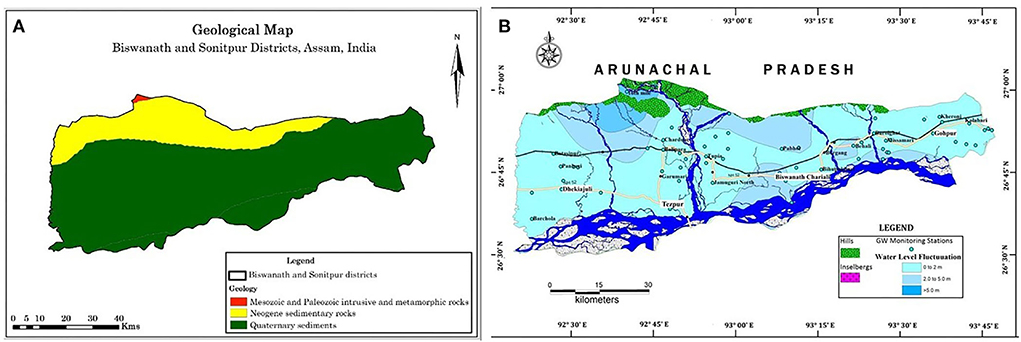
Figure 2. (A) Geological map and (B) Water level contour map of the Biswanath and Sonitpur districts, Assam.
Investigating groundwater quality for irrigation
The concentration of dissolved constituents in water determines the water quality, and its suitability for agriculture is termed irrigation water quality. Good irrigation water quality and adequate water management practices along with good soil can maximize the yield.
The GW suitability for irrigation was assessed based on nine irrigation water quality parameters like sodium adsorption ratio (SAR), percentage sodium (Na%), Kelly's index (KI), permeability index (PI), and magnesium adsorption ratio (MAR).
Sodium hazard represented as SAR was calculated as follows (Richard, 1954):
where Na+, Ca2+, and Mg2+ are expressed in meqL−1.
Na% is calculated using the given formula and expressed in meqL−1 (Eaton, 1950):
KI was estimated by the following equation (Kelly, 1940):
The ions are expressed in meqL−1.
Doneen (1964) forwarded the formula for computing permeability index (PI):
MAR was calculated using the equation:
The concentrations of ions are expressed in meqL−1.
The parameters EC, SAR, Na+, Cl−, and are considered for unweighted arithmetic water quality index (WQIUA) calculation to evaluate groundwater irrigation suitability and are estimated using Equations (8) and (9) (Farrag, 2005; El Tahlawi et al., 2016):
where qi is the quality rating for ith parameter, Vi is the observed value for ith parameter, and Si is the water quality standard value.
where n is the number of parameters.
Multivariate statistical analysis
SPSS (21) was used for the multivariate statistical analysis to investigate and interpret the data sets. The physicochemical parameters were used to obtain Pearson's correlation matrix and identify the association among the various parameters and determine the control of the water ion chemistry. The dataset dimensionality is reduced using the principal component analysis (PCA) and hierarchical agglomerative cluster analysis (HCA) and helps characterize the variance of a substantial set of inter-related variables (Kumar et al., 2017). PCA helps to identify the probable causes of pollution and the factors influencing them. The normalized data were applied with Ward's linkage method in HCA, and a dendrogram was obtained (Kumar et al., 2017; Elsayed et al., 2020). Piper and Gibbs plots were implemented to evaluate the groundwater hydrogeochemical evolution of the study area. The piper trilinear diagram illustrates the hydrogeochemical facies of the aquifer system (Piper, 1944). The diamond-shaped central region of the diagram displays the groundwater classification, and the major cations (Ca2+, Mg2+, Na+, and K+) and anions (, , Cl−, and ) are expressed as a percent of meqL−1 and plotted in the two basal triangles. Similar water samples will be inclined toward the same group (Todd, 1980; Saha et al., 2019). The Gibbs plot sheds early insight into the governing hydrogeochemical processes of the study area (Gibbs, 1970).
Results and discussion
Physicochemical parameters and major ion chemistry
The electrical conductivity (EC) represents the conductivity of water, and the total dissolved species is represented by TDS. The results of EC and TDS varied from 105 to 980 μScm−1 and 56 to 934 mgL−1 having average values of 540.96 μScm−1 and 216.22 mgL−1, respectively. TDS values for 96% of samples were found within the acceptable limit of 500 mgL−1. Consuming water with TDS values >500 mgL−1 can cause gastrointestinal irritation (BIS, 2012). In natural aquifer systems, dissolved oxygen (DO) is a significant parameter that determines the health of the system. DO ranges between 2.00 and 3.30 mgL−1.
The chemical analysis revealed that the mean concentrations (mgL−1) of major cations varied in the order Na+>Ca2+>Mg2+>K+, and for anions, the order was Cl−> (Table 1). The Na+, K+, Ca2+, and Mg2+ were present in the range of 17.40–62.30 mgL−1, 0.10–45.00 mgL−1, 11.37–32.22 mgL−1, and 2.10–17.40 mgL−1, respectively. The most abundant alkali metal is observed to be Na+, and sources like the weathering of halite and silicate minerals may contribute to it. However, by-products of agricultural activities may increase the sodium concentration of the groundwater (Saha et al., 2019). Content of Na+>K+ because the rate of Na+ dissolution is much higher than that of K+. The use of potassium-based fertilizers and the decomposition of animal or waste products are considered potential sources of K+ (Saha et al., 2019). Ca2+ was observed as the most abundant alkaline earth metal, and Mg2+ can be derived from sources such as the weathering of dolomite and ferromagnesium minerals (Saha et al., 2019). All samples were well within the permissible limit of WHO for drinking and irrigation concerning Na+, K+, Ca2+, and Mg2+.
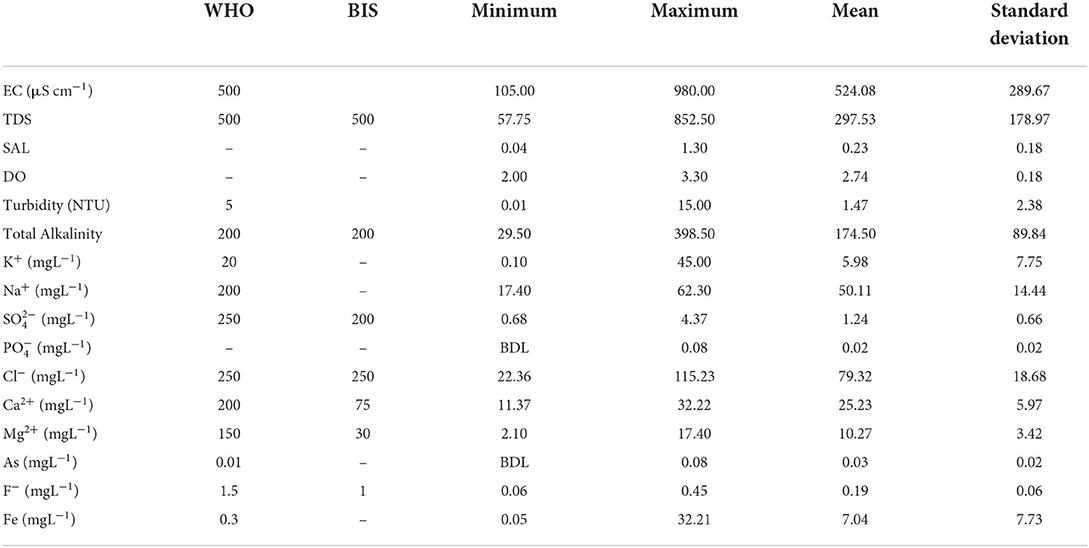
Table 1. Representing physicochemical parameters in comparison to permissible limits set by World Health Organization (WHO) and Bureau of Indian Standards (BIS).
Cl− in the groundwater can be derived from rocks, seawater intrusion, or pollution by domestic sewage and industrial waste. Lower Cl− content represents low salinity in the groundwater of the region (Saha et al., 2019). The organic matter present in the water system oxidizes to produce carbon dioxide facilitating mineral dissolution and contributing to enrichment (Khashogji and El Maghraby, 2013). Weathering of silicate minerals also contributes to enhancement (Gastmans et al., 2010; Saha et al., 2019). The groundwater is enriched with Ca2+, Mg2+, and ions due to weathering activities. was observed between 35.98 and 485.98 mgL−1 and Cl− between 22.36 and 115.23 mgL−1, respectively. Cl− results were observed within the WHO permissible limit for drinking purposes. Cl− was observed as a principal contributor of TDS and EC enrichment in the aquifer system. was observed in the range of 0.67–4.36 mgL−1 and well within the WHO and BIS permissible limits for drinking and irrigation. However, 48% samples exceeded the WHO permissible limit for . values ranged between BDL-0.08 mgL−1 (average- 0.01 mgL−1), and all samples were well within the permissible limit of WHO for for drinking and irrigation.
F−, naturally occurring in the earth's crust, has a remarkable effect on human physiology (Lanjwani et al., 2021). F− is essential for developing dental health; however, higher concentrations will result in toxic effects such as dental and skeletal fluorosis [(World Health Organization (WHO)., 2017; Gogoi et al., 2021)]. F− values ranged between 0.06 and 0.44 mgL−1 with an average value of 0.19 mgL−1 indicating the groundwater is safe for drinking and irrigation concerning F− concentrations.
However, Fe values were observed to be significantly high ranging from 0.05 to 32.20 mgL−1 with an average value of 7.04 mgL−1. About 95% (n = 53) samples surpassed the WHO permissible limit of Fe in drinking water, thereby raising concerns for the region. Although Fe is an essential element for living cells, its long-term exposure can result in toxicological concerns (Goswami et al., 2020). High levels of Fe cannot be disposed by the body and can cause severe damage to the internal organs (Chaturvedi et al., 2014; Goswami et al., 2020).
As values ranged between BDL-0.08 mgL−1 (average-0.03 mgL−1) which indicates As contamination of the groundwaters in the region. Consuming unsafe amounts of As on a regular basis may lead to chronic As poisoning eventually resulting in carcinogenic risks, hyperkeratosis, cardiovascular diseases, birth effects, diabetes, and neurotoxicity (Flanagan et al., 2012; Kumar et al., 2017; Goswami et al., 2020, 2022; Shaji et al., 2021). The potential of As as a threat to human health is intense in highly populated regions primarily dependent on the groundwater as the chief drinking water source and for use in irrigation (Gillispie et al., 2015; Goswami et al., 2020). Food and Agriculture Organization (FAO) recommended 0.10 mgL−1 as the maximum arsenic concentration for irrigation assuming the rate of water application to be 10,000 m3, following adequate irrigation practices. However, if the rate of water application largely surpasses 10,000 m3, then the permissible limit reduces. The existence of Archean and gneissic rocks in the region (Central Ground Water Board, 2013) may be a significant contributor to its rich mineralogical composition. The shallow aquifers of the Holocene epoch in the Brahmaputra floodplains are enriched with high As contents as reported by several researchers (Goswami et al., 2014; Shah, 2015; Kumar et al., 2016a,b; Patel et al., 2019). As concentrations >10μgL−1 were also reported in most of the shallow tube well waters of Bangladesh (Zhao et al., 2010). This may be due to the re-depositional and sediment mixing during high-flow duration of the Brahmaputra River (Goswami et al., 2020). Using the contaminated water for irrigation purposes may result in As accumulation in the agricultural soils, gradually affecting the growth and yield of the crops and causing adverse health effects on humans on the consumption of As-contaminated food (Brammer and Ravenscroft, 2009; Gillispie et al., 2015; Goswami et al., 2020). Moreover, even if the source of the contaminated water that is consumed is the same, still As bioaccumulation in the residents of the same region may vary. The contamination level is also reliant on the storage methods of the water for domestic use. Storage in earthen pots reduces the As content by facilitating As oxidation and precipitation (Goswami et al., 2020).
Hydrochemical facies
The hydrochemical facies of the groundwater is interpreted by implementing the Piper diagram (Piper, 1944). Samples having similar qualities tend to fall under the same group (Ramesh et al., 2014; Saha et al., 2019). Two triangles represent the major cations and anions, and a diamond-shaped plot represents the combination of both. The latter helps to interpret and classify the hydrogeochemical characteristics of the groundwater (Shil et al., 2019). Figure 3 indicates the water of the study area belonged to the mixed type of waters namely Ca2+-Na+- and Ca2+-Mg2+-. The dominant cation is observed to be Na+, and the plot suggests higher content of Ca2+ is being exchanged with Na+ than Mg2+. is the major anion represented by the diagram which can be attributed to the presence of calcite, dolomite, rhyolite, and basalt minerals.
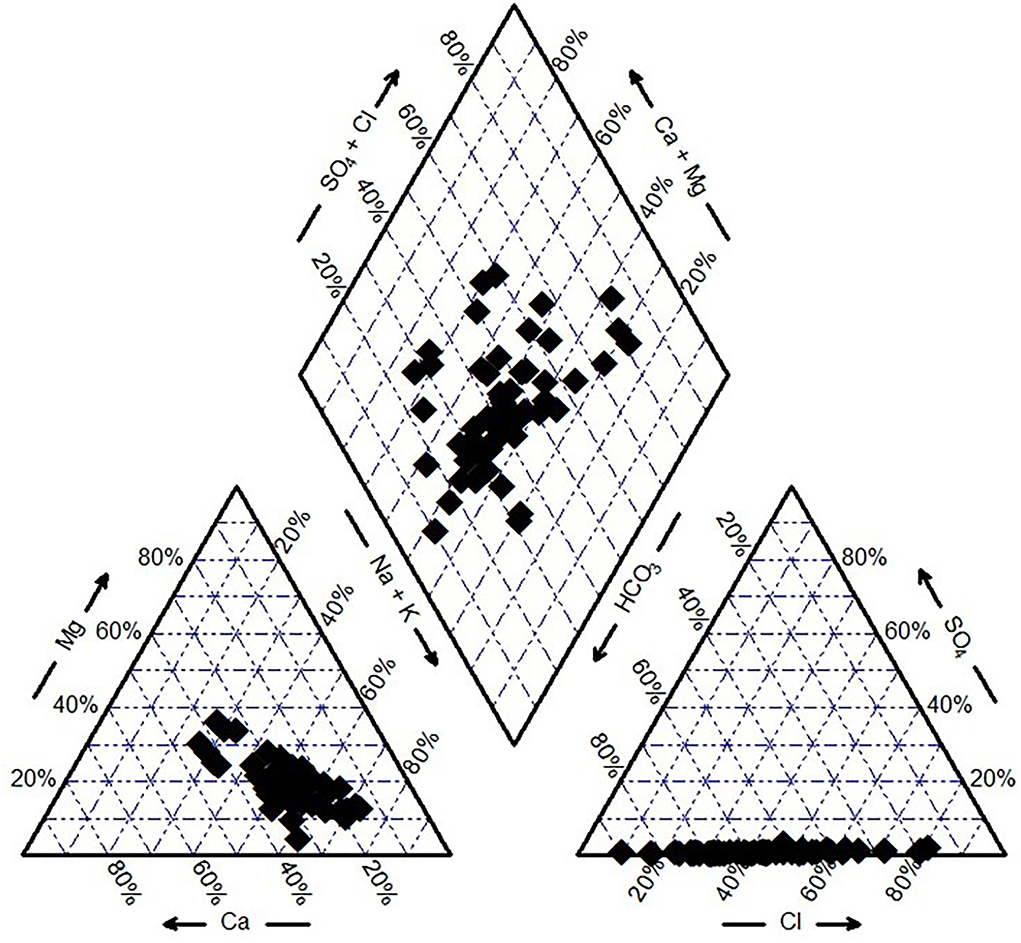
Figure 3. Piper diagram delineating the hydro-chemical facies of the study area.
Source-rock deduction
Gibbs diagram helps in the assessment of the source of ions in the groundwater by evaluating the ratio among the cations and anions and TDS. The Gibbs ratio is estimated by the following equations:
The distribution of the cations and anions and TDS in the diagram was used to interpret rock–water interaction, evaporation, and precipitation dominance (Lanjwani et al., 2021). Figure 4 indicates the dominance of rock–water interactions pinpointing that rock geochemistry was the principal source in the groundwater of the region. The abundance of the varied dissolved ions in the groundwater relies on their abundance in the parent rock and their rate of solubility (Saha et al., 2019).
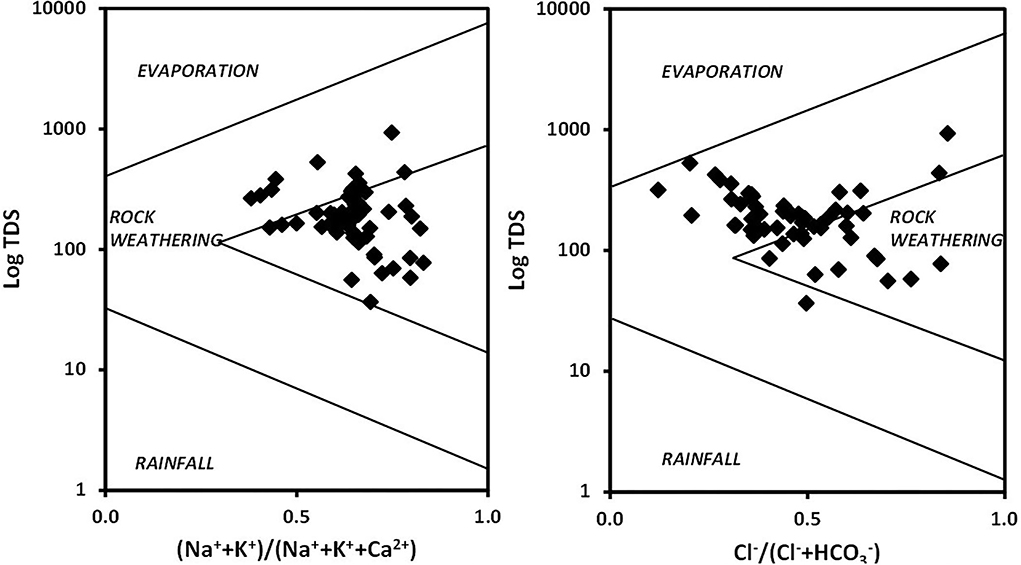
Figure 4. Gibbs' diagram pinpointing the principal mechanism dominating groundwater chemistry.
vs. Na+ was plotted to investigate the weathering processes. Samples on the left of the equiline represent carbonate weathering and, on the right, represent silicate weathering (Lanjwani et al., 2021). Figure 5A shows that the samples were dispersed on both sides of the equiline indicating the prevalence of carbonate and silicate weathering promoting the release of and Na+. The Ca2+ vs. (Figure 5B) indicates a majority of samples on the left of the equiline represent the dominance of silicate weathering (carbonic acid weathering) over carbonate weathering. Samples plotted along the trendline indicate calcite dissolution (Lanjwani et al., 2021).
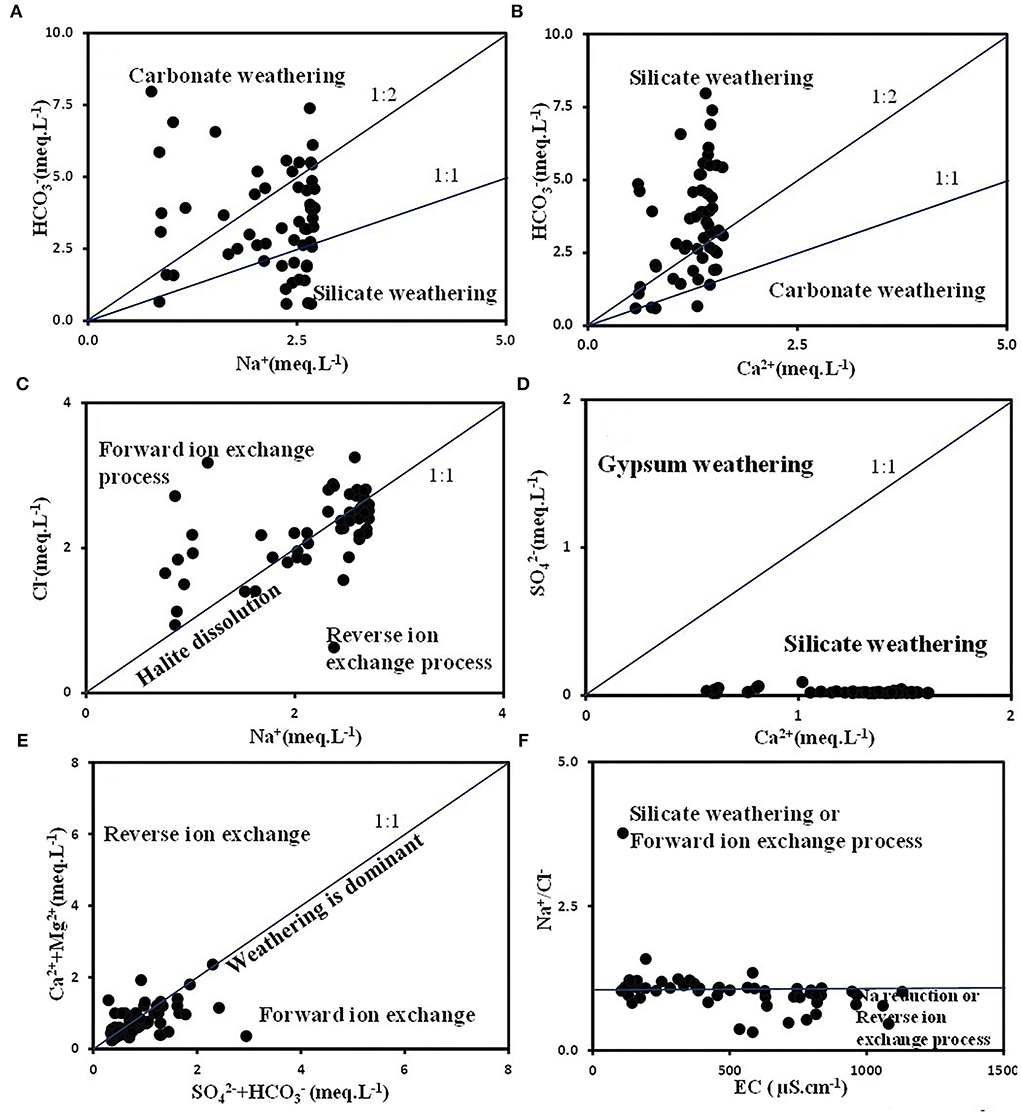
Figure 5. Scatter plots used for source-deduction (A) vs. Na+ (B) Ca2+ vs. (C) Na+ vs. Cl−(D) Ca2+ vs. (E) Ca2++Mg2+ vs. , and (F) EC vs. Na+/Cl−.
In the Na+ vs. Cl− scatter plot (Figure 5C), samples along the equiline (Na+/Cl− ratio equivalent to 1) represent halite dissolution. If Na+/Cl− ratio> 1, it signifies silicate weathering (reverse ion exchange) whereas Na+/Cl− ratio <1 indicates the ion exchange process (Egbueri et al., 2019; Lanjwani et al., 2021). Figure 5C implies the prevalence of reverse ion exchange and forward ion exchange processes. A few samples also represented halite dissolution. Ca2+ vs. plot (Figure 5D) shows silicate weathering as a predominant mechanism.
The effects of the distribution of sulfate and carbonate minerals are evaluated by the Ca2++Mg2+ vs. . Figure 5E ascertains the prevalence of reverse ion and forward ion exchange processes in the aquifer systems. Sample points along the equiline indicate sulfate and carbonate weathering. Points above the equiline indicate reverse ion exchange and carbonate–sulfate dissolution, whereas samples plotted below the equiline represent silicate weathering (Lanjwani et al., 2021). Evaporation processes may contribute to the enrichment of species in the water. The Na+/Cl− ratio remains unchanged if the evaporation process is dominant (Jankowski and Acworth, 1997; Lanjwani et al., 2021). Figure 5F reveals the reverse ion exchange process to be predominant in the region.
Mineral saturation
Mineral equilibrium estimations, using MINTEQ 3.1 geomodeling tool, for groundwater aid in the prediction of reactive mineral presence in the aquifer system which provide a saturation index (SI) for the minerals interacting in the groundwater system (Goswami et al., 2020, 2022). SI is the logarithm of the ratio of the ion activity product to the mineral thermodynamic equilibrium constant, adjusted for the temperature of the sample, and given as . Saturated (equilibrium, SI = 0), undersaturated (dissolution, SI < 0.5), and oversaturated (precipitation, SI > 0.5) saturation states are characterized on the basis SI value. SI for anhydrite, arcanite, bischofite, carnallite, chloromagnesite, epsomite, fluorite, gypsum, halite, kainite, melanterite, mirabilite, pentahydrite, sylvite, tachyhydrite, and thenardite is calculated and is displayed in Table 2. The bulk of samples are undersaturated with the selected minerals, according to SI values. Fluorite and gypsum (an evaporitic mineral) showed the potential for increase, indicating that evaporitic mineral dissolution has a substantial influence on the region's groundwater chemistry. Low-to-high undersaturated forms of anhydrite, halite, and epsomite along with other minerals can be found. The saturation indices are greater due to higher recharge and shifts in the aquifers with reduction potential and weathering.
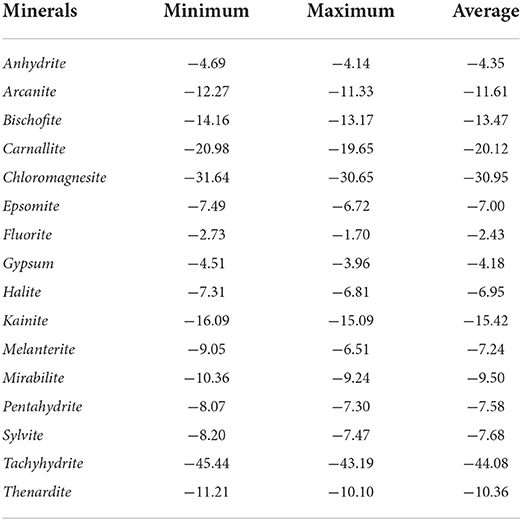
Table 2. Representing the mineral saturation indices.
Statistical analysis
Correlation coefficient
The correlation coefficient (r) between 13 parameters was evaluated in SPSS software (Table 3). Mg2+ and Ca2+ were significantly correlated (r = 0.948), which may be due to weathering and dissolution processes (Lanjwani et al., 2021). A positive correlation of Cl− with Na+ and K+ implies the chief source of Cl− to be halite and sylvite (Saha et al., 2019). The correlation matrix also displayed a significant positive association between As and (r = 0.699). As(V) exists as , which is considered a chemical analog of because of their similar chemical speciation (Strawn, 2018; Goswami et al., 2020). It implies they can replace each other in biogeochemical reactions such as adsorption/desorption reactions and precipitation/dissolution reactions. Hence, the fate and bioavailability of As are determined by the competitive biogeochemical mechanisms among As and (Strawn, 2018). Moreover, phosphate promotes As mobility in soil by competing for the same adsorption sites (Campos, 2002). Also, studies have established that water having higher As(III) concentrations along with high phosphate and silicate but low iron is a hard mix to successfully apply As removal treatments (Hug et al., 2008).

Table 3. Displaying the correlation matrix obtained using SPSS software.
Principal components analysis (PCA)
PCA is an important tool that describes the variance of large datasets with inter-related variables with the set of independent variables (Lanjwani et al., 2021). The 13 physicochemical parameters of the samples of Biswanath Chariali and Sonitpur districts were applied in a rotated component matrix, and the results of the PCA are summarized in Table 4. Five factors were identified which dominated the groundwater quality. Factor 1 accounts for 19.47 % variance in the data, and the variables present are Mg2+ and Ca2+ representing the dominance of dolomite weathering in the groundwater. Factor 2 accounted for As and with a variance of 14.84%. Similar in their chemical speciation, they can substitute each other in chemical reactions (Goswami et al., 2020). Factor 3 had a variance of 12.91% and showed significant negative loading for dissolved oxygen and positive loading for Fe. Factor 4 accounted for positive loadings from Na+ and Cl− with a variance of 11.27% likely implying leaching and dissolution. Factor 5 accounted for EC and K+ with a variance of 8.78% which prominently represents anthropogenic effects.
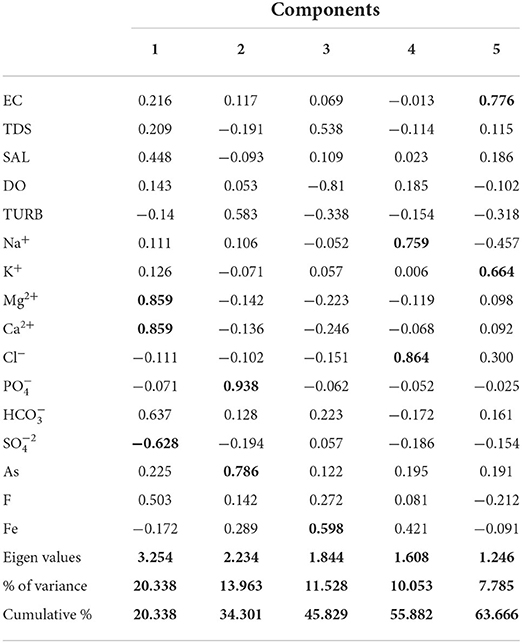
Table 4. Displaying the results obtained from principal component analysis (PCA).
Hierarchal cluster analysis (HCA)
HCA was implemented on normalized data using Ward's linkage method to classify the water quality parameters, and a dendrogram was generated (Figure 6). It is used for the classification of the physicochemical parameters and discerning the groundwater chemistry which is associated with the simultaneous geochemical processes (Kumar et al., 2016a,b). Four clusters were observed in the dendrogram. Cluster I represented the association between Mg2+ and Ca2+ indicating a prevalence of carbonate weathering processes. Cluster II was formed by EC, TDS, salinity, , K+, and F− which are representative of weathering processes promoting F− leaching. Rocks rich in F− containing minerals such as biotite, hornblende, fluorite, and apatite release F− into the water through weathering (Kumar et al., 2016). Cluster III represented a close association between As, , dissolved oxygen (DO), and turbidity. This may be related to common sources of As and such as agricultural activities. Cluster IV was formed with Na+, Cl−, Fe, and . Overall, the HCA of the water quality parameters concerning heavy metals Fe and As in this study area may be attributed to the water, local geology, and agricultural practices.
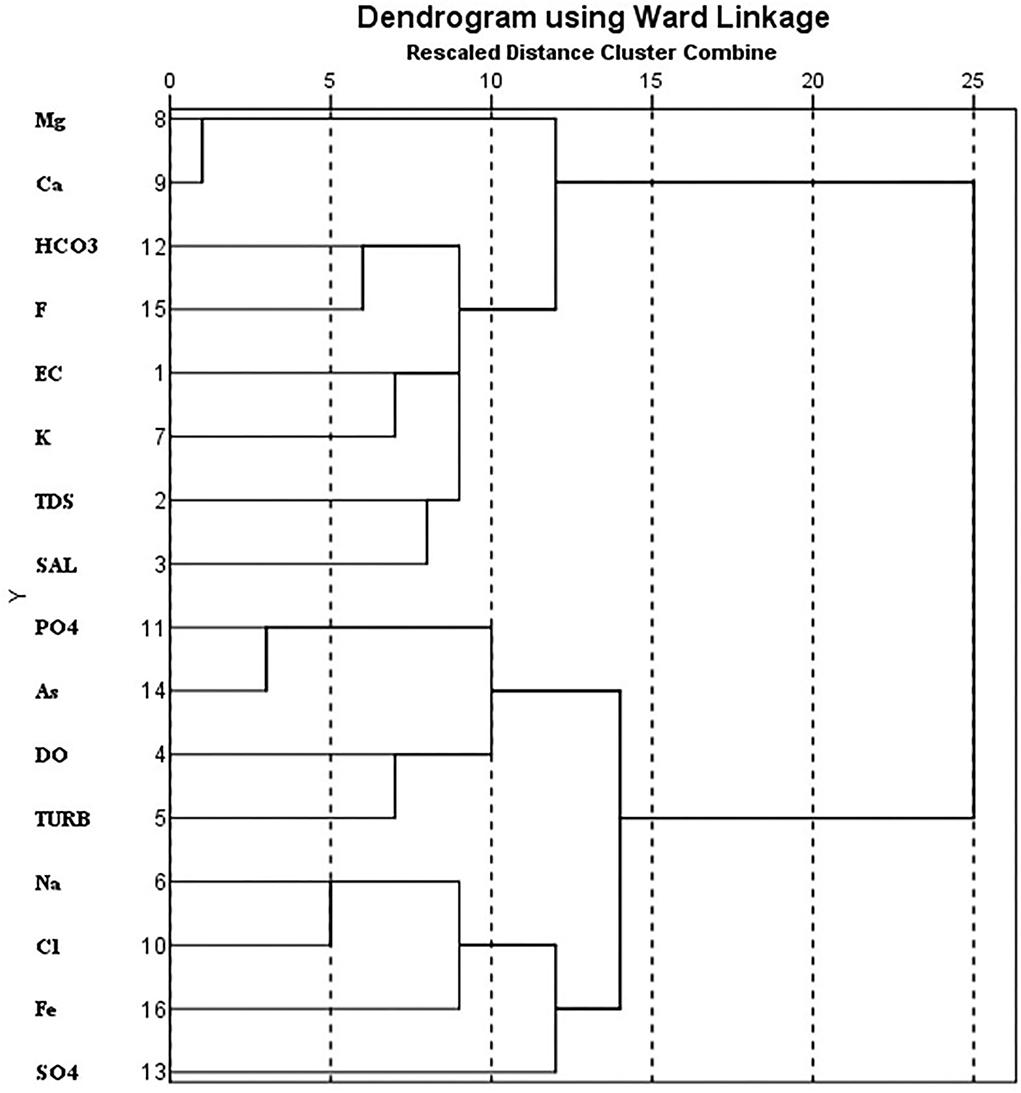
Figure 6. Cluster analysis of the study area.
Water quality classification for irrigation
Salinity hazard
Water salinity hazard is an influential water quality guideline that is measured by electrical conductivity (EC). Higher EC values indicate that the water will be less available to plants even though the soil remains wet (Rawat et al., 2018; Lanjwani et al., 2021). When EC increases, the amount of water that can be utilized by plants decreases since plants require “pure” water for transpiration. This indirectly affects the crop yield. Based on the electrical conductivity, salinity hazard has been classified into four classes (Tatawat and Chandel, 2008). For agriculture purposes, low salinity groundwater (EC <500 μScm−1) is preferred. About 48% of samples belonged to this category in this study, and 52% of samples belonged to the medium salinity class (EC 500–1,000 μScm−1) (Table 5). Water with moderate salinity can be used for agriculture without any regulation for salinity. Only selected crops with special regulations of salinity can be grown in soils having adequate drainage. Very high salinity (>3,000 μScm−1) groundwater cannot be used for irrigation under normal environmental conditions.
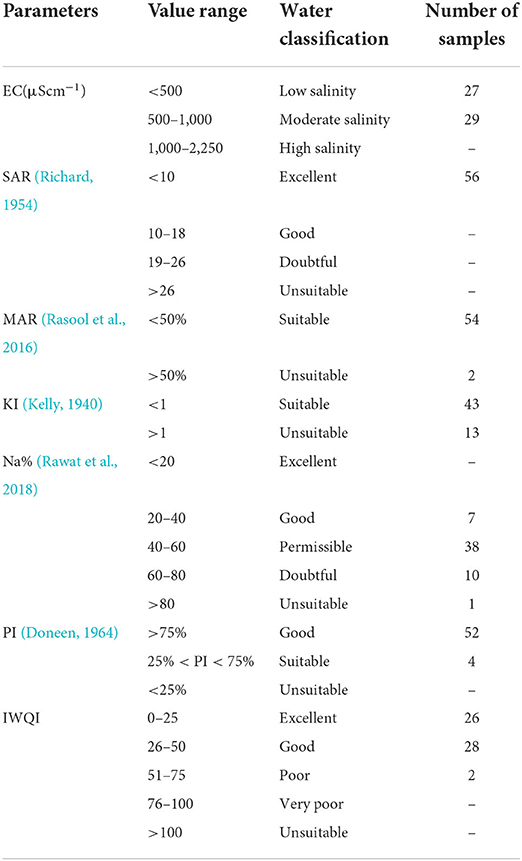
Table 5. Representing the irrigation indices determining the suitability of groundwater for agriculture.
Sodium adsorption ratio (SAR)
SAR is defined as the relative ratio of Na+ ions against the Ca2+ and Mg2+ ions present in the groundwater sample. The potential of Na+ ions to accumulate in the soil at the cost of Ca2+, Mg2+, and K+ ions is measured by SAR values. The percolation time of water through the soil also relies on the SAR (Rawat et al., 2018). Using water with high SAR values for irrigation regularly may lead to substantial adsorption of sodium onto the soil colloids. This may result in the alteration of the soil structure, hence making the soil compact and reducing permeability (Zaman et al., 2018). Therefore, lower values of SAR are preferable for irrigation.
Based on SAR values, irrigation water is classified as SAR <10 (excellent), 0–18 (good), 18–26 (doubtful), and >26 (unsuitable) (Rawat et al., 2018). SAR values <10 are categorized as excellent for use in agriculture (Richard, 1954). The SAR values for the samples ranged between 0.69 and 3.70 (Table 5) and were classified as excellent for irrigation use.
Sodium percentage (Na%)
Na+ is a significant parameter in determining the water for irrigation use. Excess Na+ ions chemically bind with the soils, thereby reducing its capacity for water movement (Rawat et al., 2018). Hence, Na% is a factor used to assess its aptness for irrigation (Wilcox, 1955). Na+ ions react with to form alkaline soils, whereas Na+ ions react with Cl− to form saline soil. Alkaline and saline soils hamper plant growth (Todd, 1980; Rawat et al., 2018). When Na+ ion concentrations are considerably higher in irrigation water, they tend to initiate base-exchange reactions in the clay particles, thereby replacing Ca2+ and Mg2+ ions. This process of exchange decreases the water movement capacity. In such conditions, the movement of air and water becomes restricted when wet and such soils harden when they dry (Saleh et al., 1999; Rawat et al., 2018) and, as a result, leads to reduced permeability, disruption of the soil structure, and reduced drainage of the soil, thereby reducing productivity and plant growth (Sridharan and Senthil, 2017).
Na% values are classified as excellent (<20%), good (20–40%), permissible (40–60%), doubtful (60–80%), and unsuitable (>80%) (Khodapanah et al., 2009). In this study, the Na% values ranged between 26.74 and 92.83, 13% (n = 7) were classified as good, 68% (n = 38) were within permissible range, 18% (n = 10) were doubtful, and 2% (n = 1) was unsuitable (Table 5).
Permeability index (PI)
PI is used to assess the suitability of the groundwater for irrigation influenced by the extended exposure of irrigation water with high concentrations of Na+, Ca2+, Mg2+, and ions (Ravikumar et al., 2011; Elsayed et al., 2020). PI values were found within the range of 40.33–220.08% (Table 5). The results indicated that 93% (n = 52) of samples belonged to Class I (high permeability) and only 7% (n = 4) belonged to Class II (moderate permeability).
Kelly's index (KI)
KI values indicate the excessive sodium quantity in the water. It measures sodium against the Ca2+ and Mg2+ and assists in determining the suitability of groundwater for irrigational purposes (Kelly, 1940; Shil et al., 2019). Water having KI values <1 is considered acceptable for irrigation purposes, whereas KI values >1 represent excess sodium and classify the water as unsuitable for irrigation (Kelly, 1940). KI also indicated that 77% (n = 43) of samples were within the permissible limits (Table 5).
Magnesium adsorption ratio (MAR)
In natural waters, an equilibrium state is maintained by Ca2+ and Mg2+ ions. Although Ca2+ and Mg2+ ions do not exist in a chemically equivalent state, mainly in the soil system, however, elevated Mg2+ ions are usually consequent to the exchangeable Na+ ions in agricultural soils. Ca2+ and Mg2+ are essential ions that influence the soil structure but a substantial increase in their concentrations increases the pH of the soil and reduces the accessibility of phosphorus (Rawat et al., 2018). Higher concentrations of Mg2+ ions make the soil alkaline resulting in decreased crop yield (Sridharan and Senthil, 2017; Shil et al., 2019). The harmful effect of Mg2+ ions in water is measured as MAR and used to determine its suitability for irrigation (Paliwal, 1972). Water samples containing MAR values >50 are considered unsuitable for irrigation (Khodapanah et al., 2009). Ninety-six percent (n = 54) of samples were classified as suitable for irrigation (Table 5). Four percent (n = 2) samples were unsuitable and should be treated before use in agriculture.
Irrigation water quality indices (IWQI)
IWQI is considered a dimensionless parameter which ranges from 0 to 100. Based on the IWQI values, irrigation water quality is divided into four classes: excellent (0–25), good (26–50), poor (51–75), very poor (76–100), and unsuitable (>100) (Farrag, 2005). The IWQI evaluation in the study region observes 46% (n = 26) samples as excellent and 50% (n =2 8) samples as good (Table 5). Only two samples were observed in the poor category of the index. Except for these two samples, the rest is considered safe to use for irrigation.
Wilcox diagram
The Wilcox diagram is used to investigate the groundwater quality potential for irrigation requirements. The chart is based on the electrical conductivity and sodium adsorption ratio. The Wilcox diagram (Figure 7) represents maximum samples within excellent, good, and permissible categories. However, three samples were categorized as doubtful and two were categorized as unsuitable for irrigation purposes.
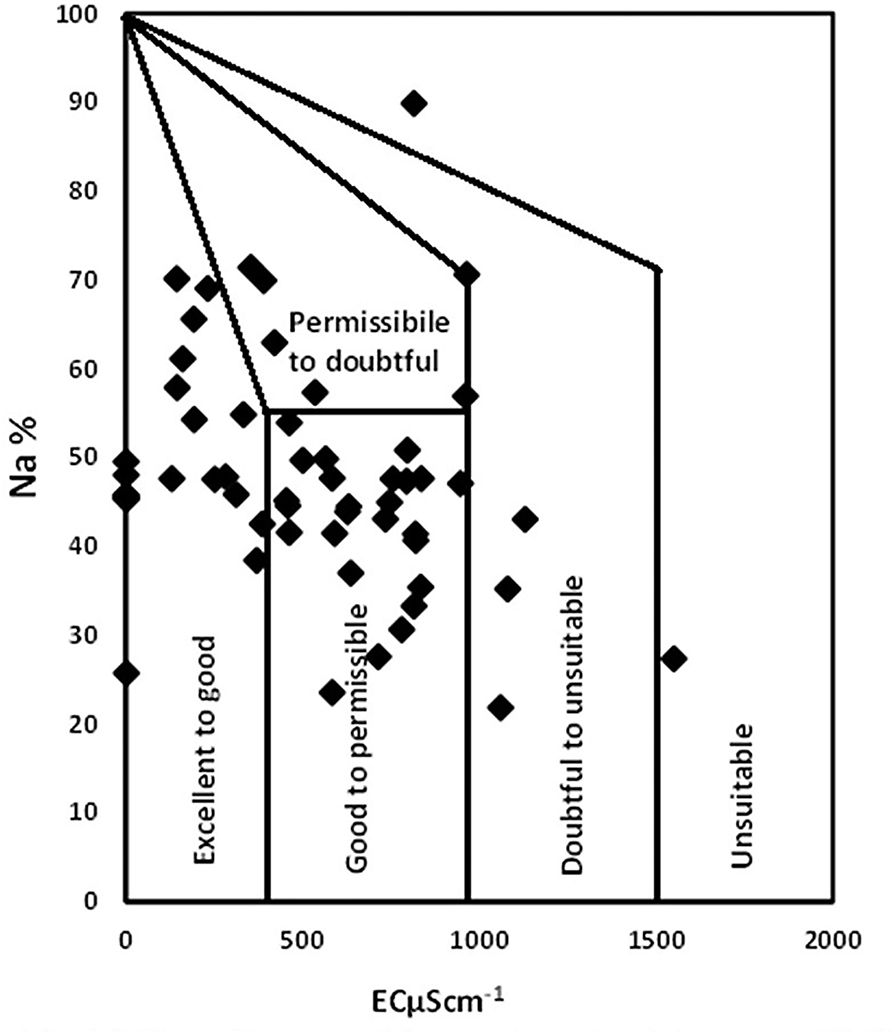
Figure 7. Wilcox diagram of electrical conductivity vs. Na%.
Conclusion
This study examined the groundwater hydrochemistry of the Biswanath Chariali and Sonitpur regions. The results of the physicochemical analysis were compared with the standard limits of WHO for drinking water. The EC and TDS values displayed 96% and 98% samples were below WHO permissible limits. Na+, K+, Ca2+, Mg2+, Cl−, , F−, and concentrations revealed all samples were lower than the permissible limits; however, 48% samples showed exceeded the WHO permissible limit for drinking water. The trace metals Fe and As concentrations surpassed the WHO permissible limit in drinking water by 95% and 25% samples, respectively, thereby raising concerns for the region. The results conclude that even though the water is potable concerning all other parameters, however, adequate removal measures should be implemented to remove Fe and As contamination. The scatter plots of the groundwater chemistry revealed rock weathering processes to be controlling the groundwater chemistry of the region. Silicate, carbonate, ion exchange, and reverse ion exchange processes predominated the region. The correlation matrix displayed a significant positive association between As and which may indicate a common source of origin for both. Salinity hazard and sodium percentage (Na%) indicated 97% and 98% samples were safe for use in agriculture. Sodium adsorption ratio (SAR) and permeability index (PI) values indicated 100% samples were suitable for irrigation purposes. According to Kelly's index (KI) values, 77% samples were fit for use in irrigation. The magnesium adsorption ratio (MAR) values of two samples were over 50% and should be treated before use in agriculture. Overall, the groundwater in Biswanath Chariali and Sonitpur districts should be treated for Fe and As before consumption, and the health effects of the contamination in the region should be closely monitored. According to a few indices used to determine agricultural appropriateness, not all water samples should be utilized in irrigation without treatment. The demand for high-quality irrigation water has risen in recent years, and using low-quality water to irrigate soils on a regular basis will result in lower productivity. As a result, understanding the quality of irrigation water aids in efficient irrigation water utilization and management for long-term output. It also aids in identifying crop suitability for the soil and other agricultural applications.
Data availability statement
The raw data supporting the conclusions of this article will be made available by the authors, without undue reservation.
Author contributions
RG: conceptualization, methodology, resources, writing—review and editing, funding acquisition, and supervision. NN: writing—review and editing, data curation, software, and validation. RT: formal analysis, methodology, and review and editing. All authors contributed to the article and approved the submitted version.
Funding
This work was funded by Science and Engineering Research Board (SERB), the Department of Science and Technology (DST), Govt. of India under SERB-STAR grant (grant number STR/2020/000126), and SERB-POWER grant (grant number SPG/2021/002107) awarded to RG.
Conflict of interest
The authors declare that the research was conducted in the absence of any commercial or financial relationships that could be construed as a potential conflict of interest.
Publisher's note
All claims expressed in this article are solely those of the authors and do not necessarily represent those of their affiliated organizations, or those of the publisher, the editors and the reviewers. Any product that may be evaluated in this article, or claim that may be made by its manufacturer, is not guaranteed or endorsed by the publisher.
References
Abdel-Fattah, M. K., Abd-Elmabod, S. K., Aldosari, A. A., Elrys, A. S., and Mohamed, E. S. (2020). multivariate analysis for assessing irrigation water quality: a case study of the Bahr Mouise Canal, Eastern Nile Delta. Water 12, 2537. doi: 10.3390/w12092537
Allen, L. N., and MacAdam, J. W. (2020). Irrigation and water management. Forages Sci. Grassl. Agric. 2, 497–513. doi: 10.1002/9781119436669.ch27
APHA. (2012) Standard Methods for the Examination of Water and Wastewater, 22nd Edn. Washington DC: American Public Health Association.
Arslan, S.. (2017). Assessment of groundwater and soil quality for agricultural purposes in Kopruoren basin, Kutahya, Turkey. J. Afr. Earth Sci. 131, 1–13. doi: 10.1016/j.jafrearsci.2017.04.004
BIS. (2012) Specifications for Drinking Water IS: 10500:2012. New Delhi: Bureau of Indian Standards.
Brammer, H., and Ravenscroft, P. (2009). Arsenic in groundwater: a threat to sustainable agriculture in South and South-East Asia. Environ. Int. 35, 647–654. doi: 10.1016/j.envint.2008.10.004
Campos, V.. (2002). Arsenic in groundwater affected by phosphate fertilizers at Sa~o Paulo, Brazil. Environ. Geol. 42, 83–87. doi: 10.1007/s00254-002-0540-0
Chaturvedi, R., Banerjee, S., Chattopadhyay, P., Bhattacharjee, C. R., Raul, P., and Borah, K. (2014). High iron accumulation in hair and nail of people living in iron affected areas of Assam, India Ecotoxicology and Environmental Safety 110, 216–220. doi: 10.1016/j.ecoenv.2014.08.028
Doneen, L. D.. (1964). Water Quality for Agriculture, Department of Irrigation. University of Calfornia, Davis, 48.
Eaton, E. M.. (1950). Significance of carbonates in irrigation waters. Soil Sci. 69, 123–133. doi: 10.1097/00010694-195002000-00004
Egbueri, J. C., Mgbenu, C. N., and Chukwu, C. N. (2019). Investigating the hydrogeochemical processes and quality of water resources in Ojoto and environs using integrated classical methods. Model. Earth Syst. Environ. 5, 1443–1461. doi: 10.1007/s40808-019-00613-y
El Tahlawi, M. R., Abo-El Kassem, M., Baghdadi, G. Y., and Saleem, H. A. (2016). Estimating and Plotting of Groundwater Quality Using WQIUA and GIS in Assiut Governorate, Egypt. World Journal of Engineering and Technology 4, 59–70. doi: 10.4236/wjet.2016.41007
Elsayed, S., Hussein, H., Moghanm, F. S., Khedher, K. M., Eid, E. M., and Gad, M. (2020). Application of irrigation water quality indices and multivariate statistical techniques for surface water quality assessments in the Northern Nile Delta, Egypt. Water 12, 3300. doi: 10.3390/w12123300
Farrag, A. A.. (2005). The hydraulic and hydrogeological impacts of the nile system on the groundwater in Upper Egypt. Assiut Univ. Bull. Environ. Res. 8, 87–102. doi: 10.21608/auber.2005.150305
Flanagan, S. V., Johnston, R. B., and Zheng, Y. (2012). Arsenic in tube well water in Bangladesh: health and economic impacts and implications for arsenic mitigation. Bull. World Health Organ. 90, 839–846. doi: 10.2471/BLT.11.101253
Gastmans, D., Chang, H. K., and Hutcheon, I. (2010). Groundwater geochemical evolution in the northern portion of the guarani aquifer system (Brazil) and its relationship to diagenetic features. Appl. Geochem. 25, 16–33. doi: 10.1016/j.apgeochem.2009.09.024
Gibbs, R. J.. (1970). Mechanism controlling water world chemistry. Science 170, 1088–1090. doi: 10.1126/science.170.3962.1088
Gillispie, E. C., Sowers, T. D., Duckworth, O. W., and Polizzotto, M. L. (2015). Soil pollution due to irrigation with arsenic-contaminated groundwater: current state of science. Curr Pollut. Rep. 1, 1–12. doi: 10.1007/s40726-015-0001-5
Gogoi, R. R., Khanikar, L., Gogoi, J., Neog, N., Jyoti, D., and Prasad, K. (2021). Applied Geochemistry Geochemical sources, hydrogeochemical behaviour of fluoride release and its health risk assessment in some fluorosis endemic areas of the Brahmaputra valley of Assam, India. Appl. Geochem. 127, 104911. doi: 10.1016/j.apgeochem.2021.104911
Goswami, R., Kumar, M., Biyani, N., and Shea, P. J. (2020). Arsenic exposure and perception of health risk due to grpundwater contamination in Majuli (river island), Assam, India. Environ. Geochem. Health 42, 443–460. doi: 10.1007/s10653-019-00373-9
Goswami, R., Neog, N., and Thakur, R. (2022). Hydrogeochemical analysis of groundwater quality for drinking and irrigation with elevated arsenic and potential impact on agro-ecosystem in the upper Brahmaputra plain, India. Environ. Sci. Pollut. Res. doi: 10.1007/s11356-022-20600-8
Goswami, R., Rahman, M. M., Murrill, M., Sarma, K. P., Thakur, R., and Chakraborti, D. (2014). Arsenic in the groundwater of Majuli–The largest river island of the Brahmaputra: magnitude of occurrence and human exposure. J. Hydrol. 518, 354–362. doi: 10.1016/j.jhydrol.2013.09.022
Hug, S. J., Leupin, O. X., and Berg, M. (2008). Bangladesh and Vietnam: different groundwater compositions require different approaches to arsenic mitigation. Environ. Sci. Technol. 42, 6318–6323. doi: 10.1021/es7028284
Jain, C. K., Bandyopadhyay, A., and Bhadra, A. (2010). Assessment of ground water quality for drinking purpose, District Nainital, Uttarakhand, India. Environ. Monit. Assess. 166, 663–676. doi: 10.1007/s10661-009-1031-5
Jain, C. K., and Vaid, U. (2018). Assessment of groundwater quality for drinking and irrigation purposes using hydrochemical studies in Nalbari district of Assam, India. Environ. Earth Sci. 77, 254. doi: 10.1007/s12665-018-7422-6
Jankowski, J., and Acworth, R. I. (1997). Impact of debris-flow deposits on hydrogeochemical process and the development of dry land salinity in the Yass River catchment, New South Wales, Australia. Hydrogeol. J. 5, 71–88. doi: 10.1007/s100400050119
Kelly, W. P.. (1940). “Permissible composition and concentration of irrigated waters,” in Proceedings of the A.S.C.F 607.
Khashogji, M. S., and El Maghraby, M. M. S. (2013). Evaluation of groundwater resources for drinking and agricultural purposes, Abar Al Mashi area, south Al Madinah Al Munawarah City, Saudi Arabia. Arab. J. Geosci. 6, 3929–3942. doi: 10.1007/s12517-012-0649-8
Khodapanah, L., Sulaiman, W. N. A., and Khodapanah, D. N. (2009). Groundwater quality assessment for different purposes in Eshtehard District, Tehran, Iran. Eur. J. Sci. Res. 36, 543–553.
Kumar, M., Das, A., Das, N., Goswami, R., and Singh, U. K. (2016a). UK Co-occurrence perspective of arsenic and fluoride in the groundwater of Diphu, Assam, North-eastern India. Chemosphere 150, 227–238. doi: 10.1016/j.chemosphere.2016.02.019
Kumar, M., Patel, A. K., Das, A., Kumar, P., Goswami, R., Deka, P., et al. (2017). Hydrogeochemical controls on mobilization of arsenic and associated health risk in Nagaon district of the central Brahmaputra Plain, India. Environ. Geochem. Health 39, 161–178. doi: 10.1007/s10653-016-9816-2
Kumar, M., Rahman, M. M., Ramanathan, A. L., and Naidu, R. (2016b). Arsenic and other elements in drinking water and dietary component from the middle Gangetic plain of Bihar, India: health risk index. Sci. Total Environ. 539, 125–134. doi: 10.1016/j.scitotenv.2015.08.039
Lanjwani, M. F., Khuhawar, M. Y., Khuhawar, T. M. J., Lanjwani, A. H., and Soomro, W. A. (2021). Evaluation of hydrochemistry of the Dokri groundwater, including historical site Mohenjo-Daro, Sindh, Pakistan. Int. J. Environ. Anal. Chem. doi: 10.1080/03067319.2021.1884241
Movilla-Pateiro, L., Mahou-Lago, X. M., Doval, M. I., and Simal-Gandara, J. (2020). Toward a sustainable metric and indicators for the goal of sustainability in agricultural and food production. Crit. Rev. Food Sci. 61, 1108–1129. doi: 10.1080/10408398.2020.1754161
Paliwal, K. V.. (1972). Irrigation With Saline Water. Monogram no. 2, New Series. New Delhi: IARI, 198.
Patel, A. K., Das, N., Goswami, R., and Kumar, M. (2019). Arsenic mobility and potential co-leaching of fluoride from the sediments of three tributaries of the Upper Brahmaputra floodplain, Lakhimpur, Assam, India. J. Geochem. Explor. 203, 45–58. doi: 10.1016/j.gexplo.2019.04.004
Piper, A. M.. (1944). A graphic procedure in geochemical interpretation of water analysis. Am. Geophys. Union Trans. 25, 914–923. doi: 10.1029/TR025i006p00914
Ramesh, K., Nithya, K., and Vennila, S. (2014). Groundwater quality assessment of Kurunthancode block in Kanya kumari District, India. Int. J. Chem. Tech. Res. 6, 4585–4594. Available online at: https://sphinxsai.com/2014/ch_vol6_no11/1/(4585-4594)N14.pdf
Rasool, A., Xiao, T., Farooqi, A., Shafeeque, M., Liu, Y., Kamran, M. A., et al. (2016). Quality of tube well water intended for irrigation and human consumption with special emphasis on arsenic contamination at the area of Punjab, Pakistan. Environ. Geochem. Health. 39, 847–863. doi: 10.1007/s10653-016-9855-8
Ravikumar, P., Somashekar, R. K., and Angami, M. (2011). Hydrochemistry and evaluation of groundwater suitability for irrigation and drinking purposes in the Markandeya River basin, Belgaum District, Karnataka State, India. Environ. Monit. Assess. 173, 459–487. doi: 10.1007/s10661-010-1399-2
Rawat, K. S., Singh, S. K., and Gautam, S. K. (2018). Assessment of groundwater quality for irrigation use: a peninsular case study. Appl. Water Sci. 8, 233. doi: 10.1007/s13201-018-0866-8
Richard, L. A.. (1954). Diagnosis and Improvement of Saline and Alkali Soils. Edit. US Department of Agriculture, Agricultural Handbook n°60, Washington, DC, 160. doi: 10.1097/00010694-195408000-00012
Saha, S., Reza, A. H. M. S., and Roy, M. K. (2019). Hydrochemical evaluation of groundwater quality of the Tista floodplain, Rangpur, Bangladesh. Appl. Water Sci. 9, 198. doi: 10.1007/s13201-019-1085-7
Saleh, A., Srinivasula, S. M., Acharya, S., Fishel, R., and Alnemri, E. S. (1999). Cytochrome c and dATP-mediated oligomerization of apaf-1 is a prerequisite for procaspase-9 activation. J. Biol. Chem. 274, 17941–17945 doi: 10.1074/jbc.274.25.17941
Shah, B. A.. (2015). Status of groundwater arsenic contamination in the states of North-East India: A review. Indian Groundwater. 5, 32–37.
Shaji, E., Santosh, M., Sarath, K. V., Prakash, P., Deepchand, V., and Divya, B. V. (2021). Arsenic contamination of groundwater: a global synopsis with focus on the Indian Peninsula. Geosci. Front. 12, 101079. doi: 10.1016/j.gsf.2020.08.015
Shil, S., Singh, U. K., and Mehta, P. (2019). Water quality assessment of a tropical river using water quality index (WQI), multivariate statistical techniques and GIS. Appl. Water Sci. 9, 168. doi: 10.1007/s13201-019-1045-2
Shirmohammadi, B., Malekian, A., Salajegheh, A., Taheri, B., Azarnivand, H., Malek, Z., et al. (2020). Scenario analysis for integrated water resources management under future land use change in the Urmia Lake region, Iran. Land Use Policy 90, 104299. doi: 10.1016/j.landusepol.2019.104299
Singh, A. K.. (2004). “Arsenic contamination in groundwater of North Eastern India,” in Proceedings of 11th National Symposium on Hydrology with Focal Theme on Water Quality (Roorkee: National Institute of Hydrology), 255–262.
Singh, S., Singh, C., Kumar, K., Gupta, R., and Mukherjee, S. (2009). Spatial– temporal monitoring of groundwater using multivariate statistical techniques in Bareilly district of Uttar Pradesh, India. J. Hydrol. Hydromech. 57, 45–54. doi: 10.2478/v10098-009-0005-1
Sridharan, M., and Senthil, N. D. (2017). Groundwater quality assessment for domestic and agriculture purposes in Puducherry region. Appl. Water Sci. 7, 4037–4053. doi: 10.1007/s13201-017-0556-y
Strawn, D. G.. (2018). Review of interactions between phosphorus and arsenic in soils from four case studies. Geochem. Trans. 19, 10. doi: 10.1186/s12932-018-0055-6
Tatawat, R. K., and Chandel, C. P. S. (2008). A hydrochemical profile for assessing the groundwater quality of Jaipur City. Environ. Monit. Assess. 143, 337–343. doi: 10.1007/s10661-007-9936-3
Wilcox, L. V.. (1955). Classification and Use of Irrigation Water. Washington, DC: US Dept. of Agriculture, Circular, 969.
World Health Organization (WHO). (2017). Guidelines for Drinking-Water Quality, 4th Edn. Incorporating the First Addendum. Geneva: World Health Organization.
Zaman, M., Shahid, S. A., and Heng, L. (2018).”Irrigation water quality,” in Guideline for Salinity Assessment, Mitigation and Adaptation Using Nuclear and Related Techniques (Springer), 113–131. doi: 10.1007/978-3-319-96190-3_5
Keywords: Central Brahmaputra Plain, irrigation water, groundwater, arsenic, iron
Citation: Goswami R, Neog N and Thakur R (2022) Hydrogeochemical assessment of groundwater quality for drinking and irrigation in Biswanath and Sonitpur district of the Central Brahmaputra Plain, India. Front. Water 4:889128. doi: 10.3389/frwa.2022.889128
Received: 03 March 2022; Accepted: 05 July 2022;
Published: 10 August 2022.
Edited by:
Richard Graham Taylor, University College London, United KingdomReviewed by:
P. Saranya, Physical Research Laboratory, IndiaVenkatramanan Senapathi, Alagappa University, India
Copyright © 2022 Goswami, Neog and Thakur. This is an open-access article distributed under the terms of the Creative Commons Attribution License (CC BY). The use, distribution or reproduction in other forums is permitted, provided the original author(s) and the copyright owner(s) are credited and that the original publication in this journal is cited, in accordance with accepted academic practice. No use, distribution or reproduction is permitted which does not comply with these terms.
*Correspondence: Ritusmita Goswami, cml0dXNtaXRhMTAwQGdtYWlsLmNvbQ==
†These authors have contributed equally to this work