 Tesfay Abraha
 Assefa Tibebu
 Gebremariyam Ephrem
- Ethiopian Institute of Architecture, Building Construction and City Development, Addis Ababa University, Addis Ababa, Ethiopia
Water connects all kinds of life like a thread. However, despite its indispensable roles, little attention has been paid to its effective management for generations. Water as a nonrenewable natural resource, combined with a fast-growing urban population and climate change, has exposed countries to increasing water-related risks. Even though the water-related risk is becoming a fast-expanding worldwide concern, it is largely ignored and understudied in Ethiopia. As a result, this research aims to explore water-related risks at the country and basin levels, as well as to generate information on how water-related risks may influence current and future urbanization and urban settlement so that land use and water resource management planners can make better strategic decisions. To do this, the researchers employed a deductive exploratory (quantitative) research strategy that primarily centered on desk review and spatial analysis, utilizing GIS and remote sensing. As a result, this study found that water availability per person per year is 1,109 m3, indicating that Ethiopia is experiencing water stress. According to the study, 41.6% of Ethiopians live in basins, receiving <500 m3 per capita each year. Furthermore, 178 urban centers (15%) are located in dry basins, 369 (33%) urban centers are located in low groundwater potential zones, and 315 urban centers (28.15%) are located in an area with <100-mm annual rainfall. In addition, 307 urban centers (28%) are all in high-drought-risk areas, while 307 urban centers (27%) are insignificant flood-prone areas. Overall, this study discovered that Ethiopia and its urban centers are experiencing water-related challenges. Hence, water-centric management strategies, such as water-smart community development, water-sensitive physical planning, water-smart technology, and a water-sensitive legal framework, are required to address the ongoing water risks.
Background
Today, over half of the global population lives in urban areas, and the number is expected to continue rapidly growing (UN-Habitat, 2020), and it is projected that, by 2050, more than two-thirds of the global population (68%) will reside in urban areas. This means that, ~7 out of 10 people will live in urban centers. These forecasts also revealed that Asia and Africa will account for roughly 90% of the population rise (UN-DESA, 2018). Hence, these precedent facts clearly show that:
• The fate of the world has been and will be highly influenced by an urban setting.
• The number and size of settlements in developing countries will be influenced by increasing urbanization. For example, villages will rapidly transition into emerging towns, emerging towns into small towns, and so on.
• Developing countries, in particular, are projected to face difficulties in meeting the needs of their rapidly rising populations, particularly in the areas of water, food, energy, and waste management.
As the globe continues to urbanize, the world's population life and livability will be determined by how urban areas are managed and governed following sustainable development goals and the efficient use of natural resources. As a result, the fundamental task of urban leadership, communities, and scholars will be to comprehend the main trend of urbanization concerning resource use.
Surprisingly, recent reports have shown that the resource consumption rate is surpassing the population growth rate (Seto et al., 2012; Swilling et al., 2018; Nicolau et al., 2019; Ganivet, 2020). Available Projection indicated that, by 2050, the urban resource consumption rate is expected to grow faster than the urban population growth rate (Ganivet, 2020). By 2050, urban domestic material consumption will account for 60% of the total global domestic material consumption (Baynes and Musango, 2018). Domestic material consumption will reach 8–17 tones per capita per year, which exceeds the standard set by the sustainable development goal (6–8 tones per capita per year; Swilling et al., 2018). To date, manifestations have already surfaced that the resource consumption pattern is in clashes with nature's affordability (Parsons, 2021), and ecosystem services are under wide-ranging stress (Rahimi et al., 2021).
When it comes to freshwater withdrawal and consumption patterns, the trend is also alarming (UN-Water, 2021). Since the previous century, knowingly or unknowingly, human intervention has threatened water resources (Cosgrove and Loucks, 2015; Abd El Mooty et al., 2016). Consequently, water withdrawal has tripled over the last 50 years (He et al., 2021), with agriculture accounting for 72% of the total withdrawal, followed by an industry and a municipal with 12 and 16%, respectively (FAO UN Water, 2021). This shows that water consumption has been growing at more than 2-fold the rate of population increase (FAO, 2017). It is also projected that, by 2025, water withdrawals in developing countries will increase by 50%, while, in developed countries, it is expected to increase by 18% (Boretti and Rosa, 2019). Currently, the contradiction between water withdrawal and available freshwater goes beyond the surface (Upadhyaya, 2016). While access to safe water is still a dream for most urban people (Nadeem et al., 2016), water stress-related conflicts are increasing (Sivakumar, 2011). Today, natural catastrophes are becoming more numerous and widespread over the world, with water-related disasters being the most regular and recurrent (Asian Development Bank, 2015). Water-related dangers, such as floods and droughts, are predicted to grow in both frequency and severity as a result of too much or too little water (UNICEF, 2020). According to the reports stated above, the world is rapidly approaching water risk. In this regard, theoretically, “water risk” is defined as “the possibility of an entity experiencing a water-related challenge, such as water scarcity, water stress, flooding, infrastructure decay, and drought” (Schulte and Morrison, 2014).
Existing definitions of “water stress” and “water scarcity” are differentiated based on the degree of severity of the water challenges. For example, Falkenmark (1989) considered both terms as different degrees of the same challenge. According to Falkenmark (1989), an area is said to be stressed when it receives freshwater <1,700 m3 per capita per year and a water-scarce area when it receives freshwater <1,000 m3 per capita per year. Presently, 25% of the world population are living in water-stressed countries, and 67% are experiencing severe water scarcity for at least 1 month each year (UNICEF, 2020). It is also predicted that water stress will continue at an accelerating rate as long as the current water management and water utilization practices remain unchanged (Heidari et al., 2021). Total water consumption is expected to rise by 55% by 2050, with manufacturing and residential sectors seeing 400 and 130% increases, respectively. As a result, the globe will confront a freshwater supply gap of up to 40%, indicating that the world is still on “off track” to meet its sustainable development targets.
Africa, with about 60% of its territory belonging to arid and semiarid climatic conditions (Gan et al., 2016), is cited as a water-stressed continent and contributes to 50% of the people who drink water from unsafe water sources (WWAP, 2019). Sub-Saharan Africa, which falls under rapid population growth, climate change, and irregular rainfall patterns, has many water-stressed countries (Serdeczny et al., 2016). Since 2000, the number of people in Sub-Sahara who lack access to clean water increased by 40% (UN Water, 2021). The Sub-Saharan Africa region is one of the regions that are suffering from water stress due to fast-growing urban areas (Christopher, 2006). While Ethiopia, a Sub-Saharan country, has relatively abundant water resources, the unprecedented population growth, rapid urbanization along with climate change is shaking the balance between water demand and supply. According to Zablon et al. (2021), although Ethiopia is recognized as Africa's “Water Tower,” its water source is severely impacted by fluctuating rainfall, increasing water demand, climate change, and watershed degradation.
Water stress-related literature has developed slowly in Ethiopia over the last few decades. Sustainable Water Partnership (2021), for example, investigated Ethiopia's whole water resource profile, including water resource potential and water stress-related challenges. According to this report, Ethiopia is a water-stressed country. The total annual renewable water resource per person is 1,162 m3, which is below the water stress level set by Falkenmark. According to this report, most basins in the east of the country have ephemeral surface water and are classified as dry basins. Similarly, Adeba et al. (2015) investigated water scarcity and its effects on sustainable development in the Awash basin, concluding that the basin is the most water stressed due to continual water withdrawal. Adane et al. (2021) also developed a baseline for water stress in Ethiopia at the subbasin level. Water stress was mapped at the subbasin scale using the “Fresh Water Withdrawal-to-Availability Ratio (WTA),” and it was discovered that water stress in Ethiopia is growing over time. Assefa et al. (2018) established a general generic water security index, using Addis Ababa as a case study, and found that urbanization shapes urban water security both directly and indirectly. Furthermore, both urbanization and water security are dynamic processes that alter with changes in the population, economy, and environment. The study also stated that studying water security paves the way for understanding and generating indicators to measure sustainable water development goals, and that urban water security is centered on assessing the capacity of urban water sources to ensure sustainable urban water-related services that can result in vibrant and livable urban settlements
Despite these attempts, there are still certain gaps that this study attempted to fill. As a result, the following are the primary motivations for conducting this research:
• Despite the fact that worldwide water stress studies exist, they are less likely to give detailed and specific water stress information. The intricate variability that exists at the main basin level is hidden by global-scale water stress research. In this scenario, a country that appears to be safe or unaffected by stress may have significantly more troubled basins.
• Even while limited studies on water-related studies, such as urban water security, are emerging, pieces of literature in urban water risk in general, as well as, in particular, in urban water security, studies are still lacking.
• The majority of water risk studies in Ethiopia are sporadic and fragmented. These studies are useful in illustrating the severity of the water risk problem, but they do not provide a full picture of how water risk grows from a country to a basin level.
• Most studies used “Fresh Water Withdrawal-to-Availability Ratio (WTA) index;” however, this study combines the Fresh Water Withdrawal-to-Availability Ratio (WTA) index with an Environmental Water Requirement indicator” and the “Falkenmark index.”
As a result, the overall goal of this research is to investigate water-related risks, such as “water stress,” “flooding,” and “drought,” as well as to generate “water risk” information that will aid in determining where water risk exists in conjunction with Ethiopia's spatial urbanization pattern and water risk probability. This work makes a 2-fold contribution. First, the research refined the condition of water stress at the country and basin levels using a set of water stress indicators (which included both the Fresh Water Withdrawal-to-Availability Ratio and the Environmental Water Requirement indicator as well as the “Falkenmark index”). Second, the overlay maps (the combined map of water risk and the distribution of urban centers) can be utilized as a baseline for scenario analysis for both national urban development planning and national water risk monitoring.
Related Literature
Key Concepts Related to “Water Scarcity,” “Water Stress,” and “Water Risk”
Water-related problems are commonly referred to as “water scarcity,” “water stress,” and “water risks” (Schulte and Morrison, 2014; Kummu et al., 2016; FAO, 2018; UNICEF, 2021; UN-Water, 2021). There are two thoughts regarding the relationship between “water scarcity” and “water stress;” for example, FAO (2012), UNICEF (2021), and UN-Water (2021) argued that, compared to “water stress,” “water scarcity” is a more inclusive and broader concept, and “water stress” is the symptom of “water scarcity.” Whereas Schulte and Morrison (2014) conceptualized the terms opposite to the aforementioned concepts. According to Schulte and Morrison (2014), compared to “water scarcity,” “water stress” is a more inclusive and broader concept that encompasses all the issues of water scarcity. Existing definitions of “water stress” and “water scarcity” are also differentiated based on the degree of severity of the water challenges. For example, Falkenmark (1989) considered both terms as different degrees of the same challenge. According to Falkenmark (1989), an area is said to be stressed when it receives freshwater <1,700 m3 per capita per year and a water-scarce area when it receives freshwater <1,000 m3 per capita per year (Table 1).
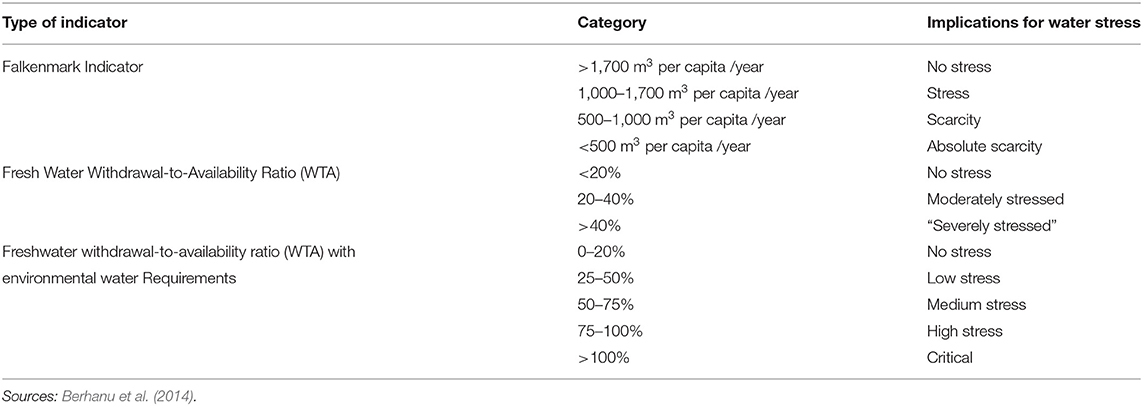
Table 1. Water stress indicators and their thresholds.
The terms “water scarcity” and “water stress” are sometimes used interchangeably because they have a lot of similarities and overlaps. However, there is mounting evidence that the two phrases are independent concepts that should not be confused (Schulte and Morrison, 2014; UN-Water, 2021). The definition, applications, and functionality of the terms are not uniform across the literature. Hence, setting a working definition and describing how “water scarcity” and “water stress” are used in the present research is a prerequisite to minimizing the confusion emerging between the two terms. Therefore, this study employed the definition of Falkenmark (1989) to explain the degree of severity of the water challenges. “Water scarcity” is regarded as the volumetric abundance of water supply and conceptualized as a physical, objective reality that can be measured consistently in a given geographic location and temporal horizon (Schulte and Morrison, 2014). “Water scarcity” can be either “physical” or “economic” scarcity. “Physical” water scarcity refers to volumetric water shortage, and “economic” scarcity refers to water scarcity due to a lack of water infrastructure (UNICEF, 2021). Schulte and Morrison (2014) defined “water stress” as the occurrence of water scarcity when the available freshwater fails to support human and ecological water demands. According to Schulte and Morrison (2014), compared to “water scarcity,” “water stress” is a more inclusive and broader concept and considers several physical aspects related to water resources, which include water scarcity, water quality, environmental flows, and the accessibility of water. Therefore, in this particular study, “water scarcity” is considered as a symptom of “water stress” or “water scarcity” is included in the “water stress” concept, and the whole definition is borrowed from the definition of Schulte and Morrison (2014). The rationale to consider “water stress” over “water scarcity” includes:
• When assessing water risk, “water stress” is thought to be more effective than “water scarcity.”
• “Water stress” takes into account more than just the physical availability of water.
• “Water stress” is a broader concept than “water scarcity” that includes the relationship between total renewable freshwater resources (TRWR) and the total freshwater withdrawn (TFWW) in a given geographical location or annual water availability per person.
• “Water-stress” study helps to understand whether the rates of abstractions in basins are sustainable over the long term, which, in turn, helps to encourage resource efficiency.
• A “water stress” map can aid in the development of urban scenario planning as well as the monitoring and reporting of water risk.
Meanwhile, “water risk” is a catch-all phrase for the severity of water-related problems in a given place, and “water risk” has the advantage of being comprehensive, as it encompasses both “water scarcity” and “water stress” (Schulte and Morrison, 2014). “Water risk,” according to Schulte and Morrison (2014), is “the likelihood of an entity facing a water-related challenge, such as water scarcity, water stress, flooding, infrastructure decay, and drought.”
Physical Water Stress Indicators
Since the issue of water stress emerges as a main concern, various water stress measurement indexes have been developed (Damkjaer and Taylor, 2017; Wang et al., 2021). For example, Falkenmark (1986) developed a water stress assessment index that relates total population and total runoff. Vörösmarty et al. (2005) developed a water stress index to measure the water withdrawal-to-availability (WTA) ratio. Smakhtin et al. (2004) developed a water stress index by incorporating environmental water requirements, which is later adopted by UN-Water as a method of measuring water stress. Sun et al. (2008) also developed a water supply stress index. Some of the well-acknowledged indexes are presented in the following section.
Falkenmark Indicator and Its Thresholds (Country-Level Assessment)
The Falkenmark index is the oldest and most well-known water stress index (McNally et al., 2019). Falkenmark (1986) initially defined water stress as the fraction of the total annual runoff available for each person every year in a given country (Damkjaer and Taylor, 2017). Objectively, the Falkenmark index compares the total freshwater volume with the total population in a country (m3/capita/year; Mulwa et al., 2021; Equation 1 and Table 1).
Fresh Water Withdrawal-to-Availability Ratio (WTA)
The withdrawal-to-availability ratio (WTA) developed by Raskin et al. (1997) also emerges as one of the country-level water stress indicators (Rijsberman, 2006). The water Withdrawal-to-Availability Ratio (WTA) index defines water stress in terms of the ratio of total annual withdrawals of freshwater for domestic (D), industrial (I), and agriculture (A) to mean annual renewable water resources (FAO, 2018; Equation 2 and Table 1).
Fresh Water Withdrawal-to-Availability Ratio (WTA) With Environmental Water Requirement
The water stress index with environmental water requirements was originally described by Smakhtin et al. (2004). This stress index is an improvement over the withdrawal-to-availability ratio (WTA) because it includes the environmental water requirement (EWR). This indicator is also approved by United Nation as a sustainable development indicator or as a water-use efficiency indicator (FAO, 2018). Mathematically, the water stress index with environmental water requirement is expressed by the ratio between total freshwater withdrawn (TFWW) by all sectors and total renewable freshwater resources (TRWR) after taking into account environmental flow requirements (EFR). Commonly, an environmental flow requirement (EFR) is taken as 20–50% of total renewable freshwater resources (TRWR; Smakhtin et al., 2004; Equation 3 and Table 1).
Contextual Water Resource and Urbanization Review of Ethiopia
Surface Water Resources (River Basins) in Ethiopia
Water covers around 0.7% of Ethiopia's landmass (Melesse et al., 2013). According to Seifu and Seid (2006), Ethiopia has 12 major river basins (Table 2 and Figure 1), which create four major drainage systems (FAO, 2016), such as:
• The Nile basin, which includes Abbay or Blue Nile, Baro-Akobo, Setit-Tekeze/Atbara, and Mereb, covers 33% and drains the northern, central, and western parts.
• The Rift Valley, which includes Awash, Denakil, Omo-Gibe, and Central Lakes, covers 28% and consists of a group of independent interior basins, extending from Djibouti in the north to the United Republic of Tanzania in the south, with nearly half of its total area located in Ethiopia.
• The Shebelli-Juba basin, which includes Wabi-Shebelle and Genale-Dawa, covers 33% and drains the southeastern mountains toward Somalia and the Indian Ocean.
• The North-East Coast, which consists of the Ogaden and Gulf of Aden basins, covers the remaining 6% of the country.
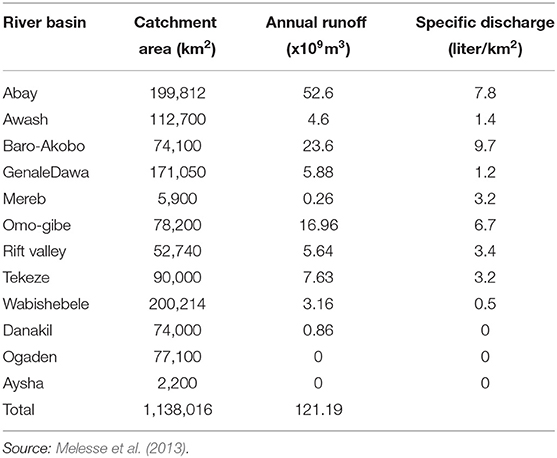
Table 2. Ethiopian surface water resources by major river basins.
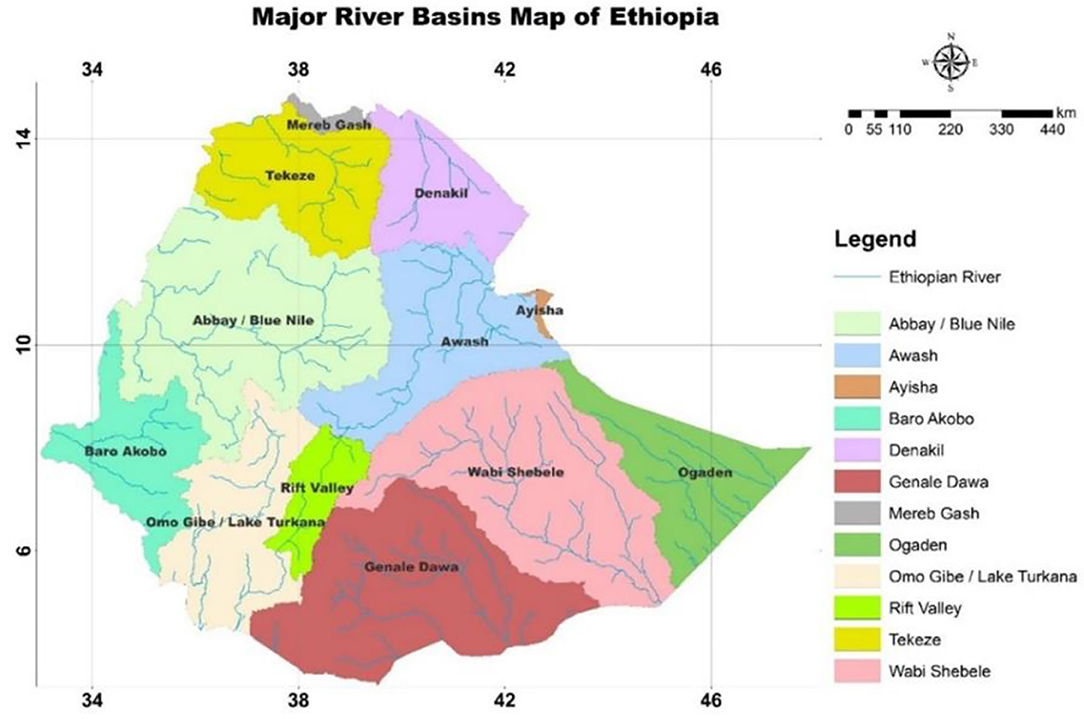
Figure 1. Major river basins of Ethiopia. Source: Awulachew et al. (2007).
In Ethiopia, rivers are largely seasonal, with around 70% of runoff occurring between June and August (Dile et al., 2013). Although there are unequal geographical and seasonal changes, Ethiopia receives about 122 billion m3 of yearly surface runoff (FDRE-MWR, 2002). Water shortages affect all river basins except the Nile; however, heavy rains can produce floods, especially in the Awash River and in the lower Baro-Akobo and Wabe-Shebelle river basins, causing damage to standing crops and infrastructure (FAO, 2016).
Groundwater Resource Potential of Ethiopia
Studies on the groundwater potential of Ethiopia have reported different results that vary from 2.6 billion cubic meters (FDRE-MWR, 2002) to 40 billion cubic meters (Mengistu et al., 2019). These reports indicate that the groundwater potential is not fully known, but its quantity cannot be undermined (Melesse et al., 2013), Moreover, groundwater occurrence is affected by the variability of rainfall, topography, climate, and geological formation (Ayalew, 2018).
Surface Water Resources (Lakes and Reservoirs) Potential of Ethiopia
Ethiopia contains around 22 lakes, with 11 fresh, nine saline, and four crater lakes (Awulachew et al., 2007). Except for Lake Tana, which is the source of the Abay River in the Nile Basin, most of the largest lakes are found in the Rift Valley (FAO, 2016). Most Rift Valley lakes have no surface water outlets and, as a result, are extremely saline. The surface area covered by lakes is estimated to be 7,500 km2 (Awulachew et al., 2007). The total area of wetlands in Ethiopia is estimated between 1.4 and 1.8 million ha (Abebe and Geheb, 2003). Floodplains are mostly found in the north-western and western highlands, the Rift Valley and the eastern highlands, but some are also located in lowlands (FAO, 2016). Ethiopia has also many small, medium, and large reservoir dams constructed for hydropower generation, irrigation, and drinking water supply (Awulachew et al., 2007).
Annual Spatial Distribution of Rainfall of Ethiopia
The rainfall distribution in Ethiopia is highly variable both spatially and temporally (Ayalew, 2018). This varies due to Ethiopia's diverse environment, which ranges from the semiarid desert in the lowlands to humid and warm in southwest Ethiopia (Fazzini et al., 2015). The main reasons for rainfall variability in Ethiopia are global climate change and local contexts of seasonal variations due to undulating topography (Melesse et al., 2013). The southwestern highlands of Ethiopia receive the most yearly rainfall (over 2,700 mm), followed by a progressive decline in the north (to <200 mm), northeast (to <100 mm), and southeast (to <200 mm; World Bank, 2020). To this end, previous studies on Ethiopian rainfall asserted that:
• There are spatial and temporal rainfall irregularities.
• Besides inter-regional variability, there is also intra-regional rainfall variability.
• Topographical variations along with climate change are the vanguard factors for seasonal variation in rainfall.
• Most parts of Ethiopia receive one main wet season (“Kiremt”) from mid-June to mid-September up to 350 mm per month in the wettest regions.
Water Resources and Climate Change in Ethiopia
Ethiopia is characterized by significant climate disparities in its intra and inter regions due to its enormous terrestrial size and diversified topography. The eastern part of the country is predominantly arid and semiarid, receiving little rainfall and regularly experiencing drought (World Bank., 2019). Today, the impact of climate change on water resource is becoming a major challenge in Ethiopia. There is growing evidence that shows Ethiopia is diving into worsened events of climate change, including drought and flood (FAO, 2016; Ketema and Dwarakish, 2021). One of the great manifestations of the impact of climate change on Ethiopia includes the occurrence of eight major droughts in the past 15 years, which had significant adverse consequences for the economy and livelihoods (World Bank, 2020). Drought risks are high in most eastern basins, and almost 90% of drought-prone regions are in lowland areas (Nanki et al., 2010). Climate change is also creating flood risks in several basins, particularly in the Awash and Wabi-Shebelle Basins and in parts of the Great Rift Valley (World Bank, 2018). Studies reported that between 1991 and 2019, floods resulted in 3,000 deaths, displaced 1.3 million people, and lost 250,000 cattle and half a million hectares of cropland (World Bank, 2019). In the previous decades, Ethiopia faced multiple natural hazards, including floods, landslides, epidemic diseases, and storms (Table 3).
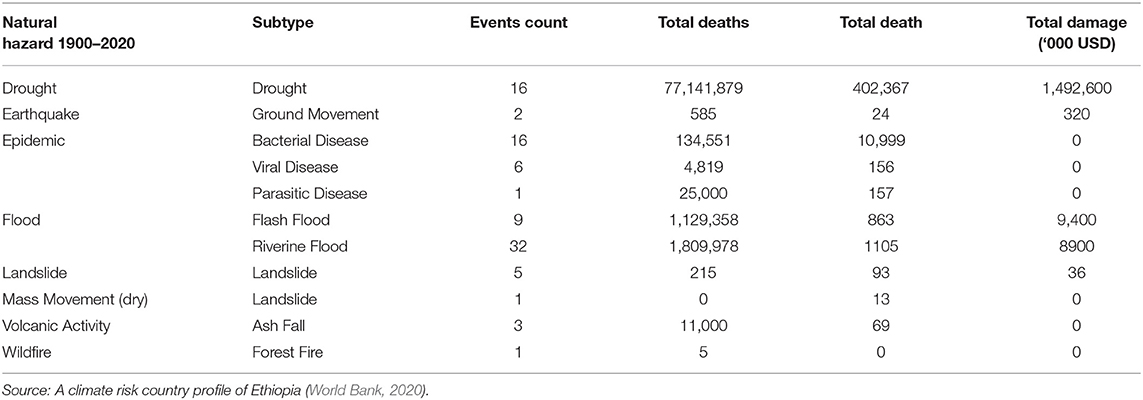
Table 3. Natural disasters in Ethiopia, 1900–2020.
Urbanization Trends and Demographic Dynamics in Ethiopia
Even though Ethiopia is still owning predominantly a rural population, in the previous two decades, urban population in Ethiopia has shown unprecedented growth. According to a world bank report, the Ethiopian urban population increased from 21,609,825 in 2017 to 24,941,349 in 2020. Ethiopian Central Statistics Agency also reported that the share of the urban population is about 20% of the total country's population. As compared to other developing countries, Ethiopia's urbanization level is still in its lowest stage. It is far below the Sub-Saharan Africa average of 37%. However, according to official figures from the Ethiopian Central Statistics Agency, Ethiopian urbanization is also well-known for its highest urban population growth rate that increasing from 3.8% in a year to 5.4% results a tripling of the urban population earlier than 2034 (World Bank Group, 2015).
Recent urbanization-related studies have also suggested that a high growth rate of the urban population will continue and will result in a higher level of urbanization within the coming couple of years. The urban-rural migration, rural village annexation, and informal settlements are expected to change the urban population growth dynamics. According to Angel et al. (2013), regional capital cities in Ethiopia are expected to grow more than three times the 2010 population size by 2040. For example, Hawassa will grow to more than 6-fold its 2010 population by 2040 and Mekelle to almost 5-fold of its 2010. All in all, Ethiopian urbanization is experiencing rapid population growth, and there is an increase in medium, small, and emerging urban centers. Based on the 2007 national census, the Ethiopian Central Statistics Agency officially recognized a total of 973 urban centers in Ethiopia. Today, there are about 1,119 urban centers. These realities have already started to impact the demand and supply of any resource flow in the urban areas. Particularly, the gap between water supply and demand is huge in most urban centers of Ethiopia (Ethiopian Panel on Climate Change, 2015).
Materials and Methods
Description of the Study Area
Ethiopia, sometimes known as the Horn of Africa, is a country in northern Africa (Figure 2). Ethiopia is bordered on the north by Eritrea, on the northeast by Djibouti, on the east by Somalia, on the south by Kenya, and on the west by South Sudan and Sudan. Ethiopia has 12 river basins, with a total annual runoff volume of 122 billion m3 and a groundwater potential of 2.6–6.5 billion m3. Ethiopia has enormous water resources and is home to the headwaters of many transnational rivers, including the Nile. Tana (Abay Basin) is Ethiopia's largest lake and a significant water source for the Nile River. In the Nile and Rift Valley Basins, Ethiopia has 1.8 million hectares of wetlands and floodplains. The country has a total area of 1,126,829 square kilometers. With a population of almost 110 million people, it is Africa's second-most populous country after Nigeria. Ethiopia's population growth rate (4.5%) is far above the global average and among Africa's highest. Ethiopia is one of Africa's least urbanized countries, with only 20% of the total population living in urban centers. Urbanization is anticipated to double in the next few decades. As a result, the country's future development and water resource use will be shaped by the dual pressures of rapid urbanization and high population increase, as well as climate change.
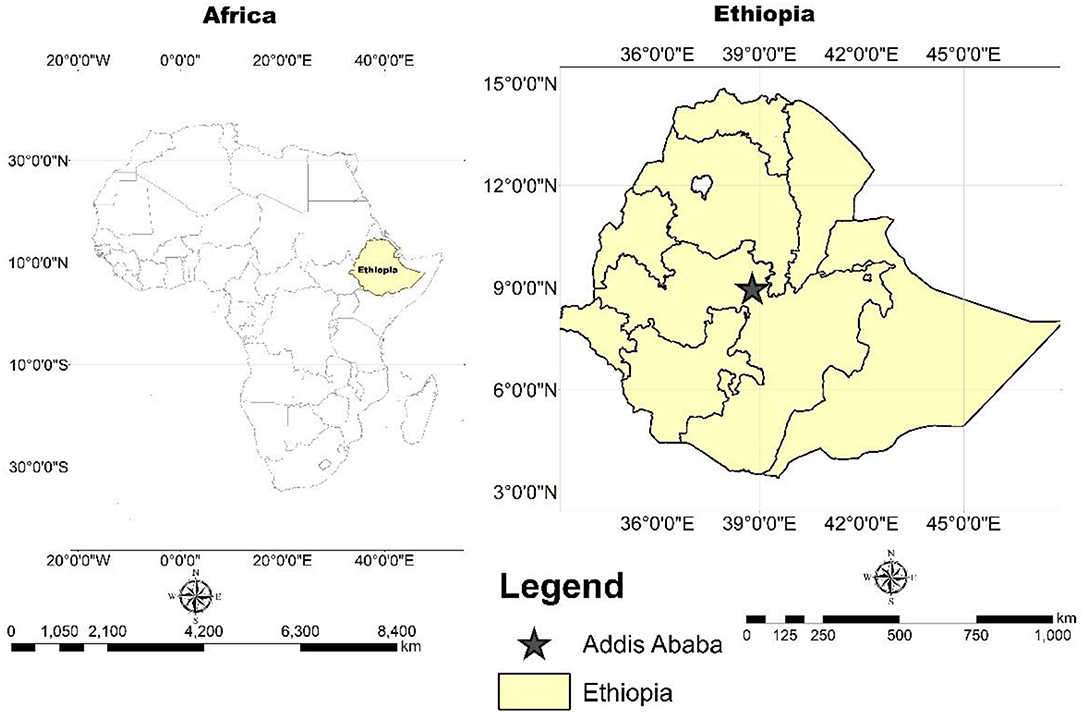
Figure 2. A location map of Ethiopia.
Data Source and Collection Method
Data Source
The researchers used a deductive exploratory (quantitative) research technique that was supported by secondary data review and spatial analysis using GIS and remote sensing techniques. The secondary data review is conducted using desk review and a literature review of “Water Availability Indices.” The desk review is used to collect, organize, and synthesize the available water-related information. As a result, the researchers gain a better understanding of the country's context, water risk priorities, and water stewardship trends. Scanning the literature, analyzing secondary data, and converting analog (hardcopy) maps to digital maps are also important steps in this data collection process. The “Water Availability Indices” literature review is also utilized to adopt related water stress measurement indicators, such as Fresh Water Withdrawal-to-Availability Ratio (WTA), Fresh Water Withdrawal-to-Availability Ratio (WTA) with Environmental Water Requirement, and Falkenmark Indicator, whereas spatial analysis, also known as locational analysis, is used to create geographical data and generate various maps and quantitative evidence to understand where water risk situations occur, map the distribution of urban centers in water risk zones, and visualize the interrelationships between urban centers' location and water resource potential at the country and basin levels through maps. The study also makes use of official data from global, regional, and country-level sources. The global data are obtained from the AQUASTAT database of FAO and World Resource Institute (water resource); country data are obtained from the Ethiopian Ministry of Water, Irrigation and Energy, Ethiopian Ministry of Water Development Commission, Ethiopian Central Statistics Agency, Ethiopian Meteorology Agency, Ethiopian Ministry of Urban Development and Construction (MUDC) and EthioGIS Map-Server Ethiopia (Table 4).
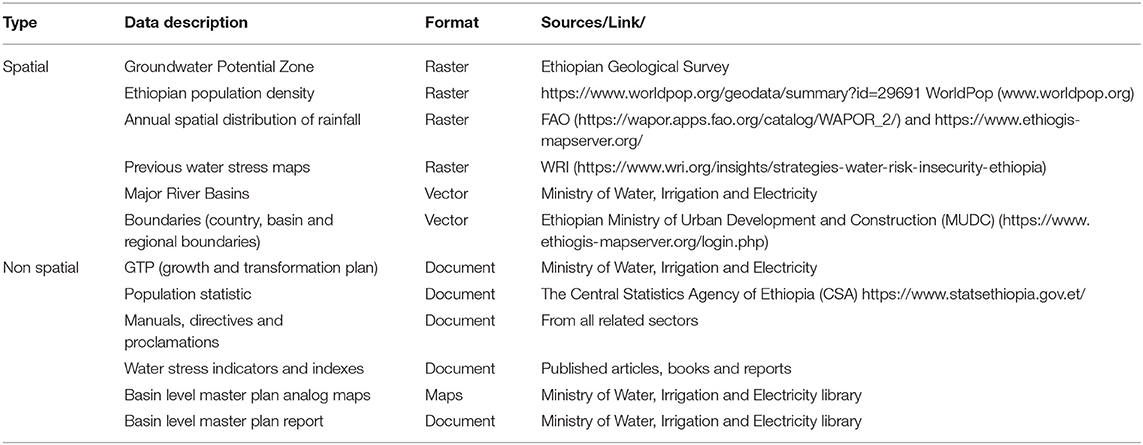
Table 4. Spatial and non-spatial data sources.
Methods to Estimate Water Stress at Country and Basin Levels
A combination of two complementary “water stress-” measuring indexes termed “Water Availability Per Person Index” and “Water Stress Index with Environmental Water Requirement” are used to measure water stress at the country and basin levels. FAO and UN Water (2021) agreed on a technique for estimating water stress based on water withdrawals. The ratio between total freshwater withdrawal (TFWW) by all key sectors and total renewable freshwater resources (TRWR) when environmental flow needs (EFR) are taken into account is the formula expressed by Equation 3. The “Water Availability Per Person Index,” also known as the “Falkenmark Indicator,” is used to calculate basin-level “water stress.” Only the “Water Availability Per Person Index” was used to quantify water stress at the basin level due to a lack of precise data on water extraction in each basin (Figure 3).
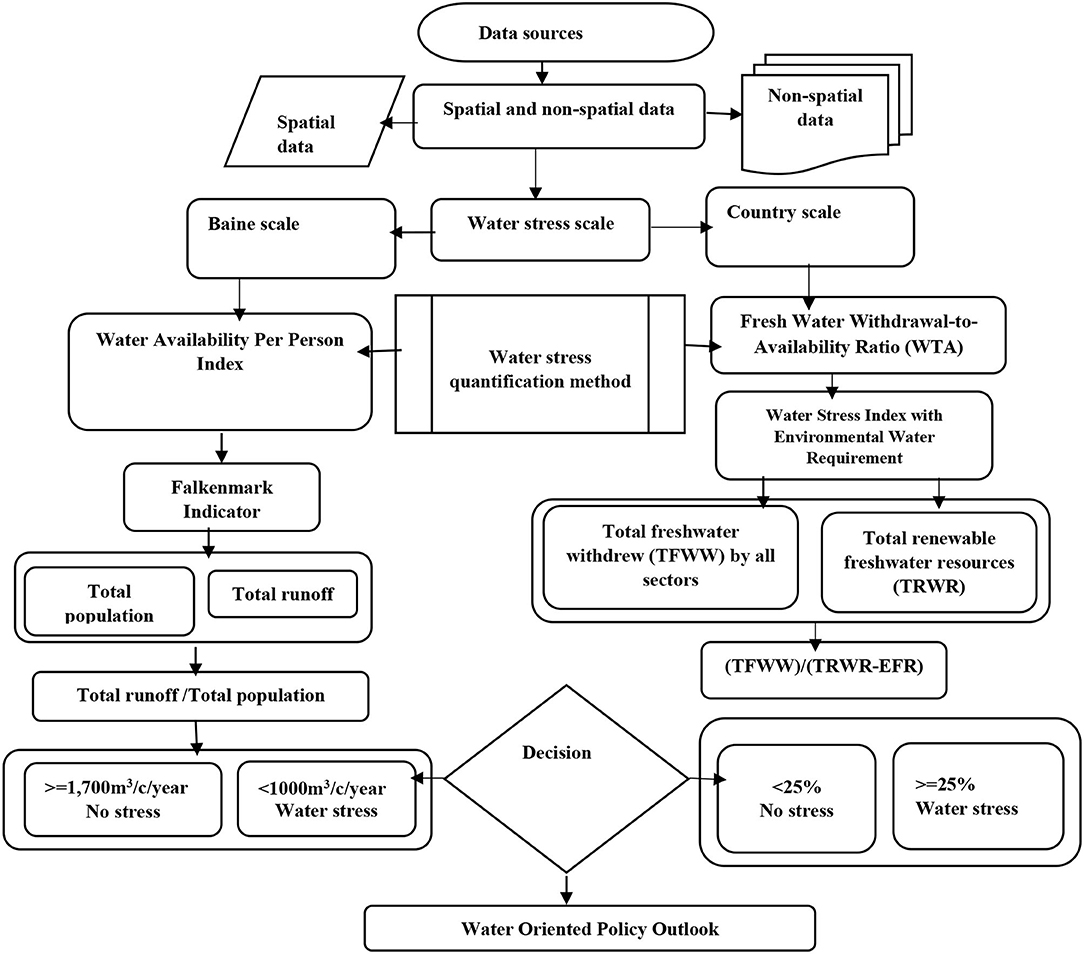
Figure 3. A flow chart of methodological approach to estimate a water stress level at basin and country levels.
Results and Discussion
Distribution of Urban Centers at a Major Basin Level
The relationship between urbanization and the distribution of urban centers at the basin level in Ethiopia has not been adequately researched. Understanding and defining water resource allocation strategy in the face of rising urbanization and climate change require knowing the percentage of the urban population and the number of urban centers in each basin (McDonald et al., 2014). This study also attempts to map and quantify the number of urban centers in each basin based on these considerations (Figure 4). As a result, out of Ethiopia's 1,119 urban centers, this study found that:
• 194 urban centers (17%) are located in the Abay basin.
• 175 urban centers (16%) are located at the GenaleDawa basin.
• 140 urban centers (13%) are located at the Omo-gibe basin.
• 115 urban centers (10%) are located at the Awash basin.
• 114 urban centers (10%) are located at the Wabishebele basin.
• 55 urban centers (5%) are located in the Baro-Akobo basin.
• 8 urban centers (1%) are located in the Mereb basin.
• 61 urban centers (6%) are located in the Rift valley basin.
• 78 urban centers (7%) are located in the Tekeze basin.
• 178 urban centers (15%) are located in the dry basins, such as Danakil, Ogaden, and Aysha.
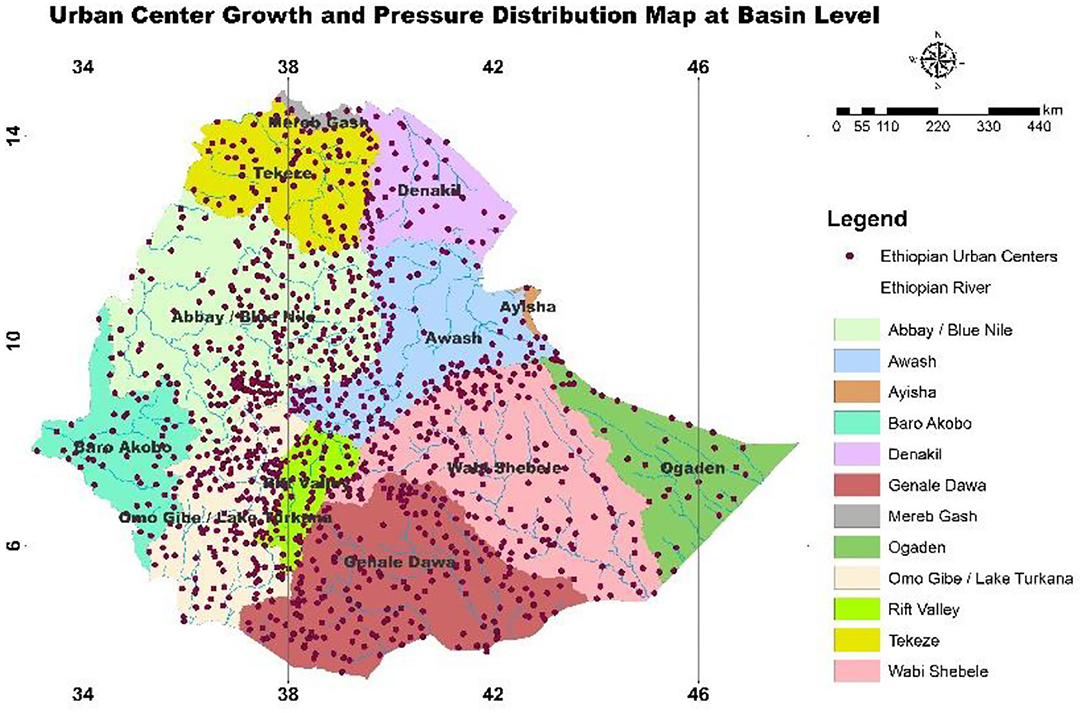
Figure 4. Distribution of urban centers by major river basins. Source: GIS analysis by superimposing urban centers and basin thematic layers (2022).
According to previous basin level studies, four basins in Ethiopia, the Abbay, Baro-Akobo, Mereb, and Tekeze basins cover around 40% of the country's spatial extent and 70% of the country's surface water sources, where the population size is no more than 30–40%. Genale-Dawa and Wabishebel basins cover ~33% of the country's spatial extent and 8% of the country's surface water sources (Ayalew, 2018). Two basins, The Omo-Gibe and Rift Valley Lake basins, cover around 4% of the country's land area and 18% of the country's surface water sources. The awash basin covers around 10% of the country's land area and 4% of the country's surface water sources. Meanwhile, the three eastern river basins of Afar-Danakil, Aysha, and Ogaden, which are nearly dry, represent around 13% of the country's total area (Melesse et al., 2013).
Groundwater Potential Zones and Distribution of Urban Center of Ethiopia
This study looks at the relationship between groundwater protentional distribution and urban center spatial locations. As a result of the analysis, it appears that there are a substantial number of urban centers located in a low groundwater potential zone that is exposed to groundwater stress (Figure 5). The GIS spatial analysis, which involved superimposing urban centers and groundwater potential zone layers, revealed the following facts:
• Approximately 25,562,371 (23%) of the total population resides in low groundwater potential.
• Approximately 84,437,629 (77%) of the population resides in moderately and high groundwater potential.
• Approximately 5,112,473 (20.35%) urban population and 369 (33%) urban centers reside in low groundwater potential zones.
• Approximately 20,006,437.70 (79.65%) urban population and 750 (77%) urban centers are located in moderate to high groundwater potential zones.
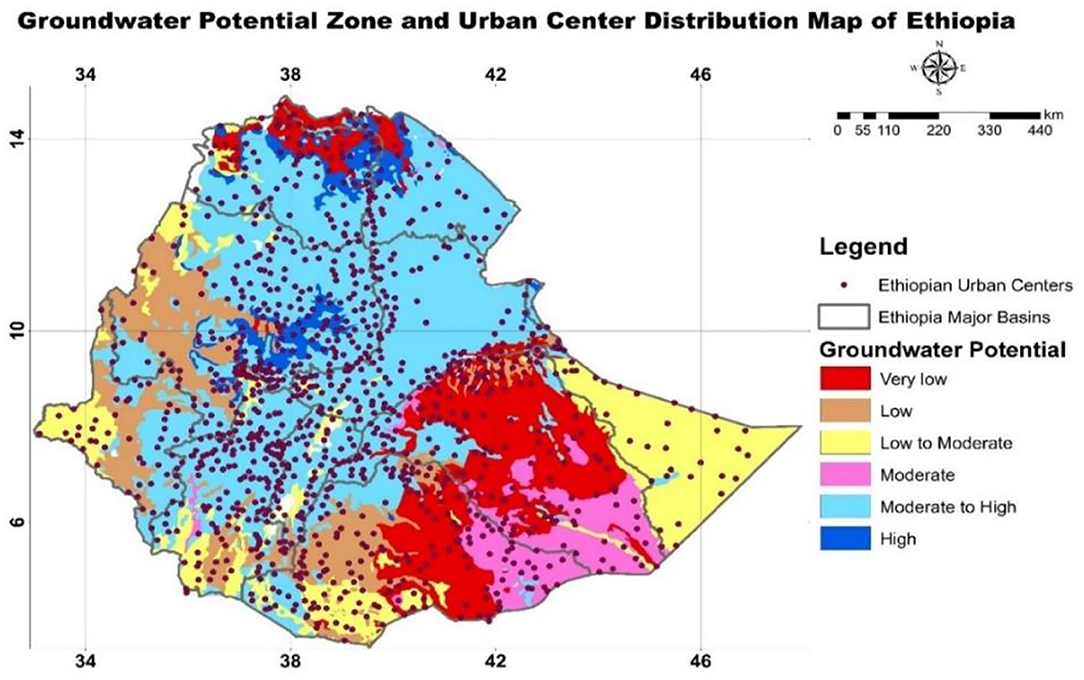
Figure 5. The groundwater resource potential of Ethiopia. Source: FDRE National Planning Commission (2016); Kebede et al. (2018).
In low-income countries, groundwater is frequently regarded as the primary source of local water supply (Carrard et al., 2019). Similarly, both urban and rural Ethiopians rely on groundwater for 70–80% of their household water supply. However, due to increased extraction and consumption, groundwater in urban areas is under severe pressure, resulting in water stress (Mengistu et al., 2021). Furthermore, despite the fact that groundwater research in Ethiopia is scarce, there is widespread agreement that unequal spatial distribution of groundwater potential leads to uneven water stress distribution (Razack et al., 2020). The most vulnerable to groundwater stress are urban areas (Herbert, 2019). According to Zablon et al. (2021), six of the 10 capital cities are located in locations with high or extremely high water stress.
Annual Spatial Distribution of Rainfall and Distribution of Urban Centers in Ethiopia
In Ethiopia, even though much research has been conducted on rainfall and its spatial distribution, there are limited pieces of research that deal with the link between the annual spatial distribution of rainfall and the distribution of urban centers and their susceptibility to the occurrence of water stress. This research analyzes the spatial trends of rainfall and their association with the distribution of urban centers in Ethiopia. Based on the spatial analysis (Figure 6), this research found that:
• Approximately 315 urban centers (28.15%) are located in an area that receives <100-mm mean annual rainfall.
• Approximately 487 urban centers (43.52%) are located in an area that receives 100–200-mm mean annual rainfall.
• Approximately 317 urban centers (28.33%) are located in an area that receives >2,300 mm.
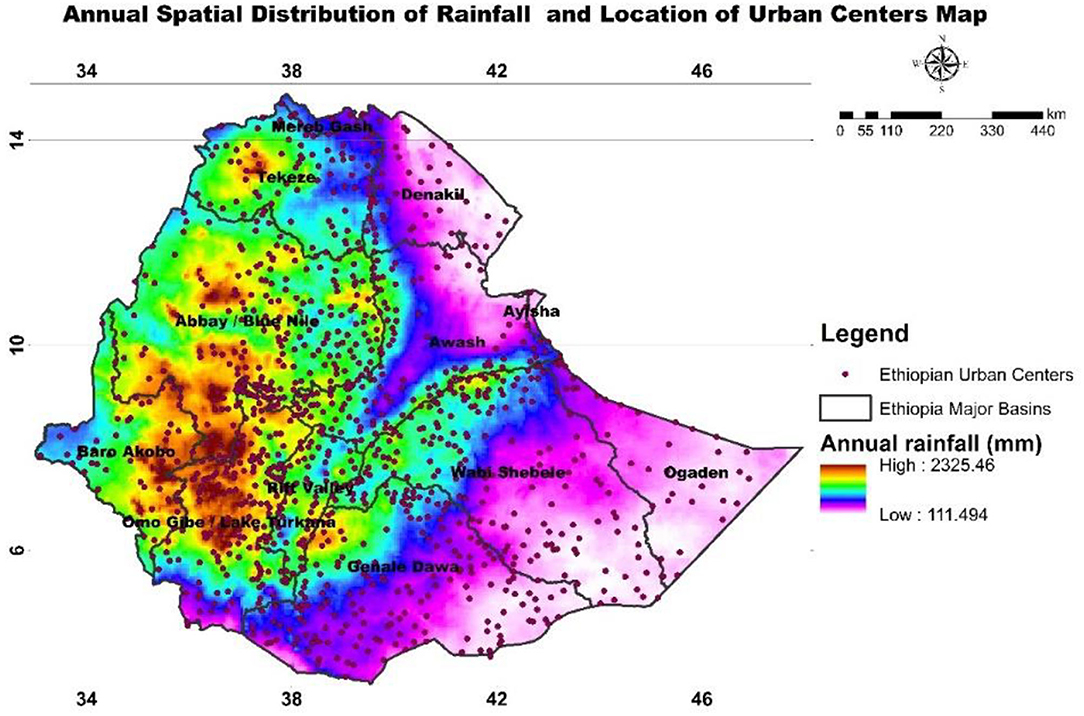
Figure 6. Spatial variability of the mean annual rainfall in Ethiopia and location of urban centers. Source: the FAO dataset.
Rainfall variability in Ethiopia influences surface water and groundwater distribution potential (Weldegerima et al., 2018). According to Melesse et al. (2013), the magnitude of the mean annual rainfall in Ethiopia's southeast, east, and northeast borders is as low as 200 mm and primarily encompasses dry basins, such as Afar-Danakil, Aysha, and Ogaden. This means that urban areas receiving <200 mm of yearly rainfall are experiencing water stress. Adane et al. (2021) also stated that Ethiopian urban centers are and will be extremely sensitive to water-related threats now and in the coming decades.
Water Resources, Climate Change, and Urbanization in Ethiopia
Ethiopia is now considered one of the world's most drought-prone countries as a result of erratic and uneven rainfall distribution as well as increasing climate change (World Bank, 2018; Figure 7). This study also attempted to assess the urban settlement pattern concerning Ethiopia's drought likelihood map and found:
• Approximately 307 urban centers (28%) are located in high-drought probability areas.
• Approximately 438 urban centers (39%) are located in medium drought probability areas.
• Approximately 374 urban centers (33%) are located in low-drought probability areas.
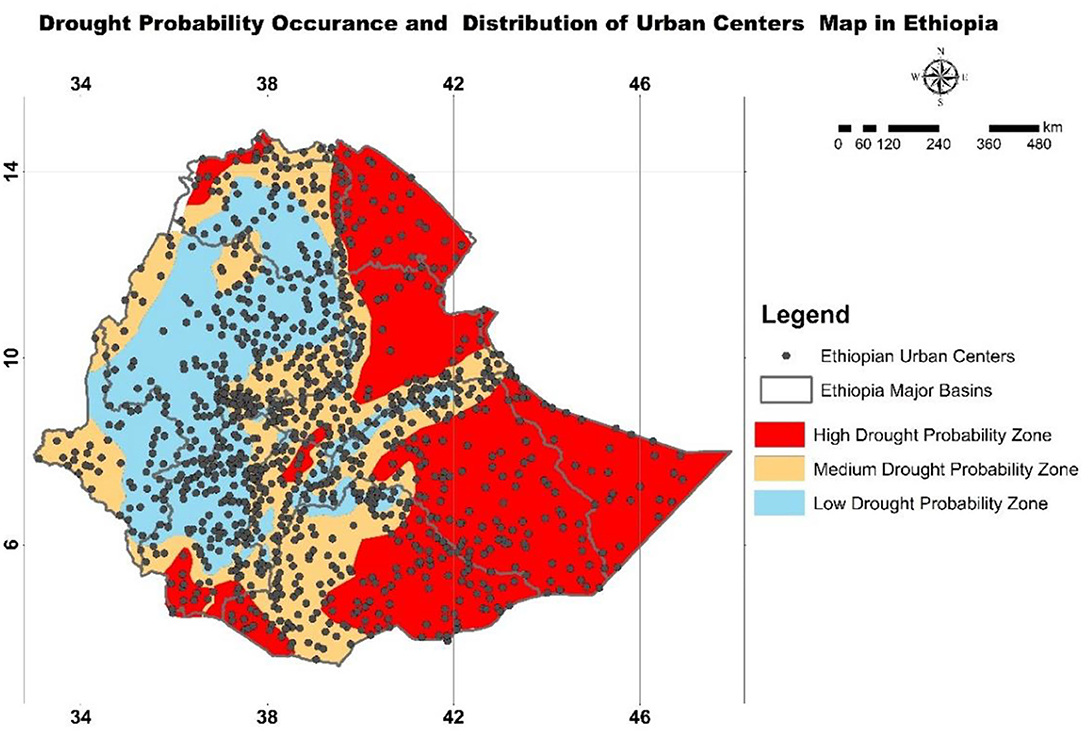
Figure 7. A drought probability map of Ethiopia and location of urban centers. Source: A drought probability map adopted from Ministry of Water Resources National Meteorological Agency (2007).
According to the World Bank (2019), climate change is having a significant influence on Ethiopia's water resources, wetlands, and ecology. Ethiopia is ranked 5th out of 184 countries in terms of drought occurrence. Since 2010, 12 catastrophic droughts have killed over 400,000 individuals and affected over 54 million people, according to reports (World Bank Group, 2021). Ethiopia has regularly faced catastrophic occurrences, such as droughts and floods, as well as rainfall variability and rising temperatures, all of which have harmed livelihoods (Ministry of Environment Forest, 2015).
Climate change is causing higher rainfall and increased flood hazards in Ethiopia, particularly in lowland areas (Ethiopian Panel on Climate Change, 2015). This study also attempted to investigate the spatial distribution of urban centers with Ethiopia's flood-prone map (Figure 8) and discovered that:
• Approximately 307 urban centers (27%) are located in major flooding areas.
• Approximately 317 urban centers (28%) are located in moderate flooding areas.
• Approximately 186 urban centers (17%) are located in minor flooding areas.
• Approximately 309 urban centers (28%) are located in the safest areas.
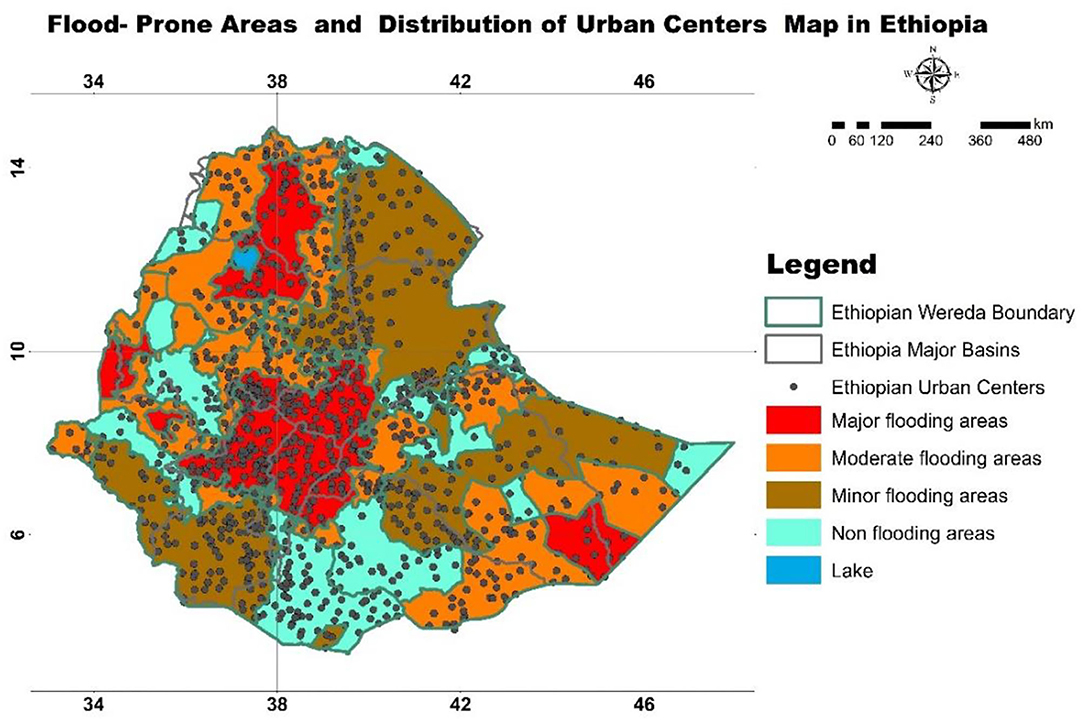
Figure 8. Flood-prone areas in Ethiopia. Source: Adopted from Ethiopian Development Research Institute/Global Green Growth Institute (EDRI/GGGI) (2015).
Ethiopia is also prone to flooding, ranking 34th out of 162 countries in terms of flooding risk and 5th in terms of landslide risk (World Bank, 2019). Natural disasters like flooding and drought, along with uneven topography, result in a population that is highly marginalized (WBG Climate Change Knowledge Portal, 2020). Domestic water supplies, such as deep and hand-dug wells, irrigation canals, and developed and undeveloped springs, are, on the other hand, decreasing in quantity due to delayed rainfall and reduced rainfall levels (Nanki et al., 2010). Climate change has a noticeable impact on urban infrastructure in that severe rainfall is a typical occurrence, causing floods and causing damage to urban infrastructures like roads and ridges (World Bank, 2010).
Country-Level Water Stress: Analyzed Using the Falkenmark Index (Water Availability per Person per Year
This analysis uses Falkenmark's technique of “Water Availability Per Person Index” and “Fresh Water Withdrawal-to-Availability Ratio (WTA),” with “Environmental Water Requirement” indexes to assess water stress at the country level. The first method takes into account a country's total population to total yearly runoff ratio. In this context, Ethiopia's overall population is estimated to be 110 million people, while the country's total annual surface runoff is anticipated to be around 122 billion m3. Using the Falkenmark index, the annual water availability per person is calculated to be 1,109 m3. According to Falkenmark (1986), water stress occurs when yearly water availability falls below 1,700 m3 per person, water scarcity happens when annual water availability falls below 1,000 m3 per person, and absolute scarcity occurs when annual water availability falls below 500 m3. As a result of the water availability per-person-index water stress indicators, Ethiopia is currently experiencing water stress.
Country-Level Water Stress: Analyzed Using Fresh Water Withdrawal-to-Availability Ratio (WTA) With Environmental Water Requirement
Ethiopia's annual freshwater withdrawal is estimated to be 10.55 billion cubic meters per year, with a total renewable freshwater resource (TRWR) of 122 billion cubic meters per year (the sum of TRWR and ERWR). Total annual water withdrawals in Ethiopia grew from 5.6 billion cubic meters in 1997 to 10.5 billion cubic meters in 2017. The water withdrawal-to-availability ratio is calculated using these figures and Equation 3. Based on the stated indicator and equation, the water withdrawal-to-availability ratio with environmental water requirement is found to be 13% (Table 5). According to UN-Water (2021), if the yearly freshwater withdrawal-to-availability ratio is <25%, it is deemed to be under no stress. Meanwhile, the country is considered water-stressed when the numbers exceed 25%. As a result, Ethiopia is not experiencing water stress at present time. Water stress on a wide scale, such as country, region, and global levels, on the other hand, is less likely to provide accurate information about water stress since the detailed variability that exists at major basin levels in a country can be obscured (FAO and UN Water, 2021).
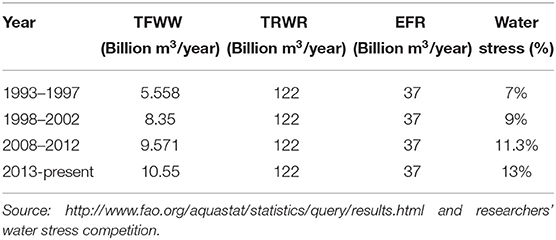
Table 5. Total renewable freshwater resources (TRWR) and total freshwater withdrawn (TFWW) of Ethiopia and its implication for water stress.
Basin-Level Water Stress: Analyzed Using the Falkenmark Index
Measuring water stress at the national level yields a crude answer that ignores the country's uneven distribution of water resources. As a result, assessing the water stress at the basin level must be done at the same time. The total basin population and total yearly surface runoff must be known to assess basin-level water stress. The total annual surface runoff of each basin is obtained from published data (Melesse et al., 2013; Ayalew, 2018). The total population of each basin was calculated using the WorldPop population density grid map (www.worldpop.org). By combining the population number and annual discharge of each basin (Figure 9 and Table 6), this study found that:
• A population of about 45,643,966 (41.6%) live at basins that are under absolute water scarcity that receives <500 m3 per capita per year.
• A population of about 31,897,939 (29%) live in a water-scarce basin that receives 500–1,000 m3 per capita per year.
• A population of about 27,125,642 (24.6%) live in a stressed basin that receives 1,000–1,700 m3 per capita per year.
• A population of about 5,332,450 (4.8%) lives in a no-water stress basin that receives >1,700 m3 per capita per year.
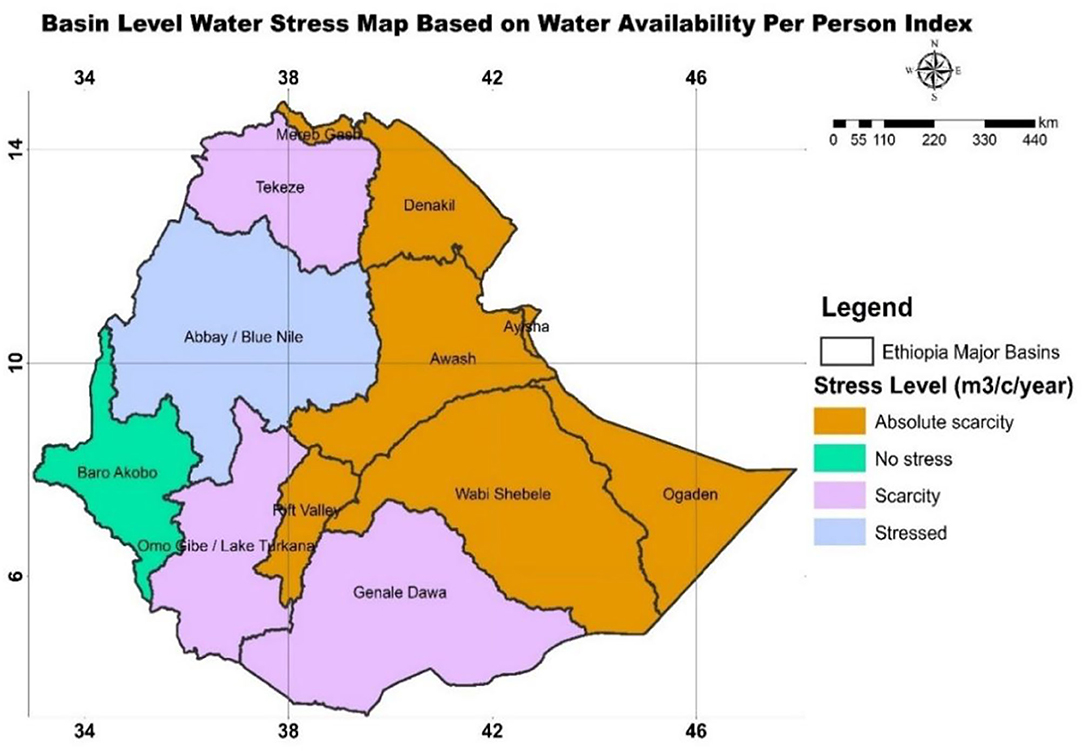
Figure 9. A basin-level water stress map based on water availability per person index. Source: Researchers' basin-level water stress estimation using (Falkenmark, 1989) and researchers GIS spatial analysis (2022).
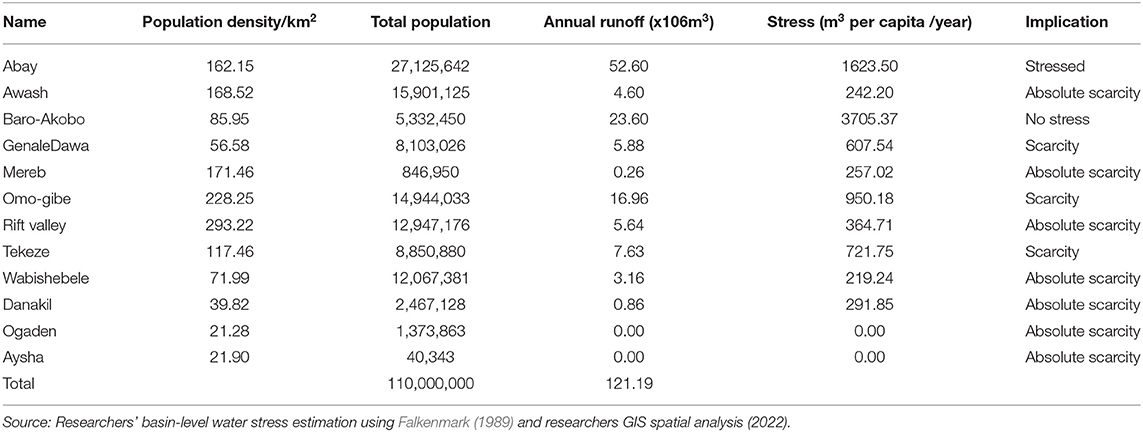
Table 6. A level of water stress at major river basins of Ethiopia.
Among all basins,
• Awash, Mereb, Rift valley, Wabishebele, Danakil, Ogaden, and Aysha basins are faced with absolute water scarcity that receives <500 m3 per capita per year.
• Genale Dawa, Omo-gibe, and Tekeze basins are categorized under scarce water basins, which offer 500–1,000 m3 per capita per year.
• Abay basin belongs to the water stress category that offers 1,000–1,700 m3 per capita per year.
• The Baro-Akobo basin is the only basin in the country that is not challenged by water stress.
In this context, FAO (2016) stated that all river basins, with the exception of the Nile, are experiencing water shortages. The Awash Basin is also one of Ethiopia's most water-stressed basins (Sustainable Water Partnership, 2021). According to World Bank (2020), the WabiShebele River basin has the largest area coverage and is classified as water scarce due to low annual flow. According to Awulachew et al. (2007) three of the 12 major river basins, the Ogaden, Aysaha, and Danakil, are designated dry basins.
Limitation and Future Research Direction
The analysis results of this investigation have key limitations and considerations. First, the Falkenmark indicator was used to quantify basin-level water stress analysis. Water stress caused by the freshwater withdrawal-to-availability ratio was not measured due to a lack of data on water withdrawal in each basin. Second, the water stress map only depicts physical water shortage and ignores economic water scarcity, and, third, total renewable water resources do not include lakes and other water reservoirs. As a result, future research will be focused on overcoming these limitations.
Conclusion and Way Forward
Climate change, in combination with urbanization and laissez-faire water management, is already worsening water risks. In many ways, the worst effects of the combined variables will persist as long as current water management practices remain unchanged. As a result, a better water-centric policy is required across all sectors, such as climate change adaptation, water management, and disaster risk reduction to manage water-related risks. Tracking water risks, such as water stress, drought, and flooding features, is a crucial prerequisite for such policy orientation. Most significantly, determining the level of water stress in a given geographic area requires mapping and quantifying the water stress level. Due to the dynamic nature of water stress, even a country or basin that appears to be safe today might become a water stress hotspot unless quick water-centric corrective policies are implemented. As most developing countries are responsible for rising urbanization, developing countries are on the front lines to face the numerous challenges of water risks. The same is true for Ethiopia, which seems, at face value, a non-stressed country. There are real concerns in Ethiopia that the country as a whole and its basins in particular and significant urban centers are experiencing water stress, such as:
• At the country level, the seemingly safe water-stress level statistic masks true water stress in important river basins.
• Water stress is a dynamic and cross-cutting issue that is always changing in response to population and environmental factors.
• More water-stressed basins are being created in the country as a result of spatial and temporal rainfall irregularities.
• Uneven surface and groundwater potential distribution is undermining urban livability. Furthermore, the increasing urban population and climate change are expected to worsen water-related problems in the country in the future decades.
In general, this research suggests that the combination of a population, exceeding 110 million people with unwise water resource management, could result in a water crisis. As a result, this possibility necessitates a rethinking of water policy that incorporates community water use attitudes, water-saving technology, water-sensitive regional planning, and water-centric legal frameworks that can provide short- and long-term solutions to alleviate ongoing water stress before it becomes irreversible. The following section discusses potential measures for reducing growing water stress in developing countries, in general, and Ethiopia, in particular.
Integrating Groundwater Development With Water-Sensitive Land Use Planning
In developing countries, urban expansion, increasing water demand, along with unguided spatial planning practices are threatening the sustainability of groundwater. Therefore, a development plan that integrates both groundwater development and spatial planning is mandatory. In areas where there is continuous groundwater utilization and pollution, protection and rehabilitation plans are required. For this, the following actions are important:
• Preparing and implementing groundwater management plans at national, regional, and city scales.
• Groundwater management should be based on an integrated water management approach that includes surface water, conservation, water quality, and reuse management strategies.
• Establishing a groundwater budget model and a water-sensitive management plan for its long-term sustainable utilization that minimizes its long-term overdraft.
• Promoting water-wise groundwater utilization in all sectors, such as agriculture and industry and domestic water users.
Revision of Basin Master Plans and Optimizing River Basin Planning and Water Allocation
In a time of climate change, intensified water use, and uncontrolled land-use change, ensuring sustainable water management at all spatial scales is a challenging task. To address this challenge, there should be integrated basin-scale master plans that take into consideration the range of water utilization. There are indications that the water withdrawal is exceeding the available water in most basins, and they are becoming stressed due to prolonged droughts and more extreme rainfall events. To confront these challenges, a basin master plan that responds to the growing water demand and business as usual water withdrawal is important. The following points are important to ensure efficient water allocation.
• Special attention should be given to drought-prone and water-stressed basins.
• Introducing and implementing demand management measures to improve water use efficiency in all water-using sectors.
• Promoting appropriate watershed management practices to promote water conservation, maximize water yields, and improve water quality.
• Establishing appropriate and effective river basin management institutions.
• Developing and enacting suitable legislation that will provide an enabling framework for sustainable and effective water resources development and management.
Developing and Implementing Comprehensive Plan of Action to Address Water-Related Disasters
• Undertaking frequent and systematic forecasting of floods and installing automatic recorders at the strategic sites in the flood-prone areas to record flood levels.
• Determining flood characteristics of the area and issuing timely flood warnings and establishing flood-plain zoning.
• Explore options for possible transfer of water from water surplus regions to drought-prone or water-deficit areas.
• Develop and implement schemes that encourage voluntary resettlement of people from water-scarce areas to water surplus areas.
Linking “Top-Down” and “Bottom-Up” Approaches of Water Management Practices
So far, microscale water conservation measures have been used to restore water bodies and water shades. However, such techniques are not connected to bigger water conservation efforts that encompass river basins and other bodies of water. As a result, a more comprehensive and top-down water management policy should be backed up with bottom-up and indigenous water conservation practices. The two most essential characteristics that pave the way for integrated water management systems are the expansion of local knowledge and nature-based solutions at the local level.
Ensuring a Balance Between Freshwater Withdrawals and Available Water Resources
As previously stated, Ethiopia's water resources are unevenly distributed. The majority of the country's water development demands are carried by a few basins, resulting in an imbalance between water withdrawal and availability. To prevent tipping the scales, the government should rethink its water-related development goals in light of future sustainable water development goals.
Build Urban Water Resilience Strategies
The globe, as well as local contexts, is currently under the influence of urbanization. Hence, water development strategy should unquestionably be following urban growth prospects. Water management in urban areas is tilted toward the “supply side,” which is incompatible with long-term development. As a result, water resources are periodically depleted. This seeks to shift from a “supply-side” to a “demand-side” water management approach, which can be achieved by (i) increasing the efficiency of each water use, (ii) lowering losses in the water supply distribution networks, (iii) establishing a “water-sensitive community” through education, and (iv) introducing low-cost water-saving devices, such as water-saving toilets, faucets, and low-flow showers.
Data Availability Statement
The raw data supporting the conclusions of this article will be made available by the authors, without undue reservation.
Ethics Statement
The animal study was reviewed and approved by respect the codes. Written informed consent was obtained from the owners for the participation of their animals in this study.
Author Contributions
TA contributed as PhD student. AT and GE contributed as supervisors. All authors contributed to the article and approved the submitted version.
Funding
This research is part of Ph.D. work under the supervision of Addis Abba University.
Conflict of Interest
The authors declare that the research was conducted in the absence of any commercial or financial relationships that could be construed as a potential conflict of interest.
Publisher's Note
All claims expressed in this article are solely those of the authors and do not necessarily represent those of their affiliated organizations, or those of the publisher, the editors and the reviewers. Any product that may be evaluated in this article, or claim that may be made by its manufacturer, is not guaranteed or endorsed by the publisher.
Acknowledgments
The authors are grateful to the Ethiopian Ministry of Water, Irrigation and Energy, Ethiopian Ministry of Water Development Commission, and Ethiopia Metrology Agency.
References
Abd El Mooty, M., Kansoh, R., and Abdulhadi, A. (2016). Challenges of water resources in Iraq. J. Waste Water Treat. Anal. 7:260. doi: 10.4172/2157-7587.1000260
Abebe, Y. D., and Geheb, K. (2003). Wetlands of Ethiopia. Wetlands of Ethiopia. Proceedings of a Seminar on the Resources and Status of Ethiopia's Wetlands. Nairobi: IUCN Publication.
Adane, Z., Yohannes, T., and Swedenborg, E. (2021). Balancing Water Demands and Increasing Climate Resilience: Establishing a Baseline Water Risk Assessment Model in Ethiopia. Washington, DC: World Resources Institute. doi: 10.46830/writn.19.00123
Adeba, D., Kansal, M. L., and Sen, S. (2015). Assessment of water scarcity and its impacts on sustainable development in Awash basin, Ethiopia. Sustain. Water Resour. Manag. 1, 71–87. doi: 10.1007/s40899-015-0006-7
Angel, S., Groot, D., Martin, R., Fisseha, Y., Taffese, T., and Lamson-Hall, P. (2013). The Ethiopia Urban Expansion Initiative : Interim Report 2.
Asian Development Bank. (2015). Water-Related Disasters and Disaster Risk Management in the People's Republic of China. Available online at: https://www.adb.org/sites/default/files/publication/177695/water-related-disasters-prc.pdf
Assefa, Y. T., Babel, M. S., Sušnik, J., and Shinde, V. R. (2018). Development of a generic domesticwater security index, and its application in Addis Ababa, Ethiopia. Water 11:w11010037. doi: 10.3390/w11010037
Awulachew, S. B., Yilma, A. D., Loulseged, M., Loiskandl, W., Ayana, M., and Alamirew, T. (2007). Water Resources and Irrigation Development in Ethiopia. Available online at: https://dlc.dlib.indiana.edu/dlc/bitstream/handle/10535/4738/WP123.pdf?sequence=1 (accessed November 07, 2021).
Ayalew (2018). Theoretical and empirical review of Ethiopian water resource potentials, challenges and future development opportunities. Int. J. Waste Resour. 8:353. doi: 10.4172/2252-5211.1000353
Baynes, T. M., and Musango, J. K. (2018). Estimating current and future global urban domestic material consumption. Environ. Res. Lett. 13:aac391. doi: 10.1088/1748-9326/aac391
Berhanu, B., Seleshi, Y., and Melesse, A. (2014). Surface water and groundwater resources of ethiopia: potentials and challenges of water resources development. In: Melesse, A., Abtew, W., Setegn, S. (eds). Nile River Basin. Springer, Cham. doi: 10.1007/978-3-319-02720-3_6
Boretti, A., and Rosa, L. (2019). Reassessing the projections of the World Water Development Report. Npj Clean Water 2:9. doi: 10.1038/s41545-019-0039-9
Carrard, N., Foster, T., and Willetts, J. (2019). Groundwater as a source of drinking water in Southeast Asia and the Pacific : a multi-country review of current reliance and resource concerns. Water 11:1605. doi: 10.3390/w11081605
Christopher, W. T.. (2006). Water Stress in Sub-Saharan Africa. Available online at: https://www.cfr.org/backgrounder/water-stress-sub-saharan-africa (accessed December 15, 2021).
Cosgrove, W. J., and Loucks, D. P. (2015). Water Resources Research. (New York: American Geophysical Union) 4823–4839. doi: 10.1002/2014WR016869
Damkjaer, S., and Taylor, R. (2017). The measurement of water scarcity: defining a meaningful indicator. Ambio 46, 513–531. doi: 10.1007/s13280-017-0912-z
Dile, Y. T., Berndtsson, R., and Setegn, S. G. (2013). Hydrological response to climate change for Gilgel Abay River, in the Lake Tana Basin - Upper Blue Nile Basin of Ethiopia. PLoS ONE 8, 12–17. doi: 10.1371/journal.pone.0079296
Ethiopian Development Research Institute/Global Green Growth Institute (EDRI/GGGI). (2015). Unlocking the Power of Ethiopia's Cities. Ethiopia's New Climate Economy Partnership, EDRI/GGGI. Available online at: https://www.open.edu/openlearncreate/mod/oucontent/view.php?id=79983
Ethiopian Panel on Climate Change (2015). First Assessment Report, Working Group II - Agriculture and Food Security. 1, 230. Addis Ababa.
FAO (2012). Coping With Water Scarcity An Action Framework for Agriculture and Food Security. Available online at: https://www.fao.org/3/i3015e/i3015e.pdf (accessed December 15, 2021).
FAO (2016). AQUASTAT Country Profile – Ethiopia. Available online at: https://www.fao.org/3/i9732en/I9732EN.pdf (accessed December 15, 2021).
FAO (2017). Water for Sustainable Food and Agriculture : A Report Produced for the G20 Presidency of Germany. Available online at: https://www.fao.org/3/i7959e/i7959e.pdf (accessed December 15, 2021).
FAO (2018). Progress on Level of Water Stress. Available online at: http://www.unwater.org/app/uploads/2018/08/642-progress-on-level-of-water-stress-2018.pdf (accessed December 26, 2021).
Fazzini, M., Bisci, C., and Billi, P. (2015). The climate of Ethiopia. World Geomorphol. Landscapes 3, 65–87. doi: 10.1007/978-94-017-8026-1_3
FDRE National Planning Commission. (2016). EthioGIS MapServer EthiopiaWeb Service for On- and Offline Mapping.
FDRE-MWR (2002). Water Sector Development Program - Main Report. Report, I(October) 193. Addis Ababa.
Gan, T. Y., Ito, M., Hülsmann, S., Qin, X., Lu, X. X., Liong, S. Y., et al. (2016). Possible climate change/variability and human impacts, vulnerability of drought-prone regions, water resources and capacity building for Africa. Hydrol. Sci. J. 61, 1209–1226. doi: 10.1080/02626667.2015.1057143
Ganivet, E.. (2020). Growth in human population and consumption both need to be addressed to reach an ecologically sustainable future. Environ. Dev. Sustainabil. 22, 4979–4998. doi: 10.1007/s10668-019-00446-w
He, C., Liu, Z., Wu, J., Pan, X., Fang, Z., Li, J., et al. (2021). Future global urban water scarcity and potential solutions. Nat. Commun. 12, 1–11. doi: 10.1038/s41467-021-25026-3
Heidari, H., Arabi, M., and Warziniack, T. (2021). Vulnerability to water shortage under current and future water supply-demand conditions across U.S. River Basins. Earth's Future 9:2021EF002278. doi: 10.1029/2021EF002278
Herbert, C.. (2019). Global Assessment of Current and Future Groundwater Stress With a Focus on Transboundary Aquifers. Frankfurt: AGU100. doi: 10.1029/2018WR023321
Kebede, S., Hailu, A., Crane, E., Ó Dochartaigh, B., and Bellwood-Howard. (2018). Africa Groundwater Atlas: Hydrogeology of Ethiopia. British Geological Survey. British Geological Survey. Available online at: http://earthwise.bgs.ac.uk/index.php/Hydrogeology_of_Ethiopia
Ketema, A., and Dwarakish, G. S. (2021). “Climate change impacts on water resources in Ethiopia,” in Climate Change Impacts on Water Resources: Hydraulics, Water Resources and Coastal Engineering, eds R. Jha, V. P. Singh, V. Singh, L. B. Roy, and R. Thendiyath (Berlin: Springer International Publishing), 47–58. doi: 10.1007/978-3-030-64202-0_5
Kummu, M., Guillaume, J. H. A., De Moel, H., Eisner, S., Flörke, M., Porkka, M., et al. (2016). The world's road to water scarcity: shortage and stress in the 20th century and pathways towards sustainability. Sci. Rep. 6srep38495. doi: 10.1038/srep38495
McDonald, R. I., Weber, K., Padowski, J., Flörke, M., Schneider, C., Green, P. A., et al. (2014). Water on an urban planet: urbanization and the reach of urban water infrastructure. Glob. Environ. Change 27, 96–105. doi: 10.1016/j.gloenvcha.2014.04.022
McNally, A., Verdin, K., Harrison, L., Getirana, A., Jacob, J., Shukla, S., et al. (2019). Acute water-scarcity monitoring for Africa. Water 11:1968. doi: 10.3390/w11101968
Melesse, A. M., Abtew, W., and Setegn, S. G. (2013). Nile River Basin: ecohydrological challenges, climate change and hydropolitics. Nile River Basin 1, 1–718. doi: 10.1007/978-3-319-02720-3_1
Mengistu, H. A., Demlie, M. B., and Abiye, T. A. (2019). Review: groundwater resource potential and status of groundwater resource development in Ethiopia. Hydrology 27, 1051–1065. doi: 10.1007/s10040-019-01928-x
Mengistu, T. D., Chung, I., Chang, S. W., Yifru, B. A., Kim, M., Lee, J., et al. (2021). Challenges and prospects of advancing groundwater research in Ethiopian aquifers: a review. Sustainability 13:11500. doi: 10.3390/su132011500
Ministry of Environment Forest (2015). Ethiopia's Second National Communication to the United Nations Framework Convention on Climate Change (UNFCCC). Available online at: https://unfccc.int/resource/docs/natc/ethnc2.pdf (accessed December 25, 2021).
Ministry of Water Resources National Meteorological Agency. (2007). Climate Change National Adaptation Programme of Action (Napa) Of Ethiopia. Available online at: https://unfccc.int/resource/docs/napa/eth01.pdf
Mulwa, F., Li, Z., and Fangninou, F. F. (2021). Water scarcity in Kenya: current status, challenges and future solutions. OALib 8, 1–15. doi: 10.4236/oalib.1107096
Nadeem, A. B., Bhat, A. A., Nath, S., Singh, B. P., and Guha, D. B. (2016). Assessment of drinking and irrigation water quality of surface water resources of south- journal of civil & environmental assessment of drinking and irrigation water quality of surface water. Hydrol. Proces. 26, 3344–3350. doi: 10.4172/2165-784X.1000222
Nanki, K., Getnet, M., Shimelis, B., Tesfaye, Z., Syoum, G., and Atnafu, E. (2010). Assessing the Effectiveness of Planned Adaptation Interventions in Reducing Local Level Vulnerability. Available online at: https://cdn.odi.org/media/documents/6111.pdf
Nicolau, R., David, J., Caetano, M., and Pereira, J. M. C. (2019). Ratio of land consumption rate to population growth rate-analysis of different formulations applied to mainland Portugal. ISPRS Int. J. Geo-Inform. 8:10010. doi: 10.3390/ijgi8010010
Parsons, T.. (2021). The weight of cities: urbanization effects on earth's subsurface. AGU Adv. 2:277. doi: 10.1029/2020AV000277
Rahimi, E., Barghjelveh, S., and Dong, P. (2021). Estimating potential range shift of some wild bees in response to climate change scenarios in northwestern regions of Iran. J. Ecol. Environ. 45:8. doi: 10.1186/s41610-021-00189-8
Raskin, P., Gleick, P. H., Kirshen, P., Pontius, R. G., and Strzepek, K. (1997). Comprehensive Assessment of the Freshwater Resources of the World. Document prepared for UN Commission for Sustainable Development 5th Session 1997 - Water stress categories are described on. Stockholm: Stockholm Environmental Institute
Razack, M., Furi, W., Fanta, L., and Shiferaw, A. (2020). Water resource assessment of a complex volcanic system under semi-arid climate using numerical. Water 12:276. doi: 10.3390/w12010276
Rijsberman, F. R.. (2006). Water scarcity: fact or fiction? Agri. Water Manag. 80, 5–22. doi: 10.1016/j.agwat.2005.07.001
Schulte, P., and Morrison, J. (2014). Defining Water Scarcity, Water Stress, and Water Risk. Available online at: https://pacinst.org/water-definitions/ (accessed December 25, 2021).
Seifu, A., and Seid, I. A. H. (2006). Analysis of rainfall trend in Ethiopia. Ethiopian J. Sci. Technol. 3, 15–30.
Serdeczny, O., Adams, S., Coumou, D., Hare, W., and Perrette, M. (2016). Repercussions. Heidelberg: Springer.
Seto, K. C., Güneralp, B., and Hutyra, L. R. (2012). Global forecasts of urban expansion to 2030 and direct impacts on biodiversity and carbon pools. Proc. Natl. Acad. Sci. U. S. Am. 109, 16083–16088. doi: 10.1073/pnas.1211658109
Sivakumar, B.. (2011). Crise de l'eau: Du conflit à la coopération-un tour d'horizon. Hydrol. Sci. J. 56, 531–552. doi: 10.1080/02626667.2011.580747
Smakhtin, V., Revenga, C., and Döll, P. (2004). Taking into Account Environmental Water Requirements in Global-scale Water Resources Assessments. In Water International (Vol. 29, Issue 3). Available online at: http://books.google.co.za/books?hl=en&lr=&id=8yPeEgrCWDcC&oi=fnd&pg=PR5&dq=Smakhtin,+Water+Stress+INdicator&ots=ReMYE2Myz8&sig=zlooLSHod9D__hysT3LTT0-_UL8#v=onepage&q=Smakhtin,WaterStress~INdicator&f=false%5Cn; (accessed September 17, 2021).
Sun, G., McNulty, S. G., Moore Myres, J. A., and Cohen, E. C. (2008). Impacts of climate change, population growth, land use change, and groundwater availability on water supply and demand across the conterminous U. S. Water Supply 6, 1–30. Available online at: https://www.srs.fs.usda.gov/pubs/ja/ja_sun026.pdf
Sustainable Water Partnership (2021). Ethiopia Water Resources Profile Overview. USAID/Sustainable Water Partnership(SWP). Available online at: https://www.globalwaters.org/resources/assets/ethiopia-water-resources-profile (accessed October 25, 2021).
Swilling, M., Hajer, M., Baynes, T., Bergesen, J., Labbé, F., Musango, J. K., et al. (2018). The Weight of Cities Resource Requirements (Issue August,). Nairobi: United Nations Environment Programme.
UN Water (2021). Valuing water: facts and figures. Water Polit. 2021, 15–27. Available online at: https://www.globalwaters.org/sites/default/files/un_water_development_report_2021.pdf
UN-DESA (2018). World Urbanization Prospects: The 2018 Revision (ST/ESA/SER.A/420). New York, NY: United Nations.
UN-Habitat (2020). World Cities Report 2020. Available online at: https://unhabitat.org/sites/default/files/2020/10/wcr_2020_report.pdf (accessed October 25, 2021).
UNICEF (2020). Water Scarcity: Addressing the Growing Lack of Available Water to Meet Children's Needs. UNICEF. Available online at: https://www.unicef.org/wash/water-scarcity#:~:text=Halfoftheworld'spopulation,ofextremelyhighwaterstress (accessed October 25, 2021).
UNICEF (2021). Water Security for All:Reimagining WASH Water Security for All. Available online at: https://www.unicef.org/media/95241/file/water-security-for-all.pdf (accessed October 15, 2021).
UN-Water (2021). Summary Progress Update 2021 : SDG 6 — water and sanitation for all. In UN-Water integrated monitoring initiative. Available online at: https://www.unwater.org/new-data-on-global-progress-towards-ensuring-water-and-sanitation-for-all-by-2030/ (accessed October 15, 2021).
Upadhyaya (2016). Integrated water resources management and climate: change adaptation strategies. Irrigat. Drainage Syst. Eng. 5:176. doi: 10.4172/2168-9768.1000176
Vörösmarty, C. J., Douglas, E. M., Green, P. A., and Revenga, C. (2005). Geospatial indicators of emerging water stress: an application to Africa. Ambio 34, 230–236. doi: 10.1579/0044-7447-34.3.230
Wang, D., Hubacek, K., Shan, Y., Gerbens-Leenes, W., and Liu, J. (2021). A review of water stress and water footprint accounting. Water 13, 1–15. doi: 10.3390/w13020201
WBG Climate Change Knowledge Portal (2020). Climate Data-Projections. Ethiopia. Available online at: https://climateknowledgeportal.worldbank.org/country/ethiopia/climate-sector-water (accessed October 15, 2021).
Weldegerima, T. M., Zeleke, T. T., Birhanu, B. S., Zaitchik, B. F., and Fetene, Z. A. (2018). Analysis of rainfall trends and its relationship with SST signals in the Lake Tana Basin. Ethiopia 2018:5869010. doi: 10.1155/2018/5869010
World Bank (2010). Making Transport Climate Resilient. Available online at: https://openknowledge.worldbank.org/handle/10986/12889 (accessed November 15, 2021).
World Bank (2018). Climate Change Profile: Ethiopia. Available online at: https://reliefweb.int/sites/reliefweb.int/files/resources/Ethiopia_4.pdf (accessed January 15, 2021).
World Bank (2020). Challenges and Opportunities for Water in Development in the Lowlands of Ethiopia. Available online at: https://documents1.worldbank.org/curated/ar/887541592763258049/pdf/Challenges-and-Opportunities-for-Water-in-Development-in-the-Lowlands-of-Ethiopia.pdf (accessed OCtober 15, 2021).
World Bank Group (2015). Ethiopia Urbanization Review : Urban Institutions for a Middle-Income Ethiopia. Available online at: https://openknowledge.worldbank.org/handle/10986/22979
World Bank Group (2021). Climate Risk Country Profile: Ethiopia. World Bank. Available online at: https://climateknowledgeportal.worldbank.org/country/ethiopia/overview (accessed November 15, 2021).
WWAP (2019). The United Nations World Water Development Report 2019: Leaving No One Behind. Available online at: https://unesdoc.unesco.org/in/documentViewer.xhtml?v=2.1.196&id=p::usmarcdef_0000367306&file=/in/rest/annotationSVC/DownloadWatermarkedAttachment/attach_import_ff9f03a3-1641-46ed-a5e0-a44f6b0ac9a9%3F_%3D367306eng.pdf&locale=en&multi=true&ark=/ark:/48223/p (accessed January 10, 2021).
Zablon A Swedenborg, E., and Yohannes, T. (2021). 3 Strategies for Water-Wise Development in Ethiopia. WRI. Available online at: https://www.preventionweb.net/news/3-strategies-water-wise-development-ethiopia (accessed January 25, 2021).
Keywords: basin, climate change, water scarcity, water stress, water risk, water sensitive, Ethiopia
Citation: Abraha T, Tibebu A and Ephrem G (2022) Rapid Urbanization and the Growing Water Risk Challenges in Ethiopia: The Need for Water Sensitive Thinking. Front. Water 4:890229. doi: 10.3389/frwa.2022.890229
Received: 05 March 2022; Accepted: 18 May 2022;
Published: 22 June 2022.
Edited by:
Domenica Mirauda, University of Basilicata, ItalyReviewed by:
Janez Susnik, IHE Delft Institute for Water Education, NetherlandsKanchan Singh, Ethiopian Civil Service University, Ethiopia
Copyright © 2022 Abraha, Tibebu and Ephrem. This is an open-access article distributed under the terms of the Creative Commons Attribution License (CC BY). The use, distribution or reproduction in other forums is permitted, provided the original author(s) and the copyright owner(s) are credited and that the original publication in this journal is cited, in accordance with accepted academic practice. No use, distribution or reproduction is permitted which does not comply with these terms.
*Correspondence: Tesfay Abraha, YWJyYWhhZ2lzcnNAZ21haWwuY29t