 Christine Heinzel
 Manfred Fink
 Britta Höllermann
- 1Department of Geography, University of Bonn, Bonn, Germany
- 2Thüringer Fernwasserversorgung, Erfurt, Germany
- 3Department of Geography, University of Osnabrück, Osnabrück, Germany
The 6th Intergovernmental Panel on Climate Change (IPCC) report (2021) stated that hot extremes have become more frequent and intense across most land regions in the past decades. It is projected that the changing climatic conditions in Germany and Thuringia in particular will lead to a higher frequency of drought events. Thus, it is vital to develop local adaptation strategies to mitigate the effects of droughts on agriculture to ensure future crop production. Water resource infrastructure has a critical role in planning future climate change adaptation measures that are sustainable. As the construction of new dams and reservoirs is controversial, it is preferable to use existing infrastructures, if they are suitable. Small-scale water management reservoirs built in Thuringia during the GDR (German Democratic Republic) and decommissioned after the German reunification were examined in this study to determine whether their reuse could be considered as a potential adaptation strategy. For this purpose, three reservoirs in Thuringia were selected. The impact of climate change on soil moisture, water availability and crop production, and the use of water from the reservoirs to meet future irrigation needs were modeled using the Water Evaluation and Planning system (WEAP). The modeled climatic changes have direct effects on the soil moisture status, leading to a higher water demand of the local agriculture. The results show that the crop water needs could double between near future (2020–2040) and distant future (2071–2100). However, predicted declines in yields can be mitigated by irrigation; modeling results indicate that supplemental irrigation with reservoir water mitigates projected losses and even allows 6.2–13.5% more crop production. Hence, the reuse of the reservoirs is worth to be considered as an adaptation strategy by policymakers. In addition to a cost-benefit analysis for future evaluation of the reservoirs, local user interests and demands need to be included avoiding conflicts about water. In general, WEAP as a modeling tool and the findings of the study show, that this research approach could be used to investigate the potential adaptive capacity of other small-scale water infrastructures.
Introduction
Global climate change is often associated with well documented hydrologic changes, including changes in precipitation patterns, soil moisture and runoff, and increases in the frequency and intensity of floods and droughts (Ehsani et al., 2017; IPCC, 2021). The 6th Intergovernmental Panel on Climate Change report (IPCC, 2021) stated that especially the hot extremes have become more frequent and more intense across most land regions since the 1950's. The increased land evapotranspiration has led to increases in agricultural droughts in some regions, including Europe (IPCC, 2021). Drought conditions in the soil have led to significant yield declines in Germany (BMEL, 2018) and substantial economic losses (Marx et al., 2018). Not only have the last few years (2015, 2018, 2019, and 2020) been exceptionally dry, predictions are that drought hazards will occur more often in Germany. Thuringia will be particularly affected, due to higher projected temperature increases in the eastern part of Germany (Thober et al., 2018).
One of the key objectives of water management is to enable freshwater supply at the appropriate time and place, which will become more and more challenging considering the climatic changes in addition to increasing population and economic activity (Fallah-Mehdipour et al., 2020; Lee et al., 2020). Already under the current levels of climate variability water managers are struggling, since the amount of damage from floods and droughts around the world continues to increase (Bouwer, 2011; Ehsani et al., 2017). The drought events and changing precipitation patterns are undermining in particular the reliability of rain as a source of irrigation water, thereby making it important for water managers to find a more secure supply of water to ensure local food production (Lee et al., 2020).
It is possible to reduce or even avoid some of the negative impacts of climate change by formulating effective adaptation strategies (Mbow et al., 2019). Despite the increasing number of drought events in recent years, the diverse range of drought responses are mostly focused on short-term actions to cope with drought (Logar and van den Bergh, 2013; Holman et al., 2021). However, it is recommendable to set drought mitigation and adaptation policies for a longer term (e.g., 20 or more years in the future).
A potential adaptation strategy to agricultural droughts could be the use of water from reservoirs and dams as a source for irrigation. The construction of reservoirs is a long-standing strategy to reduce the spatio-temporal variability of natural water supply in order to secure a reliable source of water for a wide variety of human and environmental needs (Ehsani et al., 2017). Over the last decade, there have been some studies that address the impact of climate change on watersheds, and the use of local water reservoirs as an adaptation strategy (Fallah-Mehdipour et al., 2020). For instance, Vano et al. (2010) assessed climate change impacts on the Yakima River reservoir system (USA), which supplies irrigation water to local agriculture via the operation of five reservoirs. A study by Krysanova et al. (2010) evaluated climate change adaptation strategies in European, African and Asian basins and concluded that adaptation to climate change has started in all basins, but progresses slowly. Shiau et al. (2018) analyzed water deficits induced by droughts in Taiwan and proposed hedging rules for reservoir operation to ensure stable water supplies. However, the traditional research focus on large-scale irrigation generally overlooks small-scale water infrastructure such as reservoirs and farm ponds, despite their importance (Wisser et al., 2010). Therefore, it is necessary to direct the scientific interest also to smaller water supply infrastructures.
Water resource planning models with their primarily focus on water allocation management (demand and supply interactions) (Ahmadaali et al., 2018) can be very beneficial when conducting research on water resources in a watershed. Thus, the Water Evaluation and Planning system (WEAP) was selected for this study as it combines the physical hydrological process and the water management framework, functioning as a bridge between the basin hydrology and water management (Ahmadaali et al., 2018). It is a useful tool to evaluate water resources using a scenario-based approach under different conditions of input variable (Amin et al., 2018), and various studies have been conducted involving modeling with WEAP (e.g., Höllermann et al., 2010; Joyce et al., 2011; Agarwal et al., 2019).
Understanding the externalities and benefits of water resource infrastructure is critical in planning future climate change adaptation measures that are sustainable at regional and global scales (Bhaduri et al., 2016). As the construction of new dams and reservoirs is socially and politically controversial, due to negative environmental impacts (Ehsani et al., 2017), it is preferable to use existing infrastructures if they are suitable. In Thuringia, such water infrastructures exist in the form of small water management reservoirs, which were built mainly to enhance agricultural production (Simon, 2009). The local water supplier, the Thüringer Fernwasserversorgung (TFW), which currently maintains the reservoirs, is examining the extent to which the reservoirs can be used again to supply water to agricultural operations. The Pohlen reservoir, Letzendorf reservoir and Falka reservoir have not been evaluated yet, which is why they were selected for this study. The reservoirs are situated close to each other in the district of Greiz in eastern Thuringia.
As part of the TFW project, this paper focuses on the future climatic changes in the region and their impact on local water resources, demands and crop production. The overarching objective of this study is to investigate and contextualize these impacts and assess the potential adaptive capacity of the reservoirs in the study area. In order to elaborate recommendations for local policymakers and water manager, the effects of long-term (inter-annual) and seasonal (intra-annual) climatic changes on water resources, and crop water demands will be assessed.
Case study area
To understand the importance of reservoir infrastructure in Thuringia, it is essential to elaborate on the historical background. By 1989, agriculture in the GDR (German Democratic Republic) had succeeded in becoming largely self-sufficient in agricultural produce through production maximization and intensification (Simon, 2009). Irrigation of agricultural land made a significant contribution to this. The main goal of the irrigation program was to ensure yield security and obtain high yields even in dry years. A total of 86 small agricultural reservoirs, each with a storage capacity of <1 Mio. m3, were built between 1945 and 1990 mainly in the present-day state of Thuringia. Irrigation water was provided free of charge to GDR agricultural farms, however, the high demand of water in the agricultural irrigation sector led to considerable ecological damages (Simon, 2009).
After German reunification in 1990, the legal basis and responsibilities of many of these small-scale reservoirs were unclear (Ranke, 2016). Until 2009, proper maintenance was not ensured because either the operator could not be identified or the water rights could not be determined. In 2012, the operation and ongoing maintenance of the reservoirs was contractually transferred from the state of Thuringia to the TFW (Ranke, 2016). In addition to providing irrigation water for increased agricultural production, the small-scale reservoirs have been and continue to be used for fish farming, waterfowl keeping, local recreation, flood control, and landscape enhancement (TFW, 2021b). The current question is whether the small-scale reservoirs will continue to be operated or whether they will be decommissioned. For the most part, the technical withdrawal devices at the reservoirs still exist. However, the provision of water from reservoirs is subject to maintenance fees (Simon, 2009). The costs and benefits of local storage, and water in general, are diverse and hard to quantify. The required amount of extra water to irrigate crops may differ by year and season, due to variations in commodity prices, usage, rainfall and quality. Although the decision of whether to invest and pay money for reservoir water depends heavily on personal preferences (Van Duinen et al., 2016; Nikkels et al., 2019), the costs and benefits are likely to change due to climate change impacts such as the increasing number of agricultural drought events.
The study area of the case study is located in the district of Greiz, which is situated in the eastern part of Thuringia. The district of Greiz belongs to the climatic regions of Southeast German basins and hills, as well as Erzgebirge, Thuringian Forest and Bavarian Forest (TLUBN, 2021a). The region is warm and dry in large parts, with average annual temperatures of 8–9.8°C and average annual precipitation of 641–833 mm. The district of Greiz has a comparatively very low groundwater recharge of 63 mm per year (the Thuringian average is 111 mm per year). The hydrogeology in the area of the study site, which is situated at the edge of the Thuringian Basin, is characterized by low mineralized sandstone and loess. The leading soil in the area is brown soil, with a sandy loam soil type (TLUBN, 2021a).
In the Greiz district, the study area is located in the municipalities of Endschütz, Linda bei Weida and Wünschendorf, which are in the middle eastern part of the district. The study area consists of two main catchments: Falka catchment and Pohlen-Letzendorf catchment (Figure 1).
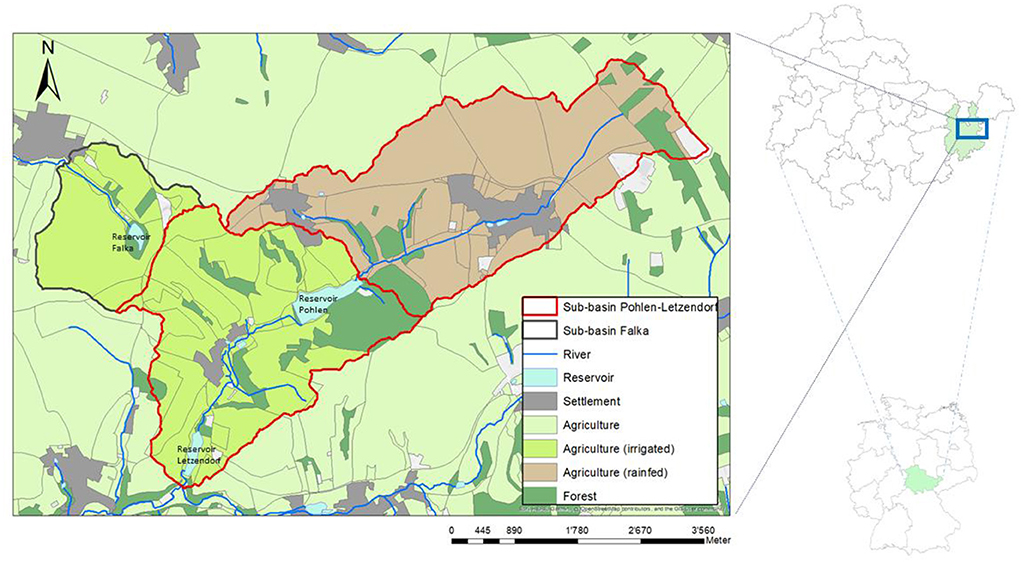
Figure 1. Location of study area and land-use categories; Falka catchment and Pohlen-Letzendorf catchment (divided in two sub-basins).
Falka (33U 298,846 m E, 5,632,009 m N) is the smallest reservoir with a storage volume of ~0.03 Mio. m3. The reservoir is located in the Falka catchment, which has an area of 129.7 ha and is mainly used for agriculture. The reservoir is connected to the Amselbach, a stream that drains into the Weiße Elster. The second catchment “Pohlen-Letzendorf” with a total area of 716.7 ha is divided into two sub-basins. The medium-sized reservoir Letzendorf (33U 299,242 m E, 5,630,036 m N), with a storage volume of about 0.06 Mio. m3, and the largest reservoir Pohlen (33U 300,492 m E, 5,631,366 m N), which has a storage volume of 0.33 Mio. m3, are located in the southern sub-basin. This sub-basin has an area of 348.5 ha, most of which is used for agriculture and covered with mixed forest. The northern reservoir Pohlen and the southern reservoir Letzendorf are supplied by the stream Fuchsbach, which connects the two reservoirs and flows into the Weiße Elster. The Fuchsbach originates from the northern sub-basin, which has an area of 413.2 ha. This area is also dominated by agriculture and has a small amount of coniferous forest. Currently, the reservoirs are mainly used for local recreation and fishing (TFW, 2021b).
Methods and data
WEAP model description
The Water Evaluation and Planning system (WEAP) was selected for this study as it combines the physical hydrological processes within a catchment area and the water management infrastructure and uses. It enables an integrated assessment of a watershed's climate, hydrology, land-use, irrigation facilities, water allocation, and water management priorities (Yates et al., 2005; Ahmadaali et al., 2018). It is applicable to municipal and agricultural systems, small basins as well as complex river systems. As a standard linear programming model, it is operating on the basic principle of water balance accounting (Sieber and Purkey, 2015) and its objective function is to maximize the percentage of supplying demand centers or catchments' needs, considering supply and demand priorities, mass balance, and other constraints (Yates et al., 2005; Ahmadaali et al., 2018). Furthermore, WEAP can address a wide range of issues, of which sectoral demand analyses, streamflow simulations, reservoir operations, and project benefit-cost analyses are especially important for addressing the study objective (Sieber and Purkey, 2015). Therefore, it allows to assess and balance in a holistic way the available water resources and the socio-economic water needs under different climate and policy/development scenarios (Dimova et al., 2014; SEI, 2015). In particular, the option to model reservoir operations in combination with the use of water from these reservoirs makes WEAP a well-suited tool for this study. The ability to utilize results of climate models as meteorological input allows for the prediction of the impacts of future climate trends on regional watershed dynamics (Sieber and Purkey, 2015). With the identification of the development of soil moisture and future yield trends, WEAP can provide an overview for local stakeholders to adopt and implement early actions. These features enable WEAP to answer the research question of this study adequately. WEAP has been used to conduct studies with reservoirs (Bazzi et al., 2021; Hatamkhani et al., 2021) and dams (Khalil et al., 2018), but these were often of higher volume and located in larger watersheds. In general, however, this study is an example that WEAP can be used to model small water infrastructures sufficiently. Therefore, WEAP is not only suitable to model the three reservoirs in Thuringia, but could also be applied in other German states or outside of Germany, if the data situation allows it.
WEAP offers five methods to simulate catchment processes such as evapotranspiration, runoff, infiltration and irrigation demands (SEI, 2015). For this study, the Soil Moisture Method was chosen, as it allows for the characterization of the impacts of land use and soil types on these processes (SEI, 2015). The one dimensional, 2-bucket Soil Moisture Method is based on empirical functions that describe evapotranspiration, surface runoff, sub-surface runoff and deep percolation for a watershed unit (SEI, 2015; Ahmadaali et al., 2018; Amin et al., 2018).
The model was developed for the catchments of the three investigated reservoirs, using the WEAP21 software. Figure 2 is showing the schematic of the model.
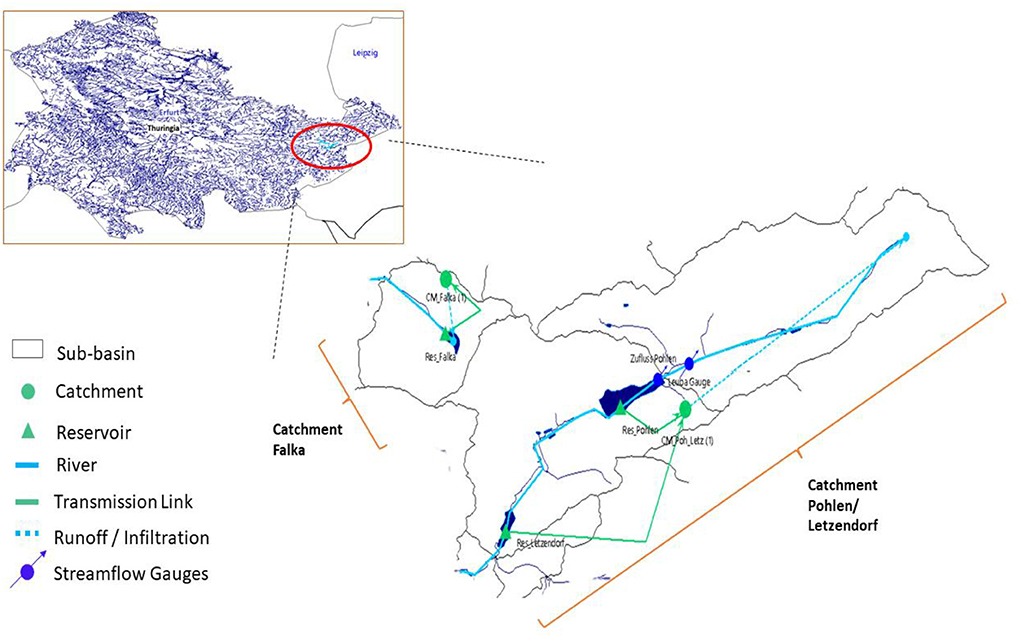
Figure 2. WEAP model schematic of the catchments.
The model includes two rivers, three reservoirs, two catchments (of which catchment Pohlen/Letzendorf contains two sub-basins), two lines of runoff/infiltration, three transmission links (connecting the reservoirs and the catchment nodes) and two hydrometric gauge stations, of which only one (Pohlen) is actually located in the catchment. Leuba gauge is located in different catchments outside the study area and was added to the model for calibration and validation purposes (see Section Calibration and validation).
For this study, the Current Accounts year was set to 2019 and a monthly time step was selected. The years 2020 and 2100 were chosen as the starting and end years of the simulation, as the data was predominantly available up to and including 2019.
Input data and data sources
The data necessary for modeling the study area with WEAP can be grouped into two categories: the data needed for modeling the catchment (and therefore the demand site) and the data concerning water resources and supply. In the first category, the data can be structured according to user-defined, and default/calibrated parameters. The user-defined parameters mainly include data on catchment area, land use, climate, and agricultural demands. For the mass balance equation of the soil moisture method, default and calibrated parameters derived from land use and soil properties were used. These variables were compared with corresponding data from different data sources to ensure that they were within a realistic range. The category “Resources and Supply” consists primarily of user-defined data on streamflow and reservoirs.
Various data sources were used in the development of the WEAP model (Table 1), with a focus on regional databases and statistics. The following sections detail and explain the data and the data sources that were used.
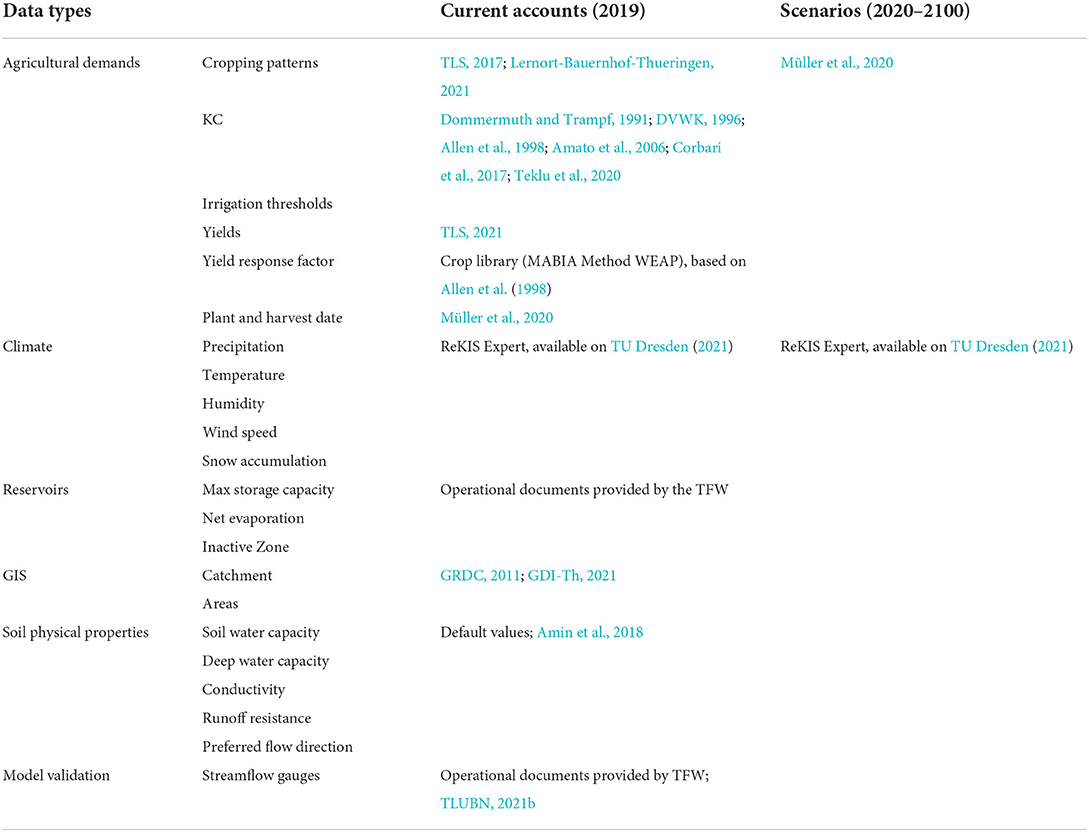
Table 1. Overview of the sources of the data used in the WEAP model.
Catchment data: User defined parameters
Five main land use categories were defined within the two sub-basins: agriculture rainfed, agriculture irrigated, forest, settlement, and aquatic area. The agricultural land was further subdivided according to the acreage of cultivated crops and intensive grassland. The area of each land use category was calculated and applied to the WEAP model as percentages of the total sub-basins.
Six different crops (wheat, rapeseed, maize, winter barley, summer barley, and sugar beet) were selected based on information from a farm located in the Pohlen-Letzendorf sub-basin (Lernort-Bauernhof-Thueringen, 2021). Since no data were available on the area shares of the crops in the study area, the respective area shares in the district of Greiz were taken from a statistical report on land use of the state of Thuringia (TLS, 2017) and adjusted in percentage terms to the two sub-basins. Specific crop rotation was not considered in the modeling process.
The Crop Coefficient Kc is relevant for most hydrologic water balance studies, and for irrigation planning and management purposes, as it incorporates crop characteristics and averaged effects of evaporation from the soil (Allen et al., 1998; Win et al., 2014; Teklu et al., 2020). The Kc values were established for each land use class and for each crop. For this purpose, literature was reviewed (Dommermuth and Trampf, 1991; DVWK, 1996; Allen et al., 1998; Amato et al., 2006; Corbari et al., 2017; Teklu et al., 2020) and the values that were most plausible for the region were selected.
In the study, the assumption was made that the Pohlen-Letzendorf catchment is not completely irrigated. Only the southern sub-basin, where the reservoirs are located, is irrigated. All crops are irrigated, as well as the intensive grassland. The timing and length of irrigation depends on the soil moisture status. The parameter Lower Threshold determines the percent level of soil moisture at which irrigation must begin (SEI, 2015). Specific values were taken from the literature (Müller et al., 2020) for all crops, all within the range of 30% (intensive grassland) to 50% (summer barley). These values are mainly applied in the model at the beginning of growing season until harvest. The Upper Threshold parameter indicates to cease irrigation when soil moisture reaches this percent level (SEI, 2015). Here, the default value 65 % was chosen for all crops and the intensive grassland.
Since part of the evaluation considers harvest gains and losses, the parameters Potential Yield, Yield Response Factor, and Planting and Harvest Date in WEAP are of great importance. Potential Yield defines the maximum yield assuming an optimal supply of water (ETActual = ETPotential) (SEI, 2015). To establish values for this parameter, yield data of the different crops were obtained from the Thuringian state statistics (TLS, 2021). The Yield Response Factor is a factor that describes the reduction in relative yield according to the reduction in the crop evapotranspiration (ETc) caused by soil water shortage (Olabanji et al., 2021). The data were obtained from the crop library functionality that is implemented in WEAP-MABIA and based on the FAO-56 report (Allen et al., 1998). Planting Date and Harvest Date are used to calculate yield reduction due to water stress, however, the parameters are not considered for irrigation or other calculations (SEI, 2015). The consultation paper by Müller et al. (2020) was chosen as data source for these parameters, as it reflects regional farming practices.
Data on various climate elements are available in hourly, daily, and monthly resolution in the period from 1961 to March 2020 (as of March 2021). Climate projection data from several models are also provided by ReKIS, the regional climate information system for Saxony, Saxony-Anhalt and Thuringia. The climate data for the Current Accounts and the reference model were obtained from the climate station Gera-Leumnitz, which is located about 10 km north of the study area. The parameters were corrected precipitation (mm), mean air temperature (°C), humidity (%), wind data (m/s), and snow accumulation (cm), for the time period January 1, 1961–December 31, 2019, respectively.
Additional parameters were the latitude of the area expressed in Degree Decimal, and the Glacier and snow modeling parameters including melting point, freezing point, albedo with lower and upper bound. However, only the climate parameter snow accumulation was considered in the model, as glaciers do not appear in the study area.
Catchment data: Default and calibrated parameters
Certain study area specific parameters and data needed for modeling are difficult to find in the literature. Therefore, default values for these parameters are often chosen in comparable studies (e.g., Ahmadaali et al., 2018; Amin et al., 2018; Teklu et al., 2020). This applies in particular to soil physical property parameters. Table 2 shows the range of the values used for the different soil property parameters in order to calibrate the model.
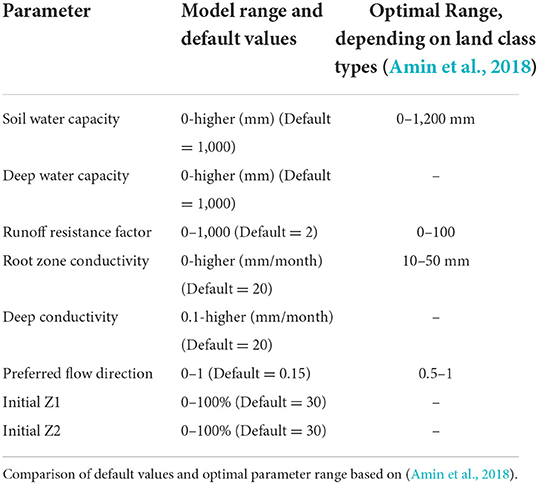
Table 2. Range of soil physical property parameters used in the WEAP model.
Resources and supply data
There are three reservoirs of different sizes in the study area: Pohlen (0.33 Mio. m3), Letzendorf (0.06 Mio. m3) and Falka (0.03 Mio. m3), which are representing the parameter Storage Capacity. Most data regarding the reservoirs were provided by the TFW. The Volume-Elevation Curve, a function that converts between volume and elevation of the reservoir (SEI, 2015), was created using the operating journal of the reservoir Pohlen, where the water levels were recorded. Unfortunately, since no operating journals were available for Letzendorf and Falka, the Volume-Elevation Curves of these reservoirs were estimated, based on Pohlen. To factor in the effects of climate on the reservoirs, monthly net evaporation was calculated from climate data. Reservoir losses to groundwater were not considered in the study due to an insufficient data situation. The Reservoir Operation data were changed so that 75% of the water in the reservoir's storages can be used for irrigation purposes.
The streamflow data were provided by TFW or sourced from the database of the Flood Information Center (HNZ) (TLUBN, 2021b) of the State of Thuringia. The discharge data on the direct inflow to the Pohlen reservoir (Gauge Pohlen) is available from the reservoir's operating journal, however, the values are estimated monthly values by TFW staff. Because these values are point estimates and not accurate averages of the monthly inflow, this gauge was considered inadequate for calibration and validation, even though it describes the runoff data for the study area. Therefore, another gauging station, located upstream of the Hohenleuben Dam on the Leuba River with a catchment area of 28.2 km2 was selected for calibration and validation. The distance from the Leuba gauge (33U 293,335 m E, 5,620,991 m N) to the Pohlen reservoir is about 11 km. Data for this gauging station were available in daily resolution from 1983 to 2017. There were no missing years in the data series. Since the catchment area of the gauge is different in size, the transfer factor f must be applied to compare the gauges (Mudersbach, 2020). The transfer factor is calculated from the ratio of the catchment area size of the reservoir and the gauging station and the ratio of the total discharge of the reservoir and the reference gauging station (Mudersbach, 2020). The transfer factor f for gauge Leuba is 0.291.
Calibration and validation
To ensure the validity and reliability of the model results, it is necessary to calibrate and validate the model (Hunter et al., 2015). The model was calibrated by comparing the streamflow data simulated in a monthly scale with observation data at the selected hydrometric gauge station Leuba. A 6-year period (January 1, 2010–December 31, 2016) was used to calibrate the model and a period of 9 years (January 1, 2000–December 31, 2009) was used to validate the model. First, the soil physical parameters were calibrated using the parameter estimation tool PEST (Parameter Estimation). WEAP includes a linkage to PEST, which allows the user to automate the process of comparing WEAP outputs to historical observations and modifying parameters to improve the model performance (SEI, 2015). The second step included a model performance test as a quantitative evaluation of the results using the Coefficient of determination (R2) (Table 3) and the Nash-Sutcliffe Coefficient (NSE). The R2 result at the end of the calibration stage for the monthly streamflow values is 0.67, which is considered as good. The R2-value of the validation stage was only 0.43, which can be rated as moderate or unsatisfactory. The values for the NSE are only in an insufficient range for the calibration stage (0.26) and the validation stage (0.19). The unsatisfactory results of the model performance test can possibly be explained by the lack of reliable observation data for the specific study area (Sun et al., 2015) and the selection of the Leuba gauging station, which is located in a different catchment with different characteristics that ultimately affects the river discharge (Xiao et al., 2019). In general, small catchments are characterized by high levels of (geological and hydrological) heterogeneity, leading to flow pathways that may be more sensitive to prevailing local conditions and primary physical conditions (Nasr and Hynds, 2016). Especially the different sizes of the reservoir vs. the gauge catchments can cause differences in runoff dynamics. This problem is typical for the situation of the small reservoirs in Thuringia because there are no gauging stations available for such small catchments in agriculturally used areas. The already weak NSE for the calibration period underlines this problem.
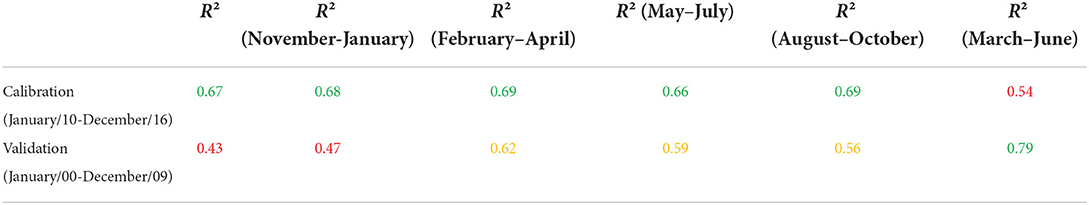
Table 3. Coefficient of determination for whole period and seasons; green = good – very good, yellow = satisfactory, red = unsatisfactory.
As a supplement to the quantitative evaluation, the data of the Leuba gauging station was graphically plotted and qualitatively evaluated. The comparison (observed and modeled data) shown in Figure 3 indicates that the overall dynamic and baseflow fits well between the transferred values of gauge Leuba and the model at the outlet of Letzendorf reservoir. The timing of the peaks could also be replicated, but the magnitude is considerably lower.

Figure 3. Monthly calibration plot based on available data for Leuba gauge station (2010–2016).
When looking at the R2-values of the seasons, both in the calibration and validation, we find that they are mostly in the satisfactory to good range. Only in winter in the validation period the values are unsatisfactory. Since the evaluation of the results mainly refers to the spring and summer months, the poorer model performance in winter can be accepted. Also, with regard to the vegetation period, the R2-value is satisfactory during the calibration, and in the validation period it is even in the very good range.
Considering the fact that the gauge with the observed values is not located in the analyzed catchment area and that the R2-values are in the good to very good range, especially in spring and summer, when drought can be problematic for plants, the model can be evaluated as acceptable for answering the research question. Additionally, the modeled lower winter discharge does not negatively affect the refilling of the reservoir and the reservoir always reaches its highest capacity before the growing season. On the other hand, the unsatisfactory NSE values should not be overlooked and the interpretation of the results should consider that the model can only be rated as a limited representation of reality. Nevertheless, the model representing the seasonal dynamic as described above and in combination with scenarios, can be applied to test hypotheses that focus on explicating important biophysical linkages (Srinivasan et al., 2018) and future changes during the growing season. Therefore, we are confident that the results of this study can serve as guidance to local policymakers to clarify the adaptive potential of small-scale water infrastructure.
Scenarios
Reference scenario—Business as usual
The Reference Scenario or Business as Usual (BAU) scenario represents the changes that are likely to occur in the future, in the absence of any new policy measure (SEI, 2015). The Reference Scenario is projected under the current conditions, which is in this study the year 2019 taking into account the data that were explained previously. The reference model refers to the years 2020–2100.
Climate change scenarios
In this study, the climate change scenarios are based on the Fifth Assessment Report of the Intergovernmental Panel on Climate Change (IPCC, 2014). The Representative Concentration Pathways (RCP) projections evaluated in the IPCC 2014 report are part of the fifth phase of the Coupled Model Intercomparison Project (CMIP5). As a main tool to analyze potential changes in the climate system, Global Climate Models (GCMs) simulate the evolution of climate states in dependence on given forcings (Kreienkamp et al., 2019). In this study, the datasets of three GCMs—the result of modeling group contributions to the CMIP5—were chosen as bases for the climate change scenarios: the Canadian Earth System Model CanESM2, the European community Earth-System Model EC-EARTH and the German Max-Planck-Institute Earth System Model MPI-ESM.
GCMs are capable of imaging climate states on global to continental scale, but not on regional scales. Consistent information on a regional scale is important for impact studies, policy making and climate consultancy to develop adaptation measures to protect socio-economic structures and ecosystems. Therefore, so-called downscaling strategies have to be applied to GCMs' output. For this study, the ESD (empirical-statistical downscaling) technique EPISODES was chosen. EPISODES offers advantages over other ESDs strategies as it provides single-site and single-variable projections, and since ESD is directly constrained by local measurements in the past, a bias correction is not necessary. However, since ESD techniques are based on the observed coherence between the scales, it must be considered that they are not necessarily capable to simulate potential future processes outside the range of atmospheric events that have been recorded so far (Kreienkamp et al., 2019).
The scenarios RCP 4.5 and RCP 8.5 were chosen for the following analysis, as they represent an intermediate and an extreme climate change scenario. In combination with the different GCMs following scenarios were applied:
- Can r45: CanESM2-EPISODES with RCP 4.5
- Can r85: CanESM2-EPISODES with RCP 8.5
- EC r45: EC-EARTH-EPISODES with RCP 4.5
- EC r85: EC-EARTH-EPISODES with RC P8.5
- MPI r45: MPI-ESM-EPISODES with RCP 4.5
- MPI r85: MPI-ESM-EPISODES with RCP 8.5
The climate data (projected from 2020 to 2100) were obtained from the REKIS platform. For the scenarios in the model, the monthly data on temperatures, precipitation, relative humidity, and wind speed were used. All data series are complete, except in the EC model, where the data for the years 2040–2045 are missing. The values for this time period were interpolated for this scenario.
Irrigation of crops scenario
This scenario, along with the climate scenarios, is fundamental to the study because it determines that the water from the reservoirs is used for irrigation purposes. In the Reference scenario, no irrigation is assumed. In the Irrigation of Crops Scenario, water from reservoirs is used to irrigate crops when the soil becomes too dry, and the plants require water (irrigation thresholds). For the Pohlen-Letzendorf catchment, only the fields in the southern sub-basin in which the reservoirs are located will be irrigated, in contrast to the Falka catchment, which will be irrigated entirely due to its small area.
Results and discussion
Impact of different climate change models and scenarios on irrigation demand
The objective of this section is to identify how the different climate change models and their RCP 4.5 and RCP 8.5 scenarios affect irrigation needs. In order to enable a more in-depth analysis of the study results, differences between the two catchment areas and the reservoirs are outlined. To identify which model and climate scenarios could be used to evaluate further results, the decadal average of the annual water demands in the period 2020–2100 were determined to visualize general trends (Figure 4). The variable “water demand” was selected because it summarizes how climatic changes could affect soil moisture and crop requirements.
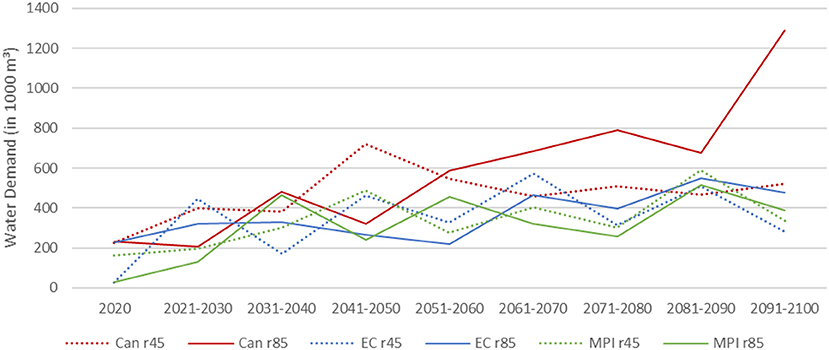
Figure 4. Annual water demands (decadal mean value) in both catchments of the study area (2020–2100), Canadian model (red), EC model (blue)* and MPI model (green) with RCP 4.5 and RCP 8.5 scenarios. *Missing data for 2040–2045.
In the figure, all models with the two scenarios show an increasing trend in water demands. However, it is evident that the Canadian model with the RCP 8.5 scenario has the greatest effect on the study area, as water demand for crops is highest, especially toward the end of the century. Although the difference between the RCP 4.5 scenarios of the models is smaller, the Canadian model again has the highest water demand. Since the focus of this study is on the effects of agricultural drought, the Canadian model and the corresponding RCP 4.5 and 8.5 scenarios were used for the further analysis because water demands are highest in the model, which suggests that drought events could be more frequent and intense. It was concluded that this model results in more drought events in the future. Projections involve a great degree of uncertainty, so it can be helpful for decision makers to assume the “worst-case” in order to be best prepared for all contingencies.
The difference between the models is also apparent when considering the ability of the reservoirs of the two catchments to meet the water demand of the agricultural areas. In Figure 5 this ability is shown and named reliability of the irrigation.
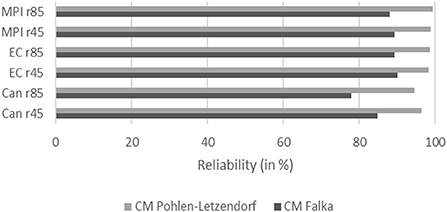
Figure 5. Reliability of the demand sites [Pohlen-Letzendorf (gray) and Falka (black) catchments] under different climate scenarios.
In general, the reliability of the two scenarios in the Canadian model is lower in both catchments than in the other models. In the Pohlen-Letzendorf catchment, the reliability of covering the water demand in the Canadian model is 95% (Can RCP 8.5) and 96% (Can RCP 4.5), while in the other two models it is between 98 and 99%. The difference is more pronounced for the Falka catchment area, where the reliability in the Canadian model is 78% (Can RCP 8.5) and 85% (Can RCP 4.5), whereas in the other models it ranges from 88 to 90%. Although the Falka catchment is generally smaller and thus has less area to irrigate, the Falka Reservoir has the lowest storage volume, which means that its inactive zone of 25% is reached quickly. The results show that the water demand in the Falka catchment can be covered less than in the Pohlen-Letzendorf catchment. Due to its small size, the reservoir will contain even less water due to the drier conditions in the future. The other two reservoirs within the Pohlen-Letzendorf catchment with a total reservoir volume of 0.39 Mio. m3 are considered as one source in the following since no specific differences could be detected through the modeling process and both reservoirs contribute to the same irrigation areas.
Due to the lower impact of the EC model and the MPI model on water demands, as well as the generally lower water availability in the Falka catchment and the Falka reservoir, the further process of evaluating the results focuses on the Canadian model with the two scenarios and the Pohlen-Letzendorf catchment.
Annual changes in the near, mid-distant, and distant future
Particularly for the planning of future water management measures, it is important to investigate the changes in climate and soil moisture of the catchment area (Pohlen-Letzendorf). For this purpose, it is useful to divide the study period into specific phases: near future (2020–2040), mid-distant future (2041–2070), and distant future (2071–2100). The annual precipitation and the average annual temperature of the study area during historical and the three future periods under the RCP 4.5 and RCP 8.5 scenarios of the Canadian model are summarized in Table 4.
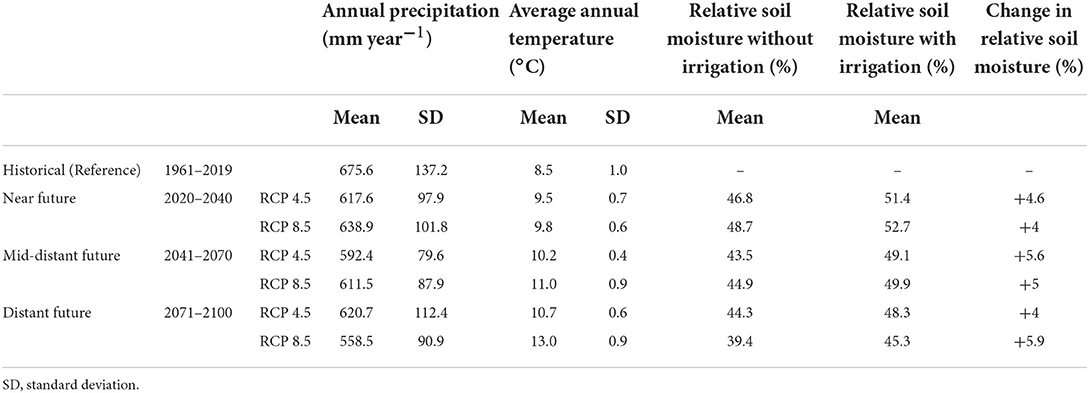
Table 4. Climate and relative soil moisture in the Pohlen-Letzendorf catchment; Historical data and future projections under RCP 4.5 und RCP 8.5 scenarios (Canadian model).
Both climate projections are drier and warmer than the historical reference period. For average annual temperatures, both projections show a significant increasing trend, in particular the RCP 8.5 scenario. In the last three decades of the twenty-first century, the annual temperature is on average 2–4.5 K above the historical period. It is noticeable that already in the reference period a temperature increase is evident. The RCP 8.5 scenario shows a constant declining trend in precipitation toward the end of the century. However, the annual precipitation in RCP 4.5 first decreases in the near and mid-distant future, but increases in the last time period. When developing adaptation strategies to climate change, temperature and precipitation change are key variables.
However, both future temperature and precipitation are susceptible to uncertainties that need to be taken into account (Hawkins and Sutton, 2011). In order to understand the physical mechanisms of drought, soil moisture-based indicators are considered to be more suitable (Nam et al., 2012; Smith, 2013; Lopes Ribeiro et al., 2021). Table 5 shows that trends in soil moisture remain relatively stable in RCP 4.5 without irrigation, relative soil moisture ranges between 46.8% (near future) and 43.5% (mid-distant future). In the RCP 8.5 scenario, however, a distinct decreasing trend is evident, from 48.7 to 39.4% (without irrigation). Additional irrigation with water from the reservoirs could increase the relative soil moisture by up to 5.9%. The soil moisture trends in this study indicate that agricultural droughts will become more severe, most notably from the mid-twenty-first century onward. Additionally, the predicted increases in the frequency of drought events will in turn increase the risk of agricultural droughts in the region (IPCC, 2021). Together with our findings this shows the urgency to adapt to such drought events in order to reduce the vulnerability of the agricultural sector.
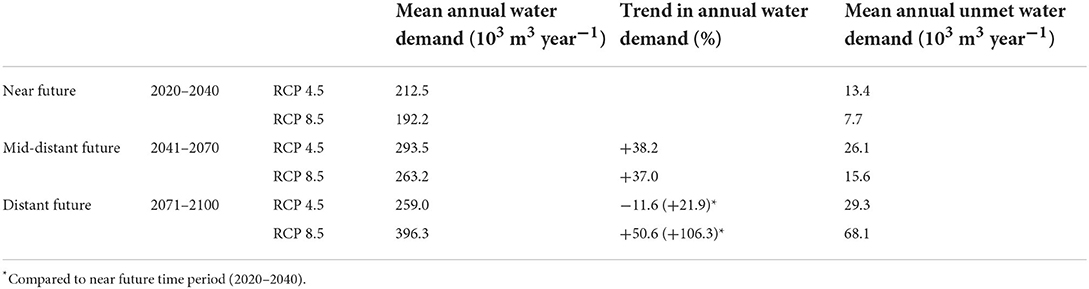
Table 5. Annual water demand and unmet demand in the Pohlen-Letzendorf catchment; future projections under RCP 4.5 und RCP 8.5 scenarios (Canadian model).
Looking at the irrigation demand under the two climate scenarios, the water requirements in the Pohlen-Letzendorf catchment are changing in the course of the twenty-first century (Table 5).
While the average annual water demand in the RCP 8.5 scenario increases by 106.3% between near and distant future, the average water demand in the RCP 4.5 scenario peaks in the middle of the century and then decreases in the last time period. However, comparing the near and the distant future period, the water demand in the RCP 4.5 scenario still increases by a total of 21.9% toward the end of the twenty-first century. Other studies confirm these findings. Save et al. (2012) modeled changes in irrigation requirements in a Spanish watershed using a Soil and Water Assessment Tool (SWAT). Depending on the crop, irrigation requirements were projected to increase by 40–250% by the end of the twenty-first century, which was directly attributed to increases in evapotranspiration, decreases in growing season water availability, and changes in crop phenology. In another study by Gondim et al. (2012), it was determined that irrigation water demand will increase by 8–9% by the mid-twenty-first century in a Brazilian watershed. Demand increases were also attributed to projected rainfall decreases and evapotranspiration increases. The results from both studies are only partly applicable to the German study area, since other climatic and agricultural conditions prevail. However, the tendency of increasing potential evapotranspiration (PET) due to the rising temperatures is a global phenomenon, even though the magnitude of this increase is varying in space (Scheff and Frierson, 2014).
Unmet water demand can be found in both climate scenarios, which is already indicated in the Figure 5 and in the observed changes in the water demand. Table 5 also includes the unmet water demands in the Pohlen-Letzendorf catchment for the three time periods. Until 2070, the average unmet water demand per year is higher in the RCP 4.5 scenario than in the RCP 8.5 scenario. Thereafter, however, unmet water demands increase in the RCP 8.5 scenario, while becoming only marginally higher in the RCP 4.5. Unmet demand is an important indicator in the study as it determines at what point local drought events become so frequent and extreme that the water in the reservoirs is not enough to meet local demands. This is particularly the case toward the end of the century in the RCP 8.5 scenario, when climatic conditions become so dry that crops require more frequent irrigation.
Monthly changes in the near, mid-distant, and distant future
In order to determine during which months the plants in the catchment need the most water, it is necessary to investigate the monthly changes in water demand and climate. Again, the study periods near future (2020–2040), middle-distant future (2041–2070), and distant future (2071–2100) were selected for this purpose. Figure 6 summarizes the climatic changes within the year in the three time periods. The two climate scenarios are compared with the historical average values. In the years 2020–2040, the temperature is only slightly higher, but from mid-century onward, especially the summer months June to August become warmer. December and January are also significantly warmer in both climate projections. In spring and fall, the differences between the historical period and the projected temperatures are smaller. Similarly, for projected precipitation, the largest differences between the historical and projected data occur in the mid-distant future. The months of July through September have historically been significantly wetter. However, in spring and early summer, when plants require a high quantity of water to grow, no major differences between precipitation amounts are apparent. Toward the end of the century, the figure shows that in the RCP 8.5 scenario, the months of July through September receive only half the amount of rain that has occurred historically. During this time period, spring and the summer months are significantly wetter in the RCP 4.5 scenario.
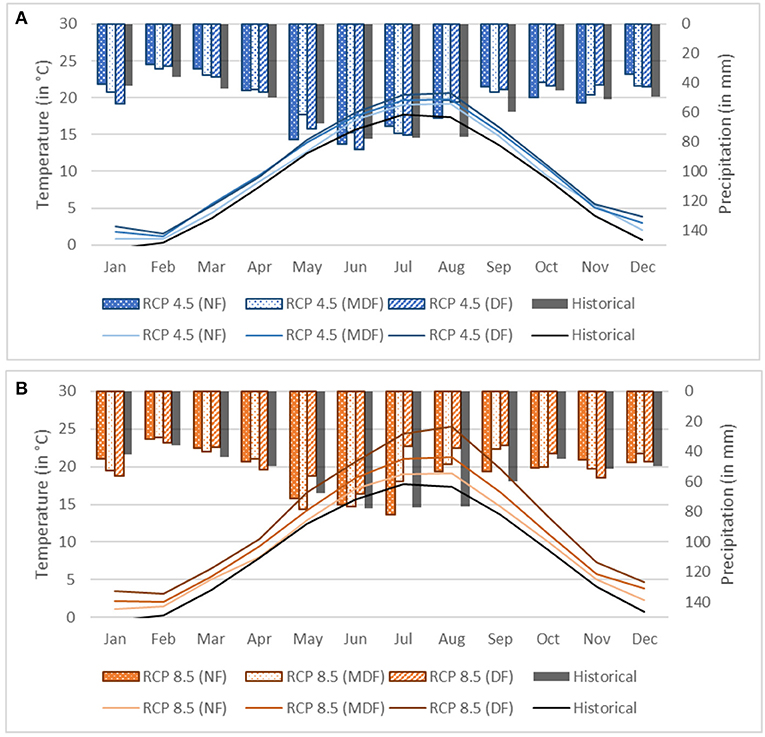
Figure 6. Historical (1961–2019) and projected climate within the year under (A) RCP 4.5 and (B) RCP 8.5 (Canadian model) for the study area; NF, near future (2020–2040); MDF, mid-distant future (2041–2070); DF, distant future (2071–2100).
Knowledge about changes on smaller scales and between different seasons are vital for decision makers to develop adaption strategies to a changing climate. The results of the model indicate future seasonal shifts in water demand which can be linked to changes in precipitation patterns and increased temperatures. Due to climatic changes, crop development tends to start earlier, and maturity can also be reached earlier in the season, leading to earlier harvesting and reducing the irrigation requirement in July and August (Grusson et al., 2021). This temporal shift will have a substantial impact on irrigation need, with a shift toward the beginning of the season (Grusson et al., 2021). This must be taken into account when evaluating the future seasonal irrigation needs. The results of the WEAP model show that the amount of water from the reservoirs is sufficient to meet the local demands properly until June in both scenarios. However, with a changed timing of cultivation as an adaptation strategy to higher temperatures and resulting higher demands in spring, the reservoirs might not be able to meet irrigation demand sufficiently until June. On the other side, the water from the reservoirs could also be seen as a kind of “last reserve” that is only used if there is a threat of total crop failure due to heat-related extreme weather events. This “last reserve” measure could lead to a longer lasting water supply from the reservoirs.
It is also essential to consider the effects of climatic conditions on relative soil moisture in the context of monthly changes. The monthly changes in relative soil moisture are presented in Figure 7. In the RCP 4.5 scenario, the differences in relative soil moisture between the three time periods are small. The soil moisture during growing season is lowest in mid-century. In the RCP 8.5 scenario, the average soil moisture is substantially lower in the last time period in the months of March through December. The results also indicate that supplemental irrigation will increase soil moisture considerably, especially during the months of April through August. For instance, in June during the 2071–2100 time period, supplemental irrigation with water from the reservoirs increases average relative soil moisture by 65.4% in the RCP 8.5 scenario and by 45.8% in the RCP 4.5 scenario.
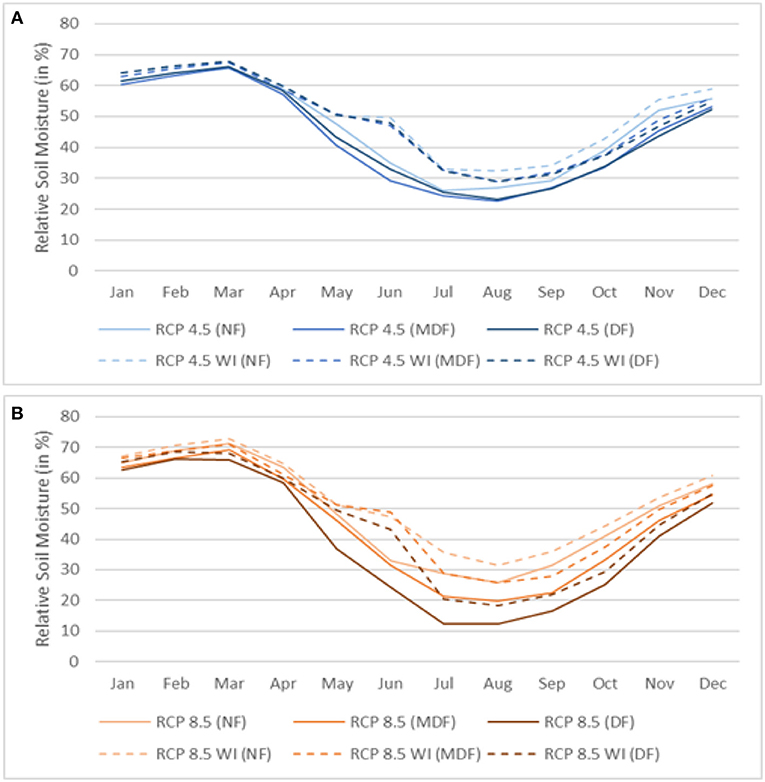
Figure 7. Monthly changes in the relative soil moisture in the Pohlen-Letzendorf catchment under (A) RCP 4.5 and (B) RCP 8.5 (Canadian model) in the Pohlen-Letzendorf catchment; NF, near future (2020–2040); MDF, mid-distant future (2041–2070); DF, distant future (2071–2100); WI, with irrigation.
To assess future trends in local hydrology and agriculture, it is important to link climatic changes with changes in monthly water demand. The average change in the water demand for the three periods under the two climate scenarios is illustrated in Figure 8.
Figure 8. Monthly water demands (left) and unmet demands (right) in the Pohlen-Letzendorf catchment under (A) RCP 4.5 and (B) RCP 8.5 (Canadian model) in the Pohlen-Letzendorf catchment; NF, near future (2020–2040); MDF, mid-distant future (2041–2070); DF, distant future (2071–2100).
In all three time periods, June is the month with the highest water demand. In the RCP 8.5 scenario, it increases from 141.825 to 205.312 m3 in June toward the end of the century. In the RCP 4.5 scenario, a similar picture appears compared to the previous results: in the near future, the average water demand in June is 157.392 m3, in the mid-century it increases to 166.331 m3, and from 2071 to 2100 it decreases to 161.455 m3. When comparing the two scenarios, it is noticeable that the average water demand in June in the first time period is higher in the RCP 4.5 scenario than in the RCP 8.5 scenario. In the other two time periods, however, it is lower.
Sufficient water supply in the growth phase, i.e., the months of April and May, is important to ensure a successful harvest. Overall, a shift in water demand can be seen, with plants requiring more water, especially earlier in the year. In all time periods and both scenarios, unmet demand is highest in June. In the RCP 8.5 scenario the demand cannot be met starting in May, however, the amount of unmet demand in that month is relatively low. In most time periods, the irrigation need cannot be met until end of September.
The WEAP modeling results suggest that changing climatic conditions will affect seasonal water availability, however, supplemental irrigation with reservoir water has the potential to increase relative soil moisture during critical plant growth season.
Impact of irrigation on crop production under the two climate scenarios
To what extent can supplemental irrigation with water from reservoirs increase harvest, or mitigate consequences due to drought? To answer this question, crop production in the Pohlen-Letzendorf catchment was plotted up to the year 2100. The RCP 4.5 and RCP 8.5 scenarios were considered, with and without irrigation from reservoirs. Decadal averages were calculated to visualize trends (Figure 9).
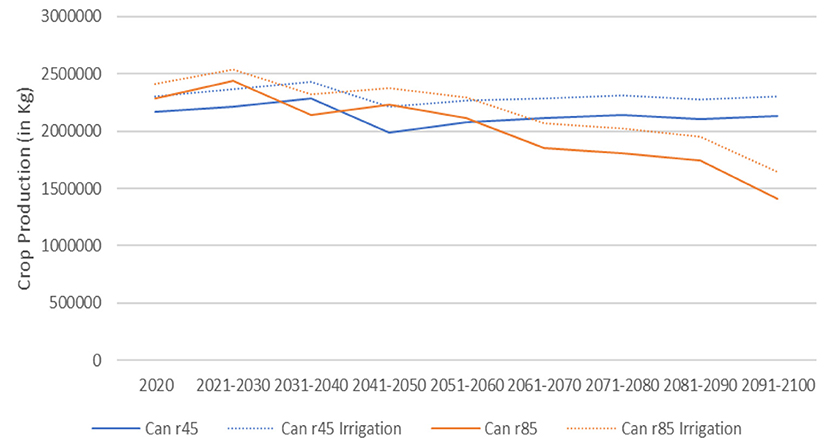
Figure 9. Changes in annual crop production (mean value of decades, 2020–2100) in the Pohlen-Letzendorf catchment with and without additional irrigation water from the reservoirs under the RCP 4.5 (blue) and RCP 8.5 scenarios (orange) (Canadian model).
Figure 9 shows two yield trends, both of which are declining at different rates. While the trend for the RCP 4.5 scenario remains relatively constant, crop production declines substantially toward the end of the century in the RCP 8.5 scenario. The results are also consistent with observations of increasing water demand for the same time period. Comparing the near and distant future time period, the crop production decreases in the RCP 4.5 scenario by 5.2% and in the RCP 8.5 scenario by 27.9%. From the figure it is apparent that the additional irrigation water increases the harvest in both scenarios, on average by about 171,189 kg per year in the RCP 4.5 scenario and 179,877 kg per year in the RCP 8.5 scenario. On average, 6.2–6.8% more could be harvested with irrigation until 2040, 8.7–9.6% more in the period 2041–2070 and 8.0–13.5% more in the last time period (for more details see Table 6).
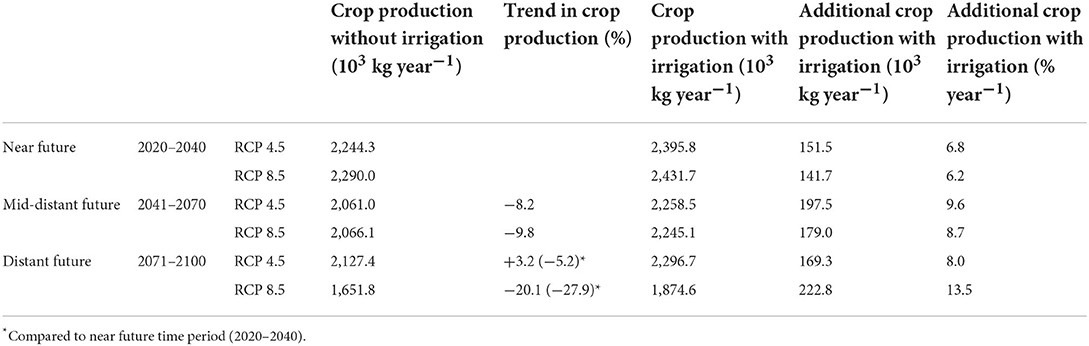
Table 6. Mean annual crop production in the Pohlen-Letzendorf catchment with and without irrigation for the three time periods (near future, mid-distant future and distant future).
With mean temperatures increasing and precipitation fluctuating, water availability and general crop production are likely to decrease in the future (Kang et al., 2009). Therefore, it is important to assess to what extent the changed availability of water can be used to counteract crop failures or to increase production. The RCP 4.5 scenario indicates relatively constant future yields (5.2% decrease between near and distant future), while the RCP 8.5 scenario shows a rapidly decreasing yield trend from mid-century onward (27.9% decrease between near and distant future). A study by Brás et al. (2021) evaluated European crop production responses to droughts between 1961 and 2018, and the researchers showed that historical droughts and heatwaves reduced European yields on average by 3–9%, depending on the type of crop. These findings are coherent with the projected climate change and the increase of crop losses in this study. On the other hand, the results of the WEAP model also show that additional water from reservoirs for irrigation could enhance crop production by 6.2–13.5% and prevent a drop in yield, depending on the scenario and time period. From these results, it can be interpreted that the use of local water resources is economically beneficial by increasing yields and particularly important by mitigating extreme climate change impacts.
Uncertainties and constraints
The processes within a catchment are complex. Inputs that are not always well known are forcing these processes, and they induce a response in a system, which characteristics are difficult to measure or estimate and change over time (Beven and Alcock, 2012). Considering the range of uncertainties in knowledge and the natural randomness of forcing, it must be discussed whether the predictions made by models of catchment processes, and the way in which they might change in the future, might be useful in informing management decisions about future investments (Beven and Alcock, 2012).
The structural limitations of a model also apply to WEAP, e.g., simplifications are made, since reality is too complex for all factors to be included in a model. For example, in the study, this is the case for groundwater dynamics in the catchment area. Groundwater is partly included in the Soil Moisture Method by the lower “bucket” in the hydrologic equation. Since the reservoirs, and not the groundwater storage, are the source of irrigation water, these limitations put only minor constraints on the current study.
In a hydrological analysis of climate change, the decision for a climate model is critical (Her et al., 2019). The Canadian model, which was selected for the in-depth investigation of the results, focuses primarily on climatic changes in the polar regions, and therefore the simulations are intended to capture snow-related climate parameters, such as cold-region surface temperature and precipitation (Kushner et al., 2018). Hence, it must be considered that the other two models could be more accurate in predicting the future climatic changes in the study area. However, this model was chosen because the climate variables included in the model have the highest impact on water demands in the watershed and this projection supports in clarifying the adaptive potential of small-scale water infrastructure.
Sampling, measurement and interpretation errors in the data arise independently from the model itself (Moges et al., 2021). In this study, the general availability of the climate input data was not problematic. However, there were still gaps in some data sets that had to be interpolated. In addition, the weather station was located 10 km away from the study area, although this should have only a minimal effect on model performance. Most land use and crop specific data were not available for the watershed. Hence, acreage percentages of growing areas were estimated on a county basis, therefore, the crops used in the model only have representative value. Also, the practice of crop rotation on the farmland was not considered. In addition, water losses to the fields were not taken into account which overestimates the availability of irrigation water slightly.
Calibrating the model parameters and evaluating model predictions using observed variables is an important part in hydrological modeling (Kiang et al., 2018; Moges et al., 2021). The streamflow data in this study are subject to a high degree of uncertainty. The data from the catchment is estimated through visual assessment by a trained staff member, and the corresponding data series were only incompletely available. Therefore, streamflow data from other catchments were used for the calibration, which were adjusted to the study area in terms of quantity, but still had different areas and therefore streamflow characteristics. In general, the calibration process can be considered one of the largest sources of error in the study. However, this problem mainly affects the absolute values, whereas in the case of relative changes over time the problem is less pronounced. Additionally, the seasonal values of the growing period of the coefficient of determination gave us confidence that the model supports testing hypotheses for potential drought conditions and that the general results can serve as guidance to local policymakers to clarify the adaptive potential of small-scale water infrastructure.
While the focus of this study is on the water-limited plant growth, it must be considered that other factors play an important role for plant growth which are not incorporated into this model. Hydrological models, including WEAP, often neglect the effect of carbon dioxide (CO2) which is challenging their relevance in the context of climate change (Lemaitre-Basset et al., 2022). In light of rapidly changing CO2 concentrations in the atmosphere, the interaction between higher CO2 concentrations, temperature, water and crop production should not be overlooked (Bouras et al., 2019). The fertilizing effect of CO2 on plants could counterbalance future yield losses, however, the higher atmospheric CO2 could negatively affect crop quality by reducing the concentrations of plant nutrients. It should also be considered that increased temperature can negatively impact plant production due to heat stress (Bouras et al., 2019). Furthermore, the model does not factor in that the selected KC values may not be consistent with future climatic changes, or that agriculture may adapt through other strategies such as changing planting and harvesting times (Bindi and Olsen, 2011). Additional climatic and weather-related factors, such as floods (Shrestha et al., 2017), heavy rain events (Li et al., 2019), frost days and days with snow cover (Kolar et al., 2014), and solar radiation (Kristensen et al., 2011) should also be considered. In addition to that, it is necessary to include changes in non-climate factors (technological, socio-economic, political etc.) when contextualizing the study results (Brisson et al., 2010). However, the results are valid nonetheless since the availability of water is a major factor in plant growth and thus crop production.
Although there are many uncertainties to consider, the findings of the study are highly informative about possible future developments in the study area. The aim of the study is to support policy makers in their decisions, and for this purpose the results are of great value. Further exploratory modeling in combination with local community engagement could provide insight how the limitations affect farmers currently and in the future.
Recommendation: Recommissioning of the reservoirs?
The results of the study show that climate change will also be evident in the study area in Thuringia, thus developing adaptation strategies should become a priority to local decision makers. Climate change will lead to an increase in the water demand of crops, which are currently almost exclusively rain-fed. To be able to adequately meet the irrigation needs of crops in the future and therefore increase or maintain crop production, the WEAP model results indicate that it is beneficial to use water from reservoirs. The beneficial value provided by each of the reservoirs might differ, due to the differences in size, infrastructural components and accessibility. However, because of their long service period the decision for recommissioning the reservoirs involves a rather versatile, lengthy process than a clear systematic method. The insights from the modeling can be used as one component in in this complex decision-making process. Prior to any final decision, there are other factors that should not be overlooked by the local policymakers. The engagement with local farmers would be the next step in the decision-making process, by first presenting the results of the study to the communities in the region and then incorporating interests but also concerns of the farmers into the process.
Reusing the reservoirs for irrigation is a subject of a profound cost-benefit calculation. Since the establishment of irrigation water delivery infrastructure, and the operation of the reservoirs involves costs, the farmers have to pay money if they want to use the water. Not all farmers can or want to afford these costs. However, as drought events become more frequent, the need for additional irrigation will increase, and with it the willingness to pay the fees. Conflicts concerning the use of water must be expected in the future (Möller et al., 2020). Already in past dry seasons, larger businesses were exempted from the withdrawal ban on surface water if they used the stored water from the reservoirs. There was a lack of understanding for this exemption among the population (Möller et al., 2020), and the potential for conflict is high if only affluent farmers could use the water. Surveys should be conducted regularly in the future to clarify the needs of the local farmers. However, another economic aspect is also important to consider: the use of reservoirs can maintain jobs even under climatically unfavorable conditions and strengthen rural areas by possibly providing impetus for other agricultural locations (TFW, 2021a).
An issue that should be addressed is the risk of overexploitation of water resources. Although there are limits to water withdrawals, if fewer resources are available in the future, additional water withdrawals could have severe consequences for the local ecology (Simon, 2009; Filipe et al., 2013).
The results of the modeling show that irrigation demand will increase rapidly from mid-century onward. Therefore, it is worth considering not using the reservoirs again until then and implementing infrastructure improvements in the meantime. The complete deconstruction and subsequent rebuilding are probably not feasible from an environmental perspective. Both structural and non-structural measures are available to increase the adaptation effect of local water reservoirs to droughts (Cho et al., 2016). For example, structural measures include an increase in levee height for increasing the storage capacity of reservoirs and conversion of earth canals to pipelines for reducing loss of irrigation water from canals. Non-structural measures may include efficient water management to minimize the loss of agricultural water supplies by adjusting the amount and time of irrigation. To maximize the efficiency of water use, institutional support would be necessary, for instance through the development of a drought forecasting system, a decision support system for effective irrigation, and an automatic water management and monitoring system (Cho et al., 2016).
As explained previously, modeling future changes in the local hydrology and agriculture of the study area is subject to a number of uncertainties. This must be considered by policymakers and resource managers when implementing the study findings and the recommendation. It must also be recognized that reservoirs can serve several purposes at the same time. For example, reservoir water can not only be used to meet irrigation needs. Small-scale reservoirs also provide protection from wildfires (Holuša et al., 2021) and can be used as flood control measures (Gotoh et al., 2011).
Conclusion and outlook
Changing climatic conditions in eastern Germany will lead to a higher frequency of drought events and therefore to an increased drought risk in this region. It is vital to develop local adaptation strategies to mitigate the effects of droughts on agriculture in order to ensure future crop production. Small-scale water management reservoirs built in Thuringia during the GDR and decommissioned after the German reunification were examined in this study to determine whether their reuse could be considered as one element of a potential adaptation strategy. For this purpose, three reservoirs of different sizes in the Greiz district were selected. The main objective was to investigate and contextualize the impacts of climate change on local hydrology, soil moisture, water demands and crop production, and the use of water from the reservoirs to meet future irrigation needs by using WEAP.
The modeling results project an increasing water demand in both scenarios toward the end of the twenty-first century, which could double between the near future (2020–2040) and the distant future (2071–2100). As the water demand for irrigation increases, the unmet demand also becomes higher. In this case, neither the amount of precipitation nor the water from the reservoirs is sufficient to ensure adequate soil moisture for the crops. As a result, yields will decrease. However, the WEAP model showed that it is worthwhile to use the water from the reservoirs. Between 6.2 and 13.5% more crop production was calculated to be possible with the additional irrigation. Especially toward the end of this century, it becomes more and more important to irrigate supplementary. The findings of the study also show that supplemental water from reservoirs can meet demands in the early growing season up to May. It is only from June onwards that irrigation needs can no longer be met, which could also threaten harvests. However, the stored water could serve as a “last reserve” and only be used when a complete crop failure is expected. This would potentially lead to water resources lasting longer.
The study concludes that it could be beneficial to use the water from the reservoirs to irrigate the surrounding agricultural fields. However, the results of the study are only one component in a complex decision-making process, and are intended to provide useful insights about future climatic changes and their local impacts for decision makers. It is important to thoroughly clarify farmers' needs in advance before taking any action, and to update frequently and adapt to the respective requirements.
For modeling the water resources and the local demands of the catchment areas, WEAP is a suitable tool, as it takes into account both the physical conditions and the management aspects. Therefore, it makes sense to use WEAP also for the analysis of the other small water management reservoirs in Thuringia to clarify how they could be used in the future. Since water reservoirs and dams exist not only in Thuringia, but also in other federal states of Germany and in other countries, the study could be used as a reference for identifying the potential of this type of infrastructure as an adaptation strategy to climate change impacts. However, it should be taken into account that data acquisition and modeling are quite complex. It is therefore advisable to exemplarily select small-scale water infrastructures (e.g., reservoirs) for a region, conduct the modeling using WEAP and then derive conclusions for other local water infrastructures on the basis of the modeling results. In order to verify the transferability of this approach to other countries, further studies are needed.
In summary, the study suggests that the use of water reservoirs could be an effective adaptation strategy to mitigate agricultural drought risk and therefore to maintain local crop production and counteract crop losses on a local scale. From this perspective, the recommissioning of the Pohlen and Letzendorf reservoirs is recommended. However, it is necessary to include local user interests and needs in the evaluation in order to conduct a benefit-cost analysis, and to avoid future conflicts. Therefore, further studies are essential to provide a final recommendation to decision makers.
Data availability statement
The datasets presented in this article are not readily available because the raw data supporting the results of this article may be available subject to confidentiality and copyright requirements. Requests to access the datasets should be directed to Y2hyaXN0aW5lLmhlaW56ZWxAdW5pLWJvbm4uZGU=.
Author contributions
CH, MF, and BH: conceptualization and writing–review and editing. CH and BH: methodology. CH: formal analysis, visualization, and writing–original draft. BH: supervision. All authors contributed to the article and approved the submitted version.
Conflict of interest
Author MF was employed by Thüringer Fernwasserversorgung.
The remaining authors declare that the research was conducted in the absence of any commercial or financial relationships that could be construed as a potential conflict of interest.
Publisher's note
All claims expressed in this article are solely those of the authors and do not necessarily represent those of their affiliated organizations, or those of the publisher, the editors and the reviewers. Any product that may be evaluated in this article, or claim that may be made by its manufacturer, is not guaranteed or endorsed by the publisher.
References
Agarwal, S., Patil, J. P., Goyal, V. C., and Singh, A. (2019). Assessment of water supply–demand using water evaluation and planning (WEAP) model for Ur river watershed, Madhya Pradesh, India. J. Instit. Eng. Series A 100, 21–32. doi: 10.1007/s40030-018-0329-0
Ahmadaali, J., Barani, G. A., Qaderi, K., and Hessari, B. (2018). Analysis of the effects of water management strategies and climate change on the environmental and agricultural sustainability of Urmia Lake Basin, Iran. Water. 10, 160. doi: 10.3390/w10020160
Allen, R. G., Pereira, L. S., Raes, D., and Smith, M. (1998). Crop Evapotranspiration Guidelines for Computing Crop Water Requirements, FAO Irrigation and Drainage Paper 56. Rome: Food and Agriculture Organization.
Amato, C. C., McKinney, D. C., Ingol-Blanco, E., and Teasley, R. L. (2006). WEAP Hydrology Model Applied: The Rio Conchos Basin, CRWR Online Report 06-12, Center for Research in Water Resources, Austin, TX: University of Texas.
Amin, A., Iqbal, J., Asghar, A., and Ribbe, L. (2018). Analysis of current and future water demands in the upper indus basin under IPCC climate and socio-economic scenarios using a hydro-economic WEAP model. Water. 10, 537. doi: 10.3390/w10050537
Bazzi, H., Ebrahimi, H., and Aminnejad, B. (2021). A comprehensive statistical analysis of evaporation rates under climate change in Southern Iran using WEAP (Case study: Chahnimeh Reservoirs of Sistan Plain). Ain Shams Eng. J. 12, 1339–1352. doi: 10.1016/j.asej.2020.08.030
Beven, K. J., and Alcock, R. E. (2012): Modelling everything everywhere: a new approach to decision-making for water management under uncertainty. Freshwater Biol. 57, 124–132. doi: 10.1111/j.1365-2427.2011.02592.x
Bhaduri, A., Bogardi, J., Siddiqi, A., Voigt, H., Vörösmarty, C., Pahl-Wostl, C., et al. (2016). Achieving sustainable development goals from a water perspective. Front. Environ. Sci. 4, 64. doi: 10.3389/fenvs.2016.00064
Bindi M. Olsen J. E. (2011): The responses of agriculture in Europe to climate change. Reg. Environ. Change. 11, 151–158. 10.1007/s10113-010-0173-x,
BMEL (2018). Erntebericht 2018. Bundesministerium für Ernährung und Landwirtschaft. Available online at: https://www.bmel.de/DE/themen/landwirtschaft/pflanzenbau/ackerbau/ernte2018.html (accessed July7, 2021).
Bouras, E., Jarlan, L., Khabba, S., Er-Raki, S., Dezetter, A., Sghir, F., et al. (2019). Assessing the impact of global climate changes on irrigated wheat yields and water requirements in a semi-arid environment of Morocco. Sci. Rep. 9, 19142. doi: 10.1038/s41598-019-55251-2
Bouwer, L. M. (2011). Have disaster losses increased due to anthropogenic climate change? Bull. Am. Meteorol. Soc. 92, 9–46. doi: 10.1175/2010BAMS3092.1
Brás, A. T., Seixas, J., Carvalhais, N., and Jägermeyr, J. (2021). Severity of drought and heatwave crop losses tripled over the last five decades in Europe. Environ. Res. Lett. 16, abf004. doi: 10.1088/1748-9326/abf004
Brisson, N., Gate, P., Gouache, D., Charmet, G., Oury, F. X., Huard, F., et al. (2010). Why are wheat yields stagnating in Europe? A comprehensive data analysis for France. Field Crops Res. 119, 201–212. doi: 10.1016/j.fcr.2010.07.012
Cho, J., Ko, G., Kim, K., and Oh, C. (2016). Climate change impacts on agricultural drought with consideration of uncertainty in CMIP5 scenarios. Irrig. Drain. 65, 7–15. doi: 10.1002/ird.2035
Corbari, C., Ravazzani, G., Galvagno, M., Cremonese, E., and Mancini, M. (2017). Assessing crop coefficients for natural vegetated areas using satellite data and eddy covariance stations. Sensors. 17, 2664. doi: 10.3390/s17112664
Dimova, G., Tzanov, E., Ninov, P., Ribarova, I., and Kossida, M. (2014). Complementary use of the WEAP model to underpin the development of SEEAW physical water use and supply tables. Proc. Eng. 70, 563–572. doi: 10.1016/j.proeng.2014.02.062
Dommermuth, H., and Trampf, W. (1991): Die Verdunstung in der Bundesrepublik 1951 bis 1980. Karten: Deutscher Wetterdienst, Eigenverlag, Offenbach.
DVWK (1996). Ermittlung der Verdunstung von Land- und Wasserflächen. Hamburg; Berlin: DVWK Merkblatt; Verlag Paul Parey. 238, 177.
Ehsani, N., Vörösmarty, C. I., Fekete, B. M., and Stakhiv, E. Z. (2017). Reservoir operations under climate change: storage capacity options to mitigate risk. J. Hydrol. 555, 435–446. doi: 10.1016/j.jhydrol.2017.09.008
Fallah-Mehdipour, E., Bozorg-Haddad, O., and Loáiciga, H. A. (2020). Climate-environment-water: integrated and non-integrated approaches to reservoir operation. Environ. Monit. Assess. 192, 60. doi: 10.1007/s10661-019-8039-2
Filipe, A. F., Lawrence, J. E., and Bonada, N. (2013). Vulnerability of stream biota to climate change in mediterranean climate regions: a synthesis of ecological responses and conservation challenges. Hydrobiologia. 719, 331–351. doi: 10.1007/s10750-012-1244-4
GDI-Th (2021). Geodaten in Thüringen. (Geoportal Thüringen). Available online at: https://www.geoportal-th.de/de-de/ (accessed January 20, 2022).
Gondim, R. S., de Castro, M. A. H., Maia, A. N. D., Evangelista, S. R. M., and Fuck, S. C. D. (2012). Climate change impacts on irrigation water needs in the Jaguaribe River Basin. J. Am. Water Resour. Assoc. 48, 355–365. doi: 10.1111/j.1752-1688.2011.00620.x
Gotoh, H., Maeno, Y., Takezawa, M., and Ohnishi, M. (2011). Flood control and small-scale reservoirs. Conf.: River Basin Manag. 146, 51–60. doi: 10.2495/RM110051
GRDC (2011): Watershed Boundaries of GRDC Stations/Global Runoff Data Centre. Koblenz: Federal Institute of Hydrology (BfG).
Grusson, Y., Wesström, I., and Joel, A. (2021). Impact of climate change on Swedish agriculture: growing season rain deficit and irrigation need. Agric. Water Manag. 251, 106858. doi: 10.1016/j.agwat.2021.106858
Hatamkhani, A., Shourian, M., and Moridi, A. (2021). Optimal design and operation of a hydropower reservoir plant using a WEAP-based simulation–optimization approach. Water Resour. Manag. 35, 1637–1652. doi: 10.1007/s11269-021-02821-7
Hawkins, E., and Sutton, R (2011). The potential to narrow uncertainty in projections of regional precipitation change. Climate Dyn. 37, 407–418. doi: 10.1007/s00382-010-0810-6
Her, Y., Yoo, S. H., Cho, J., Hwang, S., Jeong, J., Seong, C., et al. (2019). Uncertainty in hydrological analysis of climate change: multi-parameter vs. multi-GCM ensemble predictions. Sci. Rep. 9, 1–22. doi: 10.1038/s41598-019-41334-7
Höllermann, B., Giertz, S., and Diekkrüger, B. (2010). Benin 2025—balancing future water availability and demand using the WEAP ‘water evaluation and planning' system. Water Resour. Manag. 24, 3591–3613. doi: 10.1007/s11269-010-9622-z
Holman, I. P., Hess, T. M., Rey, D., and Knox, J. W. (2021). A multi-level framework for adaptation to drought within temperate agriculture. Front. Environ. Sci. 8, 589871. doi: 10.3389/fenvs.2020.589871
Holuša, J., Koren, M., Berčák, R., Resnerová, K., Trombik, J., Vaněk, J., et al. (2021). A simple model indicates that there are sufficient water supply points for fighting forest fires in the Czech Republic. Int. J. Wildland Fire. 30, 428–439. doi: 10.1071/WF20103
Hunter, C., Gironás, J., Bolster, D., and Karavitis, C. A. (2015). A dynamic, multivariate sustainability measure for robust analysis of water management under climate and demand uncertainty in an arid environment. Water. 7, 5928–5958. doi: 10.3390/w7115928
IPCC (2014). “Climate change 2014: synthesis report,” in Contribution of Working Groups I, II and III to the Fifth Assessment Report of the Intergovernmental Panel on Climate Change, eds R. K. Pachauri and L. A. Meyer (Geneva, Switzerland), pp. 151.
IPCC (2021). “Climate change 2021: the physical science basis,” in Contribution of Working Group I to the Sixth Assessment Report of the Intergovernmental Panel on Climate Change, eds V. Masson-Delmotte, P. Zhai, A. Pirani, S. L. Connors, C. Péan (Cambridge University Press). In Press.
Joyce, B. A., Mehta, V. K., Purkey, D. R., Dale, L. L., and Hanemann, M. (2011). Modifying agricultural water management to adapt to climate change in California's Central Valley. Clim. Change. 109, 299–316. doi: 10.1007/s10584-011-0335-y
Kang, Y., Khan, S., and Ma, X. (2009). Climate change impacts on crop yield, crop water productivity and food security – A review. Prog. Natl. Sci. 19, 1665–1674. doi: 10.1016/j.pnsc.2009.08.001
Khalil, A., Rittima, A., and Phankamolsil, Y. (2018). The projected changes in water status of the Mae Klong Basin, Thailand, using WEAP model. Paddy Water Environ. 16, 439–455. doi: 10.1007/s10333-018-0638-y
Kiang, J. E., Gazoorian, C., McMillan, H., Coxon, G., Le Coz, J., Westerberg, I. K., et al. (2018). A comparison of methods for streamflow uncertainty estimation. Water Resour. Res. 54, 7149–7176. doi: 10.1029/2018WR022708
Kolar, P., Trnka, M., Brazdil, R., and Hlavinka, P. (2014). Influence of climatic factors on the low yields of spring barley and winter wheat in southern Moravia (Czech Republic) during the 1961-2007 period. Theor. Appl. Climatol. 117, 707–721. doi: 10.1007/s00704-013-1037-3
Kreienkamp, F., Paxian, A., Früh, B., Lorenz, P., and Matulla, C. (2019). Evaluation of the empirical–statistical downscaling method EPISODES. Clim. Dynam. 52, 991–1026. doi: 10.1007/s00382-018-4276-2
Kristensen, K., Schelde, K., and Olesen, J. E. (2011). Winter wheat yield response to climate variability in Denmark. J. Agric. Sci. 149, 33–47. doi: 10.1017/S0021859610000675
Krysanova, V., Dickens, C., Timmerman, J., Varela-Ortega, C., Schlüter, K., Roest, K., et al. (2010). Cross-comparison of climate change adaptation strategies across large river basins in Europe, Africa and Asia. Water Resour. Manag. 24, 4121–4160. doi: 10.1007/s11269-010-9650-8
Kushner, P., Mudryk, L., Merryfield, W., Ambadan, J., Berg, A., Bichet, A., et al. (2018). Canadian snow and sea ice: assessment of snow, sea ice, and related climate processes in Canada's Earth system model and climate-prediction system. Cryosphere. 12, 1137–1156. doi: 10.5194/tc-12-1137-2018
Lee, S. H., Shin, S., Choi, J. Y., Park, J., and Yoo, S. H. (2020). Assessing the resilience of agricultural reservoirs in ungauged catchments under climate change using a ratio correction factors-based calibration and run theory. Water. 12, 1618. doi: 10.3390/w12061618
Lemaitre-Basset, T., Oudin, L., and Thirel, G. (2022). Evapotranspiration in hydrological models under rising CO2: a jump into the unknown. Clim. Change. 172, 36. doi: 10.1007/s10584-022-03384-1
Lernort-Bauernhof-Thueringen (2021). Lernort im Landkreis Greiz. Agrargenossenschaft Rückersdorf. Available online at: https://lernort-bauernhof-thueringen.de/2019/06/28/agrargenossenschaft-rueckersdorf/ (accessed June 7, 2021).
Li, Y., Guan, K., Schnitkey, G. D., DeLucia, E., and Peng, B. (2019). Excessive rainfall leads to maize yield loss of a comparable magnitude to extreme drought in the United States. Global Change Biol. 25, 2325–2337. doi: 10.1111/gcb.14628
Logar, I., and van den Bergh, J. C. J. M. (2013). Methods to assess costs of drought damages and policies for drought mitigation and adaptation: review and recommendations. Water Resour. Manag. 27, 1707–1720. doi: 10.1007/s11269-012-0119-9
Lopes Ribeiro, F., Guevara, M., Vázquez-Lule, A. D., Cunha, A. P., Zeri, M., Vargas, R., et al. (2021). The impact of drought on soil moisture trends across Brazilian biomes. Nat. Hazards Earth Syst. Sci. 21, 879–892. doi: 10.5194/nhess-21-879-2021
Marx, A., Thober, S., Kelbling, M., Samaniego, L., and Zink, M. (2018). “The 2018 agricultural drought in Germany,” in AGU Fall Meeting Abstracts (Washington, D.C., USA). 12.
Mbow, C., Rosenzweig, C., Barioni, L. G., Benton, T. G., Herrero, M., Krishnapillai, M., et al. (2019). “Food security,” in Climate Change and Land: an IPCC Special Report on Climate Change, Desertification, Land Degradation, Sustainable Land Management, Food Security, and Greenhouse Gas Fluxes in Terrestrial Ecosystems, eds P. R. Shukla, J. Skea, E. Calvo Buendia, V. Masson-Delmotte, H. O. Pörtner, D. C. Roberts, et al. In press.
Moges, E., Demissie, Y., Larsen, L., and Yassin, F. (2021). Review: sources of hydrological model uncertainties and advances in their analysis. Water. 13, 28. doi: 10.3390/w13010028
Möller, M., Kühne, R., and Fink, M. (2020). “Situation an den Talsperren. P.179-194,” in Niedrigwasser und Trockenheit in Thüringen, eds Thüringer Ministerium für Umwelt, Energie und Naturschutz (Jena: Schriftenreihe 120).
Mudersbach, C. (2020). Methoden zur Ermittlung des Gesamtzuflusses bei Talsperren – Grundsätze und Fallbeispiel. WasserWirtschaft. 110, 32–39. doi: 10.1007/s35147-020-0411-1
Müller, M., Zinkernagel, J., Kleber, J., Fricke, E., Beck, M., Göttl, M., et al. (2020). “Beratungsblatt Kulturartbezogene Kennzahlen. Grundlagen zur Bewässerungs-App,” in Ausgabe Teil 1, eds Arbeitsgemeinschaft Landtechnik und Landwirtschaftliches Bauwesen in Bayern e.V. (ALB) (Freising).
Nam, W. H., Choi, J. Y., Yoo, S. H., and Jang, M. W. (2012). A decision support system for agricultural drought management using risk assessment. Paddy Water Environ. 10, 197–207. doi: 10.1007/s10333-012-0329-z
Nasr, A., and Hynds, P (2016). “Small catchment hydrodynamic modelling: Comparing three modelling approaches,” in National Hydrology Conference 2016 (Athlone, Ireland).
Nikkels, M. J., van Oel, P. R., Meinke, H., and Hellegers, P. J. G. J. (2019). Challenges in assessing the regional feasibility of local water storage. Water Int. 44, 854–870. doi: 10.1080/02508060.2019.1656429
Olabanji, M. F., Ndarana, T., and Davis, N. (2021). Impact of climate change on crop production and potential adaptive measures in the olifants catchment, South Africa. Climate. 9, 6. doi: 10.3390/cli9010006
Ranke, C. (2016). “Vorstudie Instandsetzung Talsperre Letzendorf,” in 21. Thüringer Wasserkolloquium, eds Fachhochschule Erfurt. Available online at: https://www.db-thueringen.de/servlets/MCRFileNodeServlet/dbt_derivate_00041360/2016_thuewako_21%20A.pdf (accessed July 11, 2021).
Save, R., de Herralde, F., Aranda, X., Pla, E., Pascual, D., Funes, I., et al. (2012). Potential changes in irrigation requirements and phenology of maize, apple trees and alfalfa under global change conditions in Fluvia watershed during XXIst Century: results from a modeling approximation to watershed-level water balance. Agric. Water Manag. 114, 78–87. doi: 10.1016/j.agwat.2012.07.006
Scheff, J., and Frierson, D. M.W. (2014): Scaling potential evapotranspiration with greenhouse warming. J. Clim. 27, 1539–1558. doi: 10.1175/JCLI-D-13-00233.1
SEI (2015). USER GUIDE for Water Evaluation and Planning System (WEAP), eds. Somerville, MA: Stockholm Environment Institute.
Shiau, J. T., Hung, Y. N., and Sie, H. E. (2018). Effects of hedging factors and fuzziness on shortage characteristics during droughts. Water Resour. Manag. 32, 1913–1929. doi: 10.1007/s11269-018-1912-x
Shrestha, R., Di, L., Yu, E. G., Kang, L., Shao, Y. Z., Bai, Y. Q., et al. (2017). Regression model to estimate flood impact on corn yield using MODIS NDVI and USDA cropland data layer. J. Integ. Agric. 16, 398–407. doi: 10.1016/S2095-3119(16)61502-2
Sieber, J., and Purkey, D (2015). “WEAP—water evaluation and planning system,” in User Guide for WEAP21, Somerville, MA: Stockholm Environment Institute.
Simon, M. (2009). Die Landwirtschaftliche Bewässerung in Ostdeutschland seit 1949. PIK Report. 114. Potsdam 92. Potsdam, Germany: Potsdam Institute for Climate Impact Research (PIK).
Smith, K. (2013). Hydrological Hazards. Environmental Hazards - Assessing Risk and Reducing Disaster. New York, NY: Routledge. 337–370.
Srinivasan, V., Sanderson, M., Garcia, M., Konar, M., Blöschl, G., Sivapalan, M., et al. (2018). Moving socio-hydrologic modelling forward: unpacking hidden assumptions, values and model structure by engaging with stakeholders: reply to “What is the role of the model in socio-hydrology?”. Hydrol. Sci. J. 63, 1444–1446. doi: 10.1080/02626667.2018.1499026
Sun, W., Ishidaira, H., Bastola, S., and Yu, J. (2015). Estimating daily time series of streamflow using hydrological model calibrated based on satellite observations of river water surface width: toward real world applications. Environ. Res. 139, 36–45. doi: 10.1016/j.envres.2015.01.002
Teklu, S., Soliman, A., and El-Zawahry, A. (2020). Testing the WEAP hydrologic model for awash basin, ethiopia “soil moisture module with watershed demand approach”. Civil Environ. Res. 12, 59–74. doi: 10.7176/CER/12-3-07
TFW (2021a). Innovatives Bewässerungsprojekt an der Talsperre Frohndorf . Thüringer Fernwasserversorgung. Available online at: https://www.thueringer-fernwasser.de/zusaetzliche-inhalte/bewaesserung-frohndorf.html (accessed June 25, 2021).
TFW (2021b). Stauanlagen des Landes. Thüringer Fernwasserversorgung. Available online at: https://www.thueringer-fernwasser.de/umwelt-und-hochwasserschutz/stauanlagen_land.html (accessed July 9, 2021).
Thober, S., Marx, A., and Boeing, F. (2018). Auswirkungen der globalen Erwärmung auf hydrologische und agrarische Dürren und Hochwasser in Deutschland, Potsdam: Helmholtz-Zentrum für Umweltforschung GmbH – UFZ.
TLS (2017). Statistischer Bericht. Bodennutzung in Thüringen 2016. Erfurt, Germany. Thüringer Landesamt für Statistik. Available online at: https://statistik.thueringen.de/webshop/pdf/2016/03103_2016_00.pdf (accessed July 9, 2021).
TLS (2021). Anbauflächen und Ernteerträge ausgewählter landwirtschaftlicher Fruchtarten in Thüringen. Thüringer Landesamt für Statistik. Available online at: https://statistik.thueringen.de/datenbank/TabAnzeige.asp?tabelle=ld000513%7C%7C (accessed July 7, 2021).
TLUBN (2021a). Landkreis Greiz – Geographie. Thüringer Ministerium für Umwelt, Energie und Naturschutz. Available online at: http://www.tlug-jena.de/uw_raum/umweltregional/grz/ (accessed June 29, 2021).
TLUBN (2021b). Hochwassernachrichtenzentrale. Aktuelle Wasserstände und Durchflüsse: Thüringen. Thüringer Ministerium für Umwelt, Energie und Naturschutz. Available online at: https://hnz.thueringen.de/hw20./thueringen.html (accessed June 28, 2021).
TU Dresden (2021). ReKIS – Regionales Klimainformationssystem Sachsen, Sachsen-Anhalt, Thüringen. Available online at: http://www.rekis.org (accessed June 5, 2021).
Van Duinen, R., Filatova, T., Jager, W., and van der Veen, A. (2016). Going beyond perfect rationality: drought risk, economic choices and the influence of social networks. Ann. Reg. Sci. 57, 335–369. doi: 10.1007/s00168-015-0699-4
Vano, J. A., Scott, M. J., Voisin, N., Stöckle, C. O., Hamlet, A. F., Mickelson, K. E. B., et al. (2010). Climate change impacts on water management and irrigated agriculture in the Yakima River Basin, Washington, USA. Clim. Change. 102, 287–231. doi: 10.1007/s10584-010-9856-z
Win, S. K., Zamora, O. B., and Thein, S. (2014). Determination of the water requirement and Kc values of sugarcane at different crop growth stages by lysimetric method. Sugar Tech. 16, 286–294. doi: 10.1007/s12355-013-0282-1
Wisser, D., Frolking, S., Douglas, E., Fekete, B., Schumann, A., Vörösmarty, C., et al. (2010). The significance of local water resources captured in small reservoirs for crop production – a global-scale analysis. J. Hydrol. 384, 264–275. doi: 10.1016/j.jhydrol.2009.07.032
Xiao, D., Shi, Y., Brantley, S. L., Forsythe, B., DiBiase, R., Davis, K., et al. (2019). Streamflow generation from catchments of contrasting lithologies: the role of soil properties, topography, and catchment size. Water Resour. Res. 55, 9234.– 9257. doi: 10.1029/2018WR023736
Keywords: reservoirs, water resource management, WEAP model, scenario analysis, climate change adaptation, Germany, drought
Citation: Heinzel C, Fink M and Höllermann B (2022) The potential of unused small-scale water reservoirs for climate change adaptation: A model- and scenario based analysis of a local water reservoir system in Thuringia, Germany. Front. Water 4:892834. doi: 10.3389/frwa.2022.892834
Received: 09 March 2022; Accepted: 12 August 2022;
Published: 06 September 2022.
Edited by:
Tobias Krueger, Humboldt University of Berlin, GermanyReviewed by:
Joseph Guillaume, Australian National University, AustraliaBojan Ðurin, University North, Croatia
Copyright © 2022 Heinzel, Fink and Höllermann. This is an open-access article distributed under the terms of the Creative Commons Attribution License (CC BY). The use, distribution or reproduction in other forums is permitted, provided the original author(s) and the copyright owner(s) are credited and that the original publication in this journal is cited, in accordance with accepted academic practice. No use, distribution or reproduction is permitted which does not comply with these terms.
*Correspondence: Christine Heinzel, Y2hyaXN0aW5lLmhlaW56ZWxAdW5pLWJvbm4uZGU=