 Lisa K. Gallagher1,2*
 Abram J. Farley3Calla Chennault4
 Sara Cerasoli4
 Sébastien Jourdain5Patrick O'Leary5
 Laura E. Condon3
 Reed M. Maxwell1,2,4
- 1High Meadows Environmental Institute, Princeton University, Princeton, NJ, United States
- 2Integrated GroundWater Modeling Center, Princeton University, Princeton, NJ, United States
- 3Department of Hydrology and Atmospheric Sciences, University of Arizona, Tucson, AZ, United States
- 4Department of Civil and Environmental Engineering, Princeton University, Princeton, NJ, United States
- 5Kitware, Inc., Santa Fe, NM, United States
Physical aquifer models are a highly effective teaching tool for hydrology education, however they come with inherent limitations that include the high cost to purchase, the static configuration of the model materials, the time required to visualize hydrogeological phenomena, and the effort to reset and clean them over time. To address these and other limitations, we have developed an interactive computer simulation of a physical aquifer model called the ParFlow Sandtank. In this gamified interface, users run the simulation using a familiar web-app like interface with sliders and buttons while learning real hydrologic concepts. Our user interface allows participants to dive into the world of hydrology, understanding assumptions about model parameters such as hydraulic conductivity, making decisions about inputs to groundwater aquifer systems such as pumping rates, visualizing outputs such as stream flow, transport, and saturation, and exploring various factors that impact real environmental systems such as climate change. The ParFlow Sandtank has already been used in a variety of educational settings with more than 9,000 users per year, and we feel this emerging educational tool can be used broadly in educational environments and can be scaled-up to provide greater accessibility for students and educators. Here we present the capabilities and workflow of the ParFlow Sandtank, two use cases, and additional tools and custom templates that have been developed to support and enhance the reach of the ParFlow Sandtank.
Introduction
Understanding the hydrologic cycle and how humans interface with and impact various components is paramount to our collective water future. Water is also a significant force in extreme weather and climate events, which continue to steadily climb in frequency and severity each year. The water challenges of the future are here and it is our responsibility to educate the next generation to make informed choices to respond and remain resilient to the changing climate.
In hydrology education, physical models are used extensively to teach a variety of concepts, from streamflow generation to climate change related phenomena. Schulz et al. (2018) developed an active participation experiment that gave students the opportunity to be conduits of water in a catchment, moving water through systematically using simple rules for flow routing, to generate a hydrograph. This activity used plastic balls to represent a unit of water, and students were arranged in different seating schemes to demonstrate how spatial differences in the catchment could impact the generated hydrograph. Although this group did not formally study the outcome, they determined that this activity positively impacted the learning experience of the students. Physical models are also particularly useful to visualize groundwater and subsurface processes since these pose challenges for visualization and are often ignored or underrepresented. Using a juice box to represent an individual pore of a confined aquifer, Singha (2008) developed a simple activity to demonstrate how pumping from a confined aquifer can potentially lead to subsidence. The concepts of aquifer contraction and water expansion were acknowledged to be difficult processes to understand, hence the motivation for Singha's model development. By working in groups to make observable connections between the effective stress, applied total stress, and fluid pressure, the researcher concluded that the juice box apparatus provided students with memorable ways to solidify these concepts in their minds. Finally, there are Darcy Tubes—plexiglass cylinders filled with porous material that can be used to demonstrate Darcy's Law. This demonstration tool has been used by many to teach foundational hydrology concepts (Werner and Roof, 1994; Nicholl and Scott, 2000; Neupauer and Dennis, 2010).
Our research team has relied heavily on physical aquifer models for education and outreach, which resemble an “ant farm,”—a rectangular box made of plexiglass filled with various geologic materials like gravel, clay, and sand. An example of this apparatus can be seen in Figure 1. Rodhe (2012) describes the use of this model type, to visualize and define a variety of features, including the water table, saturated and unsaturated zones, confined and unconfined aquifers, and flow lines and particle velocity. This tank model has been used extensively by Rodhe (2012), who concludes that these models are valuable tools for students and lecturers, and that the initial training on this teaching tool is a worthwhile investment. Singha and Loheide II (2010) took these sandtank models a step further by linking the physical model sandtanks with commensurate models in COMSOL Multiphysics. The authors' work was motivated by the fact that the geosciences have become mathematically intensive, which results in challenges when developing pedagogical content to relate this demand to physically based processes they have learned about. The students participating in this coupled activity improved their understanding of the capabilities and limitations of numerical modeling.
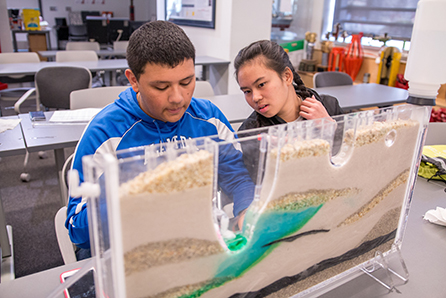
Figure 1. Students exploring groundwater scenarios using a physical aquifer model.
Although these physical aquifer models are exciting and effective teaching tools for hydrology education, they have inherent limitations: (1) Users require access to the physical model; (2) models have a prohibitively high cost to purchase for many educators; (3) models often require trained personnel to deliver instructive lessons; (4) the required time to visualize hydrogeological phenomena and “reset” the system can be long; and (5) the static configuration of model materials does not allow for setup variety. To address these inherent limitations as well as the need for quick pivoting to online teaching during the 2020 COVID-19 lockdown, our team developed an interactive computer simulation of a physical aquifer model called the ParFlow Sandtank (PFST; Figure 2). Our development goal was to create an educational tool that could be used to achieve the same instructional goals as the physical model, while addressing the limitations described previously.
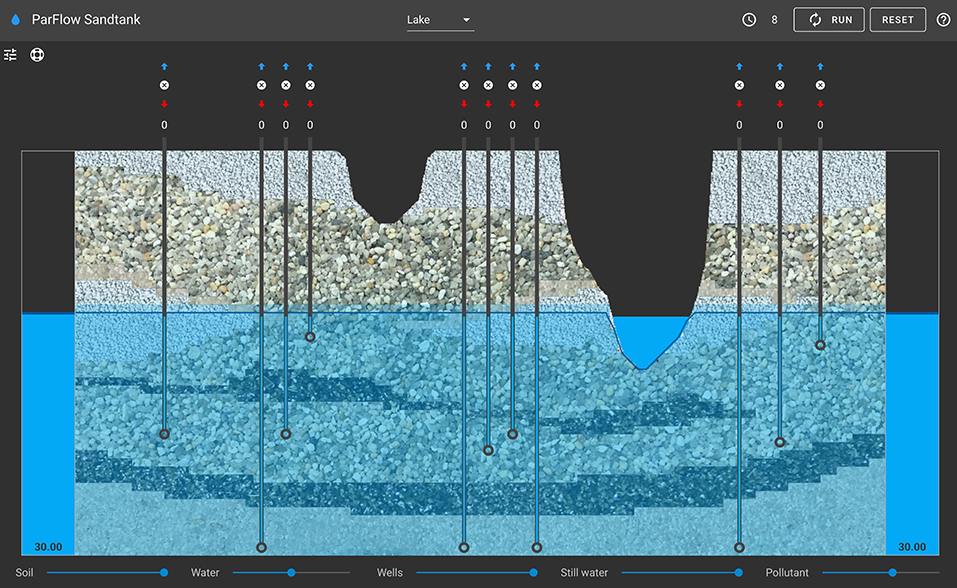
Figure 2. The ParFlow Sandtank model interface.
Although our development of the PFST began prior to the initial lockdown of 2020, we quickly saw that this tool could be highly useful under these rapidly changing circumstances that required educators to make extremely quick pivots to online teaching. In addition to the PFST model, we have developed a user manual, additional templates (described in Section Custom templates and additional functionality), and a machine learning teaching tool based on PFST, called Sandtank-ML (Gallagher et al., 2021).
In this paper, we provide an overview of the ParFlow Sandtank capabilities, workflow, and backend components, followed by a collection of sample learning objectives and two use cases.
ParFlow Sandtank: Pieces, parts, and how-to
In previous sections, we highlighted the benefits and limitations of the physical model for delivering large-scale, complex hydrologic concepts to students. To create a competitive computational model replacement of the physical model, we must maintain the hands-on benefits of the physical model while addressing some of its limitations. Our computational model design focuses on integrated components to support dynamic domain configuration and client-server interactivity to achieve the primary hands-on requirement. The PFST components are described in each section below, they are a workflow that wraps all components in a gamelike interface, the ParFlow integrated hydrologic model used to simulate the physical sand tank model, and the EcoSLIM particle tracking code used to simulate dye injection via the well ports.
ParFlow Sandtank capabilities and application workflow
The ParFlow Sandtank has a game-like browser-based interface that builds upon open-source software components developed by Kitware (e.g., ParaView and SimPut), executing the integrated hydrology model ParFlow, using a framework built upon the widely used Python scripting language. Users run the simulation using a familiar web-app like interface with sliders and buttons, yet are learning hydrologic concepts. Our user interface allows participants to dive into the world of hydrology, making decisions about inputs to groundwater aquifer systems such as pumping rates and conductivity, visualizing outputs such as stream flow, transport, and saturation, and exploring various factors that impact real environmental systems. What makes this educational tool unique, is that the PFST is actually running ParFlow in the background, inputting user selections and generating real output. Additionally, our virtual slice of the subsurface, the PFST, overcomes many of the limitations of the physical model.
The default ParFlow Sandtank, along with highlighted features, is presented in Figure 3. First, we have the water drop button, which allows the user to toggle between light and dark backgrounds to aid in visualization. Feature 2 is the Lake/River dropdown menu, which provides the choice between setting feature 14 (lake/river feature) to behave as either a lake or a river, storing water or allowing water to flow freely from the feature. The clock icon is feature 3, which tracks the elapsed number of timesteps; each time the user clicks the run button (feature 4) eight timesteps will occur. Feature 5 is the reset button, which returns the hydraulic head sliders (feature 12) to the default setting of 30.00 (note that the geologic material settings will not be changed with the reset button; also the water table will not return to the default setting of 30.00 until the user also clicks on the run button). The question mark button (feature 6) has two functionalities: if the user clicks on this button, an informational box appears that provides general development information about PFST; If the user hovers their mouse over this icon, lake storage or river flow metrics are displayed depending on the toggle selection. Feature 7 is the tank conditions button, which displays features 8 and 9 to the user. The opacity sliders (feature 8) let the user change the opacity of the soil/geologic features, water, wells, still water, and pollutant. Soil material selection sliders (feature 9) provide the user with flexibility in the type and location of material in the model. Feature 10 is the life preserver button, which takes the user to the ParFlow Sandtank user manual on the hydroframe.org website. Feature 11 is the well switch, which lets the user pump water from each well, inject water/pollutant into each well, or turn the well off. The hydraulic head sliders are feature 12, located on the left and right side of the model. These sliders adjust how much and where water is added to the system. Next, is the leaky landfill feature (number 13), which can represent a landfill, wetland, or other feature with connection to the surface. The last feature is the lake/river feature (feature 14). Water interfaces with this feature based on the user inputs, as well as the specific feature toggle selection.
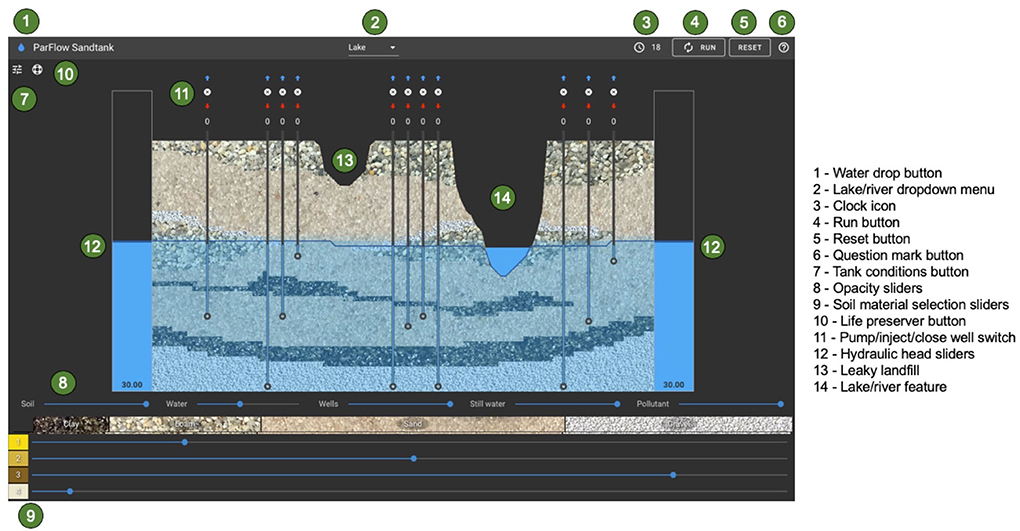
Figure 3. Feature identification for the ParFlow Sandtank (also found in user manual).
ParFlow
ParFlow is an integrated hydrology model that simulates (Kuffour et al., 2020) both variably saturated and subsurface flow (Jones and Woodward, 2001) and overland flow (Kollet and Maxwell, 2006). It has been applied to many domains worldwide and has a large active user and development community. ParFlow is open source, written primarily in C and is freely available on GitHub1. It has been developed to take advantage of parallel compute architectures (Ashby and Falgout, 1996) and runs on many architectures from laptop to supercomputer. Recently, ParFlow has been deployed in containerized environments, such as Docker and Singularity, to allow for easy deployment in virtual machine or cloud environments. For this application, ParFlow is built in a container and connected to other application components as detailed below.
EcoSLIM
EcoSLIM is a parallel, Lagrangian, particle tracking platform (Maxwell et al., 2019) that simulates advective and dispersive transport in variably saturated systems and has been extended to multi-GPU platforms (Yang et al., 2021). EcoSLIM is an open-source platform that is actively under development and available on GitHub2. EcoSLIM uses the flux output from an integrated hydrology model (in this case ParFlow) to track parcels of water through a flow system. It has been used to determine source water attribution and for numerical (simulated) hydrograph separation (e.g., Bearup et al., 2016) or evapotranspiration. EcoSLIM outputs particle point information and volume averaged concentrations in the popular VTK file format3. In this application, EcoSLIM is used to track the water injected from wells, in the same way that injected food coloring dye is used in the physical aquifer model. EcoSLIM is also containerized and connected to the rest of the ParFlow Sandtank system as described below.
Custom templates and additional functionality
The ParFlow Sandtank allows users to develop customized templates in addition to the available default template. The default template is designed so that its layout and components are the same as the physical sand tank model, including features such as confining layers, both unconfined and confined aquifers, pumping and extracting wells, and other features discussed previously. By adjusting the input files or developing new ones, users can create custom templates and expand the utility of this educational resource. This process requires the same level of technical ability as is required to develop a ParFlow run.
Custom templates can be developed by altering features such as topography, subsurface configuration, well placements, initial head boundary conditions, and various visualization components. In the default sandtank model the topography includes a combined river/lake feature and a landfill/wetland feature. These features can be changed, and additional features can be added (e.g., a contoured domain surface). The default template subsurface includes four soil types and a subsurface configuration featuring a confining unit. The subsurface can also be customized by creating a new configuration. Eleven wells are featured in the default template with various locations and depths. Wells can be removed and added to a domain with the ability to specify their location and pumping depth. While the default template sets the left and right constant head boundaries equal at 30 m, these boundary conditions can be set individually and for any value. Finally, visualization components such as the background images of soil textures, the pollutant color, and the well injector arrows can also be customized.
The hillslope template which can be found on our project website4 is an example of editing the default files to develop a new template. Detailed instructions of how to develop custom templates, as well as how to contribute templates can be found on our GitHub5. Additionally, hydroframe.org hosts custom templates called “Tucson TCE” and “Agrosystem,” which each feature different capabilities. The “Tucson TCE” template represents a local aquifer in the Tucson area that has experienced historic TCE pollution and allows users to explore how the subsurface conditions of that aquifer impact pollutant dynamics in the subsurface. The “Agrosystem” template expands the reach of educational topics to include watering practices, crop choices, and other related agricultural decisions, as well as issues related to the changing climate. The “Agrosystem” template uses the same layout as the hillslope template (Figure 4), but builds upon the default sandtank capabilities. Users can adjust surface recharge to simulate different climate conditions, and select the irrigation and water use efficiencies to explore the impact of agricultural water use on the aquifer; it also generates additional output metrics of crop yield, revenue, and total storage of the system, in addition to the default river flow or lake storage metrics.
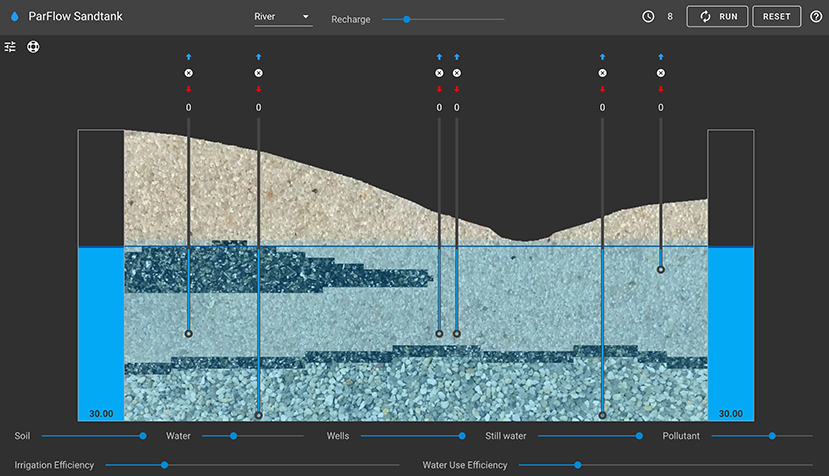
Figure 4. The ParFlow Sandtank Agrosystem custom template.
Design and backend functionality
Integrated components
The ParFlow Sandtank application consists of a client-side presentation layer that leverages server-side modeling, computational, and analysis services that encapsulates the advanced modeling and simulation workflow, including pre-processing, processing, and post-processing tasks. On the server-side, we have two types of services: one stateful and one stateless. A stateful service creates and uses a session to match the service process to a client. It stores state from client requests on the server itself and uses that state to process further client requests. A stateless service does not retain state but rather pulls necessary information from a database or file system to process client requests.
The stateful service provides the modeling and analysis services and leverages ParaViewWeb, which offers a full-featured infrastructure for controlling a stateful Python-based environment. From the ParaViewWeb based service, we can generate a ParFlow input deck from client-side modeling and access ParaView to utilize the visualization toolkit's (VTK) vtkPFBReader for reading ParFlow output for client-side analysis and visualization. In contrast, we use the ParFlow hydrologic model to simulate surface and subsurface flow on high-performance computers and EcoSlim to simulate the advective and diffusive movement of water particles for the stateless computational service that pulls the input deck from a co-located data store.
Client-server interactivity
Our JavaScript client-side presentation layer enables various end-user interactions with the computational model, including swapping out geologic material types, changing constant head boundary conditions, toggling between river flow and lake storage, and injecting, pumping, or closing a variety of wells. The run button requests the generation of the ParFlow and EcoSlim input decks from the stateful service, followed by a simulation request from the stateless service. Finally, the client can monitor and analyze the running ParFlow/EcoSlim simulation requesting data from the stateful service, which reads the current simulation output and forwards the relevant information back to the client. As depicted in Figure 5, the client-side web application goes through a middle layer launcher to start the interactive, stateful ParaViewWeb service when first visiting the web page or the stateless ParFlow/EcoSlim simulation service when pressing the run button. The remaining interactions utilize bi-directional communication directly between the client and stateful ParaViewWeb service using a WebSocket.
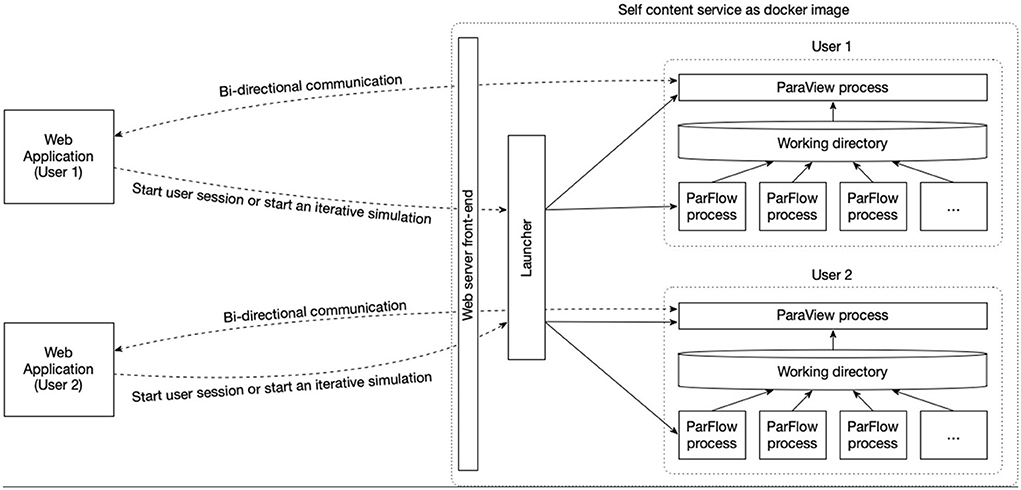
Figure 5. Communication pattern of the ParFlow Sandtank application.
Deployment
The ParaFlow Sandtank application relies on complex software such as ParaView, ParFlow, Hypre, EcoSlim, and ParaViewWeb with a meticulous installation process that varies based on the operating system. To alleviate the requirement of the complex compilation of software for the deployment of ParFlow Sandtank, we leverage Docker. Docker allows us to create a reusable image where we pre-build all the pieces of ParFlow Sandtank to run on various systems. The docker image serves the web application and the infrastructure to run the complete advanced modeling and simulation workflow. This image provides a streamlined deployment and execution of the application. Using the simple command presented below will automatically download the docker image, hydroframe/sandtank, from DockerHub if it is not present on the target computer and run the application where the end-user can access it through HTTP on port 9000 using their browser.
$ docker run -p 9000:80 -it hydroframe/sandtank.
How can we use ParFlow Sandtank
The PFST has been used in a variety of educational settings since the abrupt shift to online teaching, from middle school to undergraduate level environments. This tool was used to introduce groundwater to middle school students to discuss the impact that agricultural practices have on groundwater quality and quantity. The educators we worked with for this event provided highly positive feedback about PFST, mentioning its game-like interface, which appealed to many of their students and allowed them to explore and visualize how groundwater behaves in the subsurface. Outreach events have also been a good setting for using the PFST. Our team has used PFST to teach remote lessons to high school age students, allowing them to work as small groups in breakout rooms to explore scenarios like groundwater-surface water connectivity, wetland dewatering, etc. Since the return to in-person teaching and outreach events, we have also had the opportunity to use the PFST at in-person events with high school students. We participated in a week-long summer workshop, where students had the opportunity to explore the physical aquifer models first, learning about the water table, confined and unconfined aquifers, and concepts like saturation and recharge. After exploration with the physical models, students were introduced to the PFST and asked to walk through various scenarios to evaluate how water behaves in the environment. The participating students, in both remote and in-person settings, were highly engaged and many mentioned how much they liked learning about these concepts through this interface. The in-person students also found the introduction with the physical model helpful. Another educational setting example where PFST has been used is for undergraduate recruitment. This event was designed to highlight fields of study available to the undergraduate population at Princeton University. Students interacted with physical models and PFST; participating faculty and students responded with positive feedback, commending the highly interactive nature of the PFST tool and its ability to easily demonstrate concepts that are more challenging to visualize using the physical models.
Sample learning objectives
This is a list of example learning objectives and how to teach them using the ParFlow Sandtank. This list is not exhaustive, but provides an overview of the types of concepts that can be addressed using this tool. Additional examples can be found in user stories 1 and 2, which are based on real scenarios in which the ParFlow Sandtank has been used.
There are different geologic materials in the ParFlow Sandtank; these materials have different properties that impact how water is transmitted.
• Use the soil material selection sliders to vary the tank materials; users can choose clay, loam, sand, or gravel and compare how water is transmitted (pumping, pollutant movement, etc.).
• Hydraulic conductivity (K) is provided on a sliding scale for each material, so users can compare different materials or the same material with different K values.
Aquifers are areas under the ground that store and transmit water; there are two types of aquifers: (1) confined and (2) unconfined.
• Users can set up the PFST to have a confining layer of clay for material 4 (scroll below the PFST on screen to see the guide), creating a confined aquifer. Two wells in close proximity but in different aquifers can be pumped to visualize how the confined and unconfined conditions result in different dynamics.
The saturated zone is where all available spaces (pores, fractures, etc.) are filled with water; the unsaturated zone is where a mix of air and water fill the available spaces.
• Users can visualize the saturated and unsaturated zones by moving the “soil” opacity slider all the way to the left, completely removing the soil components from the system. This allows the user to see the saturated and unsaturated zones, with various shades of blue that represent decreasing levels of saturation that vary based on user input.
The water table is delineated as the upper surface of the saturated zone.
• The water table is represented by a blue line in the ParFlow Sandtank system. This line sits at the top of the saturated zone and can be visualized by users with or without geologic materials present. Users can adjust inputs, such as the hydraulic head sliders, pumping wells, or injecting pollutant into wells then see how the water table is impacted by each choice.
Surface water and groundwater are connected and interact with each other in many landscapes.
• This concept can be demonstrated by setting the lake/river dropdown menu to “lake” allowing water to collect in this surface feature. The user can then increase the hydraulic head sliders and visualize how the water enters the lake from below to fill the feature. The same concept can be demonstrated using the leaky landfill feature. Additionally, the concepts of recharge and discharge can be demonstrated using the hydraulic head sliders as well as the available surface features.
Groundwater can become polluted, which can impact drinking water supplies and surface water.
• When users inject water into any well in the system, pollutant will be viewable. This feature can be turned off by moving the “pollutant” opacity slider all the way to the left. Impacts of groundwater pollution can be demonstrated by injecting pollutant into a well, then observing:
° Preferential transport based on geologic material type
° Additional well pumping in vicinity and the impact on pollutant transport
° Impact of continued pollutant injection vs. single injection.
User story 1: A basic hydrology lesson
Mx. Garcia is a middle school STEM teacher who has learned about the ParFlow Sandtank and wants to use the tool to teach their students some concepts in hydrology. First, Mx. Garcia uses the PFST to teach their students about saturation and the water table. In the PFST, the water table is delineated by a dark blue line sitting at the top of the water in the system. Mx. Garcia shows their students how to adjust the hydraulic head on each side of the tank, click on the run button, and watch in real time as the water table adjusts to the new inputs (Figures 6A,B). They teach their students that the water table is the upper surface of the saturated zone. Their students ask what the saturated zone is. In this case, Mx. Garcia would like to better visualize saturation in the PFST. To do this, they ask their students to remove the geologic materials from the system by moving the “soil” opacity slider all the way to the left, as displayed in Figure 6C. By removing the geologic material, this allows the students to see only the water in the system, displayed by cells as either saturated or unsaturated conditions. Mx. Garcia explains the difference between saturated and unsaturated conditions and uses the hydraulic head sliders to adjust water conditions in the system multiple times to show their students how saturation changes as the water input to the system changes. In this transitional zone, the blue line representing the water table can be visualized, sitting on the top of the saturated zone and the bottom of the unsaturated zone (note the water table line does not enter the river/lake feature, as the water in this feature is considered “still water” in the system and computed differently).
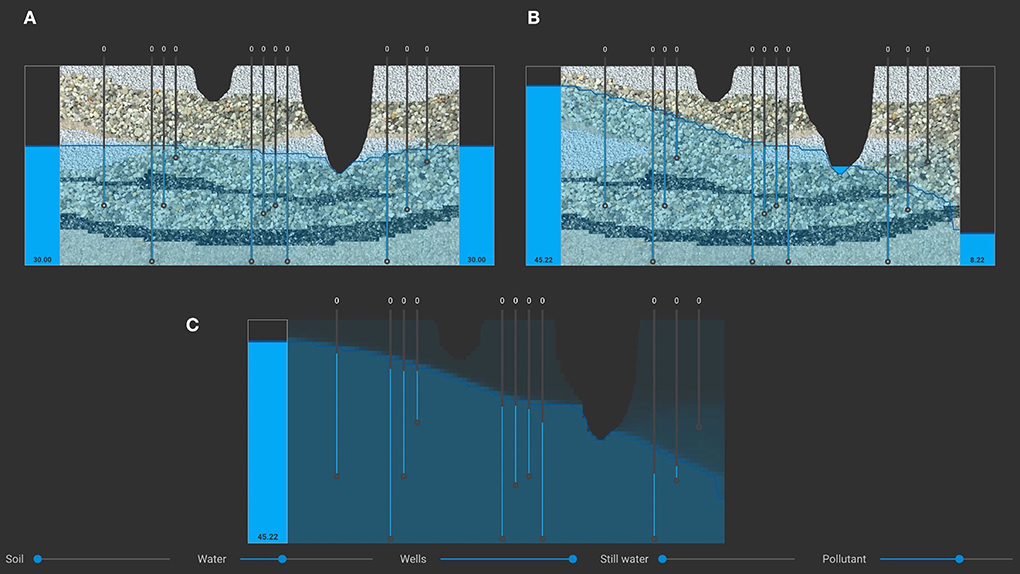
Figure 6. Mx. Garcia's demonstration of the water table responding to changing input. (A) Initial conditions. (B) Water table after user input adjustment and one timestep. (C) After removing the geologic materials the users can see saturation conditions in the PFST.
In another class session, Mx. Garcia would like to teach their students how and where water is stored underground. Our educator begins by discussing the different materials in the sandtank, highlighting the difference in the particles, spaces between particles, and how water is transmitted through each. They then use the PFST to show the difference between an unconfined and confined aquifer. As we can see in Figure 7A, Mx. Garcia has set up the PFST to have a confined aquifer, using a layer of clay as the confining layer. Above the confined aquifer is the unconfined aquifer, which is shallower and in contact with the surface. After explaining the differences between the aquifer types, Mx. Garcia uses the PFST to demonstrate that wells in different geologic units (i.e., unconfined and confined aquifers) respond differently to pumping, even when in close proximity to each other. For example, if their students pump 5 units of water from well G, Figures 7B,C shows the result: well G is completely emptied of water, the water level in well F drops significantly, but the water level in well H only drops a small amount. Even though well H is very close to well G, well H represents a different geologic unit and therefore is not as strongly impacted by pumping in well G (when compared to a well in the same geologic unit, like well F). Mx. Garcia instructs their students to continue exploring the various wells and how they are impacted by pumping water.
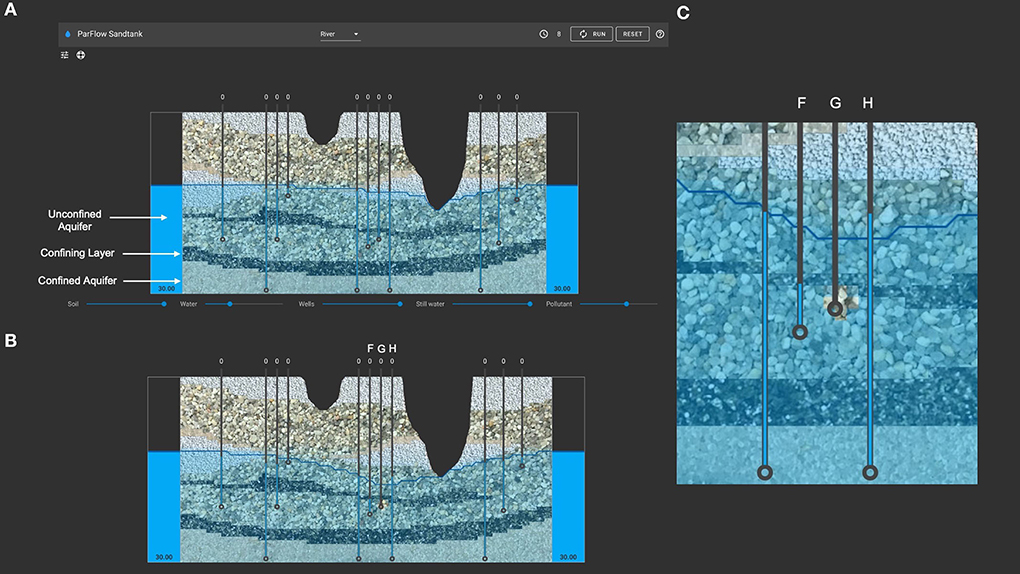
Figure 7. Mx. Garcia's initial ParFlow Sandtank setup and subsequent runs. (A) Initial setup of PFST showing a confined and unconfined aquifer. (B) Water levels in wells F, G, and H after students pump 5 units of water from the system. (C) Close up of water levels in wells F, G, and H after students pump 5 units of water from the system.
User story 2: Place based exploration
This user story is based on a classroom lesson developed by Dr. Alejandro Flores and used with his permission. Dr. Sandy Loam is a university professor teaching an undergraduate hydrology course and has built a lesson around the ParFlow Sandtank. This lesson is designed for an audience with an understanding of foundational hydrology concepts prior to this activity. Dr. Loam designed a lab activity that uses the PFST to evaluate three scenarios to determine the cause of wetland dewatering in a local area (Dr. Loam uses specific rivers and locations based on her university location, but this can be altered to individual place-based lessons). For this activity, Dr. Loam describes a case where each student group is serving as a consultant to investigate the most likely cause of an increase in seasonal dewatering in a local wetland. There are three scenarios that the students explore: new housing community water use; climate change impacts; and increased groundwater demand from a nearby city (Figure 8).
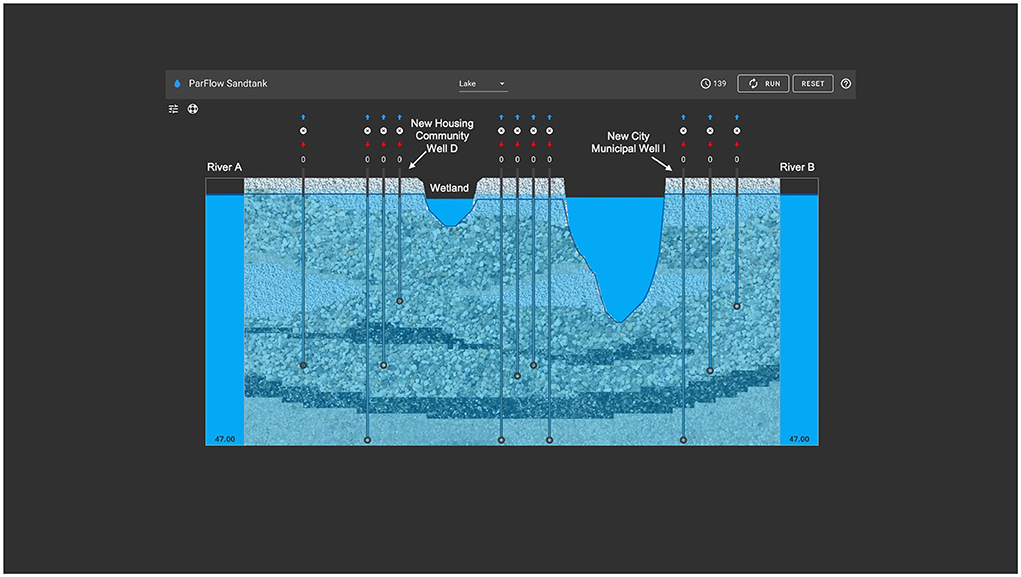
Figure 8. Labeled PFST features for Dr. Sandy Loam's lessons.
Dr. Loam explains that in the first scenario a new housing community has been developed that is close in proximity to the wetland (Figure 8). This community has added to the demand for water in the area by utilizing a shallow well to pump water for community lawn irrigation, which is mostly done from late spring into early fall. Upon investigation, the students find that when they test various pumping rates (how many units of water are pumped from well D, a shallow well in close proximity to the wetland) that when the community pumps the maximum amount, the wetland is dewatered. Dr. Loam makes sure the students understand that well D and the wetland are in the same geologic unit and are therefore highly impacted by each other.
In the second scenario, Dr. Loam paints a picture of a decades long drought in the region that has resulted in less snowpack, leading to decreased flow in the river that plays a role in recharging the wetland of interest (Figure 8, River A). This scenario is of concern, for if it is the potential cause of wetland dewatering then it is likely to increase in frequency and severity. Students are instructed to simulate reductions in river flow by using the hydraulic head sliders, decreasing one side incrementally, running the model, then determining how low the river can go before the wetland is dewatered. This value can be compared to historical data to determine if climate change is the likely cause of the wetland dewatering.
Dr. Loam describes the final scenario, in which a nearby city has experienced significant growth and therefore increased demand for water (Figure 8). This led the city to drill a new well in a deeper geologic unit to supply additional water to the city's inhabitants. If this is the issue then the city may need to abandon the well and find other options, which may prove difficult. In this scenario, students are instructed to test pumping volumes up to 10 units from well I (a deep well in comparison to the well in the new community scenario). After testing different pumping rates from this well, the students determine that the city pumping from this well does not lead to dewatering of the wetland. Much like the community housing development scenario, Dr. Loam makes sure students understand that this well has a much smaller impact on the wetland because it is in a different geologic unit. Based on the exploration activity that the students completed using the PFST, they determine that the primary reason for wetland dewatering is over pumping from the shallow well in the new housing development; they also acknowledge that climate change can make the wetland more susceptible to dewatering as well.
These two user stories are just a small sampling of the concepts that can be demonstrated using the ParFlow Sandtank. Additional workflows and resources can be found on our project website6.
Summary
This paper has presented the ParFlow Sandtank, an interactive educational tool that builds upon the utility of physical models to teach hydrogeology concepts, while overcoming inherent limitations. A key asset of the PFST is the variety of adjustable parameters and the subsequent real-time visualization of subsurface simulations. This can be used as a stand-alone tool or supplemented with additional teaching resources. ParFlow Sandtank is a freely available online tool that has proven to be useful in a variety of educational settings, and we hope it will continue to be used and further developed as more users with a myriad of specific perspectives and needs engage with the interface.
As we head into a future where water demand continues to outpace water availability, it is vitally important to have a society that understands the significance of this resource. Education of future scientists and engineers is one step in the right direction and the ParFlow Sandtank can contribute to this need by contributing to the collection of educational tools to support this effort. We invite you to explore the ParFlow Sandtank, a tool that will support deep dives into the world of hydrology.
Data availability statement
The ParFlow Sandtank is freely available and running on https://sandtank.hydroframe.org. The tool, along with associated resources, can also be accessed via https://hydroframe.org/groundwater-education-tools/ or on GitHub https://hydroframe.github.io/SandTank.
Author contributions
Conceptualization: RM, LC, and LG. Software: RM, LC, PO'L, SJ, and CC. Validation: RM, LC, PO'L, SJ, AF, CC, SC, and LG. Formal analysis and investigation: LG, AF, and SC. Resources, supervision, and project administration: RM and LC. Data curation: SJ and CC. Methodology and writing—original draft preparation: LG, RM, LC, PO'L, SJ, and AF. Writing—review and editing: RM, LC, PO'L, SJ, AF, CC, and SC. Visualization: PO'L, SJ, and LG. Funding acquisition: RM, LC, and PO'L. All authors have read and agreed to the published version of this article.
Funding
This work was supported by the National Science Foundation, Collaborative Research: Framework: Software: NSCI: Computational and data innovation implementing a national community hydrologic modeling framework for scientific discovery, under Award Number OAC-2054506. This material was also supported by the U.S. Department of Energy, Office of Science, Chicago Operations Office, under Award Number DE-SC0019609.
Acknowledgments
The authors would like to warmly thank and acknowledge Dr. Alejandro Flores for the adaptation of his contributed ParFlow Sandtank lesson exploring the potential causes of wetland dewatering.
Conflict of interest
Authors PO'L and SJ were employed by Kitware, Inc.
The remaining authors declare that the research was conducted in the absence of any commercial or financial relationships that could be construed as a potential conflict of interest.
Publisher's note
All claims expressed in this article are solely those of the authors and do not necessarily represent those of their affiliated organizations, or those of the publisher, the editors and the reviewers. Any product that may be evaluated in this article, or claim that may be made by its manufacturer, is not guaranteed or endorsed by the publisher.
Footnotes
1. ^https://github.com/parflow/parflow
2. ^https://github.com/reedmaxwell/EcoSLIM
4. ^https://hydroframe.org/groundwater-education-tools
5. ^https://hydroframe.github.io/SandTank/docs/contributing.html
References
Ashby, S. F., and Falgout, R. D. (1996). A parallel multigrid preconditioned conjugate gradient algorithm for groundwater flow simulations. Nucl. Sci. Eng. 124, 145–159. doi: 10.13182/NSE96-A24230
Bearup, L. A., Maxwell, R. M., and McCray, J. E. (2016). Hillslope response to insect-induced land-cover change: an integrated model of end-member mixing. Ecohydrology. 9, 195–203. doi: 10.1002/eco.1729
Gallagher, L. K., Williams, J. M., Lazzeri, D., Chennault, C., Jourdain, S., O'Leary, P., et al. (2021). Sandtank-ML: an educational tool at the interface of hydrology and machine learning. Water. 13, 3328. doi: 10.3390/w13233328
Jones, J. E., and Woodward, C. S. (2001). Newton–Krylov-multigrid solvers for large-scale, highly heterogeneous, variably saturated flow problems. Adv. Water Resour. 24, 763–774. doi: 10.1016/S0309-1708(00)00075-0
Kollet, S. J., and Maxwell, R. M. (2006). Integrated surface-groundwater flow modeling: a free-surface overland flow boundary condition in a parallel groundwater flow model. Adv. Water Resour. 29, 945–958. doi: 10.1016/j.advwatres.2005.08.006
Kuffour, B. N. O., Engdahl, N. B., Woodward, C. S., Condon, L. E., Kollet, S., and Maxwell, R. M. (2020). Simulating coupled surface-subsurface flows with ParFlow v3.5.0: capabilities, applications, and ongoing development of an open-source, massively parallel, integrated hydrologic model. Geosci. Model Dev. 13, 1373–1397. doi: 10.5194/gmd-13-1373-2020
Maxwell, R. M., Condon, L. E., Danesh-Yazdi, M., and Bearup, L. A. (2019). Exploring source water mixing and transient residence time distributions of outflow and evapotranspiration with an integrated hydrologic model and Lagrangian particle tracking approach. Ecohydrology. 12, e2042. doi: 10.1002/eco.2042
Neupauer, R. M., and Dennis, N. D. (2010). Classroom activities to illustrate concepts of Darcy's law and hydraulic conductivity. J. Prof. Iss. Eng. Ed. Pr. 136, 17–23. doi: 10.1061/(ASCE)1052-3928(2010)136:1(17)
Nicholl, M. J., and Scott, G. F. (2000). Teaching Darcy's law through hands-on experimentation. J. Geosci. Educ. 48, 216–221. doi: 10.5408/1089-9995-48.2.216
Rodhe, A. (2012). Physical models for classroom teaching in hydrology. Hydrol. Earth Syst. Sci. 16, 3075–3082. doi: 10.5194/hess-16-3075-2012
Schulz, K., Burgholzer, R., Klotz, D., Wesemann, J., and Herrnegger, M. (2018). Demonstrating the “unit hydrograph” and flow routing processes involving active student participation – a university lecture experiment. Hydrol. Earth Syst. Sci. 22, 2607–2613. doi: 10.5194/hess-22-2607-2018
Singha, K. (2008). An active learning exercise for introducing ground-water extraction from confined aquifers. J. Geosci. Educ. 56, 131–135. doi: 10.5408/1089-9995-56.2.131
Singha, K., and Loheide II, S. P. (2010). Linking physical and numerical modelling in hydrogeology using sand tank experiments and COMSOL multiphysics. Int. J. Sci. Educ. 33, 547–571. doi: 10.1080/09500693.2010.490570
Werner, A., and Roof, S. R. (1994). Using Darcy flow tubes to teach concepts of ground-water geology. J. Geol. Educ. 42, 220–224. doi: 10.5408/0022-1368-42.3.220
Keywords: ParFlow, groundwater, online education, hydrology, subsurface
Citation: Gallagher LK, Farley AJ, Chennault C, Cerasoli S, Jourdain S, O'Leary P, Condon LE and Maxwell RM (2022) The ParFlow Sandtank: An interactive educational tool making invisible groundwater visible. Front. Water 4:909918. doi: 10.3389/frwa.2022.909918
Received: 31 March 2022; Accepted: 26 July 2022;
Published: 22 August 2022.
Edited by:
Adam Scott Ward, Indiana University, United StatesReviewed by:
Kamini Singha, Colorado School of Mines, United StatesAnne Jefferson, Kent State University, United States
Copyright © 2022 Gallagher, Farley, Chennault, Cerasoli, Jourdain, O'Leary, Condon and Maxwell. This is an open-access article distributed under the terms of the Creative Commons Attribution License (CC BY). The use, distribution or reproduction in other forums is permitted, provided the original author(s) and the copyright owner(s) are credited and that the original publication in this journal is cited, in accordance with accepted academic practice. No use, distribution or reproduction is permitted which does not comply with these terms.
*Correspondence: Lisa K. Gallagher, bGlzYS5nYWxsYWdoZXJAcHJpbmNldG9uLmVkdQ==