 Vianney Sivelle1*
 Laïna Pérotin1Bernard Ladouche2,3Véronique de Montety1Vincent Bailly-Comte2,3Cédric Champollion4Hervé Jourde1
- 1HSM, Univ Montpellier, CNRS, IRD, Montpellier, France
- 2BRGM, Univ Montpellier, Montpellier, France
- 3G-eau, UMR 183, INRAE, CIRAD, IRD, AgroParisTech, Supagro, BRGM, Montpellier, France
- 4Géosciences Montpellier, CNRS, Univ Montpellier, Montpellier, France
The objective of this study was to evaluate the relevance of using excess air (EA) for the characterization of drain/matrix exchange in karst systems using a rainfall discharge model coupled with the simulation of EA measured at the outlet of the studied system. The conceptual model assumes a linear relationship between the formation of EA and the increase of hydrostatic pressure in the capacitive part of the aquifer. The simulated EA at the spring consists of the mixing of water circulating in the different compartments of the aquifer, with their own EA signature. The analysis is performed taking as an example the Durzon karst system (Larzac, France). The modeling is applied using daily rainfall discharge time series and 18 EA measurements at the main outlet of the karst system within 3 hydrological cycles. The main modeling results show that EA variations measured at the karst spring can be explained by recharge processes and exchange between conduit and matrix. EA measurements at the spring thus contain valuable information about the flow dynamics within the aquifer. Furthermore, results show that the use of EA measurements, despite their sparse temporal resolution, allows for reducing uncertainties in the estimation of some parameters of the reservoir model used for the simulation of karst spring discharge.
Introduction
Karstic systems consist of calcareous formations (carbonate rocks), often conceptualized through the co-existence of three types of porosity: (i) inter-granular porosity, (ii) fracture porosity, and (iii) large, wide conduits (Palmer, 1991). The relative proportions of each type of porosity in karst aquifers induce a strong spatial variability in hydraulic conductivity (Jeannin, 2001) with significant implications for flow kinetics (Ford and Williams, 2013). This results in a heterogeneous permeability field and non-linear hydraulic behavior. The drainage in karst aquifers consists of a self-organized structure leading to a preferential flow path through a conduit network embedded in either a porous matrix which sometimes is highly permeable or a fissured matrix with low permeability (Ford and Williams, 2013). Preferential flow paths can be connected to the surface through sinkholes or stream losses, allowing rapid infiltration of surface water which may have an impact on groundwater chemistry (Aquilina et al., 2005) as well as imply an important risk of karst groundwater contamination (Hartmann et al., 2021; Lukač Reberski et al., 2022).
While the drainage system controls contaminant transport within the aquifer, the matrix may store contaminants because of lateral exchange between the preferential flow path and the surrounding matrix. Karst aquifers are therefore highly vulnerable because of rapid contaminant spread and potential storage in the matrix over time. Understanding and considering lateral exchange between these two kinds of karst porosities seems to be necessary for proper qualitative (chemical vulnerability) and quantitative (resource availability) groundwater resource management of karst aquifer.
Cholet et al. (2017) proposed a coupled deconvolution of spring hydrograph and mass chemograph to assess lateral contributions in terms of flow and mineralization in a conduit-flow-dominated karst system. The study shows that low-mineralized water flow may occur from conduit to matrix after a major precipitation event in the non-saturated zone. Mitrofan et al. (2015) also highlighted flood-induced flow from the karst conduit to the surrounding matrix evidenced by chloride fluxes. Martin and Dean (2001) showed that water exchange from the conduit to the matrix may also have significant implications in karstification processes due to the intrusion of water undersaturated concerning calcite into the matrix. Numerical modeling may also bring insight into lateral exchange dynamics (Bailly-Comte et al., 2010; Reimann et al., 2011; Sivelle et al., 2019; Dal Soglio et al., 2020; Shirafkan et al., 2021). The contribution of exchange from slow-flow to fast-flow systems in three karst catchments located in southern China was estimated between 64 and 87% (Zhang et al., 2017). Within the Norville chalk aquifer (northern France), the fluxes from matrix to conduit represent approximately 10% of the spring discharge (Duran et al., 2020). Within the highly karstified Baget and Aliou watersheds (French Pyrenees), the annual matrix contribution to the total spring flow is ~3% and it can increase up to 25% during periods with low rainfall (Sivelle et al., 2019). Also, the numerical modeling of exchange flow may benefit from auxiliary variables such as temperature (Berglund et al., 2020) or Ca2+ and Mg2+ ions concentration (Zhang et al., 2017) for model calibration. Another approach consists in analyzing simulation results together with physicochemical properties such as electrical conductivity (Duran et al., 2020), to better evaluate the physical significance of simulated internal fluxes.
Among these, the study of dissolved noble gases in the subsurface may be of interest to improve the understanding of groundwater dynamics in karsts by providing information on flow path and connectivity between aquifer components. Historically, noble gases have been used as environmental tracers for a variety of purposes, such as reconstructing paleoenvironmental and paleoclimatic conditions or identifying recharge zones (Heaton and Vogel, 1981; Wilson and McNeill, 1997; Aeschbach-Hertig et al., 2000; Peeters et al., 2002; Ingram et al., 2007; Sano et al., 2017; Tomonaga et al., 2017; Popp et al., 2021; Schilling et al., 2022). While the solubility equilibrium of atmospheric gases is primarily controlled by the temperature of the recharge zone, many studies indicate that noble gas concentrations in groundwater often differ from these atmospheric equilibria and appear to be modified by another ubiquitous phenomenon called “excess air.” The work of Holocher et al. (2002) was able to show experimentally that the formation of excess air can be explained by the complete or partial dissolution of trapped air bubbles under the influence of hydrostatic pressure (Heaton and Vogel, 1981; Stute and Schlosser, 2000; Aeschbach-Hertig, 2004). Therefore, excess air can be considered as a tracer that can provide additional useful information on the type of recharge, that is, saturated or unsaturated and the amplitude of groundwater level fluctuations (Clark et al., 2005; Massmann and Sültenfuß, 2008; Schilling et al., 2021). The excess air is usually expressed as a volume under standard temperature and pressure (STP) conditions, the unit is cm3 STP.kg−1. The work of Pérotin et al. (2021) showed on the Durzon karst with a large vadose zone (>200 m) that water transfer along the vadose zone causes a slight excess of air (+ 0.8 cm3 STP.kg−1) that remains small compared to that observed at the Durzon spring (+ 5.5 cm3 STP.kg−1), suggesting that the excess air is mainly formed by variations in the water level of the saturated zone of this karst.
In this study, we investigated the relevance of using EA to characterize water exchange between transmissive and capacitive compartments in the Durzon karst system. Using a lumped parameter rainfall discharge model, the EA was simulated assuming formation in the capacitive part of the aquifer, when significant recharge occurs, and by addition from exchange fluxes between the transmissive and capacitive parts of the Durzon karst system. We first present the geological, hydrogeological, and meteorological context of the study area. Then, the formation of EA, as well as the information about recharge conditions provided by noble gas concentration measurements are described. Finally, the lumped parameter rainfall discharge model and the way to consider EA in the model are explained, before presenting the calibration results considering both spring discharge and EA and their implication in terms of parametric uncertainty of the considered lumped parameter rainfall discharge model.
Study area
Local geology and hydrogeology
The Durzon karst system is located in the Grand Causses area in the Southern Massif Central (France), with a mean altitude of approximately 700 m asl, varying between 500 and 900 m asl (Fores, 2016). The study area is part of the Natural Regional Park of the Grand Causse (PNRGC). It is one of the study sites of the French National Observation Services H+ (http://hplus.ore.fr/), which is part of the Elter European Infrastructure (https://www.lter-europe.net/elter-esfri). The geology in the area consists of Jurassic karstified carbonates: The Hettangian carbonate series is separated from the Dogger and Malm carbonate series by a Toarcian marl series, which is considered an impervious geological layer (Figure 1). The marly formations play an important role in the hydrogeological functioning of the hydrogeological system by separating the two main aquifers, which are the two carbonate units mentioned above. The Hospitalet thrust puts the Lias marl into contact with the Dogger–Malm aquifer and allows the emergence of the spring (Figure 1). The Durzon spring is the only known outlet of the unary karst system, that is, the impluvium is only composed of karstifiable rocks and consists of a Vauclusian spring, that is, the drainage is organized below the level of the spring (Marsaud, 1996). The spring is located at an altitude of 533 m asl and drains a recharge basin whose area, estimated from mass balances, varies between 98 and 117 km2 (Ricard and Bakalowicz, 1996; Tritz et al., 2011; Fores, 2016). The spatial limits of the basin were determined based on artificial tracer tests and geological features that impose the boundary at the interface with impermeable marls.
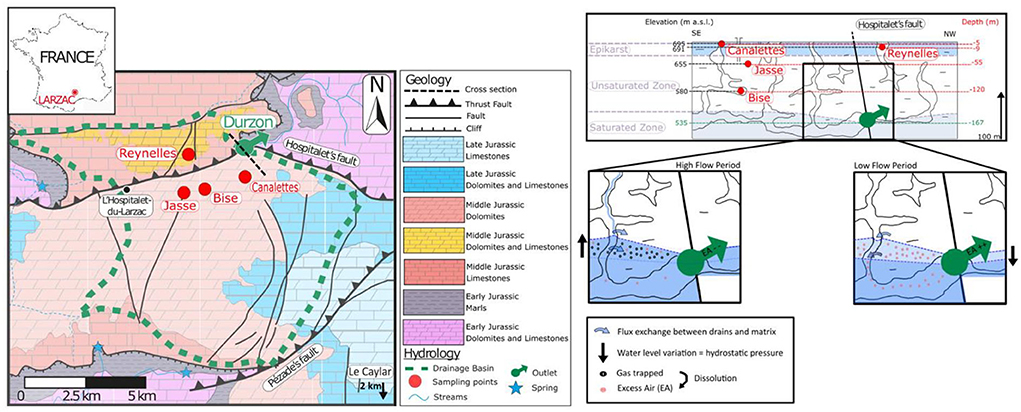
Figure 1. (Left) Geological map of the Durzon karst system (modified from Fores, 2016) (Right) Schematic cross-section made from the Durzon spring with a projection of the different sampled points along the non-saturated zone with a hypothetical position of the water level of the saturated zone (modified from Pérotin et al., 2021).
The system is characterized by a 200 m thick infiltration zone and no borehole over the area reaches the saturated zone. Therefore, only the spring discharge variation can bring the required information for hydrodynamic characterization of the saturated zone.
Climate
The area is characterized by a Mediterranean climate and oceanic influence. The annual cumulative rainfall varies from 929 to 1,729 mm (2007–2019) with a mean annual rainfall of ~1,180 mm distributed over ~92 rainy days per year (rainfall > 1 mm.day−1). The mean air temperature varies between 2.5°C in winter and 18°C in summer, with a mean annual air temperature around 10°C. The mean annual potential evapotranspiration (PET) computed using the Penman–Monteith's formula (Penman, 1948) by the national meteorological agency MétéoFrance at the Caylar station varies from 830 to 1,020 mm (2007–2019) with a mean annual PET of approximately 927 mm. The mean PET is lower than 1 mm.day−1during winter and rises to approximately 5 mm.day−1 during the summer period. Autumn is characterized by intense rainy episodes called “Cevenol episodes” where cumulative precipitation amount may reach 286 mm.day−1 (17 September 2014). Such meteorological events greatly contribute to the aquifer recharge and could generate flooding, the dynamics of which depend on the hydric state of the aquifer. As an example, the 2014 cevenol episode occurred at the end of a long recession period and generated a maximum spring discharge of only 5 m3.s−1 at the Durzon spring. The following rainfall episode, much less intense with a maximal rainfall intensity of approximately 100 mm.day−1, induced a maximum spring discharge of 16 m3.s−1 (Figure 2).
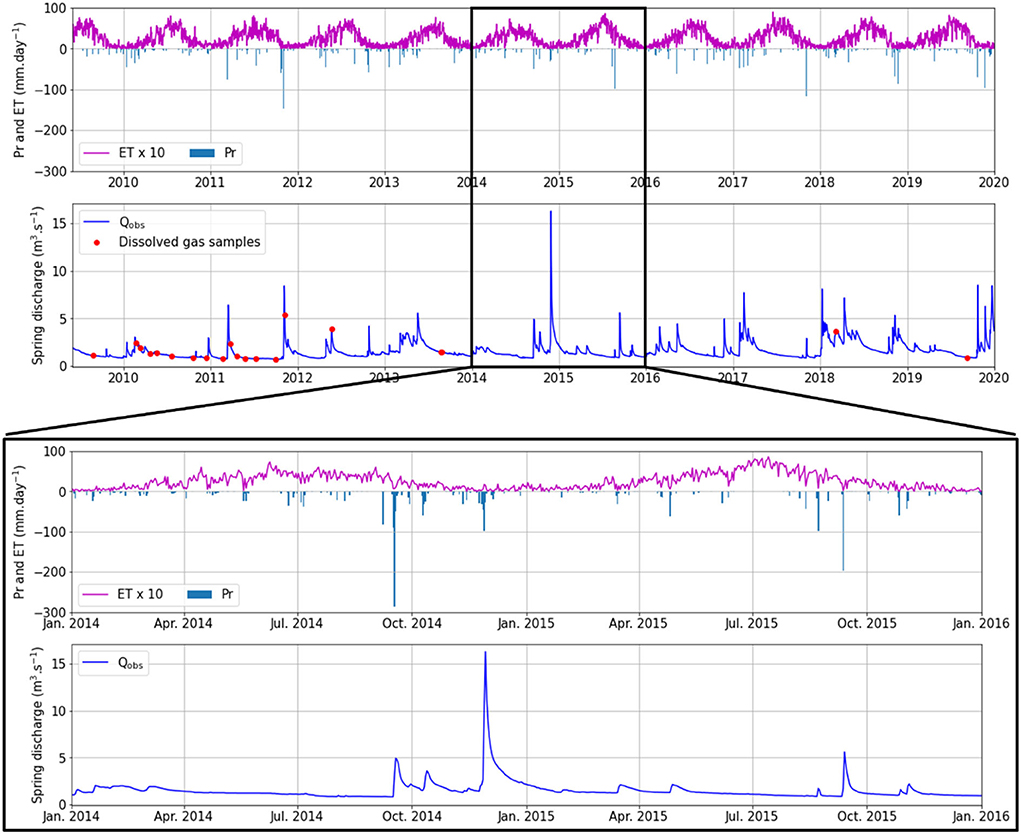
Figure 2. (Top) Precipitation (Pr) and evapotranspiration (ET) time series measured at the Caylar station and discharge time series measured at the Durzon spring and sampling of dissolved gases–(Bottom) Zoom on the period from 2014 to 2016.
Materials and methods
Air excess formation
Excess air results from the trapping of air bubbles in a porous medium following a significant recharge event. The hydrostatic pressure then applied to the air bubbles forces their dissolution causing an influx of air larger than what can be expected from equilibrium exchange between air and water (Holocher et al., 2002; Aeschbach-Hertig, 2004; Klump et al., 2007). EA was calculated based on Ne-Ar-N2 concentrations, as N2 is neither produced nor consumed in significant amounts at the studied site (Heaton and Vogel, 1981; Plummer et al., 2004; Chatton, 2017). Due to its formation process, EA can be used as a qualitative tracer for piezometric head variation in the aquifer.
Wilson and McNeill (1997) investigated the relationship between air bubble entrapment and lithology by comparing mean EA values (calculated based on Ne isotopes) in groundwater samples from aquifers developed in limestones, sandstones, and granites. Samples from granitic aquifers were almost devoid of EA, while samples from carbonate aquifers had the highest EA values (~1.0 cm3 STP.kg−1). Several authors (Herzberg and Mazor, 1979; Heaton and Vogel, 1981; Mazor et al., 1983) reported high EA values in karst aquifers. Several conceptual models have been proposed to explain the EA formation during recharge. According to Heaton and Vogel (1981), the presence of air bubbles trapped under the action of capillary forces in the capillary fringe (microscopic scale) could explain the EA formation. When surface water infiltrates, the air bubbles are carried to the level of the saturated zone. When sufficient hydrostatic pressure is applied to the trapped air bubbles, they are dissolved within the groundwater. Herzberg and Mazor (1979), suggested that the highly permeable fractured nature of most of the karst aquifers is often associated with rapid recharge that could be responsible of EA formation at a macroscopic scale. Carbonates thus appear to be suitable lithologies for the EA formation, though the physical process remains hypothetical.
Aeschbach-Hertig et al. (2002) suggest that variations in Neon concentration (and thus EA) can be a proxy of the piezometric head variation in the aquifer. Such statement is supported by many other studies (Beyerle et al., 2003; Kulongoski et al., 2004; Ingram et al., 2007; Manning and Caine, 2007; Osenbrück et al., 2009; Zhu and Kipfer, 2010). Holocher et al. (2002) experimentally investigated EA formation in quasi-saturated porous media using vertical sand columns. When simulating water level variations, a correlation between these variations and the measured EA was observed. Then EA varied between 0.14 and 1.62 cm3 STP.kg−1 with a maximal piezometric head variation of 1 m. According to Holocher et al. (2002), the total pressure exerted on the entrapped air is the dominating parameter responsible for the total amount of dissolved air in groundwater. The EA formation would thus depend on the number of trapped air bubbles and on the hydrostatic pressure that forces their dissolution. In some carbonate rocks such as dolomites, the porous matrix appears as a suitable media for the air bubble trapping considering the inter-granular porosity and significant and fast piezometric head variation with rapid transfer from the surface to the saturated zone. For simplicity, and to avoid over-parameterization in the modeling approach (see section Including air excess in the lumped parameter model), it is assumed that the evolution of excess air is linearly related to piezometric fluctuations.
Assessing recharge conditions with noble gas temperature and excess air
Groundwater recharge temperature (NGT, Noble Gas Temperature) and EA (Heaton and Vogel, 1981; Plummer et al., 2004; Chatton, 2017) can be estimated using the concentration of dissolved noble gases (Ne, Ar) and nitrogen (N2). The latter is a major atmospheric gas, which can furthermore be produced by biological reactions such as denitrification in anoxic systems (Mariotti, 1986; Smith et al., 1991; Blicher-Mathiesen et al., 1998). In karst systems, anoxic conditions are rarely observed, especially in an unconfined aquifer. Considering the Durzon karst system, the measured dissolved oxygen is always above 7.6 mg.l−1, which excludes the existence of denitrification. For this reason, the concentration of dissolved N2 is assumed to remain stable during the hydrological cycle and was used to calculate both NGT and EA.
Estimations were performed using the Unfractionated excess Air (UA) by the complete dissolution of air bubbles conceptual model, following the methodology described by Aeschbach-Hertig and Solomon (2013). This model does not include degassing or gas partitioning. The model equations developed by Aeschbach-Hertig and Solomon (2013) are not detailed in this article. The complete methodology in estimation of EA is presented in former studies (Pérotin, 2021; Pérotin et al., 2021). The average recharge elevation was set at 700 m asl. The variability in elevation of the study area induces < 1°C and 0.2 cm3 STP.kg−1 of uncertainty in the NGT and EA parameters, respectively.
Sampling and analysis
Water samples were collected at various depths within the vadose zone of the study site (see Pérotin, 2021). Canalettes and Reynelles samples taken at 5 and 9 m depth (691 and 685 m asl, respectively) allow characterization of the epikarst zone, and a 45 m deep borehole (655 m asl) allows characterization of water transfer in the unsaturated zone (Jasse). An underground river at 120 m depth in the unsaturated zone (Bise, 580 m asl) allows characterizing in a more integrative way the flows within the vadose zone, this perched underground river is located nearly 55 m above the level of the Durzon spring (535 m asl). Two sampling campaigns were undertaken during high and low water conditions (March 2018 and Sept 2019, respectively) to evaluate the seasonal hydrological influence on the gas transfers. Two sampling campaigns were conducted during high and low water periods (March 2018 and Sept 2019, respectively) to characterize dissolved gas signatures within the vadose zone. Dissolved gas samples were collected at Durzon Spring from 2009 to 2019 with a monthly time step between February 2010 and November 2011.
The noble gases dissolved in water were collected in 500 ml glass bottles closed with rubber stoppers and sealed with a metal ring. A small submerged pump (Mini Twister 12 volts standard PVC - sdec-France) was used to sample the waters of the Reynelles cave (9 m deep) and the monitoring was carried out at the Durzon spring. At Canalettes cave (5 m deep), a peristaltic pump was required due to the very low water quantity in the natural pool. The sampling is done directly in the cave, so the pump and the tank containing the water were at the same altitude to avoid any loss of pressure and therefore any decompression in the pump. Considering the Jasse borehole (45 m deep), a Grundfos MP1 pump was used, and the dissolved gas samples were collected underwater (directly in the well or in a bucket) to avoid air contamination, after having renewed the water 3 times. Two or three replicates were collected for each sample. Also, physicochemical parameters (temperature, pH, specific conductivity, and dissolved oxygen) were recorded using a HACH HQ40D portable multimeter for each dissolved gas sample. The groundwater temperature at the Jasse borehole was measured with a CTD Diver located in the borehole, rather than after sampling.
Dissolved gases (Ne, Ar, N2) of the water samples were analyzed by the analytical platform CONDATE Eau (Rennes University) with the gas chromatography method. Ne-Ar-N2 gases were extracted by the head-space method (Sugisaki and Taki, 1987) and measured by gas chromatography using a catharometric detector (μGC 3000 - SRA), with an accuracy of 8% for Ne and 5% for Ar and N2.
Modeling approach
Lumped parameter modeling
The proposed model (Figure 3) considers three compartments, each corresponding to a physical entity (epikarst, conduit, matrix). The compartments are organized as a two-level structure: the upper level of the model structure comprises the compartment E (epikarst) while the lower level comprises two interconnected compartments M (matrix) and C (conduit). As proposed in a former study (Tritz et al., 2011), the compartment E represents the soil and epikarst subsystem and constitutes the interception zone where part of the received precipitation Pr goes back to the atmosphere via an evapotranspiration rate ET. The water contained in compartment E flows to the lower compartment M. During high water level periods, part of the water contained in compartment E produces a hysteretic overflow Qhy (Tritz et al., 2011) reaching the compartment C or the spring. The flow repartition for Qhyto compartment C or the spring is parameterized by the sharing coefficient Xhy. In the lower part of the model structure, the exchange between compartments M and C is proportional to the water level difference between the two compartments. It allows the reproduction of matrix–conduit interactions as supported by direct observations in other karst systems (Bailly-Comte et al., 2010). The model can be implemented with the KarstMod modeling platform, developed within the framework of the Karst observatory network SNO KARST (www.sokarst.org), initiated by the French institute INSU/CNRS (Jourde et al., 2018). The model is based on the mass balance equations given by Mazzilli et al. (2019), assuming a linear discharge law for each compartment of the model:
where:
where hE, hM, and hC are the water levels [mm] in the compartments E, M, and C, respectively, kEM, kMC, kCS, and khy [mm.day−1] are the specific discharge coefficients for the discharge QEM, QMC, QCS, and Qhy [mm.day−1], respectively, Xhy [-] is the sharing coefficient that splits the fluxes Qhy to compartment C or directly to the spring, Lref is a unit length [mm] and εhy [-] is the binary indicator of the activation of the hysteretic discharge (Tritz et al., 2011).
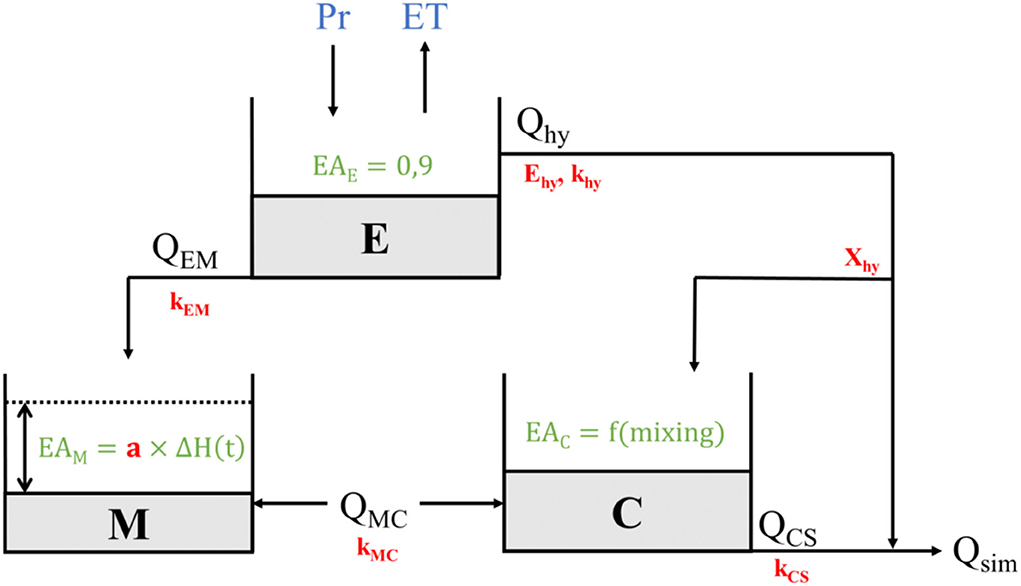
Figure 3. Lumped parameters model structure. The input variables are given in blue, the compartment and internal fluxes are given in black, the working hypothesis for EA simulation are given in green and the free parameter are given in red. Information about model parameter is given in Table 1.
The simulated spring discharge Qsim [m3.s−1] depends on the recharge area such as:
where Ra [km2] is the catchment recharge area divided by a constant for unit constancy to convert the discharge per unit surface [mm.day−1] into discharge [m3.s−1].
Including air excess in the lumped parameter model
Including EA in the proposed model considers that the EA formation mainly occurs within compartment M as a result of an increasing piezometric head. Indeed, the EA formation occurs by trapping air bubbles in a porous medium, which are dissolved when hydrostatic pressure significantly increases. In the case of the studied karst system, the relatively high porosity of dolomite formation allows considering this hypothesis. To represent such a physical process, the model assumes that the EA formation in compartment M is proportional to the piezometric head variations:
where is the concentration of EA [cm3 STP.kg−1] in compartment M at time t, resulting from a piezometric head variation Δh(t) at time t, depending on the proportional coefficient a. If Δh(t) is negative, there is no EA formation and = 0. The EA signature in compartment M depends on the mass balance between inflow from compartment E and outflow toward compartment C:
where QEM and QMC [mm.day−1] are internal discharge rates per unit surface area and EAE, EAM, and EAC are the concentrations of EA [cm3 STP.kg−1] in compartments E, M, and C, respectively, and Δt is the unit time step of the model [day].
The EA signature within compartment C depends on the mass balance between inflow from C and outflow toward the spring.
where QhyEC is the discharge per unit surface area from compartment E to C [mm.day−1], QCS is the discharge per unit surface area from compartment C to the spring [mm.day−1].
The EA signature at the spring depends on the mass balance between outflow from C and outflow from compartment E directly to the spring:
where QhyES is the discharge from compartment E to the spring.
Model calibration
The proposed rainfall discharge model counts 6 parameters (Table 1) and the EA simulation at the spring brings one more parameter. The conceptual representation of EA formation is considered as simple as possible to avoid overparameterization and to limit potential parametric equifinality (Perrin et al., 2001). Based on former studies, the recharge area was identified as Ra = 116 km2. The model is implemented in the python environment (Summerfield, 2010), while the parameter estimation was performed using a particle swarm optimization (PSO) procedure (Eberhart and Kennedy, 1995) implemented in the “pyswarm” package (Lee, 2014). Furthermore, a Latin Hypercube sampling (LHS) is applied to account for parametric uncertainties and investigate the parameter distribution according to the model performance criteria. The calibration is made over 10 years (from September 2009 to December 2019). Because the model is not dedicated to forecasting purposes or extrapolation out of the investigated climatic conditions, no validation period is considered in this study. The calibration is made considering the widely used Nash–Sutcliff Efficiency (NSE; Nash and Sutcliffe, 1970) criterion on both spring discharge (Qobs and Qsim) and excess air (EAobsand EAsim) measurement at the spring. Then, the objective function Φ consists of a weighted sum:
where ω varies from 0 to 1 to account for the different importance of both Qobs and EAobs in the calibration procedure. One should note that, within the calibration period, Qobs consists of a continuous daily time series (3,760 observations), whereas the EAobs time series counts 18 observations within 3 hydrological cycles.
Results
EA measurement analysis
The Durzon spring EA shows important variations during the hydrological cycle. The lowest EA values are lower than 1 cm3 STP.kg−1 and were observed during floods characterized by flows between 3.9 and 5.4 m3.s−1. Recession periods are characterized by high values of excess air up to 11 cm3 STP.kg−1 when the spring discharge is lower than 0.8 m3.s−1. Dissolved gas measurements taken within the shallow epikarst zone during high water level periods indicate that EA is low, around 0.5 cm3 STP.kg-1 for Canalettes and Reynelles (Pérotin et al., 2021). Low values are also measured for the Bise underground river (1.3 cm3 STP.kg-1), which makes it possible to more generally qualify the signature of the flows flowing in the drainage network of the vadoze zone. The EA measurement at different depths of the unsaturated zone over the Durzon catchment suggests that the EA formation, along with the water transfer toward the saturated zone, is low (lower than 2 cm3 STP.kg−1) and appears insufficient to explain the EA values measured at the Durzon spring, where the EA values increase up to 11 cm3 STP.kg−1 during periods of low water. A decreasing exponential-type relationship appears to be observed between the measured EA and the spring discharge (Figure 4). In karst environments, rapid and significant recharge events from the surface to the saturated zone can generate piezometric head variation from meters to tens of meters within the transmission zone. When such recharge occurs, flow reversals are observed between the main drainage features (i.e., caves, conduits, unclogged fractures) and the surrounding porous matrix (Martin and Dean, 2001; Meyerhoff et al., 2012; Mitrofan et al., 2015).
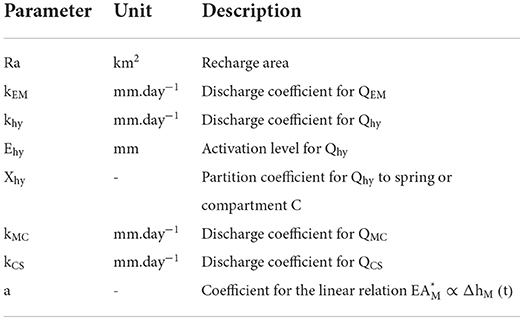
Table 1. Description of the model parameters.
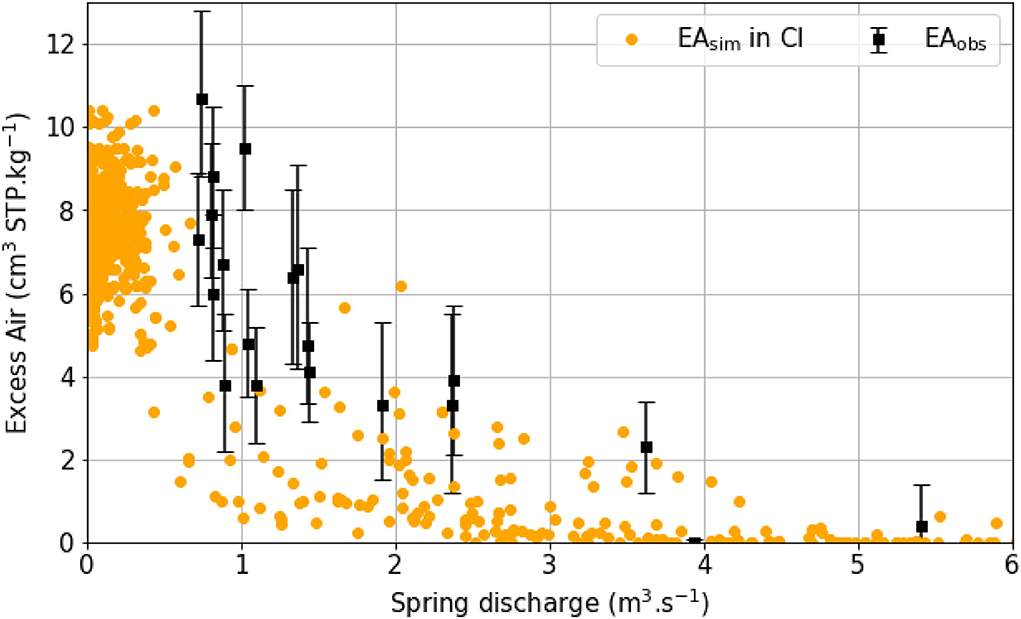
Figure 4. Evolution of the EA signature at the Durzon spring as a function of the spring discharge. EAobs correspond to the EA measurements at the Durzon spring and EAsim is in the confidence interval (CI) with the 0.1% proportion out of 50,000 simulations within the parameter space sampled with the Latin Hypercube Sampling (LHS) procedure.
When pressure gradient induces flow from the main drainage network to the surrounding porous matrix, it favors matrix recharge in the vicinity of drainage features (i.e., conduit, unclogged fractures, cave), which induces entrapment of air bubbles in the porous media due to hydrostatic pressure increase, following rapid water fluxes through the main drainage features toward the saturated zone. The greater the piezometric head increase, the greater the hydrostatic pressure applied to the air bubbles, and thus the higher the EA formation. Such a process is assumed to explain the EA formation in the porous matrix during piezometric head increase following recharge events. During recession periods, the spring discharge is mainly supplied with groundwater flow from the matrix, with negligible flow from the conduit networks (Plagnes, 1997). Such behavior explains both the high spring EA values when spring discharge is low and the decreasing exponential relationship between the measured EA and the measured spring discharge (Figure 4). During low water level periods, the matrix mostly contributes to the spring discharge so the EA values at the spring increase due to the arrival of water characterized by higher EA values.
During high flow periods (i.e., high piezometric level in the saturated zone), the spring discharge is mainly supplied by fast flow through the main drainage network from the surface to the saturated zone. During these periods, the measurements performed on water circulation through the infiltration zone seem to indicate that the infiltrated water has a low EA signature (<1.3 cm3 STP.kg−1), and thus EA formation in fast flow groundwater. This would explain the low EA values measured in the Durzon spring during high flow periods assuming no degassing. When the piezometric head decreases at the scale of the aquifer and within the karst drainage network, the lateral exchange with the surrounding porous matrix reverses, causing drainage of groundwater stored in the matrix through the drainage network. This groundwater flow from the matrix contributes to discharge at the spring and thus generates an increase in EA values at the spring. This process of formation and transfer of EA from the subsurface to the spring suggests that the lower EA values measured at the spring will be representative of the EA values of epikarst water.
Additionally, four dissolved gas measurements performed at different depths within the non-saturated zone have shown that the EA varies between 0.5 and 1.2 cm3 STP.kg−1 (Pérotin et al., 2021). This range of variation is one order of magnitude lower than the variation of EA measured at the spring, where measurements indicate variation up to 11 cm3 STP.kg−1. For the modeling approach, we will assume that the excess air of the water in the non-saturated zone is equal to 0.9, that is, an intermediate value to those measured in the epikarst and at the Bise.
Coupled flow and EA simulation
The model is calibrated considering both spring discharge and EA measurements (Table 2). Figure 5 shows the various time series, which allow for analyzing the internal functioning of the Durzon aquifer. The periods focus on 2010–2012, with a higher EA measurement density although the calibration periods lasted until 2019 (the last EA measurement at the Durzon spring). The model calibration shows a quite satisfactory agreement with NSE(Qsim) = 0.75 and NSE(EAsim) = 0.53. The simulated discharge appears to reproduce the major flood event but lacks the reproduction of some minor floods as in December 2011 and during the May-June period in 2012. The simulated spring discharge is composed of QhyES flowing from the compartment directly to the spring, which occurs when the water level in compartment E exceeds the activation threshold Ehy = 295.9 mm. This quick flow constitutes the major contribution to the spring discharge during floods, especially following episodes with significant cumulative precipitation. Also, part of the overflow from compartment E contributes to the recharge of compartment C, through the QhyEC fluxes and constitutes the major part of the overflow from compartment E. Indeed, the repartition coefficient Xhy is estimated to be 0.84, which means that 84% of the Qhy contributes to the recharge of compartment C and that 16% flow directly to the spring and thus participate in floods observed after significant precipitation events. During the rest of the year, the fluxes from compartment C to the spring QCS ensure the spring baseflow. The model appears to overestimate the spring discharge during recession periods. The complex flow behavior within the Durzon spring, first explained by considering a hysteretic behavior (Tritz et al., 2011) was better reproduced while considering an infinite characteristic time transfer function (Guinot et al., 2015). However, this model structure does not allow simulating the EA formation as well as exchanges between capacitive and transmissive parts of the aquifer allowing to account for the delay between recharge (EA formation) and increasing spring EA values in periods of low flow (Figure 4).
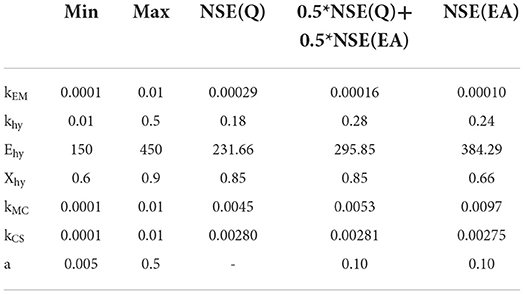
Table 2. Parameter space and values for the parameters estimated with a Particle Swarm Optimization (PSO) procedure implemented in the “pyswarm” package (Lee, 2014) according various objective functions.
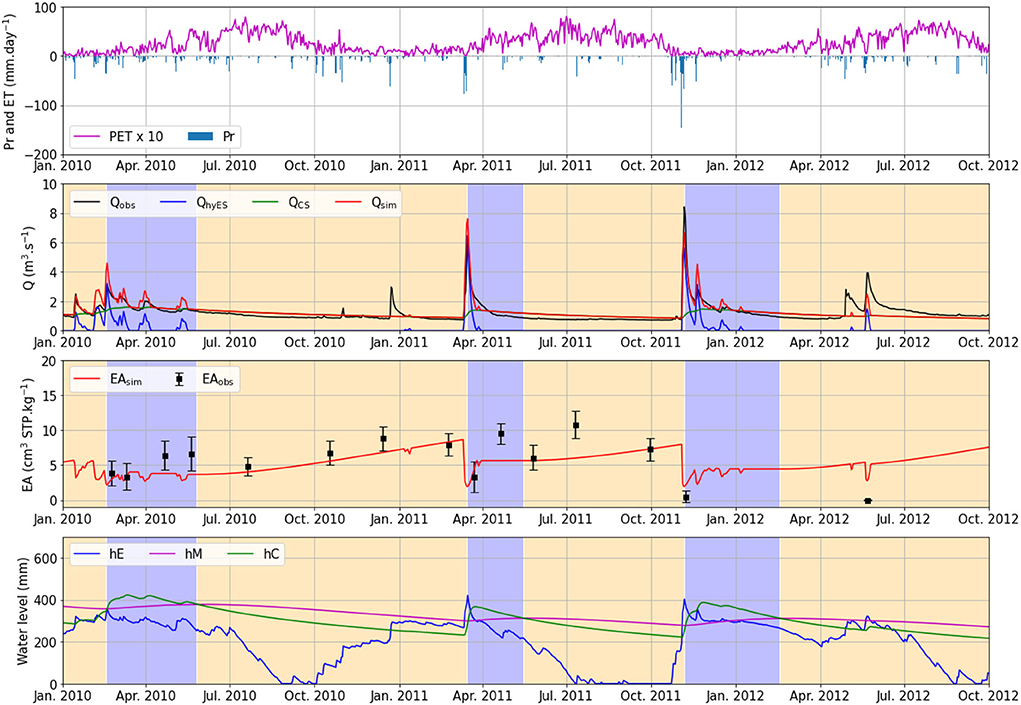
Figure 5. (i) Precipitation and potential evapotranspiration time series, (ii) observed and simulated spring discharges, (iii) observed and simulated spring EA time series, (iv) water level time series in the compartments E, M, and C. Periods with blue background color correspond to periods when the water level in C is greater than the water level in M so QMC > 0 (compartment C feeds the compartment M). Conversely, periods in orange background color correspond to periods when compartment M feed compartment C.
Despite the sparse temporal resolution of the EA time series, the spring EA variation appears quite well-reproduced. Indeed, the model allows reproducing the observed spring EA decrease following the precipitation episodes in March and November 2011. This occurs simultaneously with the occurrence of QhyES, which corresponds to fast flow from the surface to the spring without significant formation of EA, and thus allows reproducing of the EA signature observed at the spring because water from compartment E has a low EA concentration, estimated to be around = 0.9 cm3 STP.kg−1 (Pérotin et al., 2021). Considering the flow reversal in March 2011, the spring EA increases after a short period and even though the model underestimates the spring EA signature, the dynamics are quite well-reproduced.
The water level in E (hE) shows an important annual variability, with completely dry periods during the late summer periods. Conversely, the water levels in M (hM) and C (hC) present smooth variations, although compartment C presents a much more dynamic response to recharge. The proposed model considers that EA can be formed in compartment M linearly with the recharge intensity. The coefficient is estimated to be equal to 0.1 then the model considers that a recharge intensity of 1 mm.day−1 will produce an EA of 0.1 cm3 STP.kg−1. One should note that the maximum recharge intensity in compartment M is estimated at around 3 mm.day−1 so the maximum creation of EA during a single day is 0.3 cm3 STP.kg−1. In the proposed model, the EA formed during a time step (here, equal to 1 day) is mixed with the water stock available at the considered time step, with its inherited EA signature (i.e., calculated at the previous time step). The numerical model considers an instantaneous perfect mixing, which constitutes a quite simple mixing model but appears reasonable considering the poor temporal resolution of the EA time series measured at the outlet.
Parametric uncertainties
The LHS procedure is applied to investigate the parameter space with 50,000 simulations where only the 0.1% portion of the best Φ value is considered to evaluate the confidence interval (Figure 6). The parametric uncertainties lead to significant predictive errors. Indeed, the confidence interval can cover a wide range of values regarding the spring discharge time series. As an example, considering the flood in November 2011, the confidence interval (CI) covers a range of peak values from 4.5 to 11 m3.s−1, for an observed spring discharge around 8.5 m3.s−1. Also, some of the simulations lack to reproduce floods of moderate amplitude such as in January 2011. Considering the EA data measured at the outlet, the confidence interval shows consistent dynamics with the observed time series. Although the parametric uncertainties lead to predictive errors, the errors do not change the dynamics of the simulated time series. Also, considering the previously discussed episode in March and November 2011, all the simulations allow the reproduction of the EA decrease observed at the outlet.
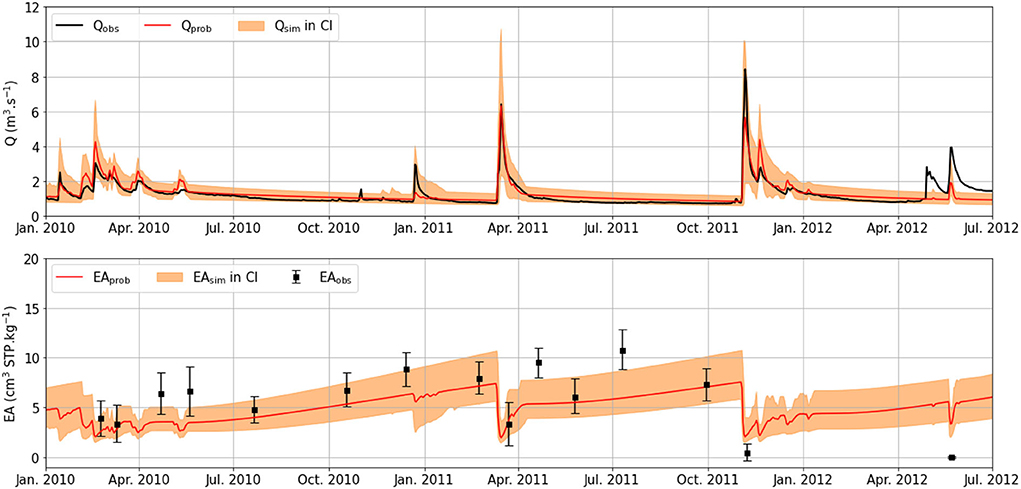
Figure 6. Observed and simulated time series in the confidence interval (CI) with the 0.1% proportion out of 50,000 simulations within the parameter space sampled with the Latin Hypercube Sampling (LHS) procedure: (top) spring discharge Q and (bottom) spring air excess EA. Qprob and EAprob consists of the weighted mean of the simulation in the confidence interval. The weight corresponds to the objective function Φ such as the lower the prediction errors the higher the weight.
Such results show that building the rainfall discharge model considering the concept of EA formation appears consistent with the simulation of spring EA but could introduce significant bias in the simulation of the spring discharge. Also, the parametric uncertainties can be less sensitive considering the EA time series due to the low temporal resolution of the spring EA time series available for parameter estimation.
The LHS procedure is applied considering three Φ so that the calibration considers either the spring discharge alone, both spring discharge and spring EA, or the spring EA alone. Accordingly, the affected weight ω to each calibration variable (spring discharge and spring EA) is modified such as ω = [0, 0.5, 1]. Figure 7 shows the scatter plots of the values of the objective function (calibration period) against the values of the parameters and the associated kernel density estimation (KDE) for each objective function. The KDE is normalized to 1 for an easier comparison of the distribution according to the different objective functions. According to all the model parameters, different cases can be observed regarding the KDE:
• The KDE shows different distributions if the model is calibrated according to the spring discharge or the spring EA, as observed for the parameters khy and kCS.
• The KDE shows a close position for the distribution peak while the distribution shows a different shape, as observed for the parameters kEM, Ehy, Xhy, and kMC. Considering kEM, the KDE appears bimodal when accounting only for spring discharge while the KDE appears unimodal when considering spring EA for model calibration. Also, the KDE appears centered close to 4 × 10⁻⁴ mm.day−1. Such results also concern kMC where the distribution spread appears to reduce when considering spring EA for parameter estimation while the optimum value occurs between 7 and 9 × 10⁻² mm.day−1.
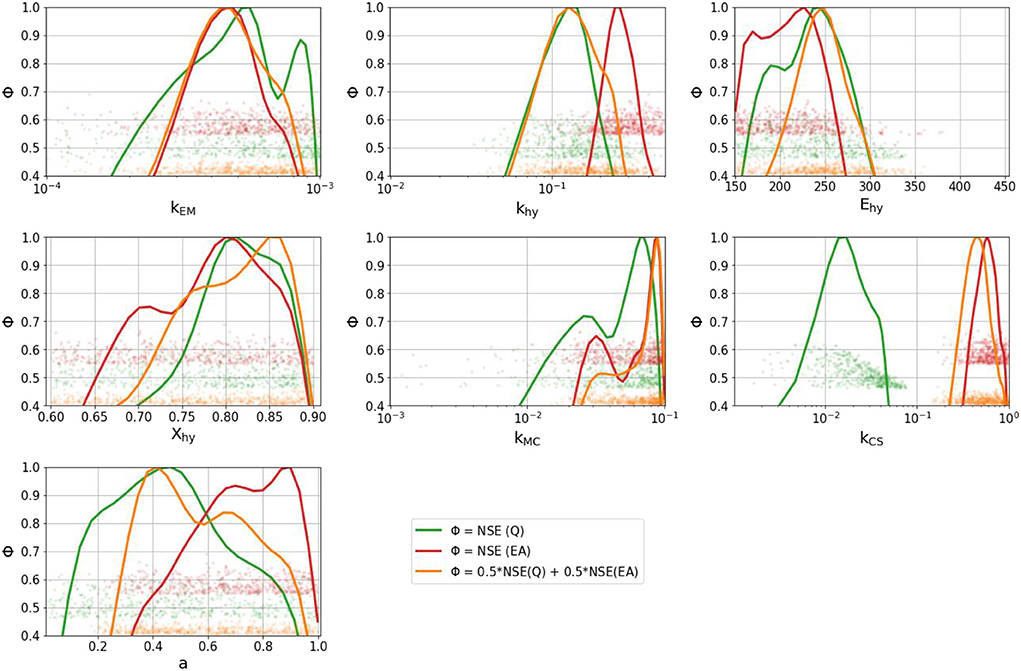
Figure 7. Kernel density estimation for each model parameter depending on the objective function Φ. Here, only the weight affected by the calibration variables (either spring discharge or spring EA measurement) is modified.
Analysis of the parameter distribution shows that the introduction of spring EA measurements may bring uncertainty in the estimation of parameters governing directly the flow dynamics at the spring, that is, khy and kCS. Conversely, considering spring EA seems to reduce the parametric uncertainty for the parameters governing the dynamics within compartment M (representative of the capacitive part of the aquifer), that is, kEM and kMC. Such results appear consistent with the working hypothesis because the proposed rainfall discharge model is based on a conceptual representation of the EA formation in karst aquifers.
Discussion
A parameter estimation procedure accounting only for the EA measurements at the spring shows that the simulated hydrographs still reproduce the main components of the spring discharge flow behavior (Figure 8). Indeed, the major floods appear quite well-reproduced when considering only spring EA for parameter estimation. Nonetheless, some floods such as in January 2010 and January 2011 are not reproduced when considering spring EA only for parameter estimation but are reproduced when considering only spring discharge for parameter estimation. The proposed rainfall discharge model presents some weaknesses in spring hydrograph simulation compared with the model structure proposed in former studies (Tritz et al., 2011; Mazzilli et al., 2012, 2013; Guinot et al., 2015). However, the proposed model allows reproducing the dynamics of observed spring EA variations and provides consistent spring hydrographs. Such results bring answers to the following questions:
• What is the information content (i.e., data worth) of additional observations such as spring EA?
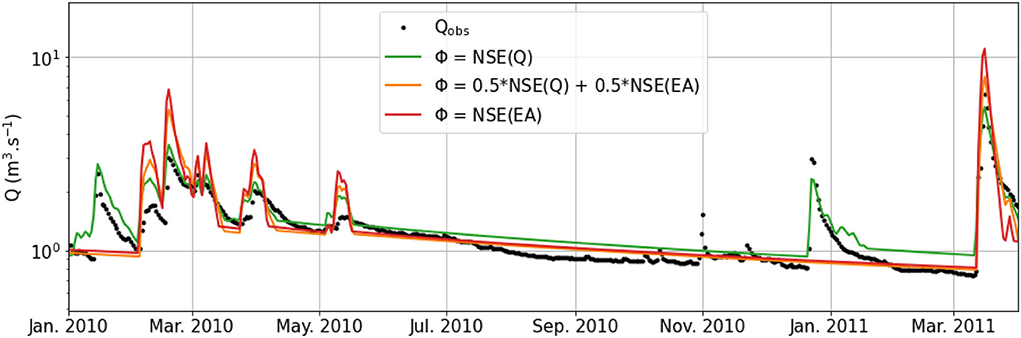
Figure 8. Observed and simulated spring discharge time series considering different objective functions.
In karst hydrology, rainfall discharge models are generally calibrated based only on the spring discharge observations. However, several studies have shown an interest in considering additional observations such as NO3 and SO4 concentrations (Hartmann et al., 2013) or electrical conductivity (Chang et al., 2021), particularly to identify realistic structures of the rainfall discharge model. Within the Durzon karst system, Mazzilli et al. (2013) attempted to calibrate a rainfall discharge reservoir model considering ground-based gravity measurements. The results of the study show that the gravity measurements do not help to better constrain the rainfall discharge model calibration. Among other reasons for such results, the question of the data representativity is risen by the authors. Other studies attempted to include piezometric head variations with conflicting results. As an example, Sivelle and Jourde (2020) identified a complex relationship between piezometric head time series and spring discharge time series within the Oeillal's spring catchment (southern France) and so, did not consider the piezometric head variation to calibrate the rainfall discharge model. Conversely, for the Lez karst system (southern France), considering the piezometric head variation in the estimation of the parameters, besides the discharge, allowed proposing a parsimonious model with better performance than former models (Mazzilli et al., 2011; Cousquer and Jourde, 2022). Also, piezometric head variation derived from ground-based gravity measurement can be of interest for the calibration of a rainfall discharge model but the information content of such data can be disputable on spatial consideration as well as the geometry of the aquifer (Mazzilli et al., 2013).
In our study, we attempted to calibrate the proposed rainfall discharge model under consideration of spring EA measurements, considered as a proxy of the recharge processes at the catchment scale. Nonetheless, the underlying hypothesis for the numerical modeling considers a linear relationship between water level variations in compartment M (representative of the capacitive function of the aquifer) and the formation of EA. Also, the study does not account for observed piezometric head variation because no borehole over the area reaches the saturated zone. Thus, the results lack information to discuss the physical realism in the relationship between EA formation and piezometric head variations. Although some experiments at the laboratory scale (Holocher et al., 2002) bring some relationship between piezometric head variation and EA signature on sand columns, no study has investigated such a relationship in natural hydrogeological systems, especially in karst aquifers. As suggested by Pérotin et al. (2021) “it is unknown whether there is a direct link between EA and rainfall recharge rates.” The results of the present study show that considering a linear relationship between EA and recharge rates appears efficient to reproduce the EA variations observed in the spring with a rainfall discharge model.
• How can we choose a suitable model structure?
Several rainfall discharge models have been proposed to simulate the Durzon spring discharge. Deville et al. (2013) proposed a two-level model structure where the upper compartment (C1) is exposed to precipitation and evapotranspiration while the lower level (C2) received flow when water content exceeds the activation threshold in C1. The lower compartment C2 supplies the spring discharge. The model is calibrated according to the ground-based gravity measurements and shows consistent results with the observation. Additional analysis is made, over a longer period and shows that gravity alone cannot constrain a rainfall discharge model because the gravity measurement in the area appears more sensitive to the slow transfer (Fores et al., 2017). Tritz et al. (2011) proposed a hysteretic model to better account for both the suction curve hysteresis in the soil/epikarst zone and the influence of the connectivity of this zone, allowing quick spring discharge increase in periods of important recharge. The authors highlight that using the hysteretic function allows for better reproduction of first flood peaks, which bring complementary information to the ground-based gravity measurements. Nonetheless, Mazzilli et al. (2013) showed that the gravity-derived information might not constrain the parameter estimation of the rainfall discharge model. Guinot et al. (2015) introduced a transfer function with an infinite characteristic time providing satisfactory performance criteria with a lower number of parameters. In this study, the calibration was performed accounting for the spring discharge alone, and no calibration is performed yet accounting for additional observations such as ground-based gravity measurement or hydrochemical observations.
The present study brings a new model structure for the Durzon karst system. The model structure is based on water exchanges between the capacitive and the transmissive compartments of the karst aquifer, considered a prerequisite to explaining the spring EA variation. The introduction of spring EA in the parameter estimation procedure allows both reproducing of the spring discharge dynamics and reducing the parametric uncertainties, especially for the parameter governing the dynamics of the capacitive compartments emptying, namely, kEM and kMC. Conversely, the parameters governing the simulated spring discharge, namely, khy and kCS appear not better constrained when considering EA in the calibration, and the model performance for the simulation of spring hydrographs appears lower than the one obtained in former studies (Tritz et al., 2011; Mazzilli et al., 2013; Guinot et al., 2015).
Conclusion
The study evaluates the relevance of using EA for the characterization of matrix–conduit interactions in karst systems using a rainfall discharge model coupled with the simulation of EA measurements at the outlet of the studied system. The main results show that considering EA measurement can reduce the parametric uncertainties. Indeed, the parameters governing the dynamics of the capacitive compartment (E and M) appear better constrained when, besides spring discharge, EA measurements at the spring are considered as complementary observations in the model calibration. Also, the rainfall discharge model allows for the reproduction of the spring hydrographs even when considering only EA measured at the spring in the objective function. Such results corroborate that the EA variations measured in the spring are informative about the internal dynamics of the Durzon karst aquifer.
Finally, the proposed numerical model allows for validating the conceptual model proposed to explain the EA formation in karst aquifers. Also, the study provides encouraging results on the use of EA as a tracer of flow exchanges. Research perspectives might include the following:
• Specifying the relationship between the EA measured at the spring and the piezometric variations within the saturated zone (which remains unknown for the Durzon system due to the absence of deep drilling),
• Combining the information content of the EA measurements at the spring with other observations such as ground-based gravity measurements, electrical conductivity, and temperature,
• Assessing both structural and parametric uncertainties related to the various types of observations available for rainfall discharge model calibration,
• Assessing the sensitivity of rainfall discharge model predictions to observations as well as assessing the information content of each type of observation for rainfall discharge model calibration,
• Developing more robust rainfall discharge models dedicated to karst aquifers by using hydrochemical observations.
Data availability statement
The data analyzed in this study is subject to the following licenses/restrictions: The data are provided by the Regional Natural Park of the Grands Causses (PNRGC) and the French National Observation Services H+. Requests to access these datasets should be directed to http://hplus.ore.fr/.
Author contributions
VS: conceptualization, methodology, software, formal analysis, and writing—original draft. LP: conceptualization, data curation, methodology, formal analysis, and writing—original draft. BL: project administration, methodology, supervision, and writing—review and editing. VM: project administration, funding acquisition, and supervision. VB-C: methodology and supervision. CC: methodology, supervision, and writing—review and editing. HJ: conceptualization, methodology, and writing—review and editing. All authors contributed to the article and approved the submitted version.
Funding
This work was carried out with the financial support of the doctoral program of the Occitanie Region and the BRGM, French geological survey, which are kindly acknowledged.
Acknowledgments
The authors would like to thank the French National Observation Services KARST (http://sokarst.org/) initiative at the INSU/CNRS, which aims to strengthen the dissemination of knowledge and promotes cross-disciplinary research on karst systems at the national scale, for their support of the use of the KarstMod model. The authors also thank the Regional Natural Park of the Grands Causses (PNRGC) for providing the discharge data as well as the French National Observation Services H+ (http://hplus.ore.fr/) for providing meteorological data over the Durzon karst system. The French National Observation Services KARST and H+ are part of the Elter European Infrastructure (https://www.lter-europe.net/elter-esfri). Dissolved gas analyses were performed within the CONDATE-EAU analytical platform, which are also acknowledged for the discussions.
Conflict of interest
The authors declare that the research was conducted in the absence of any commercial or financial relationships that could be construed as a potential conflict of interest.
Publisher's note
All claims expressed in this article are solely those of the authors and do not necessarily represent those of their affiliated organizations, or those of the publisher, the editors and the reviewers. Any product that may be evaluated in this article, or claim that may be made by its manufacturer, is not guaranteed or endorsed by the publisher.
References
Aeschbach-Hertig, W. (2004). “Excess air in groundwater: problems and opportunities.” in Annual Meeting of GSA (Denver).
Aeschbach-Hertig, W., Peeters, F., Beyerle, U., and Kipfer, R. (2000). Palaeotemperature reconstruction from noble gases in ground water taking into account equilibration with entrapped air. Nature 405, 1040–1044. doi: 10.1038/35016542
Aeschbach-Hertig, W., and Solomon, D. K. (2013). “Noble gas thermometry in groundwater hydrology,” in The Noble Gases as Geochemical Tracers Advances in Isotope Geochemistry, ed. P. Burnard (Berlin, Heidelberg: Springer Berlin Heidelberg), 81–122.
Aeschbach-Hertig, W., Stute, M., Clark, J. F., Reuter, R. F., and Schlosser, P. (2002). A paleotemperature record derived from dissolved noble gases in groundwater of the Aquia Aquifer (Maryland, USA). Geochim. Cosmochim. Acta 66, 797–817. doi: 10.1016/S0016-7037(01)00804-3
Aquilina, L., Ladouche, B., and Dörfliger, N. (2005). Recharge processes in karstic systems investigated through the correlation of chemical and isotopic composition of rain and spring-waters. Appl. Geochem. 20, 2189–2206. doi: 10.1016/j.apgeochem.2005.07.011
Bailly-Comte, V., Martin, J. B., Jourde, H., Screaton, E. J., Pistre, S., and Langston, A. (2010). Water exchange and pressure transfer between conduits and matrix and their influence on hydrodynamics of two karst aquifers with sinking streams. J. Hydrol. 386, 55–66. doi: 10.1016/j.jhydrol.2010.03.005
Berglund, J. L., Toran, L., and Herman, E. K. (2020). Can karst conduit models be calibrated? A dual approach using dye tracing and temperature. Groundwater 58, 924–937. doi: 10.1111/gwat.12988
Beyerle, U., Rueedi, J., Leuenberger, M., Aeschbach-Hertig, W., Peeters, F., Kipfer, R., et al. (2003). Evidence for periods of wetter and cooler climate in the Sahel between 6 and 40 kyr BP derived from groundwater. Geophys. Res. Lett. 30, 1173–1177. doi: 10.1029/2002GL016310
Blicher-Mathiesen, G., McCarty, G. W., and Nielsen, L. P. (1998). Denitrification and degassing in groundwater estimated from dissolved dinitrogen and argon. J. Hydrol. 208, 16–24. doi: 10.1016/S0022-1694(98)00142-5
Chang, Y., Hartmann, A., Liu, L., Jiang, G., and Wu, J. (2021). Identifying more realistic model structures by electrical conductivity observations of the karst spring. Water Resour. Res. 57, e2020WR028587. doi: 10.1029/2020WR028587
Chatton, E. (2017). Contribution of Dissolved Gases to the Understanding of Groundwater Hydrobiogeochemical Dynamics. Available online at: http://www.theses.fr/2017REN1S131 (accessed February 2, 2022).
Cholet, C., Charlier, J.-B., Moussa, R., Steinmann, M., and Denimal, S. (2017). Assessing lateral flows and solute transport during floods in a conduit-flow-dominated karst system using the inverse problem for the advection–diffusion equation. Hydrol. Earth Syst. Sci. 21, 3635–3653. doi: 10.5194/hess-21-3635-2017
Clark, J. F., Hudson, G. B., and Avisar, D. (2005). Gas transport below artificial recharge ponds: insights from dissolved noble gases and a dual gas (SF6 and 3He) tracer experiment. Environ. Sci. Technol. 39, 3939–3945. doi: 10.1021/es049053x
Cousquer, Y., and Jourde, H. (2022). Reducing uncertainty of karst aquifer modeling with complementary hydrological observations for the sustainable management of groundwater resources. J. Hydrol. 612, 128130. doi: 10.1016/j.jhydrol.2022.128130
Dal Soglio, L., Danquigny, C., Mazzilli, N., Emblanch, C., and Massonnat, G. (2020). Modeling the matrix-conduit exchanges in both the epikarst and the transmission zone of karst systems. Water 12, 3219. doi: 10.3390/w12113219
Deville, S., Jacob, T., Chéry, J., and Champollion, C. (2013). On the impact of topography and building mask on time varying gravity due to local hydrology. Geophys. J. Int. 192, 82–93. doi: 10.1093/gji/ggs007
Duran, L., Massei, N., Lecoq, N., Fournier, M., and Labat, D. (2020). Analyzing multi-scale hydrodynamic processes in karst with a coupled conceptual modeling and signal decomposition approach. J. Hydrol. 583, 124625. doi: 10.1016/j.jhydrol.2020.124625
Eberhart, R., and Kennedy, J. (1995). “Particle swarm optimization,” in Proceedings of the IEEE International Conference on Neural Networks (Citeseer) 1942–1948.
Ford, D., and Williams, P. (2013). Karst Hydrogeology and Geomorphology. Hoboken, NJ: John Wiley & Sons.
Fores, B. (2016). Gravimétrie et surveillance sismique pour la modélisation hydrologique en milieu karstique : application au bassin du Durzon (Larzac, France). Available online at: http://www.theses.fr/2016MONTT128 (accessed January 31, 2022).
Fores, B., Champollion, C., Le Moigne, N., Bayer, R., and Chéry, J. (2017). Assessing the precision of the iGrav superconducting gravimeter for hydrological models and karstic hydrological process identification. Geophys. J. Int. 208, 269–280. doi: 10.1093/gji/ggw396
Guinot, V., Savéan, M., Jourde, H., and Neppel, L. (2015). Conceptual rainfall–runoff model with a two-parameter, infinite characteristic time transfer function. Hydrol. Process. 29, 4756–4778. doi: 10.1002/hyp.10523
Hartmann, A., Jasechko, S., Gleeson, T., Wada, Y., Andreo, B., Barber,á, J., et al. (2021). Risk of groundwater contamination widely underestimated because of fast flow into aquifers. Proc. Nat. Acad. Sci. 118, e2024492118. doi: 10.1073/pnas.2024492118
Hartmann, A., Wagener, T., Rimmer, A., Lange, J., Brielmann, H., and Weiler, M. (2013). Testing the realism of model structures to identify karst system processes using water quality and quantity signatures. Water Resour. Res. 49, 3345–3358. doi: 10.1002/wrcr.20229
Heaton, T. H. E., and Vogel, J. C. (1981). “Excess air” in groundwater. J. Hydrol. 50, 201–216. doi: 10.1016/0022-1694(81)90070-6
Herzberg, O., and Mazor, E. (1979). Hydrological applications of noble gases and temperature measurements in underground water systems: examples from Israel. J. Hydrol. 41, 217–231. doi: 10.1016/0022-1694(79)90063-5
Holocher, J., Peeters, F., Aeschbach-Hertig, W., Hofer, M., Brennwald, M., Kinzelbach, W., et al. (2002). Experimental investigations on the formation of excess air in quasi-saturated porous media. Geochim. Cosmochim. Acta 66, 4103–4117. doi: 10.1016/S0016-7037(02)00992-4
Ingram, R. G. S., Hiscock, K. M., and Dennis, P. F. (2007). Noble gas excess air applied to distinguish groundwater recharge conditions. Environ. Sci. Technol. 41, 1949–1955. doi: 10.1021/es061115r
Jeannin, P.-Y. (2001). Modeling flow in phreatic and epiphreatic karst conduits in the Hölloch Cave (Muotatal, Switzerland). Water Resour. Res. 37, 191–200. doi: 10.1029/2000WR900257
Jourde, H., Massei, N., Mazzilli, N., Binet, S., Batiot-Guilhe, C., Labat, D., et al. (2018). SNO KARST: a french network of observatories for the multidisciplinary study of critical zone processes in Karst Watersheds and Aquifers. Vadose Zone J. 17, 180094. doi: 10.2136/vzj2018.04.0094
Klump, S., Tomonaga, Y., Kienzler, P., Kinzelbach, W., Baumann, T., Imboden, D. M., et al. (2007). Field experiments yield new insights into gas exchange and excess air formation in natural porous media. Geochim. Cosmochim. Acta 71, 1385–1397. doi: 10.1016/j.gca.2006.12.006
Kulongoski, J. T., Hilton, D. R., and Selaolo, E. T. (2004). Climate variability in the Botswana Kalahari from the late Pleistocene to the present day. Geophys. Res. Lett. 31. doi: 10.1029/2003GL019238
Lee, A. (2014). Pyswarm: Particle Swarm Optimization (PSO) with Constraint Support. Available online at: https://github.com/tisimst/pyswarm (accessed May 27, 2021).
Lukač Reberski, J., Terzić, J., Maurice, L. D., and Lapworth, D. J. (2022). Emerging organic contaminants in karst groundwater: a global level assessment. J. Hydrol. 604, 127242. doi: 10.1016/j.jhydrol.2021.127242
Manning, A. H., and Caine, J. S. (2007). Groundwater noble gas, age, and temperature signatures in an Alpine watershed: Valuable tools in conceptual model development. Water Resour. Res. 43. doi: 10.1029/2006WR005349
Mariotti, A. (1986). La dénitrification dans les eaux souterraines, principes et méthodes de son identification: Une revue [Denitrification in groundwater, principles and methods of its identification: A review]. J. Hydrol. 88, 1–23. doi: 10.1016/0022-1694(86)90194-0
Marsaud, B. (1996). Structure et fonctionnement de la zone noyee des karsts a partir des resultats experimentaux. Available online at: http://www.theses.fr/1996PA112532 (accessed December 31, 2019).
Martin, J. B., and Dean, R. W. (2001). Exchange of water between conduits and matrix in the Floridan aquifer. Chem. Geol. 179, 145–165. doi: 10.1016/S0009-2541(01)00320-5
Massmann, G., and Sültenfuß, J. (2008). Identification of processes affecting excess air formation during natural bank filtration and managed aquifer recharge. J. Hydrol. 359, 235–246. doi: 10.1016/j.jhydrol.2008.07.004
Mazor, E., van Everdingen, R. O., and Krouse, H. R. (1983). Noble-gas evidence for geothermal activity in a karstic terrain: rocky mountains, Canada. Geochim. Cosmochim. Acta 47, 1111–1115. doi: 10.1016/0016-7037(83)90241-7
Mazzilli, N., Guinot, V., and Jourde, H. (2012). Sensitivity analysis of conceptual model calibration to initialisation bias. Application to karst spring discharge models. Adv. Water Res. 42, 1–16. doi: 10.1016/j.advwatres.2012.03.020
Mazzilli, N., Guinot, V., Jourde, H., Lecoq, N., Labat, D., Arfib, B., et al. (2019). KarstMod: A modelling platform for rainfall - discharge analysis and modelling dedicated to karst systems. Environ. Model. Soft. 122, 103927. doi: 10.1016/j.envsoft.2017.03.015
Mazzilli, N., Jourde, H., Guinot, V., Bailly-Comte, V., and Fleury, P. (2011). Hydrological Modelling of a Karst Aquifer Under Active Groundwater Management Using a Parsimonious Conceptual Model. in H2Karst (Besançon, France). Available online at: https://hal.archives-ouvertes.fr/hal-01844603 (accessed April 27, 2022).
Mazzilli, N., Jourde, H., Jacob, T., Guinot, V., Le Moigne, N., Boucher, M., et al. (2013). On the inclusion of ground-based gravity measurements to the calibration process of a global rainfall-discharge reservoir model: case of the Durzon karst system (Larzac, southern France). Environ Earth Sci 68, 1631–1646. doi: 10.1007/s12665-012-1856-z
Meyerhoff, S. B., Karaoulis, M., Fiebig, F., Maxwell, R. M., Revil, A., Martin, J. B., et al. (2012). Visualization of conduit-matrix conductivity differences in a karst aquifer using time-lapse electrical resistivity. Geophys. Res. Lett. 39, 2012GL053933. doi: 10.1029/2012GL053933
Mitrofan, H., Marin, C., and Povar,ă, I. (2015). Possible conduit-matrix water exchange signatures outlined at a Karst Spring. Groundwater 53, 113–122. doi: 10.1111/gwat.12292
Nash, J. E., and Sutcliffe, J. V. (1970). River flow forecasting through conceptual models part I — a discussion of principles. J. Hydrol. 10, 282–290. doi: 10.1016/0022-1694(70)90255-6
Osenbrück, K., Stadler, S., Sültenfuß, J., Suckow, A. O., and Weise, S. M. (2009). Impact of recharge variations on water quality as indicated by excess air in groundwater of the Kalahari, Botswana. Geochim. Cosmochim. Acta 73, 911–922. doi: 10.1016/j.gca.2008.11.006
Peeters, F., Aeschbach-Hertig, W., Holocher, J., and Kipfer, R. (2002). “Excess air correction in groundwater dating with He isotopes.” in geochimica et cosmochimica acta (pergamon-elsevier science ltd the boulevard, langford lane, kidlington), A587.
Penman, H. L. (1948). Natural evaporation from open water, bare soil and grass. Proc. R. Soc. Lond. A. Math. Phys. Sci. 193, 120–145. doi: 10.1098/rspa.1948.0037
Pérotin, L. (2021). Caractérisation de la recharge et des transferts au sein des aquifères karstiques par l'utilisation des gaz dissous. Available online at: https://tel.archives-ouvertes.fr/tel-03655132 (accessed May 6, 2022).
Pérotin, L., de Montety, V., Ladouche, B., Bailly-Comte, V., Labasque, T., Vergnaud, V., et al. (2021). Transfer of dissolved gases through a thick karstic vadose zone – implications for recharge characterisation and groundwater age dating in karstic aquifers. J. Hydrol. 601, 126576. doi: 10.1016/j.jhydrol.2021.126576
Perrin, C., Michel, C., and Andréassian, V. (2001). Does a large number of parameters enhance model performance? Comparative assessment of common catchment model structures on 429 catchments. J. Hydrol. 242, 275–301. doi: 10.1016/S0022-1694(00)00393-0
Plagnes, V. (1997). Structure et fonctionnement des aquifères karstiques : caractérisation par la géochimie des eaux. Available online at: https://www.theses.fr/1997MON20193 (accessed March 3, 2022).
Plummer, L. N., Busenberg, E., and Widman, P. K. (2004). Applications of Dissolved N2 and Ar in Groundwater. Reston, VA: U.S. Geological Survey.
Popp, A. L., Pardo-Álvarez, Á., Schilling, O. S., Scheidegger, A., Musy, S., Peel, M., et al. (2021). A framework for untangling transient groundwater mixing and travel times. Water Resour. Res. 57, e2020WR028362. doi: 10.1029/2020WR028362
Reimann, T., Geyer, T., Shoemaker, W. B., Liedl, R., and Sauter, M. (2011). Effects of dynamically variable saturation and matrix-conduit coupling of flow in karst aquifers. Water Resour. Res. 47. doi: 10.1029/2011WR010446
Ricard, J., and Bakalowicz, M. (1996). Connaissance, aménagement et protection des ressources en eau du Larzac septentrional, Aveyron (France). Report R38953, BRGM, Orléans.
Sano, Y., Kinoshita, N., Kagoshima, T., Takahata, N., Sakata, S., Toki, T., et al. (2017). Origin of methane-rich natural gas at the West Pacific convergent plate boundary. Sci. Rep. 7, 15646. doi: 10.1038/s41598-017-15959-5
Schilling, O. S., Parajuli, A., Tremblay Otis, C., Müller, T. U., Antolinez Quijano, W., Tremblay, Y., et al. (2021). Quantifying groundwater recharge dynamics and unsaturated zone processes in snow-dominated catchments via on-site dissolved gas analysis. Water Resour. Res. 57, e2020WR028479. doi: 10.1029/2020WR028479
Schilling, O. S., Partington, D. J., Doherty, J., Kipfer, R., Hunkeler, D., and Brunner, P. (2022). Buried paleo-channel detection with a groundwater model, tracer-based observations, and spatially varying, preferred anisotropy pilot point calibration. Geophys. Res. Lett. 49, e2022GL098944. doi: 10.1029/2022GL098944
Shirafkan, M., Mohammadi, Z., Sivelle, V., and Labat, D. (2021). The effects of exchange flow on the karst spring hydrograph under the different flow regimes: a synthetic modeling approach. Water 13, 1189. doi: 10.3390/w13091189
Sivelle, V., and Jourde, H. (2020). A methodology for the assessment of groundwater resource variability in karst catchments with sparse temporal measurements. Hydrogeol. J. 29, 137–157. doi: 10.1007/s10040-020-02239-2
Sivelle, V., Labat, D., Mazzilli, N., Massei, N., and Jourde, H. (2019). Dynamics of the flow exchanges between matrix and conduits in karstified watersheds at multiple temporal scales. Water 11, 569. doi: 10.3390/w11030569
Smith, R. L., Howes, B. L., and Duff, J. H. (1991). Denitrification in nitrate-contaminated groundwater: occurrence in steep vertical geochemical gradients. Geochim. Cosmochim. Acta 55, 1815–1825. doi: 10.1016/0016-7037(91)90026-2
Stute, M., and Schlosser, P. (2000). “Atmospheric noble gases,” in Environmental Tracers in Subsurface Hydrology, eds. P. G. Cook and A. L. Herczeg (Boston, MA: Springer US), 349–377.
Sugisaki, R., and Taki, K. (1987). Simplified analyses of He, Ne, and Ar dissolved in natural waters. Geochem. J. 21, 23–27. doi: 10.2343/geochemj.21.23
Summerfield, M. (2010). Programming in Python 3: A Complete Introduction to the Python Language. Hoboken, NJ: Addison-Wesley Professional.
Tomonaga, Y., Marzocchi, R., Pera, S., Pfeifer, H.-R., Kipfer, R., Decrouy, L., et al. (2017). Using noble-gas and stable-isotope data to determine groundwater origin and flow regimes: application to the ceneri base tunnel (Switzerland). J. Hydrol. 545, 395–409. doi: 10.1016/j.jhydrol.2016.11.043
Tritz, S., Guinot, V., and Jourde, H. (2011). Modelling the behaviour of a karst system catchment using non-linear hysteretic conceptual model. J. Hydrol. 397, 250–262. doi: 10.1016/j.jhydrol.2010.12.001
Wilson, G. B., and McNeill, G. W. (1997). Noble gas recharge temperatures and the excess air component. Appl. Geochem. 12, 747–762. doi: 10.1016/S0883-2927(97)00035-8
Zhang, Z., Chen, X., and Soulsby, C. (2017). Catchment-scale conceptual modelling of water and solute transport in the dual flow system of the karst critical zone. Hydrol. Process. 31, 3421–3436. doi: 10.1002/hyp.11268
Keywords: karst hydrology, air excess, lumped parameter modeling, recharge, karst aquifer
Citation: Sivelle V, Pérotin L, Ladouche B, de Montety V, Bailly-Comte V, Champollion C and Jourde H (2022) A lumped parameter model to evaluate the relevance of excess air as a tracer of exchanged flows between transmissive and capacitive compartments of karst systems. Front. Water 4:930115. doi: 10.3389/frwa.2022.930115
Received: 27 April 2022; Accepted: 21 July 2022;
Published: 15 August 2022.
Edited by:
Oliver S. Schilling, University of Basel, SwitzerlandReviewed by:
Juan José Durán Valsero, Instituto Geológico y Minero de España (IGME), SpainLászló Palcsu, Institute for Nuclear Research (MTA), Hungary
Copyright © 2022 Sivelle, Pérotin, Ladouche, de Montety, Bailly-Comte, Champollion and Jourde. This is an open-access article distributed under the terms of the Creative Commons Attribution License (CC BY). The use, distribution or reproduction in other forums is permitted, provided the original author(s) and the copyright owner(s) are credited and that the original publication in this journal is cited, in accordance with accepted academic practice. No use, distribution or reproduction is permitted which does not comply with these terms.
*Correspondence: Vianney Sivelle, dmlhbm5leS5zaXZlbGxlQHVtb250cGVsbGllci5mcg==