 Abdul Wahab Siyal
 P. Winnie Gerbens-Leenes
- 1Integrated Research on Energy, Environment and Society (IREES), University of Groningen, Groningen, Netherlands
- 2Pakistan Agricultural Research Council (PARC), Islamabad, Pakistan
Asia has a large water scarcity problem, especially in countries depending on irrigation, limiting agricultural production, and increasing food insecurity. When water becomes scarce, it needs conveyance over longer distances or pumping from deeper groundwater stocks, requiring pumping energy, often fossil energy, emitting greenhouse gasses. This causes a trade-off between irrigation water supply and fossil energy use contributing to global warming. This research focuses on the water–energy–food nexus in irrigated agriculture to improve resource management. It uses Pakistan as its case study area and assesses water consumption, energy (EFs), and carbon footprints (CFs) associated with irrigation water supply for the major crops (wheat, rice, sugarcane, and cotton) per district. The method first assesses irrigation water volumes (surface and groundwater) per crop per district and next the energy and CO2 emissions to provide this water. Data on allocated water volumes, crop areas and pumping types were taken from governmental reports. Groundwater tables and energy data were taken from scientific publication based also on actual measurements. The research identifies unfavorable hotspots and favorable areas from a water and energy perspective. Drivers determining water consumption, EFs, and CFs related to irrigation water supply show spatial and temporal differences and include crop types, temporal crop water requirements, fractions of gravity-fed and pumped water, groundwater tables, and energy sources (diesel, electric, and solar). In Pakistan, annual irrigation supply requires 103 PJ of energy generating a CF of 11 109 kg CO2 (6% of the national CF). Diesel pumps, pumping shallow groundwater, contribute most (73%), followed by electric pumps pumping deep groundwater. Energy for surface water pumping is negligible. Wheat contributes 31% to the EF, cotton 27%, and sugarcane and rice 21% each. CFs, caused by fossil energy use to pump irrigation water, are also dominated by wheat (32%) and cotton (31%), followed by rice and sugarcane (19% each). Ten hotspot districts contribute 42% to the EF of the major crops and increased by 21% in fourteen years. Wheat and cotton in Punjab and rice and cotton in Sindh are the most energy-intensive. EFs range between 3,500 and 5,000 TJ per district, with some districts in Punjab, the most important agricultural province, using even more. Large differences occur among EFs per unit of irrigation water, ranging between 7 and 2,260 KJ/m3, CFs between 1 and 444 g CO2/m3. The identification of hotspots may contribute to measures to minimize water consumption, EFs and CFs for agriculture in Pakistan. Other countries that also rely on irrigation could apply methods applied here to identify hotspots.
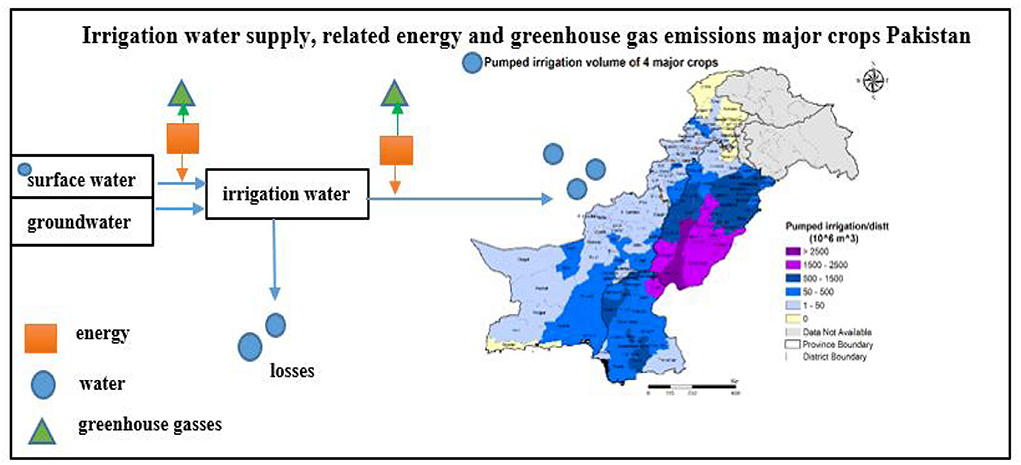
Graphical Abstract. Irrigation water supply, related energy and greenhouse gas emissions major crops Pakistan.
Highlights
• Energy and carbon footprints of food–energy–water systems show large spatial and temporal differences.
• Major drivers of energy and carbon footprints of irrigation are crop requirements; surface; and groundwater fractions, groundwater tables, and pump energy sources (diesel, electric, or solar).
• In Pakistan, 10 hotspot districts contribute 42% of irrigation energy of four major crops.
• Irrigation for wheat and cotton in Punjab and for rice and cotton in Sindh are the most energy-intensive.
• Energy footprints of irrigation water range between 7 and 2,260 KJ/m3, carbon footprints between 1 and 444 g CO2/m3.
Introduction
Globally, freshwater is a scarce natural resource (UN-Water, 2021) relevant for the functioning of societies. Most freshwater use, about 92% of global, societal freshwater consumption, takes place in agriculture (Hoekstra and Mekonnen, 2012). Water scarcity is a huge global problem, especially in Central and Southern Asia with densely populated countries such as India, Iran, and Pakistan (UN-Water, 2021) that also have large agricultural irrigation requirements (Chouchane et al., 2020). Water constraints limit agricultural production and increase food insecurity (FAO, 2020). In 2016, two-thirds of the world population, mostly in Asia, faced water scarcity for at least 1 month per year (Mekonnen and Hoekstra, 2016). When water becomes scarce, more effort is needed to provide irrigation water to agriculture. For example, water needs to be conveyed over longer distances to croplands or pumped from deeper groundwater stocks. This requires more and more energy in the form of energy for pumping, which is often fossil energy emitting greenhouse gasses. This means there is a trade-off between the supply of irrigation water and the use of fossil energy contributing to climate change, another global problem (IPCC, 2021).
Many studies have identified relationships among water, water scarcity, and agriculture, e.g., studies adopting the so-termed energy–water–food nexus approach introduced by Hoff (2011). Studies showing the relationship between energy and water have often assessed the water requirements of energy, e.g., Holmatov et al. (2021). Several studies on the energy requirements of water indicate the energy needed to supply a unit of water for a specific case. In their review paper, Plappally and Lienhard (2012) gave an overview of the energy needed per unit of freshwater for food production, e.g., energy for lifting water (pumping groundwater or surface water) and conveyance. The study showed that, in general, energy to provide water depends on location-specific factors in combination with the technology applied. Jackson et al. (2010) analyzed energy consumption at the irrigated field level. They showed that in groundwater-dependent regions, increased water use efficiency could reduce energy consumption by 12–44%. Pressurized irrigation systems have the highest efficiency in groundwater-dependent regions, while efficient management practices should be promoted in surface water-dependent regions. Moreno et al. (2010) studied energy for pressurized irrigation systems showing that energy efficiency improves by 3.5–25% with rotation schedules. Díaz et al. (2011) showed that efficient water use may lead to higher energy demand as modernization processes of irrigation systems require intensive energy use, e.g., the energy for pumping pressurized systems is much higher compared to traditional gravity-fed-based irrigation methods. Li (2014) indicated the importance of an integrated water and energy policy in China, while Safa et al. (2011) quantified energy per unit area for the construction of water supply sources, conveyance works, and system maintenance and operation. Water quality demands, however, differ among sectors, where agricultural water quality requirements are lower than requirements for the municipal sector, needing relatively more energy for purification (Liu et al., 2016). That study also gave an indication of the global energy needs for freshwater in 2010, showing the large contribution of municipal water supply compared to industrial and agricultural supply, and the increase in water withdrawals between 1973 and 2012, especially in Asian agriculture. When water availability decreases and agricultural water needs go up, also energy to provide this water will go up. For example, some South Asian countries with a growing demand for food, e.g., of cereals, have the policy to provide free water and subsidized energy to increase the production, causing an unsustainable use of resources (Rasul, 2016). The interrelationships in the energy–water–food nexus are relevant (Mayor et al., 2015). There is thus a need for more detailed information on the factors that determine the energy requirements of irrigation water.
Current emerging driving forces, such as climate change, population growth, and socioeconomic developments, are potential challenges to the sustainability of water–energy–food needs (Hoff, 2011; Liu et al., 2016). Especially in developing countries, such as countries in South Asia, the situation of water–energy–food nexus sustainability causes uncertainties due to the lack of appropriate technological, social, and economic interferences (Rasul and Sharma, 2016). Robust water–energy–food nexus system integration and management to improve efficient and sustainable development are relevant in a nexus approach.
In agriculture, crop water requirements differ among crops and depend on the crop characteristics and cropping patterns, local weather conditions, such as wind and temperature that determine evapotranspiration, and available rain. If there is not enough rainfall, crops need additional irrigation water (FAO, 2021). This means that crop water requirements have a spatial and temporal dimension and depend on the specific crop. Irrigation water volumes depend on the local availability of water, i.e., surface water or groundwater. Therefore, energy to provide water to crops also has a spatial and temporal dimension. An assessment of energy for irrigation water should therefore include the crop water requirements, local availability of specific water types, e.g., rain and surface water without energy requirements, and surface water and groundwater that need pumping. For the assessment of energy requirements of irrigation water, not only energy for pumping using diesel or electric pumps but also energy for surface water canal maintenance can be included. This provides information on how much energy is needed to provide irrigation water per unit of crop in a specific region in a specific cropping season. This paper aims to quantify the relevant factors that determine energy requirements for the irrigation of crops, identify hotspot areas, and understand and assess the water–energy nexus in irrigated agriculture. It uses Pakistan as its case study area because the country heavily relies on irrigation water (UN-Water, 2021) and has an important agricultural sector (Rehman et al., 2015) for which information on agriculture and water supply is available from official governmental reports in English, e.g., from the Bureau of statistics, planning and development department, the government of Pakistan (2018).
The major crops cultivated in Pakistan are wheat, rice, cotton, and sugarcane (FAO, 2022), which together contribute to 75% of crop cultivation of Pakistan (Bureau of statistics, planning and development department, the government of Pakistan, 2018). Agricultural output of Pakistan depends on the timely availability of water because the country is located in an arid region where rainfall is insufficient to fulfill crop water requirements. For irrigation water supply, it profits from its location in the Indus basin where the river provides surface water to an extensive canal network of the Indus basin irrigation system (IBIS). When the IBIS supply is not enough, farmers pump up groundwater (Siyal et al., 2021). In response to insufficient gravity-fed water supplies and due to the low initial cost, privately owned, farmer-operated pumping systems were developed (Qureshi et al., 2003). Since 2002, the total number of irrigation pumps has almost doubled from 0.6 to over 1.1 million in 2013 (Bureau of statistics, planning and development department, the government of Pakistan, 2018). Between 1960 and 2015, the irrigated area under pumped water increased by 390% and the area irrigated by water from gravity-fed canals decreased by 38%, so the production of Pakistan's major crops depends on pumped water (Qureshi, 2020) requiring energy. Pumping energy is provided either in the form of electricity or diesel (Shah, 2009). Water pumping is the largest source of greenhouse gas (GHG) emissions in agriculture, accounting for almost 50–70% of total GHG emissions (Reddy, 2015).
Several studies have assessed energy consumption of agricultural water pumping in Pakistan (e.g., Qureshi et al., 2003; Siddiqi and Wescoat, 2013; Qureshi, 2014; Siyal et al., 2021). Most studies used a holistic approach. For example, Qureshi et al. (2003) showed that annually 545,000 diesel-operated tubewells use 950 million liters of diesel. A second study (Qureshi, 2014) estimated that in Pakistan annually 3.5 billion liters of diesel are utilized by one million tubewells.
Insight in the interrelationships between water and energy supply for food production is relevant to develop coping strategies. This research assesses total energy use and carbon dioxide emissions associated with water supply for the major crops in Pakistan, wheat, rice, cotton, and sugarcane, at a district level showing the most favorable areas from a water and energy perspective. The five research questions are: (i) How much water is supplied to the major crops in Pakistan? and (ii) what are related energy requirements (total m3 and TJ per crop per district and m3 and MJ per kg of crop per district)?; (iii) How much CO2 is emitted to supply water to the major crops in the irrigated areas of Pakistan (total kg CO2 per crop per district and g CO2 per m3 of crop per district?); (iv) Where are the hotspots with high water and energy consuming crops located?; and (v) What are the developments of irrigation energy use in time?
This research integrates current knowledge on water, energy, and CO2 emissions for the major crops of Pakistan at a district level using the information on yields, volumes of water applied, irrigated areas, energy consumption, and estimated emissions. The research first calculates the irrigation water quantities supplied (surface and groundwater) to the major crops (wheat, rice, cotton, and sugarcane) in 123 districts in four provinces in Pakistan. Next, it calculates the energy requirements and related GHG emissions to provide this water. The results identify that crop consumes more water and energy, as well as the spatial hotspots. Next, the study shows why some crops consume more water and energy in a particular area than others. Finally, it compares the water, energy, and GHG emissions on provincial and national level and shows temporal changes. In this way, it identifies crops and hotspot areas with relatively high water and energy use. This supports the design of measures to minimize water and energy consumption for agriculture in Pakistan. The study will identify important factors related to energy for water and related GHG emissions in agriculture that are also relevant for other countries and regions. An improved and holistic understanding might provide a tool to increase the production of food without increasing the use of energy and water. This is not only important for farmers but also for policy makers.
System analysis
Agriculture in Pakistan
Administratively, Pakistan includes four provinces, Punjab, Sindh, Khyber Pakhtunkhwa (KPK), and Balochistan, divided into 121 districts. Districts within the Indus basin irrigation system (IBIS) in Punjab and Sindh are the dominant agricultural districts where the major crops, wheat, rice, sugarcane, and cotton, grow. Figures 1A,B shows the cropping pattern areas of Pakistan in the Kharif (November–April) and Rabi (April–November) season. Apart from the spatial dimension of the major crops, there is also a temporal dimension. Wheat, rice, and cotton are annual crops, whereas sugarcane is a perennial crop. Rice and cotton production starts in May, the harvest is in November, while wheat grows from November to April (Rehman et al., 2015). The sugarcane harvest is in November.
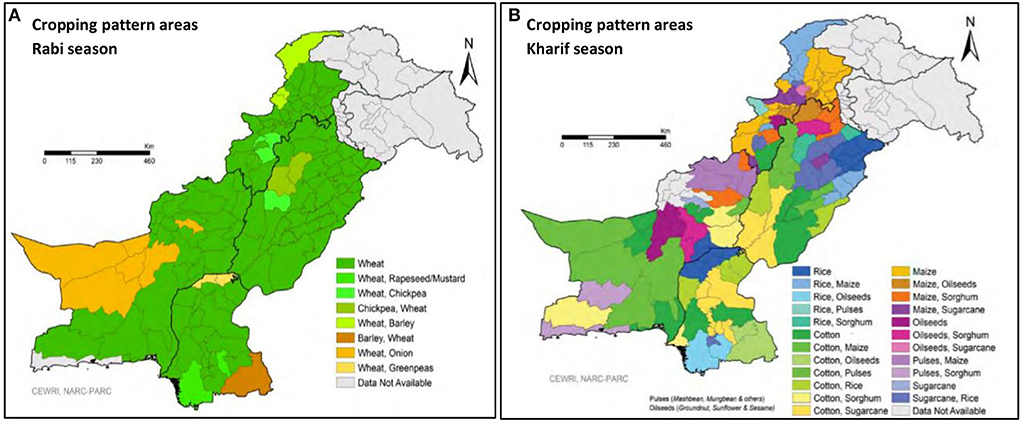
Figure 1. (A) The cropping pattern areas in the Rabi season (April till November), and (B) The cropping pattern areas of Pakistan in the Kharif season (November till April) [Source: Climate, Energy and Water Research Institute, National Agricultural Research Centre, Pakistan Agricultural Research Council, and the International Maize and Wheat Improvement Center, 2020].
Irrigation in Pakistan
Historically, agricultural production in the Indus Basin of Pakistan has relied on a vast gravity-fed canal network that spreads water from the Indus and its tributaries over large tracts of land. This IBIS system, established during British rule, was designed to protect against famine rather than to maximize productivity (Jurriens et al., 1996). The main irrigation water source, therefore, is river water combined with some groundwater. River water is diverted from three dams (Terbela, Mangla, and Chashma) and fresh groundwater is available along with the Indus River (Azad et al., 2003).
Groundwater used for irrigated agriculture in Pakistan also has a long history. In the past, groundwater abstraction made use of open wells with ropes and buckets, Persian wheels, karezes, reciprocating pumps, and hand pumps (Qureshi et al., 2003). Large-scale groundwater pumping started in the sixties of the 20th century with the launching of the “Salinity control and reclamation projects” when large-capacity tubewells were installed to supplement irrigation water. Later, in the 1970s and 1980s, farmers also installed private tubewells. Subsidized power supply and the introduction of locally manufactured diesel engines stimulated the increase in these private tubewells, especially in Punjab (Qureshi et al., 2003). In Sindh, groundwater is brackish, so that province only has relatively few tubewells (Qureshi, 2014).
In Pakistan, irrigation water is transported through earthen field channels and applied to unleveled fields resulting in huge conveyance and application losses (Ahmad et al., 2002), so water distribution efficiency is poor. Cropping areas are irrigated by (i) surface water using a gravity flow through canals and next lifting water to the crop fields; (ii) groundwater using tubewells (boreholes) and dug wells (open holes); and (iii) a mixture of surface and groundwater. There are also indigenous sources used for irrigation in Pakistan, however, at a very limited scale. For instance, in a kareze, groundwater is tapped by a tunnel, used in Balochistan. Also, tanks are used, e.g., in KPK. A tank is a small ditch storing water for later use. In Balochistan, springs occur where groundwater flows to the surface. Punjab uses all three irrigation systems, Sindh mainly surface water supply and some tubewells and wells. KPK uses canals, tubewells, wells and tanks and Balochistan canals, tubewells, wells, karezes, and springs. Irrigation on a district level is well-documented in official provincial reports in English (e.g., Bureau of statistics, planning and development department, Government of KPK, 2018; Bureau of statistics, planning and development department, government of Sindh, 2018; Bureau of statistics, planning and development department, government of the Balochistan, 2018; Bureau of statistics, planning and development department, government of the Punjab, 2018). These reports give data on total irrigated areas per district, including irrigation by canals, wells, tubewells, other sources, or conjunctively by canal wells and canal tubewells.
Energy for irrigation in Pakistan
Most surface water in Pakistan is supplied without pumping by the huge gravity-fed irrigation system, consisting of dams and canals. If irrigation is not gravity-fed, it requires energy to abstract or lift, conveys and in some cases, and pressurizes the water (Rothausen and Conway, 2011). The energy used for water abstraction or lifting also depends on the source, either surface or groundwater. Sometimes, available surface water needs pumping due to elevation differences between source and crop field, requiring energy. Groundwater always needs energy for uplifting, depending on the groundwater tables.
Energy to supply irrigation water is a major component of agricultural energy use in Pakistan (Qureshi, 2014) where energy is needed for diesel and electric pumps. There are around one million tubewells and lift pumps in the country, with 81% operated by diesel and the rest by electric pumps (Bureau of statistics, planning and development department, Government of KPK, 2018; Bureau of statistics, planning and development department, government of Sindh, 2018; Bureau of statistics, planning and development department, government of the Balochistan, 2018; Bureau of statistics, planning and development department, government of the Punjab, 2018). Depending on groundwater depths, farmers either use diesel or electric pumps (Qureshi, 2014). Theoretically, the energy used for pumping 1,000 m3 of water from 1 m depth at 100% efficiency is 9.8 MJ (Karimi et al., 2012). However, in practice, energy losses occur. For groundwater extraction, the dynamic head and pumping system efficiency are crucial parameters that influence energy requirements of pumping. For relatively high groundwater tables with a dynamic head of around 6–15 m, normally diesel pumps are used. If groundwater tables are lower, with a dynamic head around 40–80 m, farmers apply electric pumps (Qureshi, 2014). Diesel pumps are more energy efficient than electric pumps if the whole production chain of electricity, the so-called energy required for energy (ERE), is included. For electricity in Pakistan, the ERE is around 2.05 (Siyal et al., 2021). Energy use, and especially fossil energy use, gives rise to carbon dioxide emissions when fossil fuels are burnt, e.g., oil, natural gas, coal for electricity generation, or diesel to fuel machines (IPCC, 1996). Every country has its own fossil fuel mix to generate electricity, depending on the fuels applied (Yousuf et al., 2014). The carbon footprint (CF) of irrigation is 9% of total CF of Pakistan (Siyal et al., 2021). Although the contribution of water supply to total energy use and CF are relatively small, they could increase if more groundwater is used in the future.
Method and data
The assessment of energy (EFs) and carbon footprints (CFs) related to the water supply of the four major crops in Pakistan includes two clusters of steps. The first cluster, steps 1–5, assessed the water quantity supplied per the mode of supply per crop on a district level. The second cluster of steps, 6–9, first calculated the related energy for pumping water and next, combined energy consumption with CO2 emission data. Figure 2 shows the calculation steps and the input data.
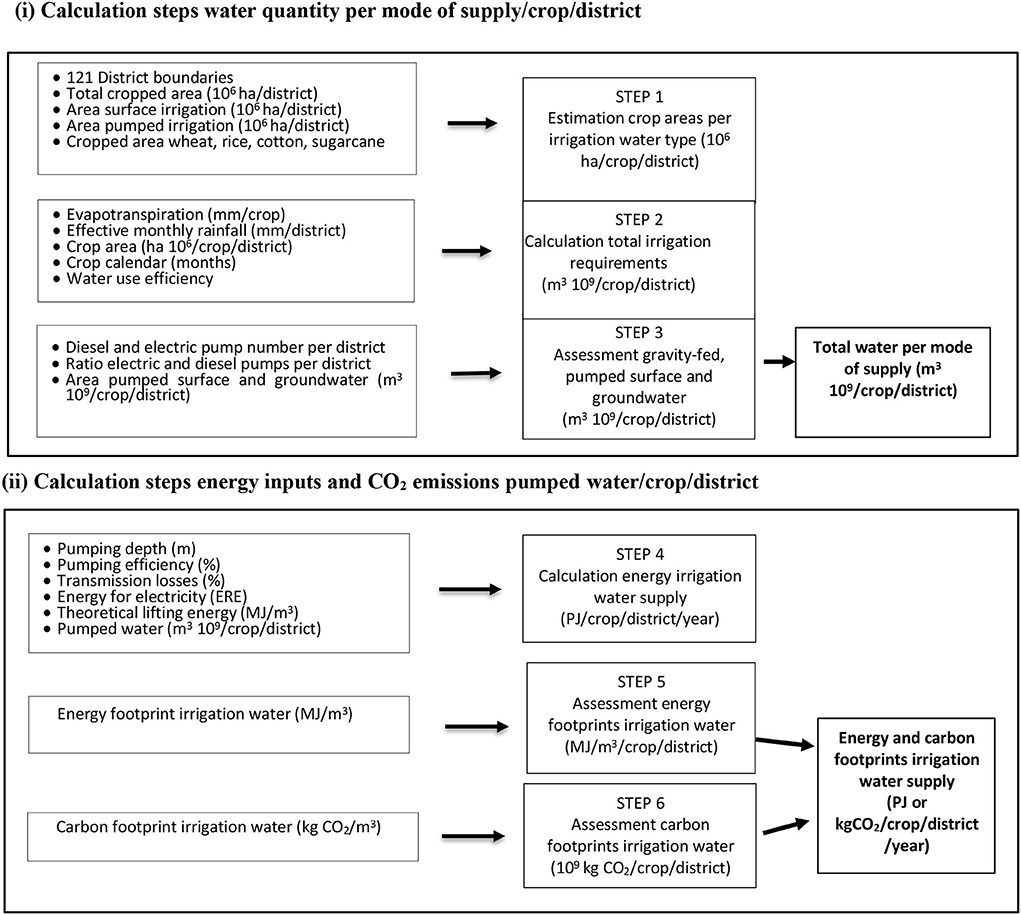
Figure 2. Calculation steps in two clusters for the energy and carbon footprints of irrigation water supply. (i) water by mode of supply/crop/district and (ii) energy for pumping water/crop/district and related CO2 emissions in Pakistan.
(i) Calculation steps water quantity per the mode of supply per crop per district
Step 1. Estimation of crop areas per irrigation water type per district
Step 1 estimates the irrigated area per crop a (wheat, rice, sugarcane, and cotton) per irrigation water type x (surface water from canals, pumped groundwater, and a mixture of both) per district d, Aa,x,d (106 ha), assuming that surface and groundwater are evenly distributed over the crops as:
where Ax,d is the area irrigated by water type x in district d, At,d is the total irrigated area in district d, and Aa,d is the total irrigated area of crop a in district d (106 ha). Data on irrigated areas by surface water from canals, pumped groundwater, and a mixture of both were taken from provincial reports i.e., Bureau of statistics, planning and development department, government of the Punjab (2018), Bureau of statistics, planning and development department, government of Sindh (2018), Bureau of statistics, planning and development department, Government of KPK (2018); Bureau of statistics, planning and development department, government of the Balochistan (2018). For Punjab, we assumed a ratio of 2:5 for surface and groundwater supply in irrigated agriculture based on information from Murray-Rust and Van der Velde (1994). Appendices 1, 2 in the supporting information (SI) give the size of the irrigated areas per water type and per crop per district for the four provinces in Pakistan.
Step 2. Calculation of total irrigation water requirements
Step 2 assesses the total irrigation water requirements per crop a for water type x per district d as the total water volume needed to irrigate a crop to fully satisfy its requirement, including losses in water conveyance and application, TIRa,x,d (109 m3), as:
where ETca,d is the evapotranspiration of crop a in district d (mm), ERa,d is the effective rainfall of crop a in district d (mm), ηi is overall irrigation efficiency, and factor 100 is applied to convert mm*106 hectares to 109 m3. Data on average evapotranspiration per crop per district for Punjab and Sindh were derived from Ullah et al. (2001), and the district boundary of the Punjab districts for ETc was adapted from Tahir and Habib (2001). For KPK and Balochistan, data on evapotranspiration were taken from GOP (1997) assuming that evapotranspiration per district is the same. The study derived data on monthly average rainfall from 90 weather stations from the Pakistan Meteorological Department (2022). To calculate the average monthly rainfall per district, the study used the inverse distance weighted (IDW) interpolation method (Shepard, 1964). For the assessment of effective rainfall, we used the USDA soil conservation services (SCS) method from Martin and Gilley (1993). We distributed effective rainfall per crop per district according to the crop calendar of Pakistan (Pakistan Meteorological Department, 2022). Data on field channel efficiency of 90% were taken from Hussain et al. (2011), and on-field efficiency of 70% for the non-rice and 75% for the rice-based systems was taken from Habib (2004).
Step 3. Assessment gravity-fed surface irrigation and pumped surface and groundwater
Step 3 calculates the gravity-fed surface water irrigation and pumped surface and groundwater volumes per crop per district (109 m3). Sometimes surface water is available but cannot be supplied by the gravity-fed system due to elevation differences between source and field, requiring pumping. The water volumes from type k pumps for crop c in district d, Vk,c,d (109 m3), were calculated as:
where Vc,dis the volume of gravity-fed irrigation water for crop c in district d, Pd is the total number of pumps in district d, and Pk,d is the number of pumps for water type k for district d. Data on pump numbers and types were taken from provincial reports that give the district-wise total number of lift pumps as well as numbers of diesel and electric groundwater pumps (Bureau of statistics, planning and development department, Government of KPK, 2018; Bureau of statistics, planning and development department, government of Sindh, 2018; Bureau of statistics, planning and development department, government of the Balochistan, 2018; Bureau of statistics, planning and development department, government of the Punjab, 2018). Appendix 2 in the supporting information (SI) gives the data on pump numbers and types per district for the four provinces in Pakistan.
(ii) Calculation steps energy inputs and CO2 emissions pumped water per crop per district
As rainwater is supplied without the use of any energy, energy consumption for rain is zero. Also, there is no direct energy for the supply of gravity-fed surface water, but only some energy is needed for the maintenance of the canal networks (Siyal et al., 2021). However, a portion of surface water and all groundwater is pumped and supplied to crops requiring energy. In Pakistan, there are two energy types applied for water pumping, diesel, and electricity.
Step 4. Calculation of energy irrigation water supply
Step 4 calculates the annual energy required for irrigation water supply per crop per district distinguishing between surface and groundwater pumping. For surface water and shallow groundwater, mostly diesel pumps are used, and for deep groundwater, electric pumps are used (Qureshi, 2014). Adopting the equation from Karimi et al. (2012) and including the energy required for energy, (ERE), the value for electricity in Pakistan, the energy consumption of type k water pump for crop c in district d, Ek,c,d (PJ), was calculated as:
where 9.8 is the energy required to lift 1,000 m3 water from 1 m depth at 100% efficiency (MJ) (Nelson and Robertson, 2008), D is the water depth (m), OPE is the pumping efficiency (%), T1 is the transmission, and distribution loss for electricity (%). We assumed that T1 and ERE values for diesel are zero. Pumping depths show variation. Diesel pumps are generally installed in areas where water tables are between 10 and 15 meters (Qureshi, 2014). For lift pumps from surface water, we assumed a depth of 10 m, and for pumping, groundwater by diesel pumps 15 m. Data on the efficiency of diesel pumps of 7% were taken from ENERCON (1989). For electric pumps in Punjab, we used the groundwater depths for the year 2016–17 from the Punjab irrigation department (2022). Due to the unavailability of groundwater depth data for the other three provinces, we used the average depth of 60 m for electric pumps (Qureshi, 2014). The ERE value of 2.05 for electricity generation in Pakistan was taken from Siyal et al. (2021). The pumping system efficiency of electric pumps of 40% was taken from Baksh et al. (2000). Transmission and distribution losses of 25% were taken from the Water Power Development Authority (WAPDA) (2009).
Step 5. Calculation of energy footprint to supply water per crop per district
Step 5 assesses the energy footprint (EF) to supply irrigation water per crop per district (MJ/m3) in 2016–17. The study divided total energy consumption for irrigation (PJ/year) by the total irrigation water volume (109 m3/year). The EFs of water for crop c in district d, Ec,d (MJ/m3), were calculated as:
We expressed the EFs per unit of the crop by dividing the EFs of water for crop c in district d by the crop yields per district. Data on crop yields were taken from statistical reports (Bureau of statistics, planning and development department, Government of KPK, 2018; Bureau of statistics, planning and development department, government of Sindh, 2018; Bureau of statistics, planning and development department, government of the Balochistan, 2018; Bureau of statistics, planning and development department, government of the Punjab, 2018). Appendix 2 in the supporting information (SI) gives yield data per crop per district for the four provinces in Pakistan.
Step 6. Assessment of carbon footprints in irrigation water
Step 6 assesses the carbon footprints, Cc,d (kg CO2/m3), to supply irrigation water to crop c in district d by combining EFs for pumping type k with specific carbon dioxide emissions as:
where CFk is the specific carbon dioxide emission for the fuel applied in pump k. Data on electricity emissions in Pakistan of 0.707 tons per MWh (0.196 kg/MJ) were taken from Yousuf et al. (2014) and emissions for diesel of 74.1 tons per TJ (0.074 kg/MJ) from the IPCC (1996). The study also gives total EFs and CFs per province by summing the results per district.
Results
Figures 3A,B shows the irrigation volumes for the four major crops (wheat, rice, sugarcane, and cotton) in the gravity-fed and pumped irrigated areas in Pakistan for the year 2016–17. Figure 3A shows the irrigated areas and water volumes on a national level, and Figure 3B shows the water volumes on a provincial level.
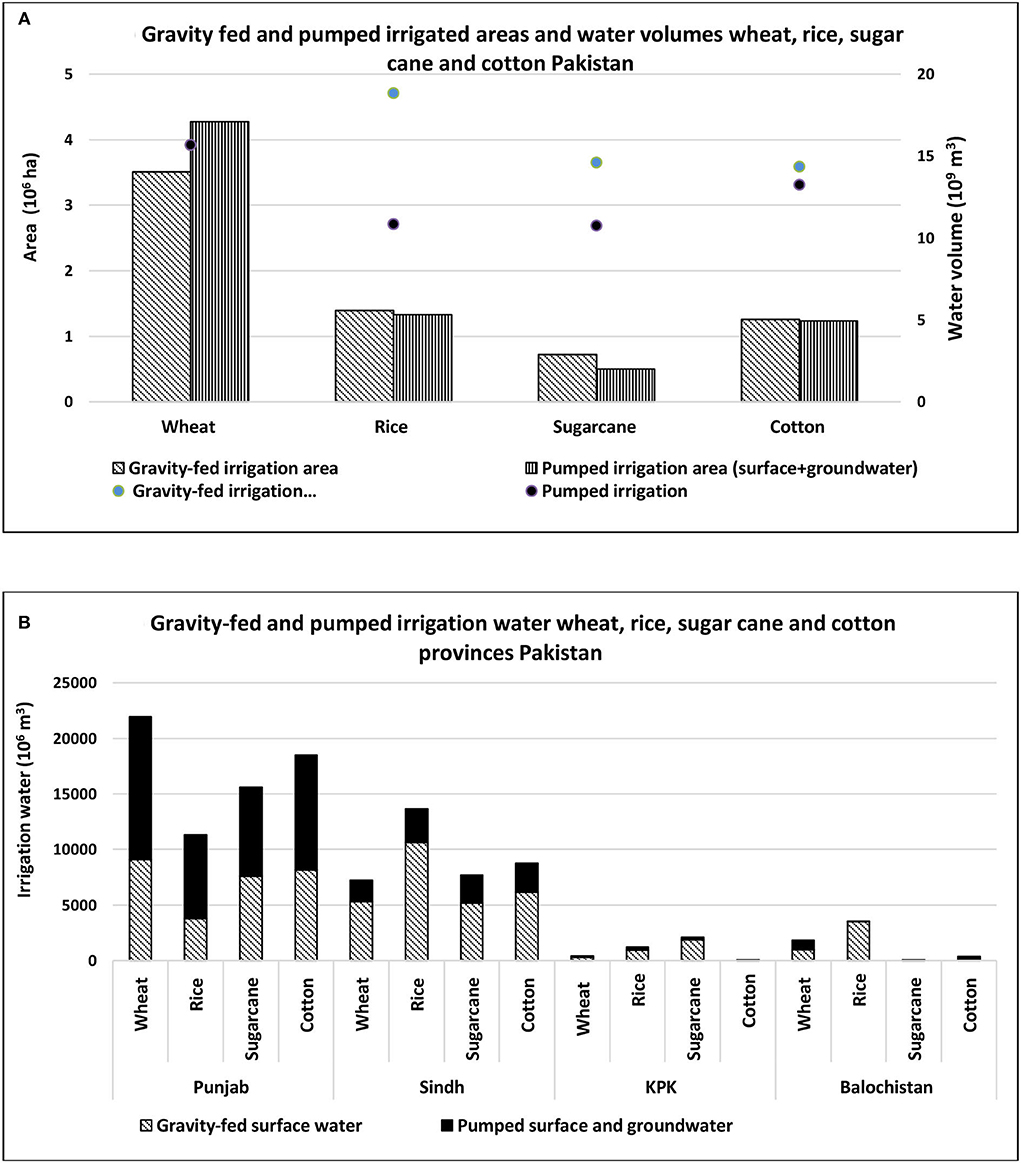
Figure 3. (A,B) Irrigation areas and water volumes for the four major crops (wheat, rice, sugarcane, and cotton) in the gravity-fed and pumped irrigated areas for the year 2016–17. (A) The areas and water volumes on a national level, and (B) on a provincial level.
The irrigated area for wheat, rice, sugarcane, and cotton in Pakistan is 14 106 ha or 76% of the total irrigated area. Figure 3A shows that more than half of the irrigated area (56%) is supplied by gravity-fed irrigation and almost half (44%) receives pumped surface or groundwater. Total irrigation water is supplied to wheat (27%), rice (26%), cotton (24%), and sugarcane (22%). Figure 3B shows that Punjab and Sindh, the largest crop producers in Pakistan, dominate irrigation water use. Almost 90% of gravity-fed irrigation water is used in Punjab and Sindh, using similar volumes, and 96% of the pumped water. However, pumped water use is dominated by Punjab (76% of the total), while Sindh uses only 20%, mainly due to its poor groundwater quality. In Punjab, wheat and cotton receive most of the water; and in Sindh, rice and cotton receive most of the water. Appendix Table 13 of Appendix 4 in the supporting information (SI) gives the provincial crop areas and irrigation by mode of supply for the major crops in 2016–17.
Figures 4A,B shows the EFs for irrigation water supply for wheat, rice, sugarcane, and cotton at the national and provincial levels in 2016–17.
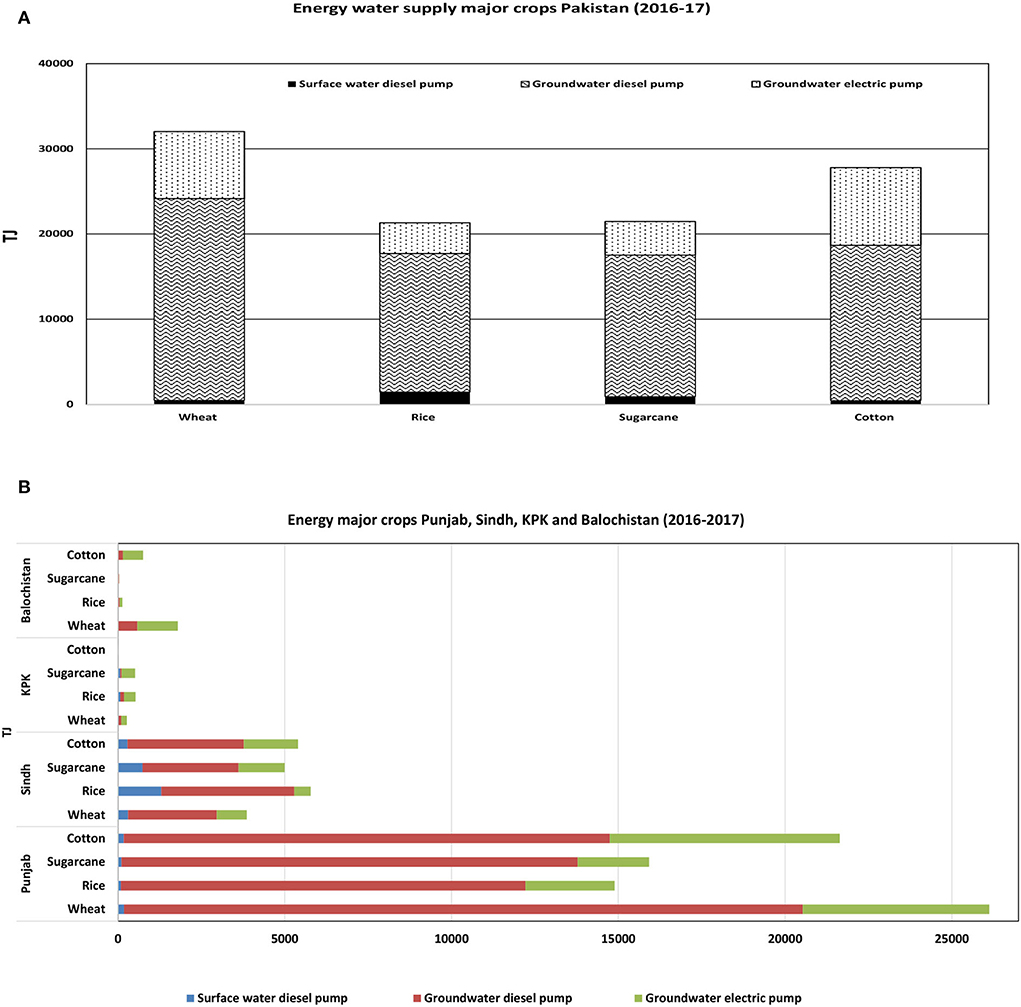
Figure 4. (A) Energy footprint irrigation of major crops (wheat, rice, sugarcane, and cotton) in Pakistan (2016–2017). (B) Energy footprint irrigation of major crops (wheat, rice, sugarcane, and cotton) in Punjab, Sindh, KPK, and Balochistan in 2016–17.
Figure 4A shows that irrigation supply of the four major crops in Pakistan requires 103 PJ of energy, mostly for diesel pumps that pump shallow groundwater (73%), followed by electric pumps that pump deep groundwater. Energy for surface water pumping is negligible. Wheat needs 31% of total irrigation energy followed by cotton (27%), sugarcane, and rice (21% each). Figure 3B shows that Punjab contributes most to irrigation EFs, especially due to diesel pumps, followed by Sindh. EFs in KPK and Balochistan are relatively small. In Punjab, wheat and cotton are the most energy-intensive crops, especially due to the energy for diesel pumps. In Sindh, rice and cotton require the most energy for ground and surface water pumping. Appendix Table 14 of Appendix 4 in the SI gives EFs for irrigation per crop per province, and EFs and CFs per water type in 2016–17.
Figures 5A–D shows the pumped irrigation volumes, EFs of irrigation supply, and EFs and CFs for the major crops per district in Pakistan for 2016–2017. Figure 5A shows the annual pumped surface and groundwater irrigation volumes, Figure 5B shows total energy consumption (diesel and electric) for irrigation supply of the major crops per district, Figure 5C shows EFs per unit of irrigation supply per district, and Figure 5D shows the CFs per unit of irrigation supply per district.
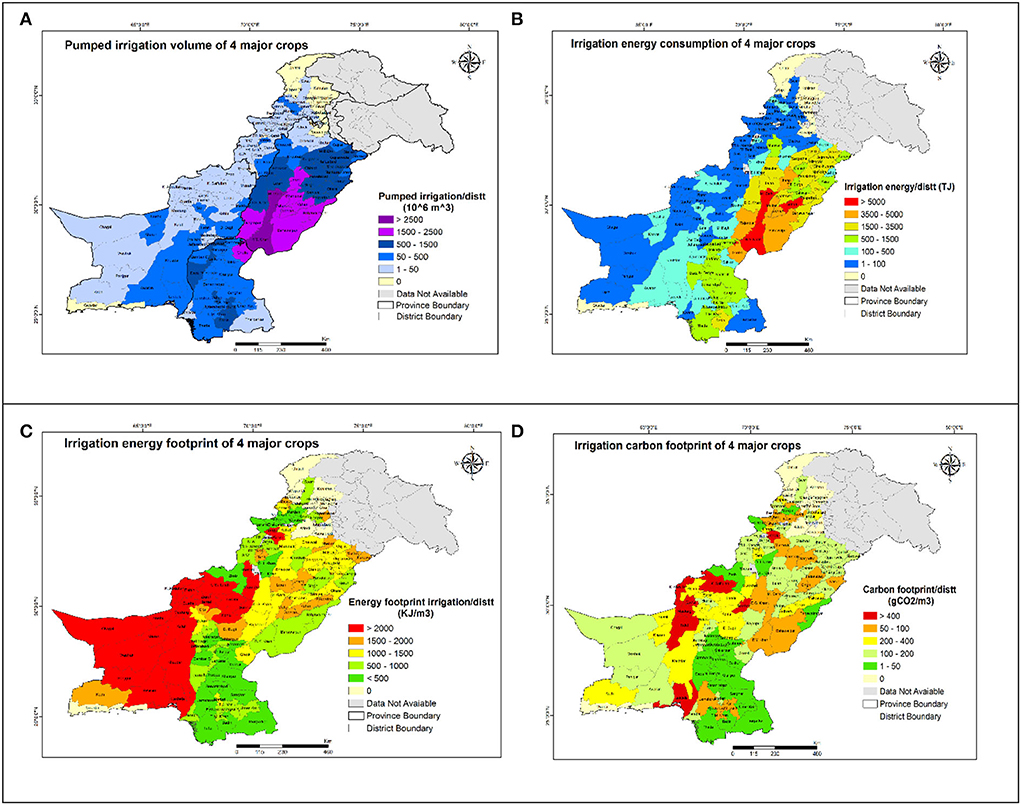
Figure 5. (A–D) Pumped irrigation volumes, energy for irrigation supply, and energy and carbon footprints for the major crops (wheat, rice, sugarcane, and cotton) per district in Pakistan for the period 2016–2017. (A) Shows the annual pumped surface and groundwater irrigation volume, (B) shows the total energy consumption (diesel and electric) for irrigation supply of the major crops per district, (C) shows the energy footprints per unit of irrigation supply per district, and (D) shows the carbon footprints per unit of irrigation supply per district.
Figure 5A shows that pumped irrigation supply in the southern and central districts of Punjab is the largest, followed by the northern districts of Punjab and Sindh. These districts use 1,500–2,500 106 m3 of pumped irrigation water for the major crops. In Rahimyar Khan, however, even more, water is used, 3000 106 m3. Appendix Figures 1A–D of Appendix 5 in the SI give the pumped irrigation volumes per crop per district for the four provinces in Pakistan.
Figure 5B shows that there are large differences in energy consumption for pumped irrigation among districts. High energy use is related to high pumped water use and ranges between 3,500 and 5,000 TJ. However, some districts use even more than 5000 TJ. Appendix Figures 2A–D of Appendix 5 in the SI give the irrigation energy per crop per district.
In general, the major drivers that determine EFs of irrigation water in Pakistan show spatial and temporal differences (depending on the growing season) and are determined by the crop types and water requirements, the fractions of gravity-fed and pumped water, groundwater tables, and energy sources for pumping that determine pumping efficiencies. Figure 5C shows that there are large differences among EFs per unit of irrigation water. The districts with zero energy for irrigation water do not irrigate. EFs for districts that do use irrigation range between 7 (two districts in Balochistan) and 2,260 KJ/m3 (also in Balochistan) depending on the water type applied, i.e., surface or groundwater, groundwater depth, and the energy source for pumping (electric or diesel). For instance, the highest EFs of more than 2,000 KJ/m3 are in Balochistan where groundwater is usually pumped from more than 60 meters by electric pumps. Figure 5D shows that for CFs, also the energy type, diesel or electric, is relevant in combination with different pumping depths. The lowest CFs occur in Sindh which has a relatively small pumped water use. Appendix Figure 3 of Appendix 5 in the SI gives the total CFs (106 kg CO2) of the major crops per district for the four provinces in Pakistan.
Figures 6A–D shows the irrigation EF per unit of yield (MJ/kg) of wheat, rice, sugarcane, and cotton per district in Pakistan in 2016–17. Figure 6A shows the irrigation EF for wheat, Figure 6B shows for rice, Figure 6C shows for sugarcane, and Figure 6D shows for cotton.
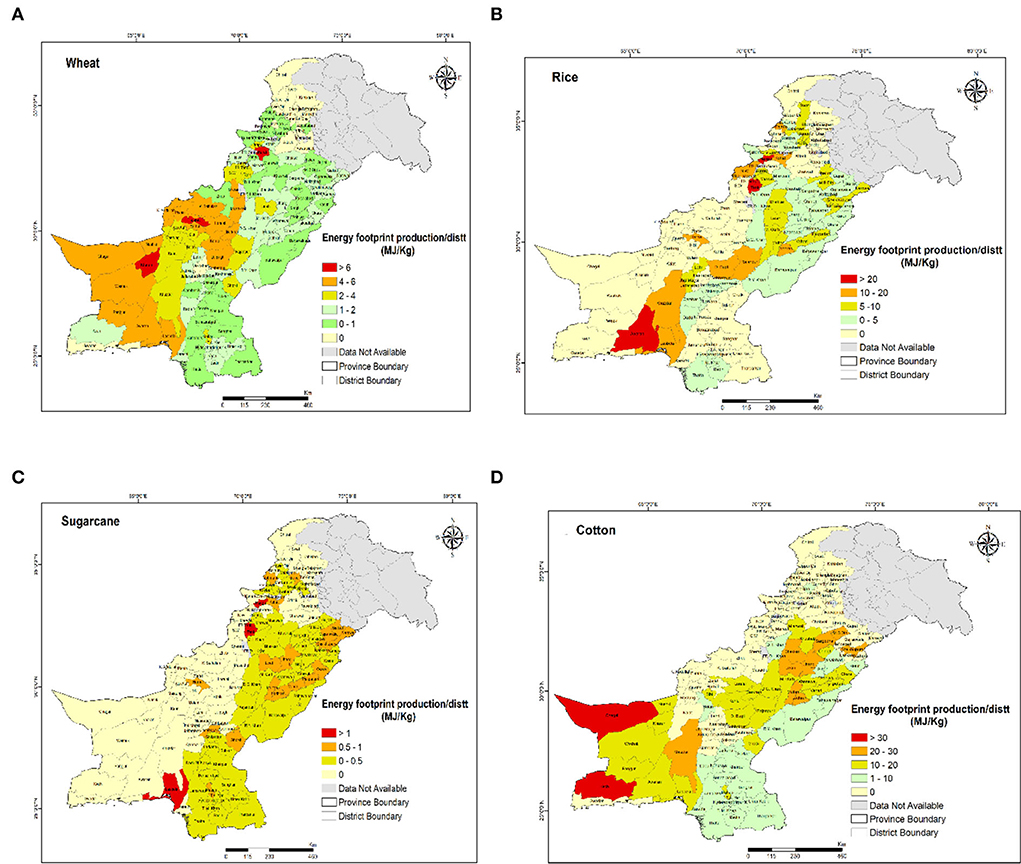
Figure 6. (A–D) Irrigation energy footprint per unit yield (MJ/kg) of wheat, rice, sugarcane, and cotton per district in Pakistan in 2016–17. (A) Shows the irrigation energy footprint for wheat, (B) for rice, (C) for sugarcane, and (D) for cotton.
The EF of wheat ranges between 0 and 6 MJ/kg. The main wheat-producing districts have EFs between 1 and 2 MJ/kg. Hotspots with relatively large footprints occur in Balochistan and KPK. For the main rice-producing districts, EFs range between 0 and 5 MJ/kg. Hotspots with EFs above 20 MJ/kg also occur in Balochistan and KPK. The main sugarcane-producing districts have EFs between 0.5 and 1 MJ/kg. Hotspots with footprints above 1 MJ/kg again occur in Balochistan and KPK. The cash crop cotton has the highest EF per unit of crop. Sindh and the east of Punjab have EFs for cotton between 1 and 10 MJ/kg. The rest of Punjab shows footprints between 10 and 30 MJ/kg, far larger than the EFs of wheat, rice, or sugarcane. Again, hotspots occur in Balochistan and KPK.
Figure 7 shows the ten hotspot districts with high total annual irrigation EFs for wheat, rice, sugarcane, and cotton and the development of irrigation EFs between 2002–03 and 2016–17.
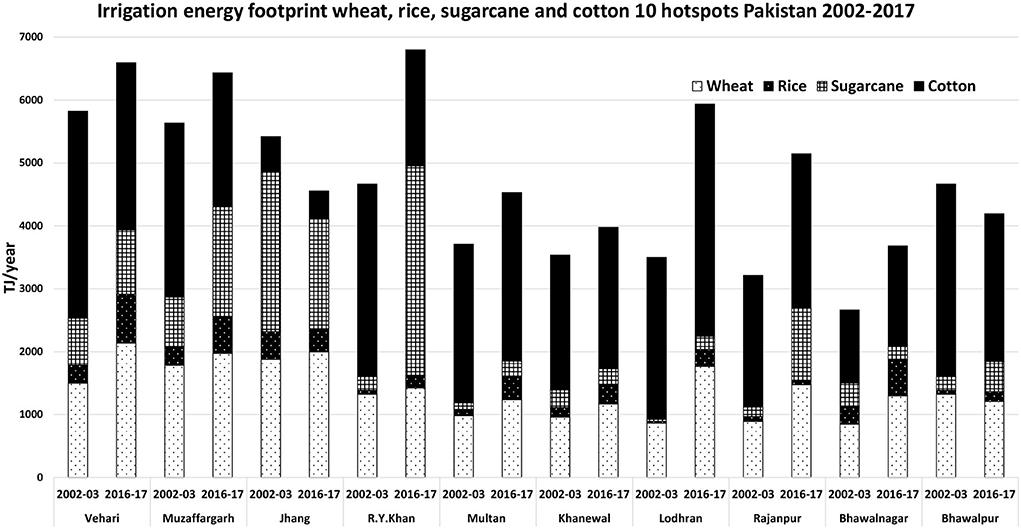
Figure 7. Ten hotspot districts with high total irrigation energy footprints for wheat, rice, sugarcane, and cotton and the development of irrigation energy footprints between 2002–03 and 2016–17.
Figure 7 shows that the ten hotspot districts consumed 43,000 TJ in 2002–03 and 52,000 in 2016–17, an increase of 21%. The ten hotspots use about 42% of total energy of Pakistan for irrigation for the four major crops. All hotspots, except Jhang and Bhawalpur, show an increase in irrigation energy. All hotspots are located in the southern part of Punjab. Irrigation energy varied from 2,700 TJ in Bahawalnagar in 2002–03 to 6,800 TJ in R.Y.Khan in 2016–17. Almost all crops have increased EFs for irrigation. Especially, irrigation energy for sugarcane in R.Y.Khan increased fifteenfold. Appendix Tables 9–12 of Appendix 3 in the SI give district-wise crop areas by mode of water supply, gross irrigation requirements, the EFs of pumping water, and EFs and CFs of the major crops (wheat, rice, sugarcane, and cotton) in Pakistan in 2016–17.
Discussion
This study presents the first detailed estimate of irrigation EFs and CFs for the major crops within administrative boundaries (districts) of Pakistan. Earlier studies focused on energy for groundwater pumping covering total irrigated agriculture in the Indus basin in Pakistan (Qureshi, 2014), in Punjab (Siddiqi and Wescoat, 2013), and in Sindh (Siyal et al., 2021). Our approach identified the main hotspots and crops with relatively large EFs and CFs and the factors causing these large footprints.
Uncertainties and assumptions
The assessment of irrigation EFs for the major crops per district in Pakistan required the integration of data from several sources. Although we encountered uncertainties and had to make many assumptions that may influence results, we identified the most important hotspots per crop on a district level. Our access to detailed information from governmental organizations in Pakistan made it possible to calculate the irrigation EFs for the major crops. One of the study aims was to identify hotspots at a district level, including 121 districts. Sometimes district-wise data on groundwater depths, fuel for pumping, or operational pumping system numbers were lacking making assumptions necessary. The most important uncertainty involved the use of surface and groundwater volumes in districts, where surface and groundwater are used conjunctively. The supply of a surface and groundwater mixture depends on temporal and spatial conditions influenced by factors regarding water availability and suitability, climate, cropping patterns, groundwater quality, and farmers' choices. There is no literature available making it possible to separate and quantify the supply of surface or groundwater from a conjunctive source at the district level. Because conjunctive irrigation water supply is a major fraction of irrigation, we assumed a ratio of 2:5 of surface and groundwater supply based on information from Murray-Rust and Van der Velde (1994). This ratio may influence results at the district level, but at the provincial and national levels, our results are in line with existing literature.
Comparison with other studies
The assessment of EFs of irrigation water was an important aspect of this research. Our approach deviated from earlier studies. Those studies quantified energy use for irrigation from the perspective of pumping energy, multiplying the number of pumps by the energy use per pump and applying a utilization factor, defined as the number of hours a pump operates divided by the annual number of hours (Qureshi et al., 2003). We started from the perspective of water, assessing the total volumes of surface and groundwater provided per pump type and next assessed the energy use. The use of this utilization factor causes uncertainty, because it shows huge ranges. Qureshi et al. (2003), for example, have shown the importance of utilization factors and proposed ranges based on pumping type, energy use, and agroclimatic zones. For the estimation of energy consumption, usually, average utilization factors for electric and diesel pumps are taken to quantify total energy for irrigation. Qureshi (2014) used an average utilization factor of 15% for the estimation of irrigation energy consumption at the country level. Siddiqi and Wescoat (2013) used a value between 6 and 10% for Punjab, while Siyal et al. (2021) used 6% for diesel and 11% for electric pumps in Sindh. Qureshi et al. (2003) estimated that annually 950 106 L of diesel are consumed by 545,000 diesel-operated tubewells, assuming a utilization factor of 8%. A second study (Qureshi, 2014) estimated that annually almost 3.5 109 L of diesel are used by one million tubewells, assuming a utilization factor of 15%. This shows that the utilization factor increases with an increasing number of tubewells. For the general and quick impression of EFs, groundwater pumping in agriculture that approach may work but making an assessment from the water part of the equation gives more detailed crop and location-specific estimations of energy use providing the hotspot locations.
Our results indicated that in Pakistan in 2016–2017 51 109 m3 of pumped water, including surface and groundwater, was required to irrigate the major crops (wheat, rice, sugarcane, and cotton) with an EF of 103 PJ. Around one million pumps, 0.8 106 diesel and 0.2 106 electric pumps extracted 39 and 13 109 m3 of irrigation water and consumed 78 PJ diesel and 25 PJ electric energy. These values are in line with values from the literature. Qureshi (2014) estimated 170 PJ irrigation energy (148 PJ diesel and 22 PJ electric) to pump water for irrigated agriculture in Pakistan in 2010. That study, however, excluded the ERE value of 2.05 for electricity in Pakistan but included all crops. Our results for Punjab of 29 109 m3 pumped by diesel and 9 109 m3 by electric pumps requiring 61 PJ diesel and 17 PJ electric energy are in line with results from Siddiqi and Wescoat (2013), who estimated 80 PJ of energy to pump water for irrigation in Punjab in 2009–10, including 63 PJ diesel-based energy and 16 PJ electric energy.
The total CF of pumped irrigation water for the four major crops is 11 109 kg CO2 per year. This footprint is three times larger than the value estimated by Qureshi (2014) of 3.8 109 kg per year equal to 1.2% of Pakistan's total annual CO2 emissions of 183 109 kg [International Energy Agency (IEA), 2020]. However, the value is smaller than estimated by Siyal et al. (2021) of 16 109 kg per year or 9% of total CO2 emissions. There are three reasons this study finds smaller CFs for irrigation compared to Siyal et al. (2021). First, Siyal et al. (2021) included all irrigated agricultural areas in Pakistan and not only the areas of the major crops. Second, that study made a rough estimate based on utilization factors of 11% for electric and 6% for diesel pumps. This study used a more detailed approach and identified the fractions of irrigated areas per pump type per district using information from official organizations (e.g., Bureau of statistics, planning and development department, government of Sindh, 2018). Third, that study took an average value of energy per unit of pumped water and multiplied by the total pumped water volume, while this study made a more detailed analysis quantifying energy per unit of pumped water per crop at the district level and next multiplied by the total irrigation volume.
Hotspot districts
This study identified ten hotspot districts contributing 42% to total EF of Pakistan for irrigation for the four major crops. These hotspots are located in the southern part of Punjab with a dominant wheat–cotton–sugarcane cropping pattern. Our findings are in line with Qureshi et al. (2003) who also identified southern Punjab as an important groundwater pumping region caused by low rainfall, high cropping intensity, diversified cropping patterns, high utilization factors, and relatively large areas irrigated by only one tubewell. Previous energy analyses mainly focused on the quantification of energy for groundwater pumping and related CO2 emissions showing the magnitude of the energy–water nexus in the irrigated areas of Pakistan. Suggestions to decrease EFs of irrigation were usually focused on water management and conservation to avoid energy use (e.g., Jackson et al., 2010; Qureshi, 2014; Cremades et al., 2016). This study provides a more detailed analysis for the major crops showing not only spatial differences among districts but also hidden temporal differences depending on cropping patterns. For example, a large density of pumps is not only necessarily an indication of a high EF but also the temporal aspect is an important driver dictating low or high EFs per crop per district. This study contributes to find hidden interrelationships in the water–energy nexus on a district, provincial, and national levels to better understand not only water but also energy perspective coping strategies for better resource use and conservation to achieve more sustainable agriculture.
Policy implications
There are three potential approaches to reduce irrigation EFs in agriculture relevant for policy: (i) the water perspective approach; (ii) the traditional energy perspective approach; and (iii) the renewable energy approach. The water perspective approach focuses on improved water use efficiencies so that less water is lost requiring less energy for conveyance. In the Indus basin in Pakistan, the delivery efficiency is only 36%, mainly because much of the surface water is lost in a conveyance from the canals to the crop fields (Qureshi, 2020). Siyal et al. (2021) showed that a shift from groundwater use to properly maintained, gravity-fed canal systems decreases irrigation energy use and CO2 emissions by 31–82% and increases surface water availability by 3–10%. A traditional energy perspective approach improves energy efficiency by increasing pumping efficiency through the introduction of high-quality electric pumps (Qureshi, 2014). However, this traditional approach can be further improved by adopting renewable energy sources such as solar, wind, or biogas pumps. Recently, in Pakistan, a lot of research, e.g., pilot-scale and feasibility studies, in combination with subsidies have been initiated at provincial and national levels, exploring and recommending renewable energy potentials (e.g., Siyal et al., 2015; Ali Shah and Akbar, 2021). Though these efforts are translated at a slow pace at the farm level, prospects of renewable energy applications in irrigated agriculture need to be adopted with a clear vision and short-, medium-, and long-term targets. Especially, solar-powered irrigation presents an opportunity not only to introduce clean electricity, climate smart, and relatively affordable technology but also to think strategically about how this technology can be used to regulate groundwater use and to provide additional electricity in rural areas so that small-scale farmers benefit when electricity is not needed for irrigation. This application, however, is context-specific (Hartung and Pluschke, 2018).
Conclusions
Important factors in the water–energy–food nexus that determine EFs and CFs for irrigation water in Pakistan show spatial and temporal differences (depending on the growing season) and include: crop types, crop water requirements, fractions of gravity-fed and pumped water, groundwater tables, and energy sources for pumping (diesel, electric, or solar). In Pakistan, the annual irrigation supply of the four major crops, wheat, rice, sugarcane, and cotton, shows an EF of 103 PJ generating a CF of 11 109 kg CO2, or 6% of the national CF. Most energy is used by diesel pumps that pump shallow groundwater (73%), followed by electric pumps that pump deep groundwater. Energy for surface water pumping is negligible. Wheat needs 31% of total irrigation energy, followed by cotton (27%), sugarcane, and rice (21% each). CFs are also dominated by wheat (32%) and cotton (31%), followed by rice and sugarcane (19% of the total each).
Our results indicate the hotspots where efforts can be taken to decrease water consumption, EFs, and CFs. This study identified ten hotspot districts for the major crops where 42% of irrigation energy of Pakistan is consumed. Two provinces dominate EFs and CFs for irrigation water, Punjab and Sindh. In Punjab, wheat and cotton are the dominant crops. In Sindh, rice, cotton, and sugarcane, but EFs are far smaller than in Punjab, because mainly surface water is applied. The other two provinces have only small footprints for irrigation water. High EFs are related to high pumped water use and range between 3,500 and 5,000 TJ per district. However, some districts, especially in Punjab, the dominant agricultural province, use even more than 5,000 TJ. The research also showed a substantial increase of the EF in the ten hotspot areas where in fourteen years the EF increased by 21%. This gives an indication of the upward trends in water consumption as well as in EFs and CFs.
There are large differences among EFs per unit of irrigation water, ranging between 7 and 2,260 KJ/m3 depending on the water type applied, i.e., surface or groundwater, groundwater depth, and the energy source for pumping (electric or diesel). As a result, CFs also differ, ranging between 1 and 444 g CO2/m3.
The identification of hotspots may contribute to measures to minimize water and energy consumption for agriculture in Pakistan. Other countries that also rely on irrigation could apply the method applied here to identify hotspots and optimize water consumption, EFs and CFs. Not only farmers but also policy makers in South Asia might profit from a tool to better understand how to increase food production without increasing the use of energy and water.
Data availability statement
The datasets presented in this study can be found in online repositories. The names of the repository/repositories and accession number(s) can be found in the article/Supplementary material.
Author contributions
Conceptualization, data collection and analysis, and writing original draft preparation: AS. Editing, visualization, and contribution to study design: PG-L. All authors contributed to the article and approved the submitted version.
Acknowledgments
We thank Rozina Naz, Principal Scientific Officer from the Pakistan Agricultural Research Council (PARC), Islamabad, Pakistan for her support in creating the GIS maps.
Conflict of interest
The authors declare that the research was conducted in the absence of any commercial or financial relationships that could be construed as a potential conflict of interest.
Publisher's note
All claims expressed in this article are solely those of the authors and do not necessarily represent those of their affiliated organizations, or those of the publisher, the editors and the reviewers. Any product that may be evaluated in this article, or claim that may be made by its manufacturer, is not guaranteed or endorsed by the publisher.
Supplementary material
The Supplementary Material for this article can be found online at: https://www.frontiersin.org/articles/10.3389/frwa.2022.941722/full#supplementary-material
Abbreviations
CF, Carbon footprint; EF, Energy footprint; ER, Effective rainfall; ERE, Energy required for energy; Etc, Potential evapotranspiration; GHG, Greenhouse gasses; GOP, Government of Pakistan; ha, Hectare; IBIS, Indus basin irrigation system; KJ, Kilojoule; KPK, Khyber-Pakhtunkhwa; MJ, Megajoule; SI, Supporting information; TIR, Total irrigation requirement; TJ, Terajoule; PJ, Petajoule; PMD, Pakistan meteorological department; WF, Water footprint; BSPDDGP, Bureau of statistics, planning and development department, government of Punjab; BSPDDGS, Bureau of statistics, planning and development department, government of Sindh; BSPDDGKPK, Bureau of statistics, planning and development department, government of KPK; BSPDDGB, Bureau of statistics, planning and development department, government of Balochistan.
References
Ahmad, S., Mulk, S., and Amir, M. (2002). Groundwater management in Pakistan. In: First South Asia Water Forum, Kathmandu Nepal. Printed by Pakistan Water Partnership.
Ali Shah, M. A., and Akbar, M. Z. B. (2021). Solar Irrigation in Pakistan: a situation analysis report. Colombo, Sri Lanka: International Water Management Institute (IWMI) doi: 10.5337/2021.219
Azad, A., Rasheed, A., and Memon, Y. (2003). Sindh Water Resources Management, Issues and Options. FAO Investment Centre Occasional Paper Series 15. Food and Agriculture Organization (FAO) of the United Nations. Rome, Italy.
Baksh, D., Ijaz, H., Ahmad, S., and Yasin, M. (2000). EMz ceramics for improving fuel efficiency of diesel pump sets in Pakistan. J. Nat. Farm. Environ. 1, 9–15.
Bureau of statistics planning development department Government of KPK. (2018). Development statistics of KPK 2018. Available online at: https://kpbos.gov.pk/ (accessed February 17, 2022).
Bureau of statistics planning development department government of Sindh. (2018). Development statistics of Sindh 2018. Available online at: https://onsindhbos.gov.pk/development-statistics/ (accessed February 17, 2022).
Bureau of statistics planning development department government of the Balochistan. (2018). Development Statistics of Balochistan 2018. Available online at: https://balochistan.gov.pk/index.php?option=com_docman&task=cat_view&gid=1274&Itemid=677/ (accessed February 17, 2022).
Bureau of statistics planning development department government of the Punjab. (2018). Punjab Development Statistics 2018. Available online at: http://www.bos.gop.pk/developmentstat (accessed February 17, 2022).
Bureau of statistics planning and development department, the government of Pakistan. (2018). Agricultural Statistics of Pakistan 2017–2018.
Chouchane, H., Krol, M. S., and Hoekstra, A. Y. (2020). Changing global cropping patterns to minimize national blue water scarcity. Hydrol. Earth Syst. Sci. 24, 3015–3031. doi: 10.5194/hess-24-3015-2020
Climate Energy Water Research Institute National Agricultural Research Centre, Pakistan Agricultural Research Council, the International Maize Wheat Improvement Center. (2020). Cropping Pattern Zonation of Pakistan. Available online at: https://repository.cimmyt.org/bitstream/handle/10883/20857/61841.pdf?sequence=1&isAllowed=y
Cremades, R., Rothausen, S. G., Conway, D., Zou, X., and Wang, J. (2016). Co-benefits and trade-offs in the water–energy nexus of irrigation modernization in China. Environ. Res. Lett. 11:054007. doi: 10.1088/1748-9326/11/5/054007
Díaz, J. R., Urrestarazu, L. P., Poyato, E. C., and Barrios, M. P. M. (2011). The paradox of irrigation scheme modernization: more efficient water use linked to higher energy demand. Spanish J Agric. Res. 4, 1000–1008. doi: 10.5424/sjar/20110904-492-10
ENERCON (1989). Tubewell energy audit manual (ENERCON-89-131). National Energy Conservation Centre (ENERCON). Planning and development devision, Government of Pakistan, Islamabad, Pakistan.
FAO (2020). The State of Food and Agriculture 2020. Overcoming Water Challenges in Agriculture. Rome, Italy.
FAO (2021). CropWat. Food and Agriculture Organization of the United Nations (FAO). Available online at: http://www.fao.org/land-water/databases-and-software/cropwat/en/ (accessed October 11, 2021).
FAO (2022). Faostat. Food and Agriculture Organization of the United Nations (FAO). Available online at: https://www.fao.org/faostat/en/#data
GOP (1997). Irrigation Agronomy, on Farm Water Management Field Manual, Volume iv. Federal water management cell, Ministry of food, agriculture and livestock, Islamabad, Pakistan.
Habib, Z. (2004). Scope for Reallocation of River Waters for Agriculture in the Indus Basin. Doctoral dissertation. Spécialité sciences de l'eau, ENGREF, Paris, France.
Hartung, H., and Pluschke, L. (2018). Benefits and Risks of Solar-Powered Irrigation: A Global Overview. Rome, Italy: FAO. ISBN 978-92-5-130479-2 (FAO).
Hoekstra, A. Y., and Mekonnen, M. M. (2012). The water footprint of humanity. P. Natl. Acad. Sci. USA 109, 3232–3237. doi: 10.1073/pnas.1109936109
Hoff, H. (2011). Understanding the Nexus. Background Paper for the Bonn 2011 In: Conference: The Water, Energy and Food Security Nexus. Stockholm Environment Institute Sweden: Stockholm.
Holmatov, B., Schyns, J. F., Krol, M. S., Gerbens-Leenes, P. W., and Hoekstra, A. Y. (2021). Can crop residues provide fuel for future transport? limited global residue bioethanol potentials and large associated land, water and carbon footprints. Renew. Sustain. Energy Rev. 149, 111417. doi: 10.1016/j.rser.2021.111417
Hussain, I., Hussain, Z., Sial, M. H., Akram, W., and Farhan, M. F. (2011). Water balance, supply and demand and irrigation efficiency of Indus Basin. Pakistan Econ. Soc. Rev. 49, 13–38.
International Energy Agency (IEA) (2020). Electricity generation by source, Pakistan 1990-2017. iea.org/countries/Pakistan (accessed January 5, 2022).
IPCC (1996). Revised 1996 Guidelines for National Greenhouse Gas Inventories, Workbook and Reference Manual.
IPCC. (2021). “Summary for Policymakers,” in Climate Change 2021: The Physical Science Basis. Contribution of Working Group I to the Sixth Assessment Report of the Intergovernmental Panel on Climate Change, eds V. Masson-Delmotte, V., P. Zhai, A. Pirani, S. L. Connors, C. Péan, S. Berger, N. Caud, Y. Chen, L. Goldfarb, M. I. Gomis, M. Huang, K. Leitzell, E. Lonnoy, J. B. R. Matthews, T. K. Maycock, T. Waterfield, O. Yelekçi, R. Yu, and B. Zhou (Cambridge; New York, NY: Cambridge University Press), 3–32. doi: 10.1017/9781009157896.001
Jackson, T. M., Khan, S., and Hafeez, M. (2010). A comparative analysis of water application and energy consumption at the irrigated field level. Agric. Water Manag. 97, 1477–1485. doi: 10.1016/j.agwat.2010.04.013
Jurriens, M., Mollinga, P. P., and Wester, P. (1996). Scarcity by Design: Protective Irrigation in India and Pakistan, Paper 1. Wageningen Agricultural University, International Institute for Land Reclamation and Improvement. Wageningen, The Netherlands.
Karimi, P., Qureshi, A. S., Bahramlo, R., and Molden, D. (2012). Reducing carbon emissions through improved irrigation and ground water management: a case study from Iran. Agric. Water Manag. 108, 52–60. doi: 10.1016/j.agwat.2011.09.001
Li, X. (2014). Understanding the Water-Energy Nexus: A Case Study of Ningxia. (Master thesis). University of Uppsala, Sweden.
Liu, Y., Hejazi, M., Kyle, P., Kim, S. H., Davies, E., Miralles, D. G., et al. (2016). Global and regional evaluation of energy for water. Environ. Sci. Technol. 50, 9736–9745. doi: 10.1021/acs.est.6b01065
Martin, D.L., and Gilley, J. (1993). Irrigation water requirements. In: Part 623, National engineering handbook. Chapter 2. Washington, DC: United States department of agriculture (USDA), Soil conservation service.
Mayor, B., López-Gunn, E., Villarroya, F. I., and Montero, E. (2015). Application of a water – energy – food nexus framework for the Duero river basin in Spain. Water Int. 40, 791–808. doi: 10.1080/02508060.2015.1071512
Mekonnen, M. M., and Hoekstra, A. Y. (2016). Four billion people facing severe water scarcity. Sci. Adv. 2:e1500323. doi: 10.1126/sciadv.1500323
Moreno, M. A., Córcoles, J. I., Tarjuelo, J. M., and Ortega, J. F. (2010). Energy efficiency of pressurised irrigation networks managed on-demand and under a rotation schedule. Biosystem Eng. 107, 349–363. doi: 10.1016/j.biosystemseng.2010.09.009
Murray-Rust, D. H., and Van der Velde, E. J. (1994). Conjunctive use of canal and groundwater in Punjab, Pakistan: management and policy options. Irrig. Drain. Syst. 8, 201–231. doi: 10.1007/BF00881558
Nelson, G. C., and Robertson, R. (2008). Estimating the contribution of groundwater irrigation pumping to CO2 emissions in India. Draft technical note. Washington, DC: International Food Policy Research Institute (IFPRI), 16.
Pakistan Meteorological Department (2022). (PMD) Crop calendar of Pakistan. National agromet centre. Islamabad: Government of Pakistan. Availale online at: https://namc.pmd.gov.pk/crop-calender.php
Plappally, A. K., and Lienhard, J. H. (2012). Energy requirements for water production, treatment, end use, reclamation, and disposal. Renew Sustain Energy Rev. 16, 4818–4848. doi: 10.1016/j.rser.2012.05.022
Punjab irrigation department (2022). Monitoring Groundwater 2017. Government of Punjab, Pakistan. Available online at: https://irrigation.punjab.gov.pk/essentials_big
Qureshi, A. S. (2014). Reducing carbon emissions through improved irrigation management : a case study from Pakistan. Irrig. Drain. 63, 132–138. doi: 10.1002/ird.1795
Qureshi, A. S. (2020). Groundwater governance in Pakistan: From colossal development to neglected management. Water 12, 3017. doi: 10.3390/w12113017
Qureshi, A. S., Shah, T., and Akhtar, M. (2003). The Groundwater Economy of Pakistan. IWMI Working Paper 064/Pakistan Country Series No.19. Lahore: International Water Management Institute (IWMI) Regional Office. p. 24. doi: 10.3910/2009.186
Rasul, G. (2016). Managing the food, water, and energy nexus for achieving the sustainable development goals in South Asia. Environ. Dev. 18, 14–25. doi: 10.1016/j.envdev.2015.12.001
Rasul, G., and Sharma, B. (2016). The nexus approach to water–energy–food security: an option for adaptation to climate change. Clim. Policy 16, 682–702. doi: 10.1080/14693062.2015.1029865
Reddy, P. P. (2015). Agriculture as a source of GHGs. In: Climate resilient agriculture for ensuring food security. New Delhi, India: Springer. doi: 10.1007/978-81-322-2199-9
Rehman, A., Jingdong, L., Shahzad, B., Chandio, A. A., Hussain, I., Nabi, G., et al. (2015). Economic perspectives of major field crops of Pakistan: an empirical study. Pac. Sci. Rev. 1, 145–158. doi: 10.1016/j.psrb.2016.09.002
Rothausen, S., and Conway, D. (2011). Greenhouse-gas emissions from energy use in the water sector. Nat. Clim. Change 1, 210–219. doi: 10.1038/nclimate1147
Safa, M., Samarasinghe, S., and Mohssen, M. (2011). A field study of energy consumption in wheat production in Canterbury, New Zealand. Energy Convers. Manag. 52, 2526–2532. doi: 10.1016/j.enconman.2011.01.004
Shah, T. (2009). Climate change and groundwater: India's opportunities for mitigation and adaptation. Environ. Res. Lett. 4 :035005. doi: 10.1088/1748-9326/4/3/035005
Shepard, D. (1964). “A two-dimensional interpolation for irregularly spaced data function,” in Proceedings-1968 ACM national conference, 517–524. Available online at: http://citeseerx.ist.psu.edu/viewdoc/download?
Siddiqi, A., and Wescoat, J. L. (2013). Energy use in large-scale irrigated agriculture in the Punjab province of Pakistan. Water Int. 38, 571–586. doi: 10.1080/02508060.2013.828671
Siyal, A. W., Gerbens-Leenes, P. W., and Nonhebel, S. (2021). Energy and carbon footprints for irrigation water in the lower Indus basin in Pakistan, comparing water supply by gravity-fed canal networks and groundwater pumping. J. Clean. Prod. 286, 125489. doi: 10.1016/j.jclepro.2020.125489
Siyal, A. W., Yasin, M., Ali, I., Hussain, Z., Aslam, M., and Khan, M. (2015). Performance evaluation of fixed dome and floating type biogas digesters for tubewell operation with dual fuel approach in Pakistan. Int. J. Innov. Appl. Stud. 10, 1225.
Tahir, Z., and Habib, Z. (2001). Land and water productivity: Trends across Punjab canal commands. IWMI working paper 14, Pakistan Country Series Number 3. http://www.iwmi.cgiar.org/ International Water Management Institute, Pakistan.
Ullah, M. K., Habib, Z., and Muhammad, S. (2001). Spatial distribution of reference and potential evapotranspiration across the Indus Basin Irrigation Systems, IWMI working paper 24, Pakistan country series no.8, Lahore, Pakistan, ISBN: 92-9090-206-X. IWMI.
UN-Water (2021). Summary Progress Update 2021 – SDG 6 – water and sanitation for all. Version: July 2021. Geneva, Switzerland.
Water Power Development Authority (WAPDA) (2009). Hydropower Potential in Pakistan. Lahore, Pakistan. Available online at: www.wapda.gov.pk
Keywords: food-energy-water systems, energy footprint, carbon footprint, irrigation, Pakistan
Citation: Siyal AW and Gerbens-Leenes PW (2022) The water–energy nexus in irrigated agriculture in South Asia: Critical hotspots of irrigation water use, related energy application, and greenhouse gas emissions for wheat, rice, sugarcane, and cotton in Pakistan. Front. Water 4:941722. doi: 10.3389/frwa.2022.941722
Received: 12 May 2022; Accepted: 16 August 2022;
Published: 14 September 2022.
Edited by:
Seifu Admassu Tilahun, Bahir Dar University, EthiopiaReviewed by:
Ahmed Sefelnasr, Assiut University, EgyptAbeyou Worqlul, Texas A&M University Central Texas, United States
Copyright © 2022 Siyal and Gerbens-Leenes. This is an open-access article distributed under the terms of the Creative Commons Attribution License (CC BY). The use, distribution or reproduction in other forums is permitted, provided the original author(s) and the copyright owner(s) are credited and that the original publication in this journal is cited, in accordance with accepted academic practice. No use, distribution or reproduction is permitted which does not comply with these terms.
*Correspondence: Abdul Wahab Siyal, YS53LnNpeWFsQHJ1Zy5ubA==