 Shubham Goswami
 M. Sekhar
- 1Department of Civil Engineering, Indian Institute of Science, Bangalore, India
- 2Indo-French Cell for Water Sciences, Indian Institute of Science, Bangalore, India
Processes controlling groundwater recharge have been a topic of pursuit in the hydrological research community. The groundwater recharge in hard-rock aquifers is significantly impacted by rainfall patterns, aquifer characteristics, weathering/soil conditions, topography, land use, and land cover. Analysis of the recharge process in tropical semi-arid hard-rock aquifer regions of southern India is crucial due to several factors, including (a) a heavily tailed monsoon system prevailing in the region, which is characterized by very few episodic storm events; (b) heterogeneity of aquifers in terms of fractures; and (c) the presence of several man-made irrigation lakes/tanks along with the drainage network. This study uses a lumped unconfined aquifer model to estimate the groundwater recharge for nine locations in Gundlupet taluk and 150 locations in Berambadi Experimental Watershed (EWS) in the south Indian state of Karnataka. Analysis of estimated recharge factors identifies 30 high-episodic recharge events out of 292 observations (around 10%) in Gundlupet taluk and 80 out of 150 locations in 2017 in Berambadi EWS. Partial information correlation (PIC) analysis is used to select the significant predictors out of potential predictors based on rainfall intensity distribution and climatological indices. PIC analysis reveals that the number of rainfall events with 15–30 mm daily rainfall intensity are most significant for normal recharge events in Gundlupet taluk and Berambadi EWS. The combined information on daily rainfall distribution, daily rainfall events of 20–40 mm, and the number of La Niña months in a particular year can explain the variability of high-episodic recharge events in Gundlupet taluk. These high-intensity rainfall events can be potential sources of alternate recharge pathways resulting in faster indirect recharge, which dominates the diffused recharge and results in high-episodic recharge events. Rainfall intensity distribution and climatological indices contain the potential information required to disaggregate normal and high-episodic recharge factors for future rainfall projections, which is useful for future groundwater level projections.
Introduction
Processes controlling groundwater recharge have been a topic of pursuit in the hydrological research community. Understanding processes governing the groundwater recharge is crucial for regions with huge demands for groundwater supplies as these are notably the key to agricultural development. As per (UNESCO, 2022), India stands first in the list of groundwater user countries with a withdrawal rate of ~250 km3/year in the last decade, which is more than the USA and China put together. Groundwater recharge is primarily classified into two categories: direct and indirect recharge. Direct recharge is the diffused recharge from rainfall infiltration through the unsaturated zone. Indirect recharge is generated principally from localized percolation from streamflow and because of preferential flow through joints, cracks, and fissures (Taylor et al., 2013; Zhu and Ren, 2018). Climatic conditions, geomorphology, and geology influence the relative contribution of direct and indirect recharge components. The groundwater recharge process is significantly impacted by rainfall patterns, aquifer characteristics, weathering/soil condition, topography, land use, and land cover. Analysis of the recharge process in tropical semi-arid hard-rock aquifer regions of southern India is crucial due to several factors, including (a) heavily tailed monsoon system prevailing in the region, which is characterized by very few episodic storm events; (b) heterogeneity of aquifers in terms of fractures; and (c) the presence of several man-made irrigation lakes/tanks along with the drainage network. Indirect recharge is prominent in regions with low-recharge amounts, such as hard-rock aquifers in semi-arid regions, making it imperative to understand the processes governing indirect recharge (Dewandel et al., 2010; Massuel et al., 2014; Lachassagne et al., 2021; Rusagara et al., 2022). Local studies conducted in an experimental forested watershed of Kabini Critical Zone Observatory (CZO) in southern India noted significant indirect recharge (associated with recharge from first- and second-order streams) as compared to direct and localized recharge (Maréchal et al., 2009). Asoka et al. (2018) identified high intensity (>35.5 mm/day) precipitation as the main driver for groundwater recharge in the hard-rock aquifer region of southern India during the monsoon season (Asoka et al., 2018). Hydrogeochemical studies in the hard rock aquifer of southern India found evidence of a rapid recharge component within the overall highly mixed groundwater system (Collins et al., 2020). Studies carried out in similar geological regions have identified the importance of rainfall intensity and temporal distribution in driving the recharge rates (Owor et al., 2009; Perrin et al., 2012; Moeck et al., 2020; Guillaumot et al., 2022). Even though there is a general belief that extreme rainfall events are not much relevant to groundwater recharge, studies from literature in granitic aquifers of Eastern Africa have indicated the role of intense seasonal rainfall in high recharge events (Taylor et al., 2013). It has been observed that heavy rainfall events and strong seasonality can result in higher recharge rates. Recharge estimates based solely on a constant fraction of rainfall are often misleading. Maréchal et al. (2006) noticed that the higher number of rainy days during monsoon favored recharge. They found the estimated total groundwater recharge to be higher than the estimate from linear regression and attributed the difference to indirect recharge. Various studies conducted in Africa have identified the disproportionate contribution of heavy rainfall to groundwater recharge (Leblanc et al., 2008; Favreau et al., 2009; Taylor et al., 2013; Galle et al., 2018; Cuthbert et al., 2019; Banks et al., 2021; MacDonald et al., 2021). Carvalho Resende et al. (2019) studied the impact of climate variability on groundwater storage and identified El Niño Southern Oscillation (ENSO) as the main driver of changes in interannual groundwater storage triggered by significant changes in groundwater recharge.
This study evaluates the episodic nature of rainfall–recharge factor patterns based on the hypothesis that these high-episodic recharge events are impacted by rainfall intensity distribution and climatology which facilitates alternate recharge pathways. The causal factors for the high-episodic rainfall–recharge factor events will be evaluated focusing on the tropical nature of India's summer monsoon rainfall. These episodic high recharge scenarios control groundwater dynamics and a substantial portion of groundwater storage is recovered. Understanding this high-episodic recharge that reinitializes the groundwater conditions becomes important to forecast groundwater levels in the future climate scenario as frequent extreme storm events are projected for the twenty-first century (Mehrotra et al., 2013; Sharma et al., 2018). Forecasting the future groundwater level will require combining these extreme rainfall–recharge factors along with normal rainfall–recharge factors in the models for an unbiased realistic forecast.
The primary objectives of this study are (1) to estimate groundwater recharge in hard rock aquifers of tropical southern India using long-term observation data; (2) to analyze the rainfall–recharge patterns and identify high-episodic recharge events; and (3) to test the hypothesis of an association of high-episodic recharge scenarios with rainfall intensity, distribution, and climatological indices.
Study area and data
Study area
To achieve the objectives of the study, a long-term reliable dataset in all aspects becomes the primary requirement. Gundlupet taluk, an administrative unit, which is a part of Kabini CZO, fulfills the requirement because of the rich data over a long period available from state government departments complimented by a high-density curated data for Berambadi Experimental Watershed (EWS) that lies within the taluk. Figure 1 shows the location, land-use, and land-cover of the study area for the year 2010 taken from Moulds et al. (2018) along with the groundwater observation wells in Gundlupet taluk and Berambadi EWS. Gundlupet taluk (1,406 km2) comes under the Chamrajanagara district in the South Indian state of Karnataka. It belongs to the Kabini river basin, which is a major tributary to the Cauvery River. The region is primarily semi-arid with an annual rainfall of ~1,100 mm with high interannual variability. About one-third of the area of the taluk is covered by the forests of Bandipur National Park. The net sown area is about 41% of the total area of taluk and groundwater is the sole source for the domestic and irrigation sectors. The study area is part of the Mysore Plateau, underlain by the Western Dharwar Province of the Dharwar craton of the Archaean-Paleoproterozoic age. Three broad rock categories in the craton are gneisses of the Peninsular Gneiss, meta-sediments, and meta-igneous rocks of the Dharwar Schists, and to the east, the granite of the Closepet batholith belt (Rao, 1962; Meert et al., 2010). Granitic gneissic bedrock traversed by dykes ranging from 0.5 to 1.5 km in length and 5–15 m in width in the east-west direction are observed in the region (Sekhar et al., 2006). The typical hard rock granitic aquifers comprise two layers, a few meters thick fissured layer at the surface of the fresh bedrock having high hydraulic conductivity but low porosity and a weathered layer of gneissic saprolite with low-hydraulic conductivity but higher porosity (Dewandel et al., 2006). Large spatial variability is observed in the thickness of gneissic saprolite with an average thickness of 18 m (Braun et al., 2009; Buvaneshwari et al., 2017). Drainage-oriented lineaments are observed in this region ranging from 2.5 to 7.5 km in length which trend north-south or NNE-SSW (Sekhar et al., 2004). The water-bearing and yielding properties are primarily due to the development of secondary porosities like weathering, joints, fractures, and fissures. Phreatic aquifers occur between the depths of 2 and 20 m below ground level (bgl) in weathered zones and deeper fractured aquifers below weathered zone (20–165 m bgl) occur in granite, gneiss, and charnockite (CGWB, 2014). The soils of the district are derived from granitic-gneisses and charnockite rock formations. Three major soil types in the area are comprised of red, black, and rocky/weathered soils, which represent the soil types for granitic-gneissic lithology found in southern India (Barbiéro et al., 2007; Tomer et al., 2015). Berambadi EWS is predominantly an agricultural watershed that was selected in Kabini CZO to capture and characterize human processes on hydrology and energy budgets (Sekhar et al., 2016). The region is drained majorly by the Gundal River, which is the main tributary of the Kabini river.
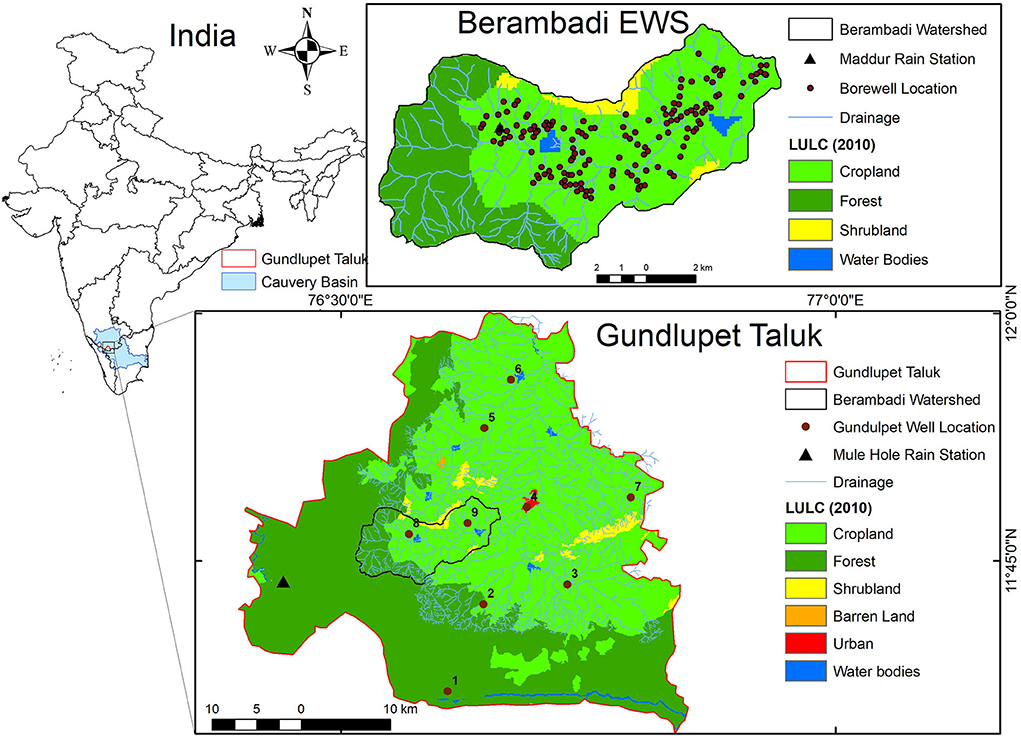
Figure 1. Location of groundwater observation wells in Gundlupet taluk and Berambadi EWS.
Data
Data of the monthly groundwater level for nine observation wells (OWs) in the Gundlupet taluk from 1980 to 2017 have been collected from the Groundwater Directorate (GD), Karnataka State with an accuracy of 1 cm. Details of these OWs are given in Supplementary Table 1. Daily rainfall data is obtained from the Department of Economics and Statistics (DES), Bangalore with an accuracy of 0.1 mm from 1980 to 2009 for the Mule Hole gauging station in Gundlupet taluk. For modeling purposes, this daily rainfall data is aggregated to monthly rainfall data. Kabini CZO team at IISc Bangalore monitors monthly groundwater levels in Berambadi EWS by spatially distributing 205 operational wells, most of these wells are owned by farmers and used for irrigation purposes (Sharma A. K. et al., 2016). These wells are used as piezometers in the study area by careful monitoring to avoid any influence of pumping operations by carrying out the sampling during the no power supply period (Buvaneshwari et al., 2017). Thus, abstraction is considered (see below), but as a spatial average abstraction and not precisely at each well. Daily rainfall data is measured at Maddur rain station which is in the western part of Berambadi EWS. Based on a criterion of less than 10% gaps in groundwater data, 150 out of 205 wells were selected for groundwater modeling. Pauta criterion (3σ) (Zhou et al., 2013; Li et al., 2016) is applied to individual OW groundwater level data to identify outliers. The outliers and data gaps are filled using linear interpolation.
Open-source Shuttle Radar Topography Mission (SRTM) product 3 arc-second (90 m spatial resolution) Digital Elevation Model (DEM) is used for elevation data. Ancillary data related to aquifer properties, such as specific yield, recharge factors, and groundwater abstraction ranges, are taken from the Central Ground Water Board report (CGWB, 2014) and previous studies in the same region (Collins et al., 2020; Goswami and Sekhar, 2022).
Methodology
The methodology in this study is divided into two parts. The first part focuses on the estimation of groundwater recharge time series at all OW locations. The second part covers the identification of normal and high-episodic recharge events and statistical evaluation of their association with rainfall intensity distribution and climatology.
Estimation of groundwater recharge
Studies show that fractured hard-rock aquifers can be modeled as unconfined aquifers (Legchenko et al., 2006; Maréchal et al., 2006; Machiwal and Jha, 2015; Subash et al., 2017). The focus of the study is to analyze the groundwater wells individually, which requires a lumped unconfined groundwater model. Park and Parker (2008) formulated a 1-D groundwater flow equation for unconfined aquifers, which is given as Equation 1:
where, h represents the hydraulic head [L], t is time [T], Sy is the specific yield of the aquifer system [–], and K is the hydraulic conductivity [LT−1]. They transformed the equation to take into account the precipitation and discharge such that (Equation 2):
where, λ is the discharge constant [T−1], R is the rainfall [LT−1], and rfis the recharge factor [–]. The discharge constant represents the fraction of available groundwater storage, which flows out of the domain laterally. It is incorporated into the 1-D lumped formulation to account for the loss of groundwater in terms of discharge because of the local groundwater gradient. Kumar (2012) and Subash et al. (2017) modified the equation by taking groundwater pumping into consideration and created the AMBHAS_1D model (CRAN - Package ambhasGW, 2017), a physically based lumped model for unconfined aquifers (Collins et al., 2020). The governing equation of the model is given as Equation (3):
where, Dnet is the net groundwater abstraction [LT−1] accounting for (pumping—return flow). It is to be noted that the recharge factor (rf) combines recharge from all sources accounting for direct recharge, indirect recharge and recharge from return flows. (1−rf)R accounts for other water balance components such as evapotranspiration (ET) and runoff (Q). In the model, the recharge factor is directly applied to rainfall (R) and not the effective rainfall [R − (ET + Q)], thus, it does not consider the associated non-linearities. Hence, this non-linearity will be part of the non-linearities discussed in the later part of the paper. The lumped aquifer model assumes that no groundwater discharge occurs at or below a specific minimum groundwater level in the area. If a high hydraulic gradient occurs, deviations from this assumption may reduce model accuracy. The model considers negligible time-lag from precipitation to water table response. For deeper groundwater levels, lag-time may affect the model accuracy for low-unsaturated hydraulic conductivity cases or if fine time resolution of data is used for calibration (Park and Parker, 2008). Detailed information on the model parameterization and calibration is given in Park and Parker (2008) and Subash et al. (2017).
Sy and rf are the primary model parameters that are estimated during calibration. Initial ranges of Sy and rf values are taken from CGWB (2012b), Subash et al. (2017) and Goswami and Sekhar (2022) for calibration of the model. Taluk averaged groundwater abstraction for each 5-year duration taken from reports and literature are forced into the model to keep it consistent with the observed abstraction (CGWB, 2006, 2008, 2011, 2012a,b, 2014, 2017; Subash et al., 2017). During the calibration exercise, specific yield and recharge factor values are estimated simultaneously, which can introduce uncertainties because of correlation among each other. A two-step approach with sequential estimates of specific yield and recharge factors considering a reasonably large (at least 5 years) groundwater data series for calibration provides better parameter estimates, reduces the correlation between them, and minimizes the equifinality (Sekhar et al., 2004). Groundwater modeling based on numerical models is always limited by a trade-off between data availability, method complexity, and expected relevance of outputs (Massuel et al., 2013). Modeling groundwaters at daily time steps can be useful in understanding the effects of evapotranspiration and pumping while monthly to seasonal analysis is much more relevant for recharge analysis (Freeze and Cherry, 1979). Previous groundwater modeling and recharge estimation studies in hard-rock aquifers have used monthly time steps (Subash et al., 2017; Collins et al., 2020). The observed groundwater levels in the study area are quite deep, and hence, to maintain the model accuracy, it is suggested to avoid finer time scales (Park and Parker, 2008). As the observed groundwater levels are available at a monthly time scale, the model simulation is carried out at a monthly time scale. Approximately, 60% of the timeseries is used for calibration and the rest 40% for validation. In the first calibration step, the model is allowed to calibrate and estimate Sy keeping a constant rf value. In the second step, the calibrated Sy value from the first step is kept constant and the model is allowed to estimate rf for each location. The model is validated for each location using the parameters estimated from the calibration stage. The calibrated and validated set of parameters is used in the model to estimate recharge timeseries for each OW.
High-episodic recharge identification and their association with rainfall and climatology
Rainfall–recharge analysis is carried out for all groundwater OWs at an annual time scale. Annual recharge factor (rf) for each study location is calculated from the estimated recharge and observed rainfall. Well-averaged recharge factor is used to calculate the z-score corresponding to each year's recharge factor. Mean and standard deviation for each OW independently are used to identify high-episodic recharge events. The z-score is calculated for each year's recharge factor value using Equation (4):
where μi and σi are the mean and standard deviation of annual recharge factor for observation well i. A threshold of z-score ≥1.96 (confidence level of 95%) is used to differentiate high-episodic recharge events from normal recharge events.
To understand the effect of rainfall patterns and the monsoon system on the recharge, we used the available daily rainfall data to obtain the number of days in intervals of 2.5–5, 5–10, 10–15, 15–20, 20–25, 25–30, 30–35, 35–40, 40–45, 45–50, and >50 mm daily rainfall in each year. A MATLAB package cdfplot is used to produce the empirical Cumulative Distribution Function (CDF) for each year's daily rainfall data. Mean CDF of combined 38 years of daily rainfall data is used as representative of the daily rainfall intensity distribution in the region. Two-sample Kolmogorov–Smirnov test is performed using the inbuilt kstest2 function in MATLAB, which gives the p-value and decision if the CDF of a particular year is significantly different from the mean rainfall CDF (Figure 2). The result of KS test is presented in last column (p-value) of Supplementary Table 2, where, p-value < 0.05 (p-value ≥ 0.05) corresponds to rejection (fail to reject) of CDF match (α = 0.05).
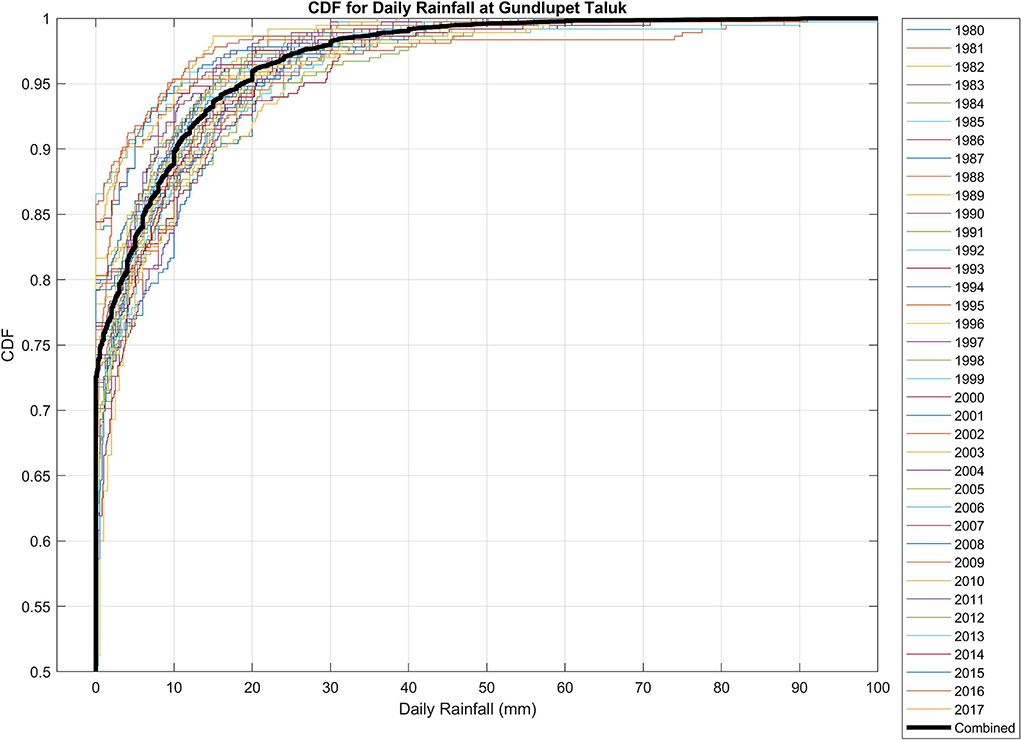
Figure 2. Daily rainfall and mean CDF at Gundlupet taluk.
Oceanic Niño Index (ONI) is a well-established index that significantly explains the interannual variability of the Indian summer monsoon (Chakraborty, 2018; Chakraborty and Singhai, 2021). ONI is the 3 months running mean of ERSST.v5 sea surface temperature anomalies in the Niño 3.4 region (5°N−5°S, 120°−170°W), which is freely available on the National Oceanic and Atmospheric Administration (NOAA) website. El Niño (warm) and La Niña (cold) periods are identified based on a threshold of ±0.5°C for ONI. ONI thresholds are used to calculate the number of El Niño months (n_elnino), La Niña (n_lanina) months, and the average ONI for each year (ONI_y). These three indices are used in this study to represent climatology on an annual scale (Supplementary Table 2).
Partial information correlation (PIC) is an information theory based tool for measuring the partial dependence and selection of predictor variables depending on the response variable without making any assumptions about its form or model representation (Sharma and Mehrotra, 2014). The Nonparametric Prediction (NPRED) R-package (Sharma A. et al., 2016) is used for predictor identification from a set of potential predictor variables (Supplementary Table 2) taking the response variable as groundwater recharge.
Results and discussion
The model simulation is carried out for all nine groundwater OWs in Gundlupet taluk (OW#1 to OW#9) and 150 groundwater OWs within Berambadi EWS (B#1 to B#150). For Gundlupet taluk, the simulation period was from 1980 to 2017; however, few wells dried out during this period. For groundwater wells in Berambadi EWS, the simulation is carried out from May 2010 to April 2020. Figure 3 represents the calibration and validation timeseries for two locations OW#4 and B#149. Supplementary Figures 1, 2 show the performance of model calibration and validation for all locations in Gundlupet taluk and Berambadi EWS using Nash-Sutcliffe Efficiency (NSE) and Root Mean Square Error (RMSE). Calibrated specific yield (Sy) and annual mean recharge factor (rf) for OWs in Gundlupet taluk are tabulated in Supplementary Table 1 and for Berambadi EWS in Supplementary Figures 2C,D. The calibrated sets of parameters are consistent with studies in the same region (Legchenko et al., 2006; Subash et al., 2017; Collins et al., 2020). A decreasing trend in Sy and an increasing trend in RMSE eastward is observed in Berambadi EWS (Supplementary Figures 2B,C). The reason for this trend is associated with deeper groundwater levels in the eastern part as compared to the western part, which is caused by higher groundwater abstraction in lower eastern regions of the watershed (Buvaneshwari et al., 2017; Collins et al., 2020). During model calibration, a depth-averaged Sy value is estimated, hence Sy values in the eastern part are averaged across deeper aquifer zones characterized by lower specific yield values. Simulation based on depth averaged Sy in deeper aquifer zones shows relatively higher deviation from observed levels as compared to shallower groundwater levels in the western part.

Figure 3. Model calibration and validation for (A) OW#4 (Gundlupet town) in Gundlupet taluk and (B) B#149 in Berambadi EWS.
In Gundlupet taluk, 30 events of high-episodic recharge are identified, which are summarized in Table 1. The annual recharge to annual rainfall plot of seven locations out of nine in Gundlupet taluk is presented in Figure 4. There is a clear distinction between the normal (violet) and high-episodic recharge events (red). The average normal recharge factor estimated by combining all locations of Gundlupet taluk is nearly 4.3%, while for high-episodic recharge events it is 5.9%. For a few locations, the high-episodic recharge factor can go as high as 1.5–2 times the normal recharge factor in specific years. For example, for OW#9 in Gundlupet taluk, the recharge factor in 1983 was 7.7%, which is nearly twice the average recharge factor (~3.9%) estimated for that location. All the normal recharge events of these seven locations follow a linear relationship quite well (R2 = 0.99) with an average recharge factor of 4.27%. However, the combined high-episodic recharge events show some scattering as compared to normal recharge events, though a linear fit corresponds to a recharge factor of 5.86%.
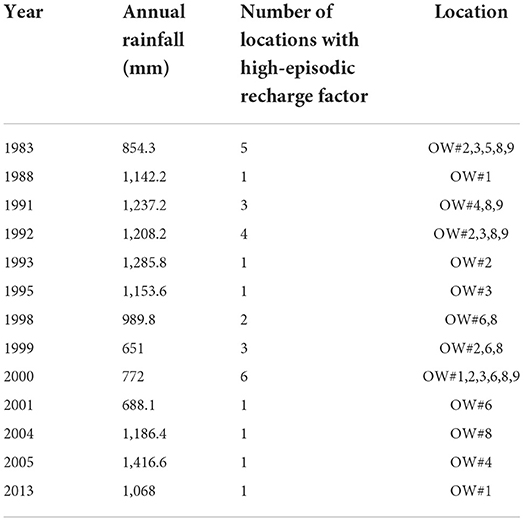
Table 1. Summary of high-episodic recharge events in Gundlupet taluk.
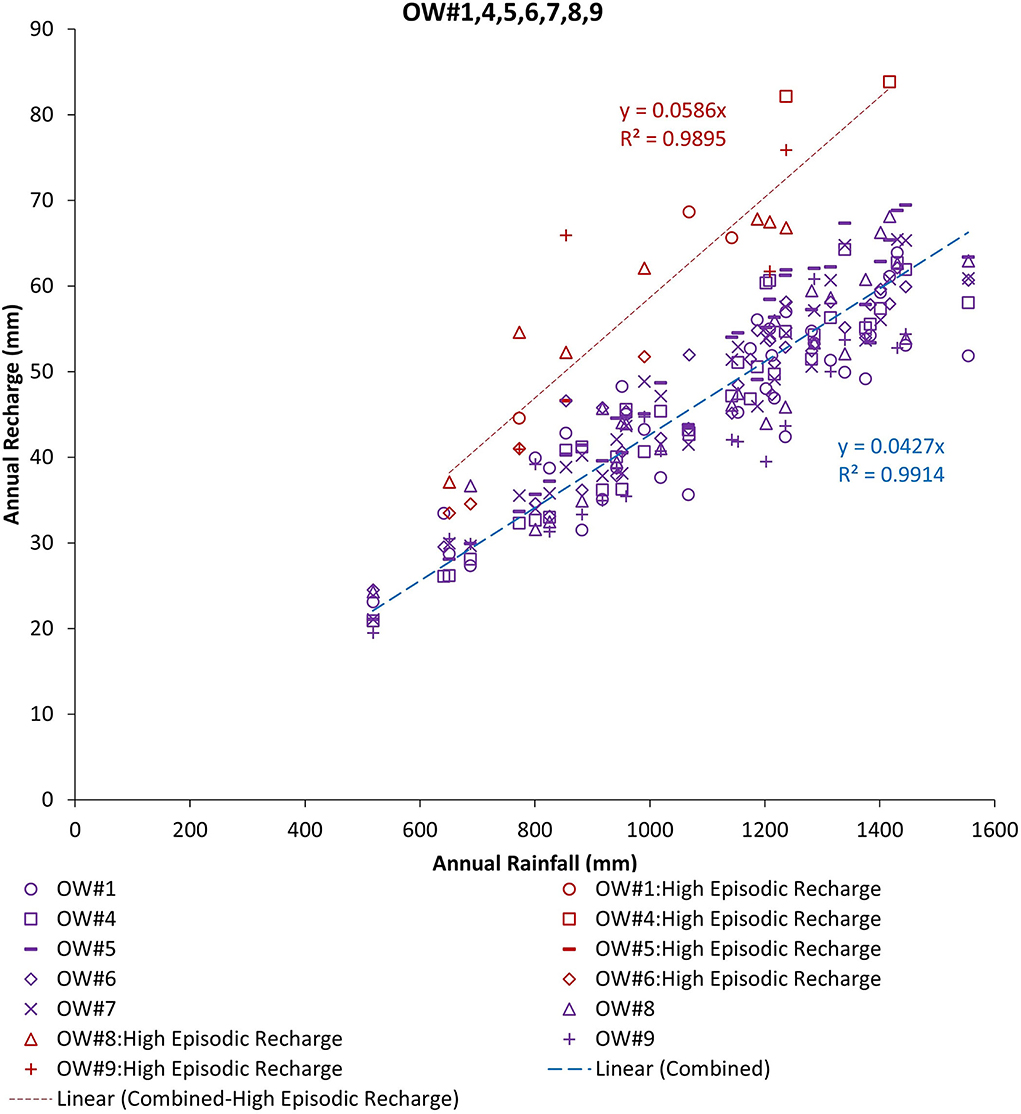
Figure 4. Annual recharge vs. annual rainfall variation in Gundlupet taluk for OW#1, 4, 5, 6, 7, 8, and 9.
Normal recharge events for OW#2 and OW#3 are more scattered than in the other seven locations in the taluk as represented in Figure 5. The identified high-episodic recharge events are of significantly higher magnitude than the site average normal recharge events for all the nine OWs in the Gundlupet taluk.
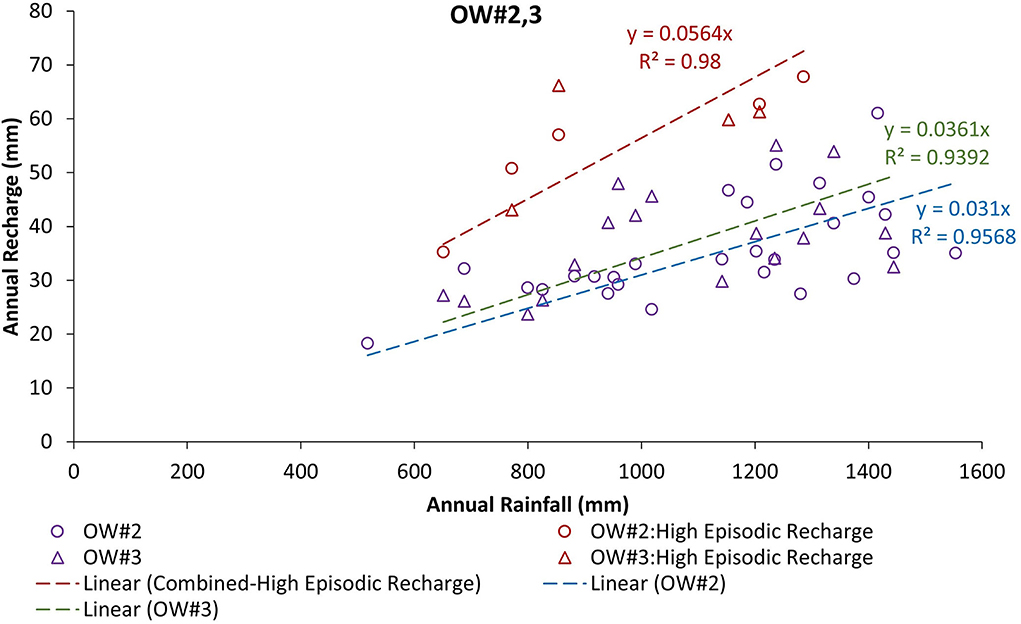
Figure 5. Annual recharge vs. annual rainfall variation in Gundlupet taluk for OW#2 and OW#3.
Rainfall intensity distribution along with events of high-episodic recharge are plotted in Figure 6. It is noticeable that the highest percentage of stations with high-episodic recharge was observed in the year 2000 (67%) despite being a rainfall deficient year. Other high-episodic recharge events correspond to both above-average (1991 and 1992) and average rainfall years (1983). This indicates that apart from annual rainfall information, rainfall intensity distribution might contain the potential information for explaining high-episodic recharge events. The monthly rainfall distribution is plotted to compare the rainfall patterns in the region (Supplementary Figure 3). Analysis of rainfall intensity distribution and climatological indices is summarized in Table 2. It is observed that the years 1988, 1999, and 2000 are years when daily rainfall distribution is different from the mean CDF, and the number of La Niña months in those years is also high. In the years 1992, 1993, 2001, 2004, and 2005, a large number (≥5) of high intensity (>40 mm/day) rainfall can be contributing to extra recharge. These observations indicate that the anomalies in rainfall intensity distribution and climatological indices may contribute to high-episodic recharge; however, it requires a statistical method to test its significance.
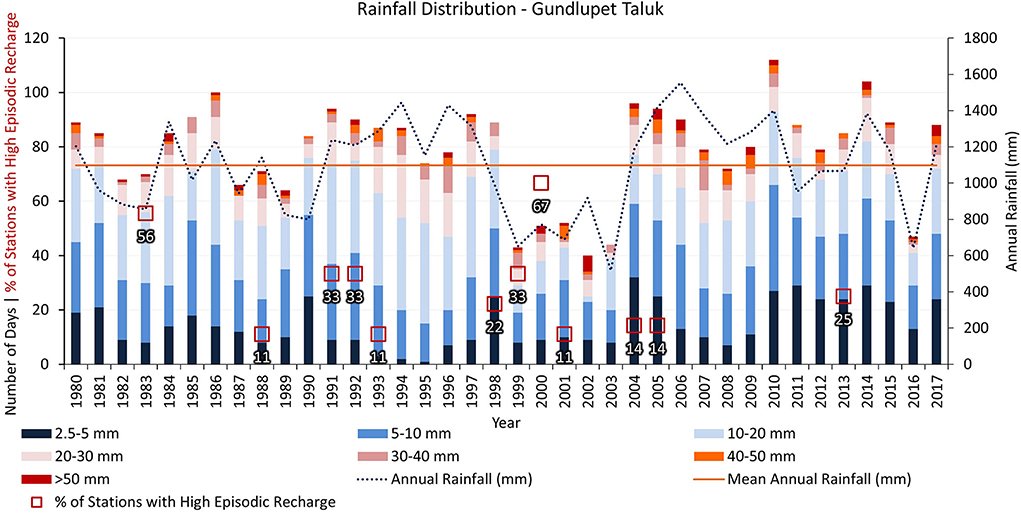
Figure 6. Rainfall distribution and high-episodic recharge events for Gundlupet Taluk.
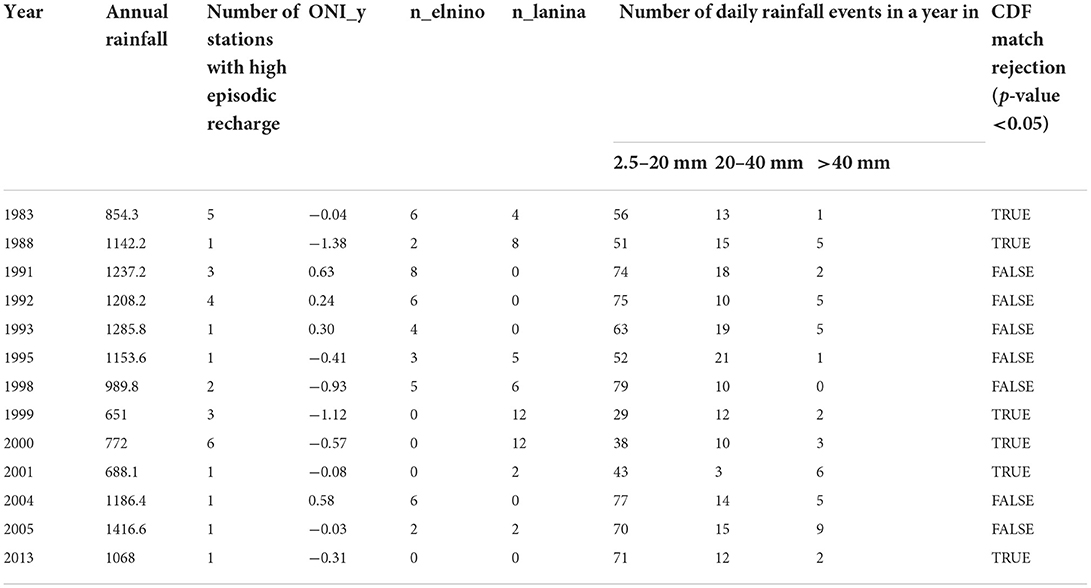
Table 2. Analysis of rainfall intensity distribution and climatological indices for high-episodic recharge years in Gundlupet taluk.
For Berambadi EWS, the location averaged annual recharge–rainfall plot is shown in Figure 7. The triangles represent the average of normal recharge events for each year from 2010 to 2019. The error bars correspond to the variability observed in recharge estimated for 150 locations within Berambadi EWS. Recharge events in the year 2017 are observed to be on the higher side for all 150 locations; however, based on the z-score criteria of≥1.96, 80 out of 150 locations are categorized as high-episodic recharge events as represented in the red circle. An insignificant number of locations in the years 2010 (1 OW) and 2015 (2 OWs) are categorized as highly episodic; hence, they are not considered for further analysis. The linear fit between the recharge–rainfall scatter plot for normal recharge events corresponds to a recharge factor of 4.42%, while the mean annual recharge factor is 8.4% for high-episodic recharge events identified in the year 2017 in the same region. 10% of OWs in Berambadi EWS exhibit higher recharge values with z-score≥1.645 (α = 0.1) in the year 2019; however, they are not considered high episodic as per the pre-defined criteria of z-score ≥1.96.
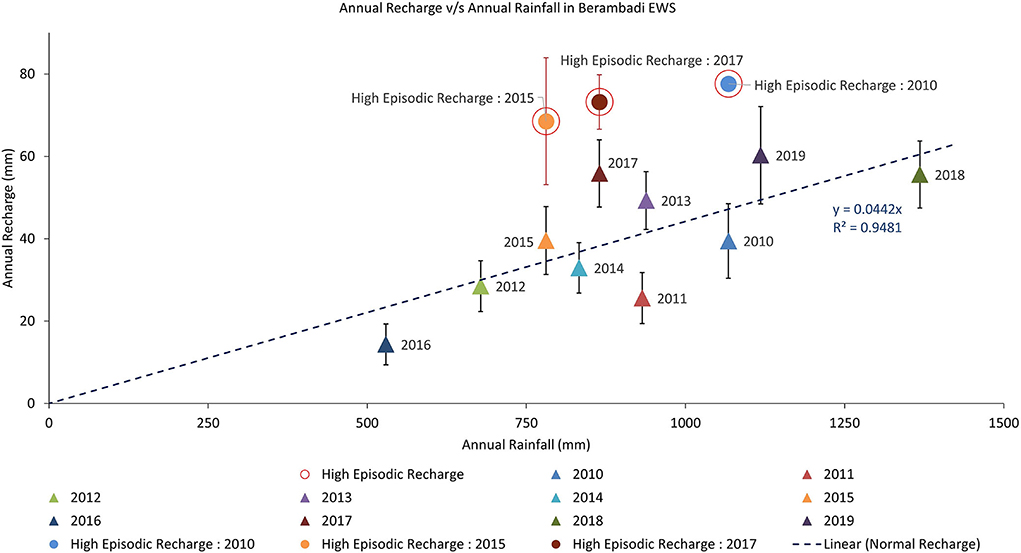
Figure 7. Annual recharge vs. annual rainfall variation in Berambadi EWS.
The results of the PIC analysis are summarized in Table 3. Daily rainfall intensities of 15–30 mm show significantly high PIC values for normal recharge events combined across all nine OWs in Gundlupet taluk and 150 OWs in Berambadi EWS. The PIC analysis of all high-episodic recharge events across nine OWs in Gundlupet taluk identified daily rainfall CDF, the number of days with 20–40 mm rainfall, and the number of La Niña months in that year as statistically significant predictors. The recharge associated with high-intensity rainfall can be indirect recharge, which is caused by percolation from ephemeral streams. Moreover, these ephemeral streams contribute to replenishing the dried-out tanks and lakes, which act as sources of indirect recharges as identified in previous studies (Barbiéro et al., 2007; Maréchal et al., 2009; CGWB, 2012a; Ruiz et al., 2015; Mondal et al., 2016; Robert et al., 2017; Riotte et al., 2018; Collins et al., 2020). In such scenarios, the indirect recharge can dominate direct recharge and result in high-episodic recharge events. These observations indicate that the combination of rainfall intensity distribution and climatology can favor the recharge process, which results in events of high-episodic recharge. The recharge information contained in identified predictor variables can be used in desegregating high-episodic recharge from normal recharge.
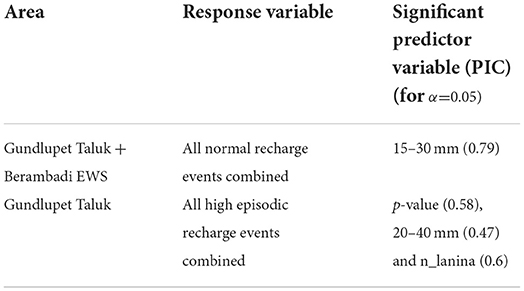
Table 3. Results of PIC analysis.
The analysis for high-episodic recharge events identified in Berambadi EWS showed no statistically significant predictor capability because of a lack of variability in predictor data. However, the observed high-episodic recharge in 2017 can be associated with strong La Niña (seven out of 12 months) in that year.
Long-term and high-spatial density recharge–rainfall analysis in the study area indicates that the recharge process in hard rock aquifers of tropical southern India is complex, and a linear recharge–rainfall-based approach, generally applied for short- and long-term groundwater level projections, may incur errors. Figure 8 demonstrates the simulated groundwater levels for the 10-year duration at B#133 in Berambadi EWS considering (Case-1) annual average recharge factor (4.4%) ignoring the high-episodic recharge events and (Case-2) model estimated varying recharge factor considering high-episodic recharge factors for the year 2017 (8.1%) and 2019 (5.5%). A significant deviation from the observed groundwater level is detected in Case-1 simulations from 2017 onwards (RMSE = 3.9 m). Case-2 simulations are able to capture the groundwater fluctuations and recovery during 2017 and 2019 (RMSE = 1.95 m). The simulated groundwater level at the end of April 2020 for Case-1 is 11.5 m deeper than the observed groundwater level, as the extra recharge occurring in 2017 and 2019 is neglected. This shows that the inclusion of high-episodic recharge events becomes critical while assimilating simulated groundwater levels for groundwater level forecast. Using annually averaged recharge factors for future projections can lead to biased and unrealistic groundwater levels, which are the basis of groundwater management and policymaking.
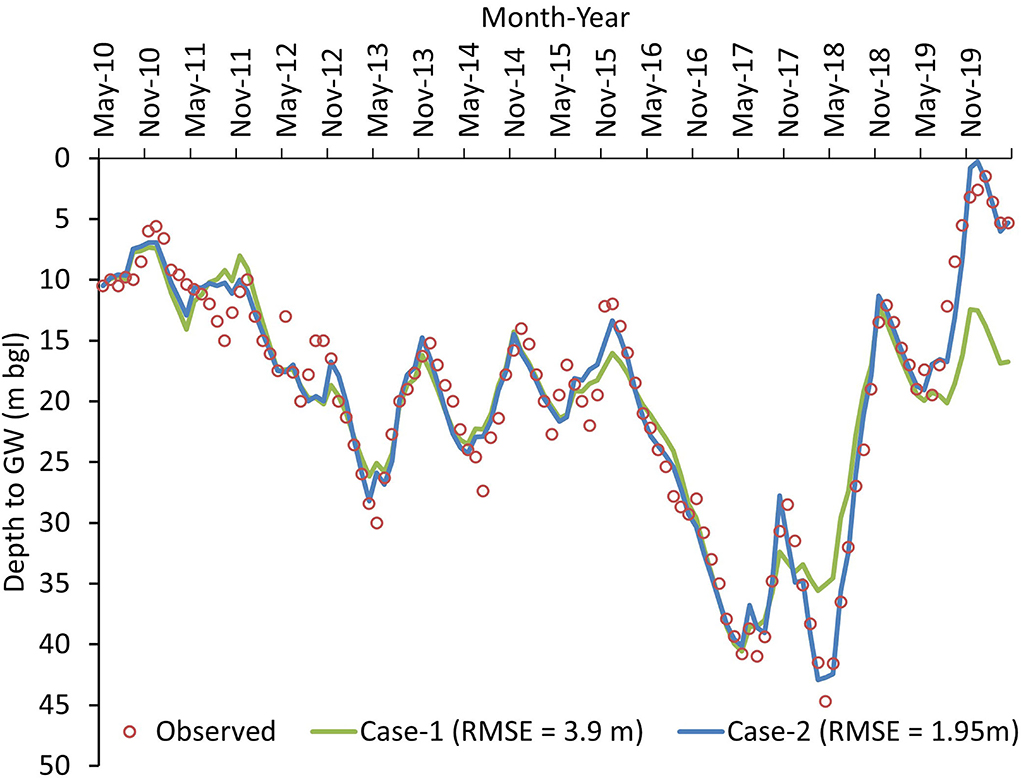
Figure 8. Comparison of simulated groundwater levels with considering constant recharge factor (Case-1) vs. high-episodic recharge factor (Case-2).
Conclusion
This study uses a calibrated and validated lumped unconfined aquifer model to estimate the groundwater recharge timeseries for nine OWs in Gundlupet taluk and 150 OWs in Berambadi EWS. It is to be noted that the model does not take into account the effects of evapotranspiration directly, hence being unable to capture non-linearities associated with evapotranspiration. Analysis of estimated recharge factors identified 30 high-episodic recharge events out of 292 observations (around 10%) in Gundlupet taluk and 80 out of 150 OWs in 2017 in Berambadi EWS. PIC analysis is used to select the statistically significant predictors from a potential set of predictor variables based on rainfall intensity distribution and climatological indices. PIC analysis revealed that the number of rainfall events with 15–30 mm daily rainfall intensity in a year are most significant for normal recharge events in Gundlupet taluk and Berambadi EWS (PIC = 0.79). Combined information on daily rainfall distribution, daily rainfall intensities of 20–40 mm, and the number of La Niña months in a particular year are able to explain the variability of high-episodic recharge events in Gundlupet taluk. These high-intensity rainfall events can facilitate alternate recharge pathways resulting in faster indirect recharge which dominates the diffused recharge resulting in high-episodic recharge events.
The findings of this study emphasize that rainfall intensity distribution and climatology are vital factors influencing groundwater recharge at an annual scale, which are usually not considered while projecting future groundwater levels. The study shows that negligence of this information can lead to unrealistic and biased groundwater level projections. More intense short-duration storms expected for future rainfall projections can result in more high-episodic groundwater recharge events. Rainfall intensity distribution and climatological indices have the potential to be used in disaggregating normal and extreme recharge factors for future rainfall projections. Prior knowledge of potentially higher groundwater recharge years is crucial for optimum water resource management and planning based on a more realistic and precise groundwater resource assessment.
Data availability statement
The data analyzed in this study is subject to the following licenses/restrictions. Groundwater and rainfall datasets are obtained from Karnataka state government departments and the Kabini Critical Zone Observatory team. SRTM-DEM and ONI are freely available online. Requests to access these datasets should be directed at: https://doi.org/10.5066/F7K072R7; https://origin.cpc.ncep.noaa.gov/products/analysis_monitoring/ensostuff/ONI_v5.php.
Author contributions
SG and MS: conceptualization, methodology, and writing (review and editing). SG: modeling, data analysis, and writing (original draft). Both authors have read and agreed to the published version of the manuscript.
Funding
SG is supported by the Prime Minister's Research Fellows (PMRF) scheme of the Ministry of Education, Government of India.
Conflict of interest
The authors declare that the research was conducted in the absence of any commercial or financial relationships that could be construed as a potential conflict of interest.
Publisher's note
All claims expressed in this article are solely those of the authors and do not necessarily represent those of their affiliated organizations, or those of the publisher, the editors and the reviewers. Any product that may be evaluated in this article, or claim that may be made by its manufacturer, is not guaranteed or endorsed by the publisher.
Supplementary material
The Supplementary Material for this article can be found online at: https://www.frontiersin.org/articles/10.3389/frwa.2022.960669/full#supplementary-material
References
Asoka, A., Wada, Y., Fishman, R., and Mishra, V. (2018). Strong linkage between precipitation intensity and monsoon season groundwater recharge in India. Geophys. Res. Lett. 45, 5536–5544. doi: 10.1029/2018GL078466
Banks, E. W., Cook, P. G., Owor, M., Okullo, J., Kebede, S., Nedwa, D., et al. (2021). Environmental tracers to evaluate groundwater residence times and water quality risk in shallow unconfined aquifers in sub Saharan Africa. J. Hydrol. 598, 125753. doi: 10.1016/j.jhydrol.2020.125753
Barbiéro, L., Parate, H. R., Descloitres, M., Bost, A., Furian, S., Kumar, M. S. M., et al. (2007). Using a structural approach to identify relationships between soil and erosion in a semi-humid forested area, South India. Catena. 70, 313–329. doi: 10.1016/j.catena.2006.10.013
Braun, J. J., Descloitres, M., Riotte, J., Fleury, S., Barbiéro, L., Boeglin, J. L., et al. (2009). Regolith mass balance inferred from combined mineralogical, geochemical and geophysical studies: Mule Hole gneissic watershed, South India. Geochim. Cosmochim. Acta. 73, 935–961. doi: 10.1016/j.gca.2008.11.013
Buvaneshwari, S., Riotte, J., Sekhar, M., Kumar, M. S. M., Sharma, A. K., Duprey, J. L., et al. (2017). Groundwater resource vulnerability and spatial variability of nitrate contamination: insights from high density tubewell monitoring in a hard rock aquifer. Sci. Total Environ. 579, 838–847. doi: 10.1016/j.scitotenv.2016.11.017
Carvalho Resende, T., Longuevergne, L., Gurdak, J. J., Leblanc, M., Favreau, G., Ansems, N., et al. (2019). Assessment of the impacts of climate variability on total water storage across Africa: implications for groundwater resources management. Hydrogeol. J. 27, 493–512. doi: 10.1007/s10040-018-1864-5
CGWB (2006). Dynamic Ground Water Resources of India. Available online at: http://cgwb.gov.in/Documents/Dynamic-GW-Resources-2004.pdf (accessed May 8, 2022).
CGWB (2008). Ground Water Information Booklet Chamarajnagar District, Karnataka. Available online at: http://cgwb.gov.in/District_Profile/karnataka/CHAMARAJNAGARA_BROCHURE.pdf (accessed May 8, 2022).
CGWB (2011). Dynamic Ground Water Resources of India. Available online at: http://cgwb.gov.in/Documents/Dynamic-GW-Resources-2009.pdf (accessed May 8, 2022).
CGWB (2012a). “Aquifer systems of India,” in Government of India, Ministry of Water Resources, Central Ground water Board (New Delhi), 22.
CGWB (2012b). Ground Water Information Booklet Chamarajnagar District, Karnataka. Available online at: http://cgwb.gov.in/District_Profile/karnataka/2012/CRNagar_BROCHURE2012.pdf (accessed May 8, 2022).
CGWB (2014). Dynamic Ground Water Resources of India. Available online at: http://cgwb.gov.in/documents/National~Dynamic-GW-Resources-2011.pdf (accessed May 8, 2022).
CGWB (2017). Dynamic Ground Water Resources of India. Available online at: http://cgwb.gov.in/Documents/Dynamic~GWRE-2013.pdf (accessed May 8, 2022).
Chakraborty, A. (2018). Preceding winter la Niña reduces Indian summer monsoon rainfall. Environ. Res. Lett. 13, 054030. doi: 10.1088/1748-9326/aabdd5
Chakraborty, A., and Singhai (2021). Asymmetric response of the Indian summer monsoon to positive and negative phases of major tropical climate patterns. Sci. Rep. 11, 22561. doi: 10.1038/s41598-021-01758-6
Collins, S. L., Loveless, S. E., Muddu, S., Buvaneshwari, S., Palamakumbura, R. N., Krabbendam, M., et al. (2020). Groundwater connectivity of a sheared gneiss aquifer in the Cauvery River basin, India. Hydrogeol. J. 28, 1371–1388. doi: 10.1007/s10040-020-02140-y
CRAN - Package ambhasGW (2017). Available online at: https://cran.r-project.org/web/packages/ambhasGW/index.html (accessed May 8, 2022).
Cuthbert, M. O., Taylor, R. G., Favreau, G., Todd, M. C., Shamsudduha, M., Villholth, K. G., et al. (2019). Observed controls on resilience of groundwater to climate variability in sub-Saharan Africa. Nature 572, 230–234. doi: 10.1038/s41586-019-1441-7
Dewandel, B., Lachassagne, P., Wyns, R., Marechal, J. C., and Krishnamurthy, N. S. (2006). A generalized 3-D geological and hydrogeological conceptual model of granite aquifers controlled by single or multiphase weathering. J. Hydrol. 330, 260–284. doi: 10.1016/j.jhydrol.2006.03.026
Dewandel, B., Perrin, J., Ahmed, S., Aulong, S., Hrkal, Z., Lachassagne, P., et al. (2010). Development of a tool for managing groundwater resources in semi-arid hard rock regions: application to a rural watershed in South India. Hydrol. Process. 24, 2784–2797. doi: 10.1002/hyp.7696
Favreau, G., Cappelaere, B., Massuel, S., Leblanc, M., Boucher, M., Boulain, N., et al. (2009). Land clearing, climate variability, and water resources increase in semiarid southwest Niger: a review. Water Resour. Res. 45, 0–16. doi: 10.1029/2007WR006785
Galle, S., Grippa, M., Peugeot, C., Moussa, B., Cappelaere, B., Demarty, J., et al. (2018). AMMA-CATCH, a critical zone observatory in West Africa monitoring a region in transition. Vadose Zone J. 17, 180062. doi: 10.2136/vzj2018.03.0062
Goswami, S., and Sekhar, M. (2022). “Estimation of specific yield of hard-rock aquifers in Upper Cauvery River basin region in India by application of AMBHAS-1D groundwater model,” in EGU General Assembly Conference. 1–2. doi: 10.5194/egusphere-egu22-9975
Guillaumot, L., Longuevergne, L., Marçais, J., Lavenant, N., and Bour, O. (2022). Frequency domain water table fluctuations reveal recharge in fractured aquifers depends on both intense and seasonal rainfall and unsaturated zone thickness. Hydrol. Earth Syst. Sci. Discuss. 1−38. doi: 10.5194/hess-2022-201
Kumar, S. (2012). Soil Moisture Modelling, Retrieval from Microwave Remote Sensing and Assimilation in a Tropical Watershed. Bangalore: Indian Institute of Science.
Lachassagne, P., Dewandel, B., and Wyns, R. (2021). Review: hydrogeology of weathered crystalline/hard-rock aquifers—guidelines for the operational survey and management of their groundwater resources. Hydrogeol. J. 29, 2561–2594. doi: 10.1007/s10040-021-02339-7
Leblanc, M., Favreau, G., Massuel, S., Tweed, S. O., Loireau, M., and Cappelaere, B. (2008). Land clearance and hydrological change in the Sahel: SW Niger. Glob. Planet. Change 61, 135–150. doi: 10.1016/j.gloplacha.2007.08.011
Legchenko, A., Descloitres, M., Bost, A., Ruiz, L., Reddy, M., Girad, J. F., et al. (2006). Resolution of MRS applied to the characterization of hard-rock aquifers. Ground Water 44, 547–554. doi: 10.1111/j.1745-6584.2006.00198.x
Li, L., Wen, Z., and Wang, Z. (2016). “Outlier detection and correction during the process of groundwater lever monitoring base on pauta criterion with self-learning and smooth processing,” in Communications in Computer and Information Science, eds L. Zhang, X. Song, and Y. Wu (Singapore: Springer Verlag), 497−503. doi: 10.1007/978-981-10-2663-8_51
MacDonald, A. M., Lark, R. M., Taylor, R. G., Abiye, T., Fallas, H. C., Favreau, G., et al. (2021). Mapping groundwater recharge in Africa from ground observations and implications for water security. Environ. Res. Lett. 16, 34012. doi: 10.1088/1748-9326/abd661
Machiwal, D., and Jha, M. K. (2015). GIS-based water balance modeling for estimating regional specific yield and distributed recharge in data-scarce hard-rock regions. J. Hydro-Environ. Res. 9, 554–568. doi: 10.1016/j.jher.2014.07.004
Maréchal, J. C., Dewandel, B., Ahmed, S., Galeazzi, L., and Zaidi, F. K. (2006). Combined estimation of specific yield and natural recharge in a semi-arid groundwater basin with irrigated agriculture. J. Hydrol. 329, 281–293. doi: 10.1016/j.jhydrol.2006.02.022
Maréchal, J. C., Murari, R., Riotte, J., Vouillamoz, J. M., Mohan Kumar, M. S., Ruiz, L., et al. (2009). Indirect and direct recharges in a tropical forested watershed: Mule Hole, India. J. Hydrol. 364, 272–284. doi: 10.1016/j.jhydrol.2008.11.006
Massuel, S., George, B. A., Venot, J. P., Bharati, L., and Acharya, S. (2013). Improving assessment of groundwater-resource sustainability with deterministic modelling: a case study of the semi-arid Musi sub-basin, South India S. Hydrogeol. J. 21, 1567–1580. doi: 10.1007/s10040-013-1030-z
Massuel, S., Perrin, J., Mascre, C., Mohamed, W., Boisson, A., and Ahmed, S. (2014). Managed aquifer recharge in South India: what to expect from small percolation tanks in hard rock?. J. Hydrol. 512, 157–167. doi: 10.1016/j.jhydrol.2014.02.062
Meert, J. G., Pandit, M. K., Pradhan, V. R., Banks, J., Sirianni, R., Stroud, M., et al. (2010). Precambrian crustal evolution of Peninsular India: a 3.0 billion year odyssey. J. Asian Earth Sci. 39, 483–515. doi: 10.1016/j.jseaes.2010.04.026
Mehrotra, R., Sharma, A., Nagesh Kumar, D., and Reshmidevi, T. V. (2013). Assessing future rainfall projections using multiple GCMs and a multi-site stochastic downscaling model. J. Hydrol. 488, 84–100. doi: 10.1016/j.jhydrol.2013.02.046
Moeck, C., Grech-Cumbo, N., Podgorski, J., Bretzler, A., Gurdak, J. J., Berg, M., et al. (2020). A global-scale dataset of direct natural groundwater recharge rates: a review of variables, processes and relationships. Sci. Total Environ. 717, 137042. doi: 10.1016/j.scitotenv.2020.137042
Mondal, A., Narasimhan, B., Sekhar, M., and Mujumdar, P. P. (2016). Hydrologic modelling. Proc. Indian National Sci. Acad. 82, 817–832. doi: 10.16943/ptinsa/2016/48487
Moulds, S., Buytaert, W., and Mijic, A. (2018). Data descriptor: a spatio-temporal land use and land cover reconstruction for India from 1960-2010. Sci. Data 5, 1–11. doi: 10.1038/sdata.2018.159
Owor, M., Taylor, R. G., Tindimugaya, C., and Mwesigwa, D. (2009). Rainfall intensity and groundwater recharge: empirical evidence from the Upper Nile Basin. Environ. Res. Lett. 4, 6. doi: 10.1088/1748-9326/4/3/035009
Park, E., and Parker, J. C. (2008). A simple model for water table fluctuations in response to precipitation. J. Hydrol. 356, 344–349. doi: 10.1016/j.jhydrol.2008.04.022
Perrin, J., Ferrant, S., Mussuel, S., Dewandel, B., Maréchal, J. C., Aulong, S., et al. (2012). Assessing water availability in a semi-arid watershed of southern India using a semi-distributed model. J. Hydrol. 460–461 143–155. doi: 10.1016/j.jhydrol.2012.07.002
Rao, B. R. (1962). A Handbook of the Geology of Mysore State, Southern India. Bangalore Printing and Publishing Company. Available online at: shttps://books.google.co.in/books?id=5IPnjwEACAAJ (accessed May 8, 2022).
Riotte, J., Meunier, J. D., Zambardi, T., Audry, S., Barboni, D., Anupama, K., et al. (2018). Processes controlling silicon isotopic fractionation in a forested tropical watershed: Mule Hole Critical Zone Observatory (Southern India). Geochim. Cosmochim. Acta 228, 301–319. doi: 10.1016/j.gca.2018.02.046
Robert, M., Thomas, A., Sekhar, M., Badiger, S., Ruiz, L., Raynal, H., et al. (2017). Adaptive and dynamic decision-making processes: a conceptual model of production systems on Indian farms. Agric. Syst. 157, 279–291. doi: 10.1016/j.agsy.2016.08.001
Ruiz, L., Sekhar, M., Thomas, A., Badiger, S., Bergez, J. E., Buis, S., et al. (2015). Adaptation of irrigated agriculture to climate change: trans-disciplinary modelling of a watershed in South India. IAHS-AISH Proc. Rep. 366, 137–138. doi: 10.5194/piahs-366-137-2015
Rusagara, R., Rusagara, R., Koïta, M., Plagnes, V., and Jost, A. (2022). Groundwater recharge pathways to a weathered-rock aquifer system in a dryland catchment in Burkina Faso. Hydrogeol. J. 30, 1489–1512. doi: 10.1007/s10040-022-02506-4
Sekhar, M., Rasmi, S. N., Javeed, Y., Gowrisankar, D., and Ruiz, L. (2006). Modeling the groundwater dynamics in a semi-arid hard rock aquifer influenced by boundary fluxes, spatial and temporal variability in pumping/recharge. Adv. Geosci. Hydrol. Sci. 4, 173–181. doi: 10.1142/9789812707208_0022
Sekhar, M., Rasmi, S. N., Sivapullaiah, P. V., and Ruiz, L. (2004). Groundwater flow modeling of Gundal Sub-basin in Kabini River Basin, India. Asian J. Water Environ. Pollut. 1, 65–77.
Sekhar, M., Riotte, J., Ruiz, L., Jouquet, P., and Braun, J. J. (2016). Influences of climate and agriculture on water and biogeochemical cycles: Kabini critical zone observatory. Proc. Indian Natl. Sci. Acad. 82, 833–846. doi: 10.16943/ptinsa/2016/48488
Sharma, A., and Mehrotra, R. (2014). An information theoretic alternative to model a natural system using observational information alone. Water Resour. Res. 50, 650–660. doi: 10.1002/2013WR013845
Sharma, A., Mehrotra, R., Li, J., and Jha, S. (2016). A programming tool for nonparametric system prediction using partial informational correlation and partial weights. Environ. Model. Softw. 83, 271–275. doi: 10.1016/j.envsoft.2016.05.021
Sharma, A., Wasko, C., and Lettenmaier, D. P. (2018). If precipitation extremes are increasing, why aren't floods? Water Resour. Res. 54, 8545–8551. doi: 10.1029/2018WR023749
Sharma, A. K., Hubert-Moy, L., Betbeder, J., Ruiz, L., Sekhar, M., and Corgne, S. (2016). “Crop identification using time series of Landsat-8 and RADARSAT-2 images: application in a groundwater irrigated region, South India,” in European Space Agency, (Special Publication) ESA SP, ed L. Ouwehand (Prague), 2−6.
Subash, Y., Sekhar, M., Tomer, S. K., and Sharma, A. K. (2017). A framework for assessment of climate change impacts on groundwater system formations. Sustain. Water Resour. Manag. 375–397. doi: 10.1061/9780784414767.ch14
Taylor, R. G., Todd, M. C., Kongola, L., Maurice, L., Nahozya, E., Sanga, H., et al. (2013). Evidence of the dependence of groundwater resources on extreme rainfall in East Africa. Nat. Climate Change 3, 374–378. doi: 10.1038/nclimate1731
Tomer, S. K., Al Bitar, A., Sekhar, M., Zribi, M., Bandyopadhyay, S., Sreelash, K., et al. (2015). Retrieval and multi-scale validation of Soil Moisture from multi-temporal SAR Data in a semi-arid tropical region. Remote Sens. 7, 8128–8153. doi: 10.3390/rs70608128
UNESCO (2022). Groundwater: Making the Invisible Visible. Available online at: https://unesdoc.unesco.org/ark:/48223/pf0000380721 (accessed May 8, 2022).
Zhou, X., Zhang, Y., Yang, Y., Yang, Y., and Han, S. (2013). Evaluation of anomalies in GLDAS-1996 dataset. Water Sci. Technol. 67, 1718–1727. doi: 10.2166/wst.2013.043
Keywords: groundwater, hard-rock aquifer, critical zone, tropics, South India, partial information correlation, episodic recharge
Citation: Goswami S and Sekhar M (2022) Investigation and evidence of high-episodic groundwater recharge events in tropical hard-rock aquifers of southern India. Front. Water 4:960669. doi: 10.3389/frwa.2022.960669
Received: 03 June 2022; Accepted: 30 August 2022;
Published: 04 October 2022.
Edited by:
Harrie-Jan Hendricks Franssen, Helmholtz Association of German Research Centres (HZ), GermanyReviewed by:
Ramanathan Alagappan, Jawaharlal Nehru University, IndiaPatrick Lachassagne, HydroSciences Montpellier, France
Copyright © 2022 Goswami and Sekhar. This is an open-access article distributed under the terms of the Creative Commons Attribution License (CC BY). The use, distribution or reproduction in other forums is permitted, provided the original author(s) and the copyright owner(s) are credited and that the original publication in this journal is cited, in accordance with accepted academic practice. No use, distribution or reproduction is permitted which does not comply with these terms.
*Correspondence: M. Sekhar, c2VraGFyLm11ZGR1QGdtYWlsLmNvbQ==