 Robert L. Miller
- Department of Civil Engineering, University of Louisiana at Lafayette, Lafayette, LA, United States
Introduction: Intensification of the hydrologic cycle induced by climate variability and landscape modification is expected to increase the frequency of extreme flood events. Multi-jurisdictional approaches to manage inland flood risks at watershed scales demand the ability to objectively assess not only future flood potentials, but to also set priorities based upon multiple factors such as the stream channels most sensitive to hydrologic stress.
Methods: This study presents a method to estimate flood hazard sensitivities to increasing stormwater runoff due to hydrologic intensification (e.g., urbanization, climate effects) on local and watershed scales. The method is demonstrated in the low-gradient inland watershed regions of southwestern coastal Louisiana, USA. Utilizing highly detailed numerical models from the Federal Emergency Management Agency (FEMA), absolute and relative flood sensitivities were calculated for 45 flood-prone stream channels in the Lafayette, LA region. Channel sensitivities to flood hazards induced by changes in the 10-yr (10% annual exceedance probability) flood flows were quantified by analysis of 485 scenarios developed using a downward counterfactual scaling strategy.
Results and discussion: Relying entirely upon publicly available numerical models and input datasets, the study revealed key information about the relationship between estimable hydraulic characteristics (e.g., conveyance, resistance, and flow) and absolute and relative flood hazard sensitivity measures on a per-channel basis. Information from the subset of detailed numerical models was efficiently leveraged to provide a regional map of relative flood sensitivities. The methodology is robust and can be applied in very general settings to address the concern of hydrologic intensification in practical flood risk management applications.
Introduction
Intensification of the hydrologic cycle occurs as a result of a variety of factors including land modification use (Sghafian et al., 2008), river engineering (Munoz et al., 2018), and climate change (Simpkins, 2017). An expected consequence of global hydrologic intensification is an increase in the magnitude of floods induced by an increase in extreme precipitation, particularly in wet climates as noted by Tabari (2020). Population growth further accelerates the expansion of urban landscapes into rural areas. This action generally increases the amount of impervious surface and stormwater runoff volumes while simultaneously increasing the risk of human exposure to flood hazards due to new developments intersecting with natural floodplain areas (Hemmati et al., 2021). It is also known that flood risk exposure disproportionately affects the most socially vulnerable communities (Tate et al., 2021), and hydrologic intensification has the potential to further exacerbate urban inequalities related to flood risks (Moulds et al., 2021).
Multi-jurisdictional efforts to manage flood risks at watershed scales (LWI, 2022), have the potential to counter the deleterious impacts induced by hydrologic intensification. However, the comovement of the various drivers of intensification presents a challenge of identifiability for flood risk managers. For example, a systematic increase in peak discharges in a certain watershed could imply inadequate stormwater regulation and enforcement, precipitation shifts due to climate change effects, or both. In the case of the Mississippi River, the nonstationary increasing discharge trend has been largely attributed to both climate drivers (i.e., atmospheric circulation) as well as river engineering activities (Munoz et al., 2018). Disentangling the relative impact of the various risk drivers is of practical concern for watershed and urban planning efforts (O'Donnell and Thorne, 2020). It is expected that different streams will exhibit various levels of flood hazard sensitivity, thereby motivating the need to pinpoint the streams most likely to respond to hydrologic change factors. Moreover, a common difficulty facing collaborative flood risk management initiatives relates to the following question: “how do we objectively pinpoint the most hydraulically sensitive streams?” Since hydrologic measurements themselves do not address such “what-if” type questions, and it is generally impossible to directly experiment by flooding real channels over vast watershed scales, such questions are formally addressed via mathematical/numerical simulation models of flood risk (Bates et al., 2020; Xing et al., 2021).
Mathematical modeling of flood risks is typically performed using one-dimensional (1D) and two-dimensional (2D) representations of the hydraulic and hydrologic (H&H) processes. The hydrologic simulator (e.g., HEC-HMS, Noah-MP) translates rainfall inputs into a runoff signal (Sarminingsih et al., 2019). The hydrological results (i.e., discharge rates) are then used as inputs for a hydraulic model (e.g., HEC-RAS, LISFLOOD-FP) which numerically describes the flood hazard response (i.e., flow, velocity, and water level) within the receiving stream channels (Parthkumar et al., 2022). The hydraulic models used by the Federal Emergency Management Agency (FEMA) in the United States (US) have primarily employed a one-dimensional approximation for floodplain hydraulics. One-dimensional models capture a high level of local details but they lack the spatial resolution of a more realistic two-dimensional representation of the floodplain system. Rapid advancements in airborne laser scanning technology (e.g., LiDAR) has recently made high-resolution digital topographic models (DTMs) widely available in the US (USGS, 2022). This development has provided a foundation for the successful deployment of two-dimensional hydrodynamic models on various scales ranging from local to continental (Bates et al., 2020). However, 2D models are computationally intensive and 1D models are quite capable of achieving adequate accuracy when utilizing high resolution DTM data (Vozinaki et al., 2017). Moreover, 1D models can be efficiently applied in practical settings requiring a high volume of numerical simulations (e.g., sensitivity analyses).
Flood processes in low-gradient basins (e.g., such as coastal Louisiana) also poses a unique set of challenges for numerical modeling efforts. Firstly, low-gradient channels do not exhibit a simple stage vs. discharge relationship. During flood events, the peak discharge often occurs significantly before the peak stage as channel storage increases downstream (Kennedy, 1984). This leads to the formation of strong hysteresis effects in the form of loops in the stage-discharge curve, as studied by Habib and Meselhe (2006). It is also not necessarily the case that a one-to-one relationship exists between channel stage and flood width. In low-gradient floodplains, when the stage in the channel begins to exceed bankfull elevation the variation in water surface elevation across a cross-section can be too large to ignore. Also, low-gradient floodplains tend to have shallow flow over larger areas compared to other floodplain types. When water recedes from the adjacent floodplains, the shallow flows in low-gradient floodplains may be impeded by micro-topographical features and dense vegetation which may contribute to variations in the water surface elevation within a cross section, as well as hysteresis effects in the observed hydrographs.
Sensitivity analysis in H&H flood risk models typically focuses on uncertainty analysis and parameter identification (Hall et al., 2005). Here, two broad classes of modeling-based sensitivity analyses are recognized:
1) Parametric sensitivity analysis which quantifies model response to changes in model parameter values.
2) Counterfactual sensitivity analysis which estimates the consequences of hypothesized changes to model inputs.
Parametric sensitivity analysis in H&H flood risk models focuses on uncertainty analysis and parameter identification purposes (Hamby, 1994; Hall et al., 2005). Flood model counterfactual sensitivity analysis focuses on “what-if” scenarios. Counterfactual sensitivity analysis is the exclusive focus of this current study.
Prior studies have documented the counterfactual sensitivity of flood risk to changes in climate and other system-wide effects. Panagoulia and Dimou (1997) modeled the flood sensitivity in the Mesochora catchment in Central Greece and found that all climate scenarios yielded larger flood volumes and greater mean peak flood values in response to increasing precipitation. Shrestha and Lohpaisankrit (2017) used bias-corrected outputs of General Circulation Models (GCMs) coupled with TOPMODEL and HEC-RAS H&H models to delineate additional 100-year flooded areas in the Yang River Basin under various emission scenarios. Prudhomme et al. (2013) performed a change factor-based sensitivity method to reveal the potential importance of various catchment properties in shaping the flood response to climate change. A HEC-RAS based approach was taken in a study by Feng et al. (2021) on urbanization-induced flood risk impacts. Using a high-resolution continental scale 2D model of the conterminous U.S., Wing et al. (2018) found that the FEMA flood maps underestimate 100-year flood exposure by a factor of 2.6–3.1 and that population and GDP growth alone is expected to significantly increase flood exposure in the US. Furthermore, using an enhanced version of the hydrodynamic flood risk model developed in Wing et al. (2018) coupled with climate models, Bates et al. (2020) predicted significant expansions in the US 100-year floodplain by 2050, and their figures showed that some of the largest increases expected to occur in the Louisiana Gulf coastal region. These studies demonstrate how powerful techniques can be leveraged to quantify the impact of climate factors on flood risks in absolute terms.
However, it remains unclear how to further extend these results down to local scales falling within the practical scope of regional flood risk managers. This is especially pressing in practical situations where resources/models may be extremely limited and climate models may not be readily available (Zischg and Bermudez, 2020). Additionally, there is a need to further develop practical screening methods capable of objectively identifying absolute and relative flood sensitivities to various types of hydrologic intensification on a per-stream basis.
The aim of this study was to develop a method to assess flood hazard sensitivity to local and regional hydrologic intensification factors on individual channels. In Section 3, the method is developed in the low-gradient inland watershed regions of southwestern coastal Louisiana, USA. Using publicly-available FEMA models, the analysis was restricted to a 10-year recurrence interval (24-h duration) storm event in order to control for the possible underestimations (e.g., due to incomplete description of backwater and inter-basin exchange processes) which may become dominant when analyzing larger, less-frequent floods in low gradient basins. Absolute and relative 10-year flood sensitivity measures are estimated via analysis of 485 scenarios prepared using a downward counterfactual discharge scaling strategy—i.e., a strategy wherein the discharge inputs are systematically worsened (i.e., increased) to reflect a steadily intensifying hydrological future condition. An aggregate flood sensitivity measure was also developed to provide a measure of the relative sensitivity of channels to local discharge intensification. Section 4 provides an analysis of the main results including key insights on the relationship between estimable hydraulic characteristics of channels and respective discharge-induced flood sensitivity. Section 5 provides a summary of the main findings and offers a discussion on the broader implications of the work, areas of future research, and final conclusions from the study.
Materials and methods
Study area description
The study area is located in the Gulf coastal region of southwestern Louisiana, USA (Figure 1). This area is bounded by the Louisiana/Texas border (Sabine River) on the west, and the Atchafalaya Basin on the east. Notably, the Atchafalaya Basin swamp is the largest freshwater swamp in the United States. The primary analysis focus area was selected as the Lower Mermentau/Vermilion River basin(s), whose hydrologic catchment areas are 6,664 and 5,217 sq. km. respectively. In this area, the land use is predominantly agricultural (≈60–65%) with the remainder consisting largely of impervious surfaces (wetlands and urban developed lands). The soils are primarily poorly drained and belong to the hydrologic soil groups (HSG) C and D. The land elevations are reflective of the low-gradient alluvial floodplain environment of the coastal Mississippi Delta with land and open channel slopes typically on the order of 0.1% or less.
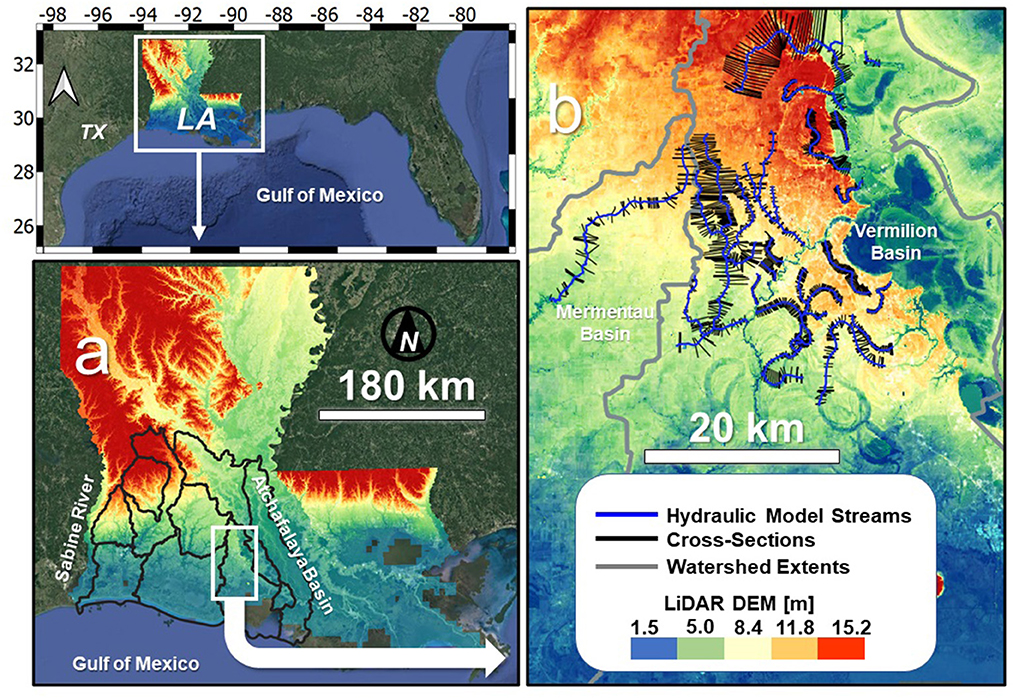
Figure 1. Location map: (a) hydrologic basins of southwestern Louisiana, (b) HEC-RAS numerical models in the Lafayette, LA primary focus area. The elevation datum is relative to the North American Vertical Datum of 1988 (NAVD 88).
As a result of the flat topography, the 100-year floodplains are extensive in this region with significant overbank flooding occurring during major rainfall events. Although this region is protected from the annual flood pulse of the Lower Mississippi/Atchafalaya River(s), shallow riverine flooding occurs frequently in this region due to the poorly drained soils and flat topography. Notably, a devastating flood affected the Vermilion Basin in August 2016 whose ±500 mm, 2-day rainfall approximated the 500-year (0.2% annual exceedance probability) project design flood (Brown et al., 2020). Other notable floods have occurred in the region including the floods of 1927, 1940, and 2001 (FEMA, 2018).
Vermilion basin, LA storm rainfall trends
The 10-year return period (24-h duration) was used in the analysis given its frequent use as the basis of practical drainage designs (LADOTD, 2011). The current 10-year (10% AEP) annual maximum was 196 mm sampled at a centrally located National Oceanic and Atmospheric Administration (NOAA) Atlas 14 station in Lafayette, LA (−91.9985 longitude, 30.2302 latitude) (NOAA, 2022). A simple analysis of descriptive statistics and 10-year rainfall trends was also conducted on rain gauge records available within the study area. A total of four gauges were evaluated with locations at Crowley, Abbeville, Lafayette, and Grand Coteau, LA respectively. Gauge data starting in 1891 were analyzed by identifying 10-year maximums of the daily rainfall timeseries for each decade at each respective location (Figure 2). Upon removal of the historic 1940 event outlier, a total of 145,215 data points were analyzed across the four-gauge locations and a mean 10-year maximum rainfall amount of 205.6 mm was obtained (Figure 2). This mean value is slightly higher than the NOAA Atlas 14 design storm but falls well within the published 90% confidence interval (172, 226 mm). However, notable increasing trends in the 10-year annual maximum daily rainfall were observed at all four locations. A mean slope of +0.59 mm/year for the 10-year event linear trendline was observed over the four gauges with a maximum slope of +0.73 mm/year computed for the Lafayette, LA gauge location. These findings are consistent with a recent study by Waldon (2019) which found a doubling in the number of heavy rainfall days in the study region compared to the early 1900's. The modeling approach described in the forthcoming sections utilizes physically-based hydrologic and hydraulic numerical models which can be easily adapted to include forecasts of upper maximal rainfall depths.
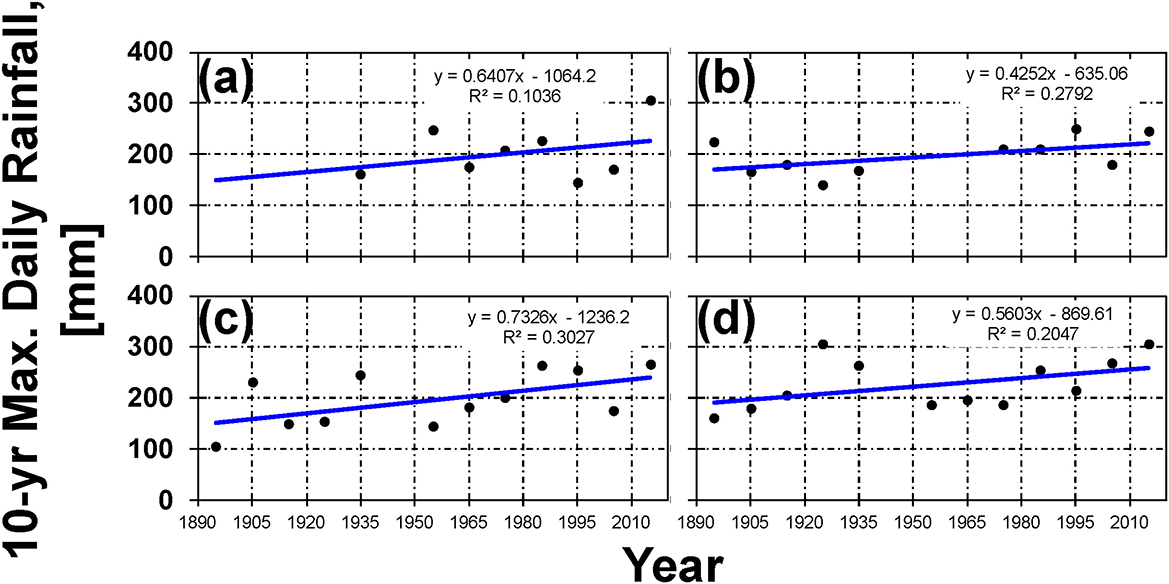
Figure 2. Rainfall trends for (a) Crowley, (b) Abbeville, (c) Lafayette, and (d) Grand Coteau in Louisiana.
Hydraulic and hydrologic modeling
A local flood study of Lafayette Parish, LA published by the Federal Emergency Management Agency (FEMA) in 2018 was used as the basis of the analysis (FEMA, 2018). The hydrologic and hydraulic numerical models were obtained from the effective FEMA 2018 flood study for Lafayette Parish, LA. The numerical models utilized detailed methods consisting of a lumped hydrological model (HEC-HMS) which simulates rainfall runoff (discharge) from local catchments which is then passed to a hydraulic model (HEC-RAS v3.1.3) in the form of an inflow boundary condition. The hydrologic models generally used the Soil Conservation Service (SCS) curve number (CN) method to estimate event-based losses, and velocity-based travel times (e.g., Manning's equation) to parametrize the SCS unit hydrographs. Although the hydraulic models are strictly one-dimensional (1D) in their geometric approximation of the hydraulics, they capture a very high level of details (e.g., bridges, culverts, narrow obstructions, interbasin exchange, and surveyed channel cross-sections). Such local details are typically ignored in regional or continental-scale 2D models (Bates et al., 2020). The 1D hydraulic models (referred to hereinafter as the FEMA models) have also undergone several rounds of review by the local engineering community and stakeholders as a part of the FEMA flood map production workflow and hence represent the best available flood hazard information for their respective study reaches. The FEMA models generated longitudinal water surface profiles along each study reach for the 10-, 50-, 100-, and 500-year peak flood conditions. Altogether, the FEMA models used herein included 45 study reaches with a total length of 243.3 km, and an average study reach length of 4.9 km. The model outputs produced mean 100-year peak channel velocities of 0.63 ± 0.05 m/s (mean ± standard error, SE), and mean 100-year overbank floodplain depths of 0.65 ± 0.13 m (peak water surface elevation minus bankfull elevation) across the 45 study reaches. The 10-year channel velocity values were 0.60 ± 0.04 m/s, with mean 10-year overbank floodplain depths of 0.22 ± 0.14 m. A total of 8 study reaches used the steady state approach which simulates the peak high-water mark along the reach as a snapshot in time. The remaining 37 study reaches used the unsteady (time-varying) approach to simulate the 10-year flooding conditions.
Discharge sensitivity scenarios
The FEMA models were used to develop simulation scenarios for the 10-year 24-h event. Hydrologic sensitivity was defined as the rate of change of various flood hazard factors with respect to the peak discharge, Q10 (m3/s). For convenience, the flood hazard factors in this study consisted of (1) maximum 10-year water surface elevation H10 (m) relative to a geodetic datum, and (2) 10-year maximum channel top width W10 (m). The maximum top width when multiplied by the length of the study reach provides a measure of the extent of the flooded areas (flooded zones). After completion of the initial (existing conditions, i = 0) simulations, a series of scenarios were constructed. In the absence of climate models, a downward counterfactual approach was applied to the 10-year event. Similar to the approach taken by Zischg and Bermudez (2020), the downward counterfactual approach in the present context consisted of perturbations of the 10-year flood by a systematic worsening of the design flood and comparison to its counterfactual to estimate the sensitivity to changes in the hazard at various levels of discharge. This was achieved in the present study by analyzing incremental increases in the Q10 inputs. A fixed increment was selected as ΔQ10 = 0.1Q10 and the discharge hydrographs/peak flow boundaries were scaled accordingly to produce the range of 1.0Q10, 1.1Q10, …, 1.9Q10, 2.0Q10for a total of 11 scenarios for each study reach. The downstream boundary conditions were generally normal depth or fixed water surface elevation and the base values remained unchanged across the scenarios. The 11 scenarios led to a total of 11 × 45 = 495 reach simulations yielding model outputs for peak water surface elevations H10 and peak top widths W10 at each computational output node (channel cross-section) of each study reach.
The numerical simulation scenarios yielded a sequence of outputs (H100, H101, …, H1010) and (W100, W101, …, W1010) from which the derivative-based sensitivities could be computed via finite difference quotients. The 10-year flood derivative-based sensitivities (S10) were computed as follows:
For each scenario i = 1, …, 10 and
For peak water surface elevation and top widths respectively. Here, total derivatives are employed since total changes are being measured by the derivatives—without holding either of the other sensitivity variables constant in each case.
It was hypothesized that the relative sensitivity of the flood hazard factors would depend on hydraulic characteristics of particular study reaches. To evaluate this hypothesis, the incremental flood hazard changes ΔH10i and ΔW10i were grouped into categories based on the k-index (defined as Kc/Ktotal where K is the conveyance measured at the 10-year peak water surface elevation—taken as the mean value over all cross-sections within a given modeled stream), Manning's n of the main channel nc, and the peak 100-year discharge for the base condition denoted by Q100. The average values of the incremental hazard changes across all study reaches were calculated for each scenario 1, 2,…,10, for the different groupings. The significance of the categorical variables is described next. The k-index, defined as Kc/Ktotal provides a measure of the relative amount of hydraulic conveyance , being carried by the main channel in a compound channel having distinct channel and overbank sub-regions and measured at the 10-year peak water surface elevation. Here A is the wetted cross-sectional area (m2), and R is the hydraulic radius (m). The k-index can be thought of as a rough measure of the “confinement” of the conveyance to the main channel, with a k-index of 1.0 corresponding to 100% of the conveyance occurring inside the main channel of a compound cross-section. The Manning's nc measures the resistance of the main channel (e.g., due to channel irregularities, flow obstacles, and vegetation within drainage channels) and is a primary variable of focus for municipal drainage managers. The peak 100-year discharge Q100 provides a relative measure of the magnitude of the contributing drainage area with larger flow rates generally corresponding to larger contributing catchment areas and larger channels.
Aggregate relative flood sensitivity measure
To summarize the aggregate sensitivity relative to unit increases in discharge with respect to multiple hazard factors, a sensitivity measure SUD was developed. It was expected that the response of the water surface profile to a unit increase in the channel discharge would be smaller in magnitude compared to the unit response of the floodplain width given the relatively expansive floodplains in the study region. However, the local flood damage-prevention ordinances and federal FEMA regulations in the U.S. typically place more weight on impacts to the peak water surface elevation—hence the focus on maintaining a “no-rise” condition in peak flood heights (Archives, 2022). As such, an aggregate sensitivity index reflective of the larger significance of the relatively smaller sensitivity of the peak water surface profile was sought. The general measure thusly adopted was a generalized harmonic mean:
Here, SUD is the aggregate flood sensitivity induced by a unit increase in discharge (s/m3), Yi is generic flood hazard factor indexed by i = 1, …, n, αi is a weight (α1 + α2 + … + αn = 1), and τi is a critical damage threshold. In the current study, n = 2, Y1 = H10, Y2 = W10, and equal weights were taken for simplicity, (i.e., ). Thus, the specific form of the aggregate sensitivity index used in this study was as follows:
The critical damage thresholds were selected as τ1 = 0.15 m (6 inches), and τ2 = 32 m. In practical terms the τ1 value corresponds to 50% of a typical freeboard requirement in south Louisiana, and τ2 is approximately the width of a 0.1 ha (0.25 ac.) square residential lot which is not uncommon for single family homes in the region. The damage thresholds used herein were selected out of convenience to correspond with increases in flood hazards which would be clearly perceived by a typical property owner as damaging—i.e., six inches of water in the home, or inundation of the entire yard. To motivate a physical interpretation of the SUD factor, consider the case where a channel exhibits the following sensitivities: 0.15 m/(m3/s) and 32 m/(m3/s). In this hypothetical case a unit increase (1 m3/s) in 10-year discharge exactly produces a 0.15 m increase in the water surface elevation and a 32 m expansion of the floodplain on average. In this special case where the sensitivities exactly equal the critical thresholds, SUD = 1.0. Conversely if the sensitivities were exactly double their respective critical thresholds, SUD = 2.0 and so forth. Thus the SUD reflects the aggregate sensitivity of a given channel to a unit increase in discharge relative to critical damage thresholds. It provides an indirect measure of the likelihood that a unit increase in discharge on a given channel would generate objectionable increases in the flood hazard. Clearly, channels that respond more readily to unit increase in discharge would have larger sensitivity derivatives which would lead to large relative values of SUDi. The threshold values, flood hazard variables, and 10-year design storm were selected in this study for convenience. However, the general method can be easily extended to other thresholds, variables, and design storm scenarios germane to different geographical regions.
Results
Absolute sensitivity to regional runoff changes
An analysis of the absolute change in peak flood widths ΔW10,i and depths ΔH10,i at each increment (ΔQ10,i = 0.1Q10) was made to quantify each channel's response to stepwise (10, 20%, etc.) amplification of their respective discharge inputs. This facilitates an assessment of the absolute flood sensitivity to changes in the overall discharge regime. Iconic examples of such overall regime changes include regional factors such as increases in storm rainfall intensity or land-use changes (e.g., urbanization) occurring throughout contributing watershed(s). Although the focus taken here was on flood intensification inversely, the beneficial effects of regional flood mitigation factors (e.g., detention and stormwater reclamation) could also be informed by analyzing the absolute responses to discharge regime changes.
The results indicated that the absolute response to changes in the overall discharge regime varied with local hydraulics of the channel. Increases in the flood widths were relatively constant across the discharge intensification scenarios for a given k-index (Kc/Ktotal) with a slight decreasing trend in ΔW10 with increasing discharge (Figure 3). Channels with a greater percentage of the conveyance occurring in the overbank areas also experienced a relatively larger absolute increase in flood widths compared to more confined channels. Smoother channels (nc ∈ [0.02, 0.034]) experienced the largest increases in flood widths (32.5 ± 2.1 m) in contrast with the roughest channels (nc ∈ [0.065, 0.09]) which increased by 6.6 ± 1.6 m on average. Across the different resistance categories, the width sensitivity generally decreased as discharge increased incrementally with the increases being most pronounced when discharge increased from Q10,0 to Q10 4 = 1.4Q10,0. With respect to the base flood 100-year discharge Q100, the top width increases were tightly clustered for all the classes Q100 ∈ [10, 199] with a general decreasing trend with a mean of 21.9 ± 3.6 m for Q10,i > 1.4Q10,0. In contrast, channels within the largest discharge class exhibited a generally increasing trend in ΔW10 with a mean increase of 49.1 ± 6.0 m for each 10% amplification of the discharge inputs. The overall mean increase in ΔW10 was 21.8 ± 0.5 m (mean ± SE) across the 45 study reaches.
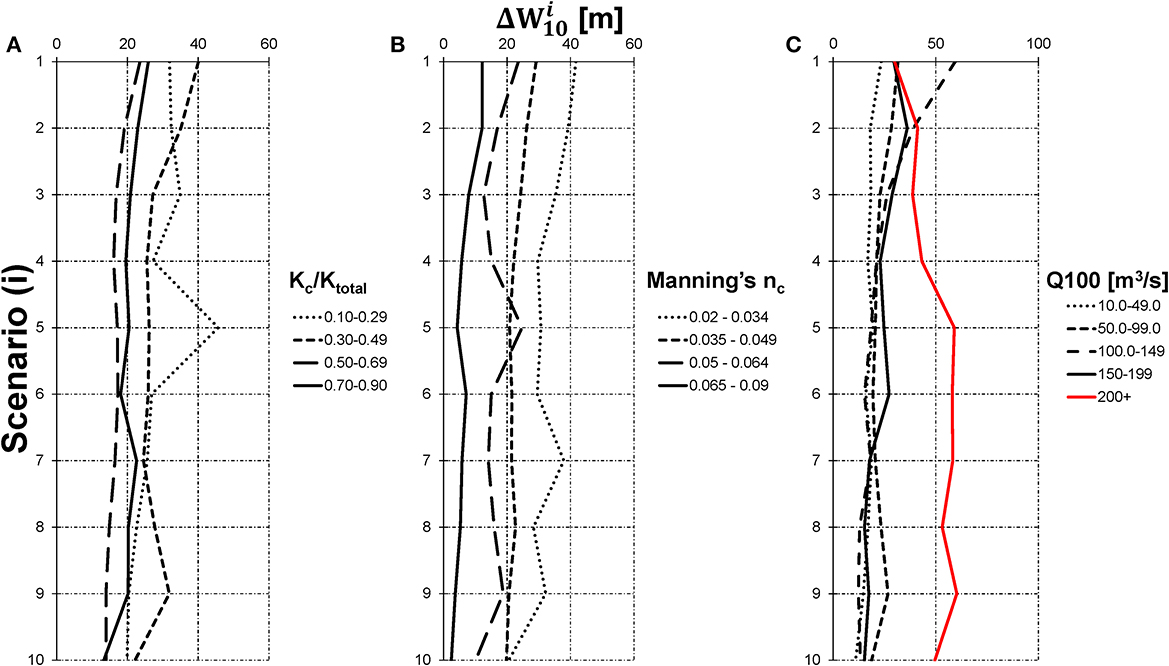
Figure 3. Peak flood width absolute incremental sensitivity grouped by (A) k-index, (B) main channel resistance, (C) 100-year peak discharge for scenarios 1, 2,…,10.
With respect to changes in flood depth ΔH10,i, a generally decreasing trend was noted across all the different hydraulic categories with a mean value of 0.06 ± 0.002 m over all study channels (Figure 4). The more confined channels experienced the largest increases in ΔH10 compared with channels that were relatively unconfined. The smoothest channels (nc ∈ [0.02, 0.034]) also experienced the largest increases in flood depths (0.08 ± 0.002 m) in comparison with the roughest channels (nc ∈ [0.065, 0.09]) which increased by 0.06 ± 0.005 m on average for each 10% amplification in the respective discharge regime. Notably, the largest absolute increases in ΔH10 values were associated with channels falling within the largest discharge class of the study (). A notable point here is that the channels in the largest discharge class also tended to coincide with lower channel resistance a higher percentage of the conveyance occurring in the main channel.
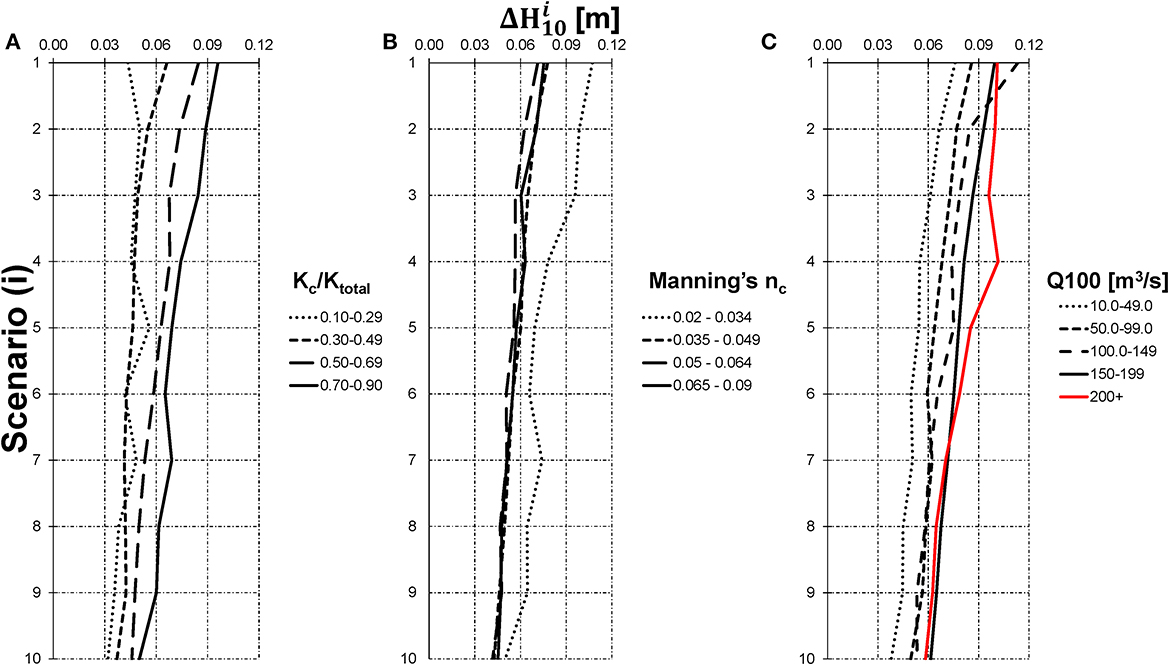
Figure 4. Peak flood height absolute incremental sensitivity grouped by (A) k-index, (B) main channel resistance, (C) 100-year peak discharge for scenarios 1, 2,…,10.
Relative sensitivity to local runoff changes
The discrete sensitivity derivatives were computed with respect to peak flooded top widths and depths and incorporated into the aggregate SUD factor. The results show the existence of an inverse relationship between SUD and Q100. This relationship demonstrates that channels having a smaller Q100 were more sensitive to unit increases in the peak discharge in comparison with channels possessing a larger Q100. The inverse relationship between relative sensitivity and magnitude of peak discharge can be illustrated by considering a real-world example in which two channels are compared—channel A which has a peak discharge of 10 m3s−1 and channel B having a peak discharge of 1,000 m3s−1. The addition of a single unit of runoff produces a 10% increase in the discharge of channel A, but only produces a 0.1% increase in the discharge of channel B. Unsurprisingly, the hydraulic impact of a unit increase in discharge should be more pronounced in channel A compared to channel B, and this relationship should hold in general. In this study, the inverse relationship was described by the following best-fit power function (R2 = 0.70) for all study reaches (Figure 5A):
A further decomposition for different ranges of k-index demonstrates that similar inverse sensitivity relationships hold for different hydraulic conditions (Figure 5B).
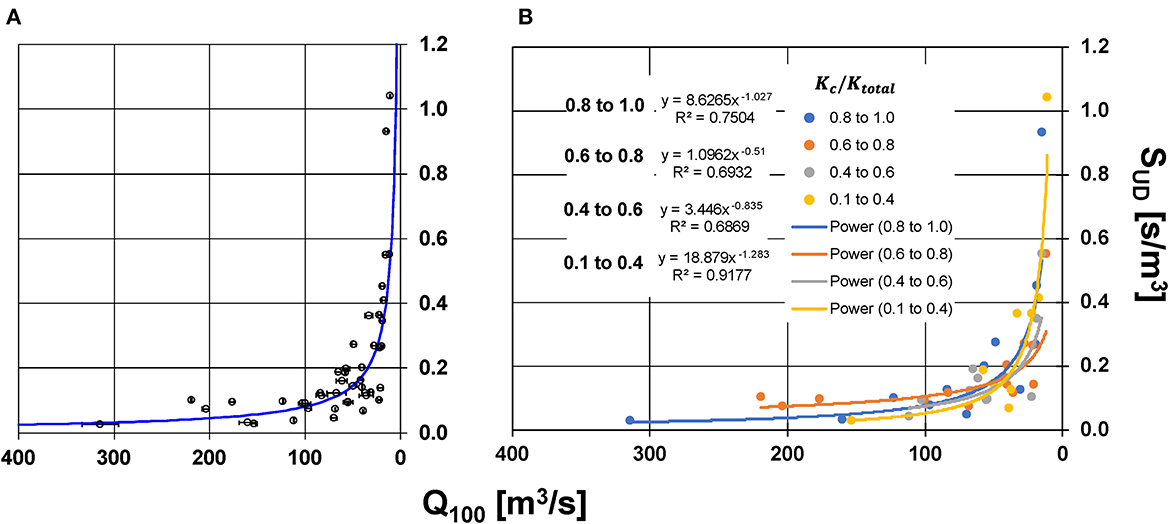
Figure 5. Relationships between Q100 (100-year 24-h reach-averaged peak discharge) and aggregate relative flood sensitivity measure SUD. (A) Plot of the overall inverse relationship between Q100 and SUD for the study channels where horizontal bars denote the standard errors of Q100. (B) Plot of the inverse relationships disaggregated into different classes based on the k-index.
Regionalization of relative sensitivity to local runoff
To further illustrate the practical utility of the SUD vs. Q100 power relationship, the best-fit equation was used to extrapolate the relative sensitivities for the entire SW LA region. The basic procedure required as inputs (1) a channel network for the region, and (2) estimates of Q100 for each channel within the network. Estimates of Q100 were obtained from the following variant of the regional regression peak discharge relationship for SW LA (Mason and Sumioka, 2001):
Here, DA is the contributing drainage area, where is dimensionless bed slope, AP is the mean annual precipitation, and θ1 and θ2 are applicable SI unit conversion constants. The High-Resolution National Hydrography Dataset Plus (NHDPlus HR) was utilized to provide the stream network (USGS, 2019). The NHDPlus dataset also provided additional “value added” hydrographic attributes (McKay et al., 2012), which included estimates of DA and parameters for each stream. The discharge was computed for each NHDPlus stream by applying the regression formula. The resulting discharge values were used to estimate the relative sensitivities SUD across the SW LA region using Equation 5 with . The minimum cutoff threshold of 3 m3s−1 was applied for the sake of clarity (note that this peak discharge corresponds with SUD ≈ 1.6), since SUD becomes unbounded for peak discharges in a neighborhood of zero. Overall, the process resulted in a mapping of the relative flood sensitivities across the entire region (Figure 6). Although the standard errors for the regional regression equation were relatively large (±53%), the extrapolation procedure provides a straightforward way to estimate and visualize flood sensitivity on a regional scale. Such a tool could then be used in initial planning/screening efforts—e.g., when ranking and prioritizing study reaches or pinpointing streams/watersheds which are most sensitive to unit/local discharge increases. Table 1 provides a summary of the aggregate sensitivities of the SW LA study basins. Here, the Vermilion Basin exhibited the largest mean relative sensitivity (0.68 s/m3) amongst the basins in SW LA.
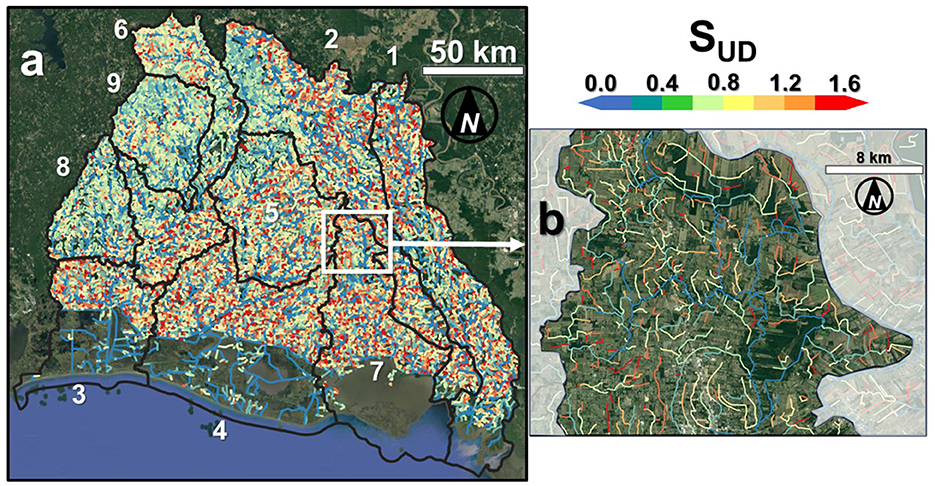
Figure 6. Relative flood sensitivities across southwestern Louisiana derived using NHDPlus streams and the power relationship in Equation 5. (a) Entire region, and (b) subset of the upper Vermilion basin. Numbers 1–9 in (a) correspond with basin IDs.
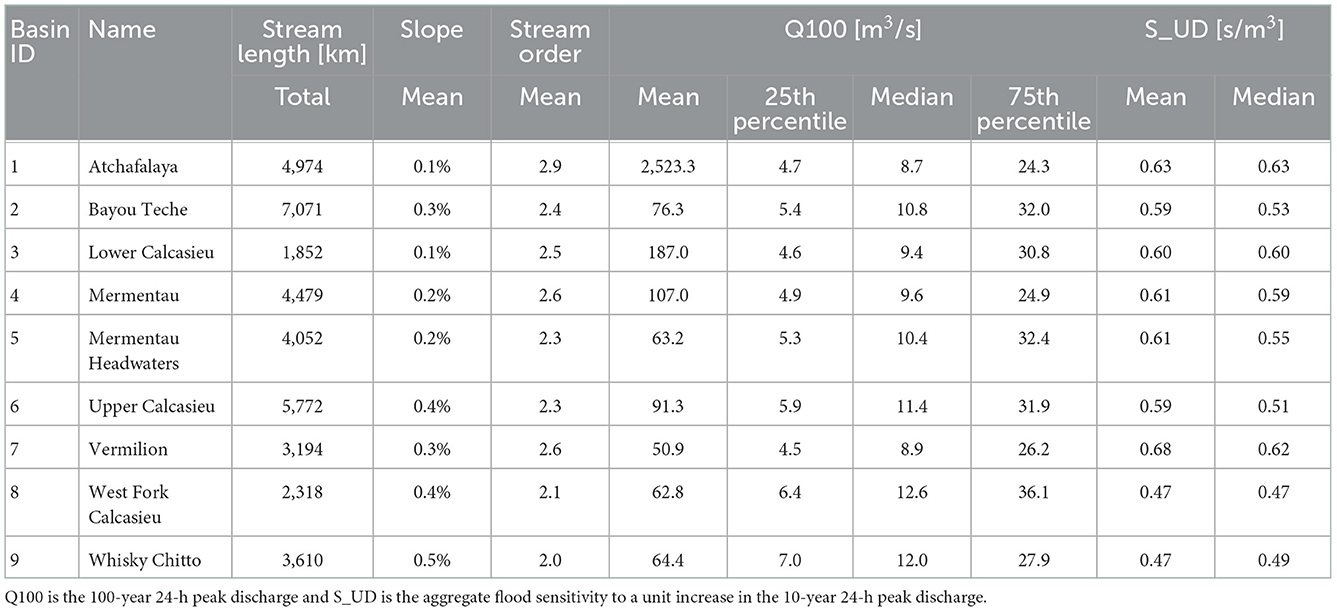
Table 1. Southwestern LA basin characteristics and relative flood sensitivities based on the results shown in Figure 6.
Discussion
Significance of hydraulic characteristics and sensitivity measures
The results indicated that the reaches with less flow resistance (e.g., engineered channels) exhibited a more drastic increase in absolute flood heights and widths as a result of changes to the overall discharge regime. Similarly, a greater absolute flood response of relatively higher-discharge channels to region-wide intensification was also noted. In this study, lower resistance in the main channel tended to correspond with higher overall peak discharge which is generally directly proportional to the contributing area. This study shows that regional hydrologic intensification (e.g., due to urbanization or climate effects) increases absolute flood hazards in the downstream reaches of the watershed. This finding is consistent with the work by Bates et al. (2020), which indicated that downstream portions of the Mississippi River Basin (notably Louisiana) experienced the largest absolute increases in flooded areas under future (intensified) climate simulation scenarios.
In comparison to smaller channels, the results indicated that the larger channels exhibited a larger absolute increase in flood hazards when subjected to the same percentage increase (i.e., amplification factor) in discharge inputs. Intensification of storm rainfall is an iconic example of a discharge amplification factor acting on a watershed scale (Waldon, 2019). The implication is that channels with a larger contributing area may be more sensitive to regional intensification in comparison with channels having a smaller contributing area. However, the opposite holds true when considering the (derivative-based) relative sensitivity, wherein larger streams were shown to be significantly less sensitive in comparison with smaller streams in terms of their relative response to a unit change in discharge. This exposes a pitfall, in which total reliance on derivative-based (relative) sensitivities may tempt one to conclude that future flood risks will evolve more slowly on larger channels in comparison with smaller channels. And while this might occur in special cases—e.g., in areas where future development pressure concentrates around smaller channels—the present study did not support the general conclusion. Perhaps a more accurate interpretation of derivative-based sensitivity is that it provides a measure of the relative response of individual channels when subjected to the same (e.g., unit) increase in discharge. These findings highlight the value of evaluating multiple measures of flood sensitivity—a point which was also highlighted by Zischg and Bermudez (2020).
Subjectivity of the term sensitivity
The preceding results indicate that different definitions of the term flood sensitivity can lead to vastly different conclusions in general. To further illustrate, one may consider an intuitive notion of sensitivity not analyzed in this study: sensitivity as synonymous with likelihood of flood occurrence. In such a case, one may plausibly assume that the channels with deeper overbank floodplains (for a specific frequency) should be the most likely to flood and hence, most sensitive to flooding. Hence, improvements of the main channel such as concrete-lining, dredging, or removal of obstructions should produce a less sensitive channel. However, the channel improvements should also lead to a higher k-index (by design). Such a channel should be able to assimilate a unit increase in peak discharge more efficiently when compared to the unimproved case. I.e., in terms of the definitions used in this study, the improved channel would have a lower relative (derivative-based) flood sensitivity when compared to the unimproved (base) condition. However, it does not immediately follow that such an improved channel is less susceptible to absolute increases in flood hazard due to system-wide shifts in hydrological drivers (e.g., climate change). Moreover, it could happen that an improved channel increases the amount of developable area which increases the likelihood of future development occurring closer to the channel—on a regional scale. This would enhance the expected volume of discharge produced by the contributing areas draining into the improved channel. Such regional changes could inadvertently lead to an unexpected intensification of the absolute flood hazard along the ostensibly less sensitive, improved channels. The preceding example highlights the importance of establishing specific and measurable definitions of flood sensitivity to ensure consistent interpretations amongst stakeholders in specific flood risk management applications.
Hydrologic intensification and future flood risk
Quantification of the effects of hydrologic intensification on future flood risk exposure is a topic of considerable interest to risk managers (Wing et al., 2018). In addition to identification of the most flood-sensitive channels, this study demonstrated a declining flood depth sensitivity and a relatively constant flood width sensitivity with increasing discharge. This finding suggests that future hydrologic intensification may exert a stronger impact on flood extents with lesser impacts on flood heights in low-gradient basins similar to southwestern Louisiana. The generic flow scaling approach taken in this study also permits an interpretation of a wide range of possible intensification mechanisms which are by no means limited to climate variability. In addition to urbanization (Feng et al., 2021), another possible factor could be flood mitigation (e.g., river engineering and modification of upstream drainage pathways). Munoz et al. (2018) studied the combined downstream effects of climate controls and river engineering and concluded that engineering accounted for 75% of the flood magnitude increase on the Mississippi River. Inversely, the sensitivity analysis developed in this study can also be repurposed as a means of targeting areas most likely to benefit from local flood runoff reduction/deintensification strategies (e.g., regional detention) (FEMA, 2022). Hence, the novel methodology developed in this study is quite flexible in scope and can be leveraged by risk managers to meet a diverse set of objectives.
Conclusions
Main findings
This study demonstrated a novel methodology to assess absolute and relative flood sensitivity on the basis of individual channels during the 10-year flood event. A total of 485 channel scenarios were developed using fully detailed and efficient one-dimensional HEC-RAS FEMA models (primarily unsteady). Although simple, the FEMA models represent an industry standard in understanding flood risks on a local scale (Wing et al., 2022). The simulation scenarios in the present study were constructed by systematically increasing the 10-year design storm discharge inputs in a downward counterfactual manner similar to the method developed by Zischg and Bermudez (2020). Absolute changes on the order of 0.06 m for flood heights and 21.9 m for peak flood widths occurred for each incremental ΔQ = 0.1Q10 increase in the respective 10-year discharge inputs in the study channels.
It was found that the absolute flood sensitivity varied with Manning's n roughness parameter, k-index, and the 100-year peak discharge. Channels with lower main channel resistance nc and higher k-indices experienced a larger absolute increase in flood heights for every 10% incremental increase in the discharge compared to rougher channels with relatively unconfined 10-year floodplains. Channels with a majority of the conveyance occurring outside of the main channel (smaller k-index) exhibited a larger absolute sensitivity of flood widths in response to systematic shifts in discharge. A larger absolute flood response of both flood width and depth to incrementally increasing discharge was also observed on channels falling within the upper range of the 100-year peak discharges analyzed. However, in this study, higher peak discharge tended to coincide with a lower main channel resistance. So, the preceding findings of larger absolute sensitivity with respect to percentage increases in overall 10-year discharge on smoother channels does not imply that lower roughness leads to greater flood sensitivity, in general. Moreover, the result more accurately reflects the finding that the larger channels exhibited the largest absolute sensitivity to system-wide increases in the runoff flow inputs.
The relative flood response to unit increases in discharge was also evaluated via a derivative-based aggregate sensitivity measure. This analysis revealed an inverse power relationship between peak 100-year flood discharge and the aggregate 10-year flood sensitivity to unit increases in stormwater discharge. Practical examples of such unit increases include increased local runoff by land use conversions, flow diversions, or local drainage enhancements. The analysis showed a reduced relative sensitivity of larger channels to local flow modifications. This finding is consistent with the physical reasoning that larger channels on average are less sensitive to a unit increase in peak discharge compared with smaller channels. The utility of the relationship was demonstrated in the extrapolative mapping of relative flood sensitivities of various channels throughout SW LA region. This result provided a concrete example of how such relationships can be leveraged to address critical knowledge gaps in practical settings where region-wide risk assessments are required in data-scarce environments (Wetzel et al., 2022). The method further shows how a subset of numerical models and publicly-available datasets can be leveraged to estimate regional flood sensitivities. Such sensitivity information can be integrated into watershed-wide screening tools (Bloetscher et al., 2021).
Limitations
Although the study provided an efficient methodology to evaluate flood risk sensitivity at practical scales of interest, some improvements can be made. Firstly, the method directly applied scale factors to the discharge inputs in the hydraulic models. As such it did not consider the hydrologic capacity of individual watersheds to assimilate increased rainfall intensities nor did it consider future development patterns within said watersheds. The direct usage of multiplicative scales did not permit the evaluation of effects due to non-volumetric intensification (e.g., alteration of time to peak and hydrograph shape). Such effects are of practical relevance, e.g., when evaluating the cumulative impact of peak vs. volume-based stormwater runoff strategies on regional scales. The aggregate relative sensitivity metric, SUD was able to capture the combined unit discharge sensitivity of both flood depth and widths. However, it has the drawback of becoming unbounded when the sensitivities approach zero. Also, direct methods were used in this study for simplicity, but there are many other types of sensitivity measures that could have been employed (Hamby, 1994). Development of a bounded yet intuitive aggregate flood sensitivity measure could prove helpful in this regard. The regional sensitivity extrapolation method utilized a single regression equation (non-Pine Hills region) for simplicity which likely overestimates the peak discharge in the Pine Hills region. Basin development factors were likewise not accounted for in the regression-based discharge estimation for brevity's sake. However, this is not a methodological limitation as such local factors can be readily incorporated in future studies. The NHDPlus delineation also shows some discrepancy in very flat coastal areas so future development of that dataset would facilitate more accurate assessments in the future.
For the sake of simplicity and given that the subtropical coastal Louisiana region has a 10-month growing season, seasonal variation in the Manning's n values were not considered in this study. However, the methodology utilized herein allows for the incorporation of dynamic n values in systems where such effects are of primary importance—an example of which occurs at high flow on the Mississippi River (May, 2020). Moreover, given the correlation of the sensitivity metrics to channel roughness values, an interesting future study could compare the parametric sensitivity of flood depth and width to Manning's n, with the discharge sensitivity of the flood sensitivity measures developed in this study over the ensemble of modeled streams.
The hydraulic models used herein were all 1D but 2D models are rapidly becoming the tool of choice for large-scale flood hazard simulations. It would be worthwhile to apply the methodology with 2D models to study the relative strengths and weaknesses of 1D vs. 2D models in flood sensitivity evaluations. A 2D approach would also generalize the method by providing a means of evaluating the discharge sensitivity of pluvial flood hazards. As with other types of environmental hazards, it is well-known that flood risks are disproportionately distributed on poorer communities in the US (Wing et al., 2022). Thus, another potential research direction involves quantifying spatial distributions of flood hazard sensitivity relative to social vulnerability toward the goal of more equitable flood risk management solutions in the future.
Data availability statement
The original contributions presented in the study are included in the article/supplementary material, further inquiries can be directed to the corresponding author.
Author contributions
RM: conceptualization, data curation, formal analysis, funding acquisition, investigation, methodology, project administration, resources, software, supervision, validation, visualization, writing—original draft, and writing—review and editing.
Funding
This research was funded in part by grants from the Louisiana Board of Regents (LEQSF(2020-23)-RD-A-25) and the National Academies of Sciences, Engineering and Medicine Gulf Research Fellowship Program (2000012638).
Acknowledgments
The author would like to thank three reviewers for their insightful comments and suggested edits which led to an improved manuscript. The author would also like to thank the Louisiana State University (LSU) LiDAR Atlas Project for furnishing the digital elevation data available at: https://maps.ga.lsu.edu/lidar2000/.
Conflict of interest
The author declares that the research was conducted in the absence of any commercial or financial relationships that could be construed as a potential conflict of interest.
Publisher's note
All claims expressed in this article are solely those of the authors and do not necessarily represent those of their affiliated organizations, or those of the publisher, the editors and the reviewers. Any product that may be evaluated in this article, or claim that may be made by its manufacturer, is not guaranteed or endorsed by the publisher.
Author disclaimer
The contents of this article are solely the responsibility of the author and do not necessarily represent the official views of the Gulf Research Program or the National Academies of Sciences, Engineering, and Medicine.
References
Archives, U. N. (2022). eCFR. Title 44 Chapter 1 Subchapter B Part 60 Subpart A 60.3. U.S. National Archives, Code of Federal Regulations. Available online at: https://www.ecfr.gov/current/title-44/chapter-I/subchapter-B/part-60?toc=1 (accessed June 27, 2022).
Bates, P., Quinn, N., Sampson, C., Smith, A., Wing, O., Sosa, J., et al. (2020). Combined modeling of US fluvial, pluvial, and coastal flood hazard under current and future climates. Water Resourc. Res. 57, e2020WR028673. doi: 10.5194/egusphere-egu21-14646
Bloetscher, F., Abbate, A., Huber, J., Liu, W., Meeroff, D. M., Nagarajan, S., et al. (2021). Establishing a framework of a watershed-wide screening tool to support the development of watershed-based flood protection plans for low-lying coastal communities. J. Infrastruct. Policy Dev. 5, 1273. doi: 10.24294/jipd.v5i1.1273
Brown, V., Kiem, B., Kappel, W., Hultstrand, D., Peyrefitte, A., Black, A., et al. (2020). How rare was the August 2016 South-Central Louisiana heavy rainfall event? J. Hydrometeorol. 21, 773–783. doi: 10.1175/JHM-D-19-0225.1
FEMA (2018). Flood Insurance Study, Vol.1 Lafayette Parish, Louisiana and Incorporated Areas. Washington, DC: Federal Emergency Management Agency.
FEMA (2022). Mitigation Measuress Turn the Table on Two Centuries of Flooding. Washington, DC: Federal Emergency Management Agency. Available online at: https://www.fema.gov/case-study/mitigation-measures-turn-table-two-centuries-flooding (accessed July 1, 2022).
Feng, B., Zhang, Y., and Bourke, R. (2021). Urbanization impacts on flood risks based on urban growth data and coupled flood models. Nat. Hazards 106, 613–627. doi: 10.1007/s11069-020-04480-0
Habib, E., and Meselhe, E. (2006). Stage-discharge relations for low-gradient tidal streams using data-driven models. J. Hydraul. Eng. 132, 482–492. doi: 10.1061/(ASCE)0733-9429(2006)132:5(482)
Hall, J., Tarantola, S., Bates, P., and Horritt, M. (2005). Distributed sensitivity analysis of flood inundation model calibration. J. Hydraul. Eng. 131, 117. doi: 10.1061/(ASCE)0733-9429(2005)131:2(117)
Hamby, D. (1994). A review of techniques for parameter sensitivity analysis of environmental models. Environ. Monit. Assess. 32, 135–154.
Hemmati, M., Mahmoud, H., Ellingwood, B., and Crooks, A. (2021). Unraveling the complexity of human behavior and urbanization on community vulnerability to floods. Nat. Sci. Rep. 11, 1–15. doi: 10.1038/s41598-021-99587-0
Kennedy, E. (1984). Chapter A10: Discharge Ratings at Gaging Stations—Book 3 Applications of Hydraulics. Washington, DC: USGS.
LADOTD (2011). 2011 Hydraulics Manual. Baton Rouge, LA: State of Louisiana Department of Transportation and Development.
LWI (2022). Creating a More Resilient Louisiana. Lake Charles: Louisiana Watershed Initiative. Available online at: https://watershed.la.gov/ (accessed July 2, 2022).
Mason, R., and Sumioka, S. (2001). The National Flood-Frequency Program: Methods for Estimating Flood Magnitude and Frequency in Rural Areas in Louisiana, 2001—Report Number fs-099-01. Reston, VA: U.S. Geological Survey. doi: 10.3133/fs09901
May, D. P. (2020). Hydraulic Effects of the Lower Mississippi River Batture. Baton Rouge, LA: Louisiana State University.
McKay, L., Bondelid, T., Dewald, T., Johnston, J., Moore, R., and Rea, A. (2012). NHDPlus Version 2: User Guide. Washington, DC: U.S. Environmental Protection Agency (EPA).
Moulds, S., Buytaert, W., Templeton, M., and Kanu, I. (2021). Modeling the impacts of urban flood risk management on social inequality. Water Resour. Res. 57, 24. doi: 10.1029/2020WR029024
Munoz, S., Giosan, L., Therrell, M., Remo, J., Shen, Z., Sullivan, R., et al. (2018). Climatic control of Mississippi River flood hazard amplified by river engineering. Nature 556, 95–98. doi: 10.1038/nature26145
NOAA (2022). “NOAA Atlas 14 point precipitation frequency estimates: LA,” in Hydrometeorological Design Studies Center Precipitation Frequency Data Server (PFDS). Silver Spring: NOAA. Available online at: https://hdsc.nws.noaa.gov/hdsc/pfds/pfds_map_cont.html?bkmrk=la (accessed June 26, 2022).
O'Donnell, E., and Thorne, C. (2020). Drivers of future urban flood risk. Philos. Trans. Royal Soc. A 378, 216. doi: 10.1098/rsta.2019.0216
Panagoulia, D., and Dimou, G. (1997). Sensitivity of flood events to global climate change. J. Hydrol. 191, 208–222.
Parthkumar, P., Czuba, J., and Easton, Z. (2022). Coupling a land surface model with a hydrodynamic model for regional flood risk assessment due to climate change: application to the Susquehanna River near Harrisburg, Pennsylvania. J. Flood Risk Manag. 15, e12763. doi: 10.1111/jfr3.12763
Prudhomme, C., Crooks, S., Kay, A., and Reynard, N. (2013). Climate change and river flooding: part 1 classifying the sensitivity of British catchments. Clim. Change 119, 933–948. doi: 10.1007/s10584-013-0748-x
Sarminingsih, A., Rezagama, A., and Ridwan. (2019). Simulation of Rainfall-runoff process using HEC-HMS model for Garang Watershed, Semarang, Indonesia. J. Phys. Conf. Ser. 1217, 012134. doi: 10.1088/1742-6596/1217/1/012134
Sghafian, B., Farazjoo, H., Bozorgy, B., and Yazdandoost, F. (2008). Flood intensification due to changes in land use. Water Resour. Manag. 22, 1051–1067. doi: 10.1007/s11269-007-9210-z
Shrestha, S., and Lohpaisankrit, W. (2017). Flood hazard assessment under climate change scenarios in the Yang River Basin, Thailand. Int. J. Sustain. Built Environ. 6, 285–298. doi: 10.1016/j.ijsbe.2016.09.006
Simpkins, G. (2017). Increasing river flood risk. Nat. Clim. Change 7, 3243. doi: 10.1038/nclimate3243
Tabari, H. (2020). Climate change impact on flood and extreme precipitation increases with water availability. Nat. Sci. Rep. 10, 13768. doi: 10.1038/s41598-020-70816-2
Tate, E., Rahman, M. A., Emrich, C., and Sampson, C. (2021). Flood exposure and social vulnerability in the United States. Nat. Hazards 106, 435–457. doi: 10.1007/s11069-020-04470-2
USGS (2022). 3D Elevation Program. Reston, VA: USGS. Available online at: https://www.usgs.gov/3d-elevation-program/what-3dep (accessed July 2, 2022).
Vozinaki, A.-E. K., Morianou, G., Alexakis, D., and Tsanis, I. (2017). Comparing 1D and combined 1D/2D hydraulic simulations using high-resolution topographic data: a case study of the Koiliaris basin, Greece. Hydrol. Sci. J. 62, 642–656. doi: 10.1080/02626667.2016.1255746
Waldon, M. (2019). Heavy Rainfall Frequency is Increasing in Lafayette Louisiana. Lafayette, LA: University of Louisiana.
Wetzel, M., Schudel, L., Almoradie, A., Komi, K., Adounkpe, J., Walz, Y., et al. (2022). Assessing flood risk dynamics in data-scarce environments—experiences from combining impact chains with bayesian network analysis in the lower Mono River Basin, Benin. Front. Water 4, 837688. doi: 10.3389/frwa.2022.837688
Wing, O., Bates, P., Smith, A., Sampson, C., Johnson, K., Fargione, J., et al. (2018). Estimates of present and future flood risk in the conterminous United States. Environ. Res. Lett. 13, 034023. doi: 10.1088/1748-9326/aaac65
Wing, O., Lehman, W., Bates, P., Sampson, C., Quinn, N., Smith, A., et al. (2022). Inequitable patterns of US flood risk in the anthropocene. Nat. Clim. Change 12, 156–162. doi: 10.1038/s41558-021-01265-6
Xing, Y., Shao, D., Ma, X., Zhang, S., and Jiang, G. (2021). Investigation of the importance of different factors of flood inundation modeling applied in urbanized area with variance-based global sensitivity analysis. Sci. Total Environ. 772, 145327. doi: 10.1016/j.scitotenv.2021.145327
Keywords: hydrologic intensification, climate change, flood sensitivity, inland basins, low-gradient channels
Citation: Miller RL (2022) Assessment of inland flood hazard sensitivity to hydrological intensification in coastal watersheds. Front. Water 4:985341. doi: 10.3389/frwa.2022.985341
Received: 03 July 2022; Accepted: 02 December 2022;
Published: 22 December 2022.
Edited by:
Jianyao Chen, Sun Yat-sen University, ChinaReviewed by:
Ming Zhong, Sun Yat-sen University, ChinaBill Selbig, United States Geological Survey, United States
Michael Waldon, University of Louisiana, United States
Copyright © 2022 Miller. This is an open-access article distributed under the terms of the Creative Commons Attribution License (CC BY). The use, distribution or reproduction in other forums is permitted, provided the original author(s) and the copyright owner(s) are credited and that the original publication in this journal is cited, in accordance with accepted academic practice. No use, distribution or reproduction is permitted which does not comply with these terms.
*Correspondence: Robert L. Miller,  cm9iZXJ0Lm1pbGxlckBsb3Vpc2lhbmEuZWR1