 Ranjeet Kumar Sahani
 Shrinivas Badiger
 Abhishek Samrat4†
 Siddhartha Krishnan
- 1The Academy for Conservation Science and Sustainability Studies, Ashoka Trust for Research in Ecology and the Environment, Bengaluru, India
- 2Manipal Academy of Higher Education, Manipal, Karnataka, India
- 3Centre for Environment and Development, Ashoka Trust for Research in Ecology and the Environment, Bengaluru, Karnataka, India
- 4Centre for Biodiversity and Conservation, Ashoka Trust for Research in Ecology and the Environment, Bengaluru, Karnataka, India
The overall precipitation in the state of Bihar, India is showing a decreasing trend both annually and seasonally, and yet extreme flood events are on the rise. The Kosi river embankments built to safeguard communities against flood risk are a product of socio-political and historical events in the past, but have resulted in differential impacts on those living inside and outside these embankments. The geomorphology of the river Kosi also makes it highly susceptible to recurring floods because it forms one of the largest inland deltas in North Bihar. Flood protection structures such as embankments exacerbate the magnitude of floods by jacketing the heavy sediment load and thus raising the riverbeds and exacerbating the intensity and duration of floods. Our paper employs an interdisciplinary approach to analysing both the biophysical and socio-institutional causalities of increasing flood events. From the quantitative analysis of rainfall data, we find that the daily, as well as monthly rainfall alone are not responsible for extreme flood events. The extreme rainfall events in the summer monsoon also do not increase the odds of flooding. Therefore, we conclude that precipitation alone is not the main factor affecting community's vulnerabilities but, a combination of socio-institutional factors including spatial location with respect to the embankment, class and caste of these communities. Our statistical analysis correlating daily and monthly gridded rainfall to the occurrences of flooding at the district level suggest that there are fewer flood events in the presence of the embankments across all years. However, primary data from household interviews and field observations confirm that the frequency and intensity of floods have increased in the post-embankment period. We found that the breaching of the river embankments is one of the major factors responsible for floods outside of the embankments. Kosi's marginalized communities perceive that they have become more vulnerable to flood risk in the post-embankment period with a declining standard of living in the Kosi villages caused by lack of proper roads, economic opportunities, educational institutions, public utilities and healthcare facilities, especially in areas with embankments.
1. Introduction
The average annual rainfall and the summer monsoon rainfall (South West Monsoon) have been showing a decreasing trend across India (Mondal et al., 2015; Radhakrishnan et al., 2017). The annual and seasonal rainfall trends in the state of Bihar are also showing a decreasing trend for the last century (Kumar et al., 2010). However, the flood frequency, magnitude and duration of flooding in the state of Bihar have shown an increasing trend, especially in the northern Kosi river catchment. The state of Bihar spends substantial resources every year on flood relief and recovery programs. Yet, the issue of floods has not been adequately addressed and it remains a persistent problem (Finance Department, 2021; Pushyamitra, 2021). The main objective of this paper is to investigate the underlying causes of increasing flood events both biophysical and socio-institutional and assess its implications on the livelihoods of communities residing in this region- particularly their exposure to increased vulnerability due to flood risk in the last few decades.
The literature on precipitation patterns in India suggests that there are clear disparities and heterogeneity in terms of the spatial distribution of annual rainfall and summer monsoon rainfall in India (Saha et al., 2018). The spatial heterogeneity of the rainfall pattern in the flood plains of the river Ganga is an example of such disparity and heterogeneity due to the vastness of the landscape (Bisht et al., 2018) and the terrain. The foothills of the Nepal Himalaya in the state of Uttar Pradesh, Bihar, and Sikkim in India receive some of the heaviest rainfall in the summer monsoon from June to September (June, July, August and September or JJAS) because of orographic terrain (Singh et al., 2019). The flood plains of Kosi in North Bihar, located in the southern part of the Kosi sub-basin, are one of the regions expected to receive more rainfall in the coming decades as compared to the middle and upper Himalayan part of the Kosi sub-basin (Singh and Sontakke, 2002; Rajbhandari et al., 2018).
The Kosi river, a major tributary of the river Ganga forms one of the largest inland deltas in the Gangetic river basin in India due to its constantly shifting river channels (Gole and Chitale, 1966). The flood plains of Kosi are the most permanently flooded areas in the state and are under-developed and socio-economically marginalized, which makes it a very hazard-prone and flood-vulnerable region both in the state of Bihar and India (Pandey et al., 2010; Singh et al., 2011). At the same time, there has been a gradual increase in the population located in the high-risk and very high-risk land categories in the North Bihar region over the past three decades (Modak and Kapuria, 2020). The Coupled Model Intercomparison Project Phase 6 (CMIP6) for the 2070–2099 period projects that the Ganges river basin will be experiencing the largest flood risk because higher flood peaks would become common by mid-2030 (Eyring et al., 2016). This makes the region highly disaster-prone giving policy makers ad communities relatively short window of time for adaptation (Gädeke et al., 2022).
Through this paper, we conjecture that in Bihar, communities had developed coping mechanisms to flooding events during the pre-embankment period, but now are forced to find new strategies to increase flood frequency, magnitude and duration in the post-embankment period. In addition, there has been a record loss of human lives, livestock, crop productivity and property due to recurring flooding in all rivers flowing from Nepal Himalaya, including Kosi. This has historically restricted the aspiration of the state to become a self-dependent, developing and industrialized state. This in turn has serious implications for the livelihoods and standard of living of communities, where half of the male population is always on the move for earning a livelihood for their families. The rate of male outmigration is the highest in the state, especially in flood-affected districts (Kumar and Bhagat, 2012).
At the same time, recurring floods have only increased the problems in the state with a lack of public utilities, economic opportunities and proper health infrastructure, leading to an increase in infant mortality, and recurring investments in basic public utilities (Minakshi, 2012). There have been several studies on floods in Bihar, which highlight the key factors responsible such as the mishandling of the floods; the underlying geomorphological factors of the river and the landscape, on the increasing cost of flood management and relief work in the wake of severe floods. The literature suggests that in terms of annual average rainfall in the catchment area of the Himalayan rivers, specifically the river Kosi, there has not been any significant increase in the rainfall in the past century (Basistha et al., 2009). Therefore, the pertinent, paradoxical question is- what are the reasons that are causing these floods to increase in magnitude and duration in the foothills of the Nepal Himalaya and the state of Bihar? Further, an ancillary question- what cost do the local marginalized communities bear as a result of frequent flooding?
The objective of the study is to understand the causes of increased frequency and intensity of floods in the post-embankment period. To answer this question we have looked at both the biophysical and socio-economic characteristics of the villages located in two highly vulnerable districts of North Bihar.
Our paper employs a unique interdisciplinary approach to analyzing both the biophysical and socio-institutional causalities of increasing flood events. The following section starts with a description of the geomorphology of the river Kosi followed by the analysis of precipitation trends, its correlation to floods if any and finally the role of flood control interventions and their impacts on the communities living in the region.
1.1. The geomorphology of the river Kosi
The primary feeders of the rivers of north Bihar such as Kosi and Gandak are orographic precipitation from the summer or southwest monsoon (JJAS) in Nepal Himalaya and natural spring discharge during post-monsoon and the snowmelt from the central Himalayan region during summer. The Kamala-Balan river system receives flows from the foothills and the adjoining plains (Sinha and Friend, 1994). Kosi and Gandak originate in the high hills and have a very large upland catchment area, a high ratio of upland area to plains, and a high river discharge, which means the floodwaters carry high volumes of coarse to medium-sized sediments.
The elevation difference between the highest point in the Kosi river catchment is 8,848 m (mount Everest) while the lowest point is just 60 meters when Kosi meets the river Ganga at Kursela (Chen et al., 2013). Most of the tributaries of the river Kosi are located in the higher mountains and the multi-peak stream power distributions are more common instead of the total and specific stream power distribution; at the same time, there is no downward trend in stream power distribution in the Kosi basin. In addition, the temporal variation in the total stream power distribution is a function of rainfall in the catchment area and the rate of increase in stream power is dependent on average rainfall in the river basin (Kaushal et al., 2020). These two rivers, Kosi and Kamala thus carry high volumes of sediment load from geologically young Himalayan mountains (Sinha, 2016). The key areal aspects of river Kosi that make it susceptible to flooding are presented in Table 1.
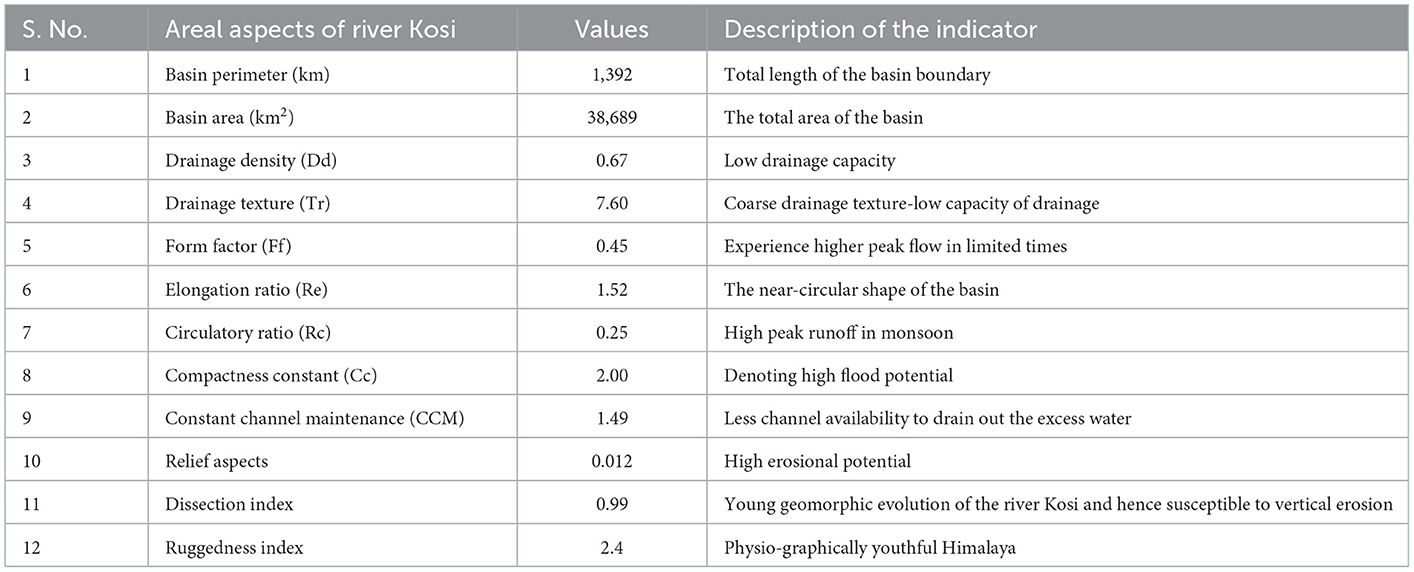
Table 1. Areal aspects of river Kosi (This table adapted from Mahala and Pathak, 2019).
Similarly, all the other aspects of the geomorphology of river Kosi such as the elongation ratio1 of 1.52 meaning the nearly circular shape of the basin affects runoff response to rainfall in the river Kosi. The circulatory ratio2 of 0.25 means its high peak runoff in monsoon is responsible for flash floods. The compactness constant3 of 2.0, denoting high flood potential makes the lowland region of Nepal and North Bihar very flood-prone. The constant of channel maintenance4 1.49, a low value indicating less channel availability to drain out the excess water quickly making the Kosi river channels prone to overbank flooding. The high relief aspects indicate its high erosional potential and which is why it carries a high amount of sediments, which impedes the flow in the river channels downstream. The moderate relief ratio of 0.012 indicates high steepness in the Himalayan peaks and low relief as it enters the plains resulting in the sudden spreading of river water. The dissection index5 of 0.99 indicates the young geomorphic evolution of the river Kosi, hence susceptible to vertical erosion, and high sediment load affecting the riverbed rise. The ruggedness index6 of 2.4 indicates a physio-graphically young Himalayan mountain range. The channel gradient of Kosi is such that it is almost vertical from its source to the foothills and flat from there onwards till it meets the Ganga near Kursela increasing its potential for frequent flooding. The high slope characteristics of more than 40% in the hills and then the sudden drop in the plains indicates its high potential for geomorphic evolution. Thus, the geomorphology of the river Kosi in itself makes it very susceptible to flooding and has a significant impact on the carrying capacity of the river as well (Mahala and Pathak, 2019).
The state of Bihar does not have a comprehensive flood mitigation strategy that could minimize the effect of floods on communities. The topography of the river Kosi is another key factor responsible for flooding even when the rainfall remains deficient (Palanichamy, 2020). The high rainfall along with the topographical steepness and instability of the channels help in high sediment connectivity resulting in flooding of the floodplains of river Kosi (Swarnkar et al., 2020). The flood prioritization maps and plans including flood susceptibility indices at sub-watershed levels can be very useful tools for the efficient management of floods and for reducing flood susceptibility (Ilderomi et al., 2022).
The presence of bridges also affects the hydraulic regime of the rivers and induces the backwater effect (Ardiclioglu et al., 2022). Construction of Kosi Mahasetu (bridge) in the upstream and Kosi river bridge at Baluwaha Ghat on Kosi might be affecting the hydraulic regime of river Kosi in the North Bihar region. In the rivers, whose catchment is mostly located in the mountainous region with steep slopes topographic factors play a very important role in the runoff generation process besides the driving factors such as the amount of rainfall, type of rainfall, flow velocity and runoff volume (Avand et al., 2022). The Kosi river catchment is a perfect fit for such a description and hence the topography plays an important role in the runoff and sedimentation leading to aggradation of the river channels and the flood plains. All of these factors affect the carrying capacity of the river, which are discussed in the following section.
1.2. Carrying capacity of the river Kosi
The heavy sediment load coming from the Himalayan mountains has been known to impede flow in the river channels of Kosi leading to the rising riverbed (Sinha et al., 2018). Thus, the carrying capacity of the channels of river Kosi has decreased over the years resulting in frequent overbank flooding and flash floods (Kumar Panda, 2015). The river channels and the adjoining areas are at the same elevation and the flatter gradient of the river from Kusaha in Nepal to Kursela in Bihar where Kosi joins the Ganga (Sinha, 2008). The low gradient of the river and the filling up of the river channels with sediments makes it dangerous because even normal rainfall events cause overbank flooding in the lower sub-basin area, submerging vast areas occupied by millions of people (Chakraborty et al., 2010). One of the major concerns for the communities living inside the embankments where the river channels pass through the Kosi villages is that often it could engulf the entire village in a matter of few hours. This makes them highly vulnerable given there are no systematic early warning systems (Mishra, 2008b).
According to a 2008 estimate, the Kosi riverbed and the adjoining area inside the Kosi embankments have very similar elevations. So, the moment river water enters the channel it spills over to the outside of the river bank, hence flooding the entire villages in its vicinity (Government of Bihar, 2010). This, however, is very different in areas outside of the Kosi and Kamala river embankments because the riverbed is at a higher elevation as compared to the villages nearby, and therefore, embankments play important role in preventing these villages from getting flooded directly during monsoon when the river is flowing in its full capacity (Sinha, 2008). Nevertheless, floodwater enters the villages located outside and adjacent to the embankments because the river is flowing at a higher elevation although there are occasional breaches in the embankments, which worsens the situation. At the same time, the constant seepage due to elevation difference creates waterlogging outside and adjacent to embankments, which may or may not be beneficial for the communities living outside along the river embankments (Hossain et al., 2011).
However, the magnitude of flooding depends on the cumulative seasonal precipitation during the southwest monsoon. Waterproof polypropylene bags filled with sand and stacked together can generate high friction making them less prone to breaching and helping reduce the impact of floodwater on flood defense structures (Klipalo et al., 2022), instead of jute sandbags. These sandbags used in the Kosi catchment are not waterproof and often prone to wear and tear. To have an effective nature-based solution for flood mitigation all the aspects of a river, such as topography, hydrometeorology, and hydraulics including upstream land use and land cover management need to be considered (Kuriqi and Hysa, 2022), which is lacking in the Kosi floodplains.
1.3. Precipitation trend in the Kosi sub-basin
A few studies also suggest that the lower Kosi sub-basin region might be receiving a greater amount of rainfall in the future (Rajbhandari et al., 2018), in the climate change context. As stated earlier, the overall rainfall trend in India as well as in the state of Bihar is showing a decreasing trend and so is the case in the Gangetic basin. However, the Kosi region in particular is showing an increase in annual rainfall because of its location where the plains meet the valleys. The proportion of South West monsoon in this region is significantly higher up to 80% of the total annual rainfall (Bisht et al., 2018). The higher precipitation due to geographical peculiarity and the location of the lower Kosi sub-basin in the foothills of Nepal Himalaya, where plains meet the hills, makes it very susceptible to extreme rainfall events (Deshpande et al., 2016). The increasing precipitation trend in the headwaters of Nepal Himalaya is another concern for the downstream region of North Bihar because it faces the brunt of flash floods and overbank floods during the monsoon (Shrestha et al., 2017).
To understand the role of changing precipitation patterns, a time series analysis was carried out. In the Mann-Kendall Test, monotonic trends of the rainfall, neither upward nor downward often not auto-correlated but needs to be normally distributed (Mann, 1945; Kendall, 1975). The Spearman Rho test is also a non-parametric test, which is used to calculate the strength of association between variables, which are either perfectly positively correlated or negatively correlated, it also measures the direction of association between two ranked variables (Spearman, 1904). Although Mann-Kendall (MK) and Spearman's rho (SR) tests are commonly used techniques for trend identification, they work only under some restrictive assumptions which are the independent structure of the time series, data needs to be normally distributed and also the duration of the data should be sufficiently long. Moreover, it is not possible to calculate the slope or the trend magnitude apart from using a regression approach. Whereas, in Sen's Innovative Approach it is possible to calculate increasing and decreasing trend without using the assumptions of MK and SR tests and where the points falling in the upper triangle represents an increasing trend while the lower triangle represents decreasing trend (Şen, 2012; Dauji, 2021). Apart from the general trend in time series data, especially the variability of hydrological time series data such as precipitation when we need to look for sub-trends the Onyutha test is a useful graphical method to understand sub-trends within a larger trend (Onyutha, 2021). Since our study is focused on the precipitation trend from 1951 to 2015, we have used Sens' Innovative Approach (Şen, 2012) to analyse trends in the Kosi sub-basin. The fact that this trend analysis provides both increasing and decreasing trends without any assumptions makes it useful in our case.
1.4. Embankments as flood control interventions
Most often the top-down approach to address flood control undermines the local environment and the livelihood opportunity costs of people. The World Bank-funded initiative in Bangladesh to control floods was one such instance when they proposed the construction of tall embankments along rivers in Bangladesh's delta region. The political backing of the government of Bangladesh and the notion of third-world development has provided enough push for this project. Also, since the government and the contractors were going to gain from the project, no one objected and politicians projected it as the grand solution to the problems of flood in Bangladesh (Boyce, 1990). Land submergence, both villages and agricultural land due to floodwater are political because it demands social interventions and political spending to control the flood to protect the communities and crops. But, the whole process creates a situation where the protection of one individual becomes a risk for others and thus affects different communities differently (Krause, 2016).
In the Orissa delta, India, colonial capitalism ensured the ill effect of political-economic interventions by colonial powers that changed the entire deltaic region of Orissa from flood dependent to a flood-vulnerable region (D'Souza, 2006). A national seminar on floods in India during the 1980's observed that floods are a disruptor of the local economy as they damage crops, destroy properties and cause deaths of people and livestock. The agriculture sector is affected the most by floods and agricultural laborers who are among the poorest become unemployed for months with no food security or income source. To counter floods, both engineers and politicians prefer to do something tangible and propose multipurpose dams, barrages and embankments to tame the rivers. But, building embankments results in trapped sediments behind these structures causing rising riverbeds and over-spilling of flood waters into villages outside the embankments. This again results in governments having to race against the rising riverbed by further raising the height of bunds and raising the houses to a higher elevation (Sinha, 1976), which continues to spiral infinitely.
The construction of river embankments in India has historically been influenced by three main factors- the location of the bunds which is decided by the political will of the region and could be shifted from one side to another to safeguard the vote bank; and if the lands belong to dominant and influential caste, the bunds are left incomplete and the margin between the river course and the bunds is narrowed down due to the resistance of people from new villages settlements. Finally, the nexus of contractors and government agencies to make a profit out of these projects, build bunds with low-quality materials susceptible to breaches and flooding. Thus the whole process of embankment building was socio-politically driven and affected one region more than the other (Gandhi, 1981).
Technological interventions in the form of river embankments for flood control most often end up causing environmental injustices due to the nature of the redistribution of floodwater where it protects one community but ultimately affects other communities (Liao et al., 2019), often marginalized. Most often, we protect the centers of the economic hub and other important places against floods. Other regions do not have similar protection hence contributing to the disproportionate distribution of flood risk, making marginalized communities even more vulnerable. For example, in Northern Thailand, it was found that the flood impact was more or less equally distributed based on the hazard zoning of the river although without embankment and for a similar frequency of flood return period (Tingsanchali and Karim, 2010).
The encroachment of the river floodplains by building homes, road construction and destruction of forests in the catchment area of rivers was found to increase the monsoon floods (Weng Chan, 1997). Therefore, any changes in the upper catchment of river Kosi might have a direct impact on the communities in the lower Kosi sub-basin. The development activities in the Kosi catchment and the consequent deforestation have already increased soil erosion from the Nepal Himalaya upstream of the Kosi sub-basin (Saxena, 2016). At the same time, in the comparative analysis of flood events in Australia and India, one study found that natural floods are showing increasing fatalities and displacement of people based on the flood data of the past three decades (Halgamuge and Nirmalathas, 2017).
In addition, the variability of the Indian summer monsoon has increased over the years resulting in frequent extreme flood events (Patwardhan et al., 2014). Also, there have been several instances of heavy rainfall events in the Ganga Basin where most of it occurs in just a few days resulting in flash floods in the existing permanently flooded areas and its adjacent areas (Deshpande et al., 2016). This typical geographical context and the variable nature of the summer monsoon in the Ganga basin could be exacerbating the flood intensity (Dogra et al., 2014). Apart from flood flow depth, the flood duration has also increased outside and adjacent to the Kosi embankments, and in the southern part of Kosi embankments (Chowdary et al., 2008).
1.5. A brief history of river embankments in North Bihar
Some river embankments of north Bihar existed before the British took control of the region. For example, the Gandak river embankment was built in the year 1756, essentially to protect cropped areas and flood-prone villages. The same embankment was repaired by the British government and the cost was recovered from the local Zamindar. Later when the embankments needed repairs, the government reconstructed them in the year 1830. Till 1830, the colonial government was only interested in the tax revenues coming from agriculture but after 1830, they started taking interest in the structure, purpose and general condition of the embankments. The Gandak embankment is also known as the Tirhut embankment because the eastern Gandak embankment passes through Champaran, part of the Tirhut and was kept under colonial supervision since 1796. Much later Saran embankments located in Saran were kept under supervision for repairs since 1809 (Singh, 2003).
These embankments were built to save crops from flooding and later continued to generate revenue for the British. The British never considered abandoning them altogether because it might affect the communities who got used to them. Besides, levying tax on agricultural produce, the repair and maintenance cost of these embankments was recovered from the Zamindars (Singh, 2003), who recovered it from the peasants.
Since these embankments are built from loose earth, they also cannot withstand natural erosion. For instance, the Turki Embankment of Muzaffarpur which was constructed in 1810 by an indigo factory along the Baghmati River to safeguard the indigo plantation, lasted until the 1934 Bihar earthquake. The Bir bandh (embankment) of Darbhanga Raj, an 80 km long construction built from the southern part of Nepal to the Bhagalpur district in the South along the western bank of the river Kosi, found itself reduced to only 4 km by 1938 (Singh, 2008). Most of the rivers of Bihar always had some form of private and public embankments, either built by the Zamindars or the Sarkar (the government of India).
Through the permanent settlement of 1793 and the embankment acts, the East India Company fixed the land tax and thus forced the Zamindars to repair all the embankments which could affect their land and agricultural production. But the enforcement of the law was not effective and so the mismanagement of embankments continued. Later the act of 1873 was introduced to stop the uncontrolled construction of private embankments and mandated that the Zamindars needed to maintain old ones and construct the new embankments. Thus, government officials regained more power to deal with embankments and manage the gradual drainage of the flooding rivers. Also, through the act of 1873, power shifted from the superintending engineer to the district collector. Finally, through the act of 1882, the government took more control over embankment construction citing the unscientific methods adopted by the Zamindars (Singh, 2003).
Of all the rivers in Bihar, Kosi was embanked the last but became the most prone to flooding disasters in Indian history (Mishra, 2008a). The government of India approved the construction of a 153 km long embankment on the eastern side from Birpur to Kopadia and another 126 km on the western side from Bhardah in Nepal to Ghonghepur in Saharsa (Singh, 2008). These Embankments were completed by 1959 and the goal was to protect 214,000 hectares (ha) of land from flooding (Singh, 2003; Baghel, 2013). At the same time, a barrage at the Indo-Nepal border at Birpur was constructed in 1963 to irrigate 712,000 ha of land through the eastern Kosi main canal and another 325,000 ha through the western Kosi canal. Post embankments, three distinct areas emerged on the landscape: the area between the embankments, the area adjacent to but outside of the embankments and the area protected from floods (Baghel, 2013).
Of these, people living in the areas between the embankments are exposed to highly precarious conditions. They face direct risks of floods, loss of life and livestock, land erosion, sand casting, house collapse, crop damage, medical emergencies due to inaccessibility, male out-migration, and various crimes. The embankments are a product of the socio-political and historical events in the past but have now become centrally responsible for increased flooding in north Bihar. Historical tussles to control floods through embankments and the political motives of the colonial government and the local Zamindars have created a bigger mess in the north Bihar regions which is irreversible. Marginal communities living in this region are paying the price of historical trial and errors of flood control for revenue generation and the economic goals of the British Empire (Singh, 2008).
The price communities pay is not equitable. In north Kosi, some are more exposed to flood hazards than others. North Kosi offers the scope to employ the environmental inequality and disproportionate impacts frame to understand and demonstrate the relative vulnerabilities of marginal castes and classes. Considering displacement and loss of livelihood it has become a regular stressor that marginalized groups are subjected to in Kosi.
A greater concern here is environmental inequality demonstrable through disproportionate exposure that has led to development-driven displacement. Hydroelectricity dams, irrigation schemes, special economic zones (SEZs), and other large infrastructures have displaced anywhere in the range of 21 to 50 million Indians. A resultant politics of displacement asks “how to address the disproportionate loss borne by the marginalized and the poor, especially women and children”. There is a “need to focus specifically on how processes of displacement and resettlement affect social groups differ concerning axes such as gender, class, caste and tribe”. It is now well known that displacement tends to affect disenfranchised groups- the most that are deemed dispensable and among them, women and children suffer disproportionately (Mehta, 2009).
Thus this paper also disaggregates the displacement risks that Musahar scheduled castes, and Mallah most backward castes are exposed to. The problem of displacement is constant with people periodically moving to higher grounds as the Kosi and its tributaries swelled, only to move back to ravaged homes and fields after the floodwaters have receded.
While environmental historical context and discussions establish human actions in terms of politically motivated technological and engineering interventions as responsible for floods, no interdisciplinary work exists on assessing the impacts of increasing flood frequency and intensity since the 1960's and its disparate implications on livelihoods. This paper seeks to understand whether the flood frequency and intensity have increased since the 1960's in the lower Kosi sub-basin, and if so, why? And what are the disproportionate livelihood impacts on marginalized communities?
2. Materials and method
2.1. Study area-Darbhanga and Saharsa-North Bihar
Our study is located between the latitude 25.74546° to 26.07287° and longitude 86.1967° to 86.53122°. We have carried out 65 household interviews in 16 study villages spread across four-community development blocks (CDB). We chose two blocks each from the Darbhanga and Saharsa districts, which are located in the southeastern part of Kosi (Figure 1).
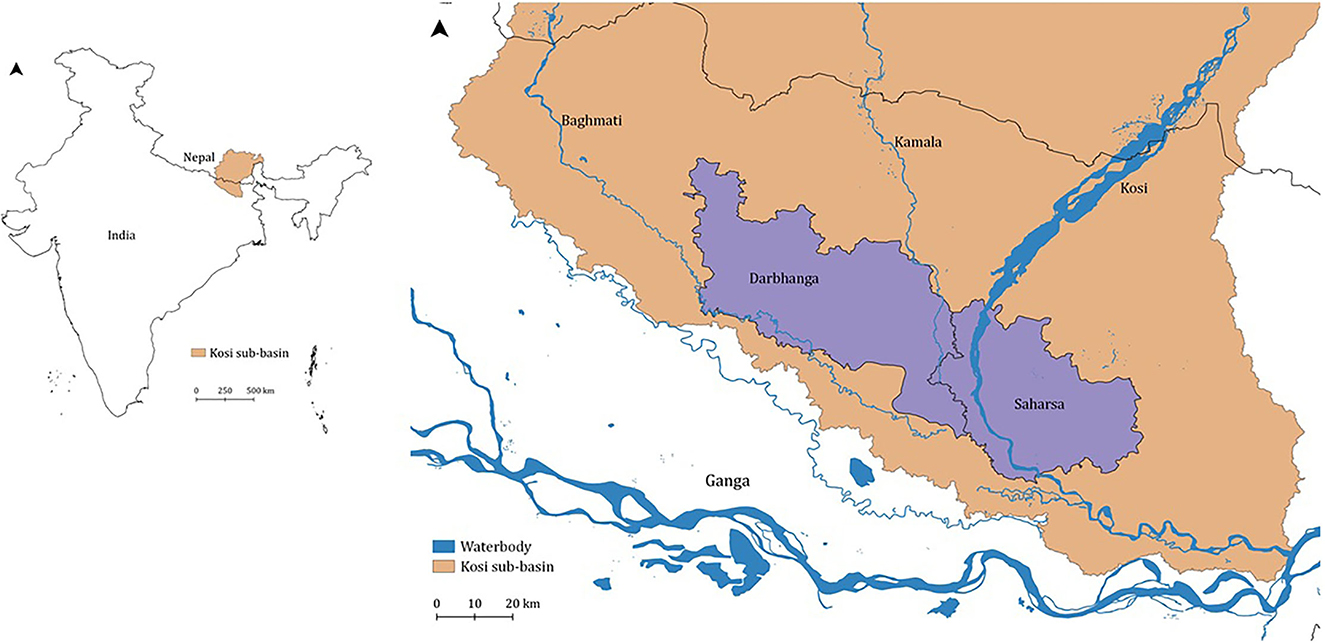
Figure 1. Location map of study area-Darbhanga and Saharsa.
The average annual rainfall in Darbhanga and Saharsa is around 1,025 (millimeter) and 1,122 mm respectively. However, as noted earlier a significant amount of rainfall occurs during the southwest monsoon. The mean monsoon rainfall for Darbhanga and Saharsa is 874 and 936 mm respectively. The district of Madhubani surrounds Darbhanga in the north, which receives 1,071 mm of mean annual rainfall and 912 mm of mean monsoon rainfall. Supaul and Madhepura districts surround Darbhanga in the north and east, which receive 1,253 and 1,203 mm of mean annual rainfall and 1,029 mm, and 984 mm of mean monsoon rainfall respectively. The maximum elevation of Darbhanga district is 52.5 meters above mean sea level (AMSL) in the north while the minimum elevation is 41.08 m in the southeastern part and the average is around 47 m AMSL, with a very gentle slope.
The rainfall in neighboring districts located in the north is important because the general direction of the rivers and streams is from North-West to South-East in Darbhanga and from North East to South West in Saharsa, all converging in the Southeastern part of Darbhanga where our study villages are located. The topography of Darbhanga is such that most of the rivers flow from the northwest to the southeast region (Central Groundwater Board, 2013). Similarly, the average mean elevation of the Saharsa district is 44 meters AMSL and the rivers flow from northeast to southwest. The main channel of Kosi passes through the western part of the Saharsa district.
Tributaries from neighboring districts of Darbhanga, Samastipur and Muzaffarpur which flow into the Kosi-Kamla rivers also receive significant rainfall during monsoon, 1,091 mm and 1,062 mm of mean annual rainfall and 912 mm and 903 mm of mean monsoon rainfall respectively. Similarly, Saharsa has its neighboring districts of Purnea, whose rivers flow into Kosi receive a major chunk of rainfall during monsoon, with 1,623 mm of mean annual rainfall and 1,319 mm of mean monsoon rainfall (Guhathakurta et al., 2020). Thus, these neighboring districts directly or indirectly contribute to the Kosi-Kamla Rivers and during monsoon creates a situation of flood in the entire Kosi sub-basin.
The population of Darbhanga and Saharsa districts as per the 2011 census were 3.937 million and 1.91 million respectively with population densities of 1,728 and 1,127 persons/sq.km respectively. The decadal change in population growth rate for Darbhanga from 2001 to 2011 was 30.85–19.47 % while for Saharsa it was 33.03–26.02% respectively (Government of India, 2011).
2.2. Data collection
To understand the perception of the communities on the nature of floods, we carried out semi-structured household interviews from 65 households located in 16 study villages across four-community development blocks (CDB), two blocks each from Darbhanga and Saharsa districts located in the South-eastern part of Kosi, North Bihar (Figure 1). We carried out the interviews with two selected communities only and do not represent the perceptions of the other communities.
We conducted these interviews from two distinctly different Musahar and Mallah communities.
We mapped the village locations using hand-held GPS units. We compiled secondary data on flood events and flood damage from the official website of the Bihar disaster management authority (DMD, 2020). For our study, a flood event is defined as any flooding, which is recorded in at least one village of a gram panchayat from a community development block in a district in a year. The criteria are that either the houses should be partially or fully submerged or damaged, cropped land is affected either partially submerged or washed out, with loss of human and livestock recorded by the state disaster management authority. We used this data as a proxy to triangulate the flood events reported by the respondents of semi-structured household interviewees in the Kosi floodplain from the years 1991 to 2015.
The precipitation data for the Kosi sub-basin was acquired from the year 1951 till 2015. However, the flood events and flood damage data for the study area was available from 1991 only, so we used rainfall and flood data from 1991 to 2015 for our correlation. Daily precipitation data for the Kosi sub-basin for the period 1951 to 2015 was sourced from Asian Precipitation-Highly Resolved Observational Data Integration Toward Evaluation of the Water Resources (APHRODITE; Maeda et al., 2020). The original APHRODITE data set is gridded using the data from ground rain gauge stations and interpolated. The station data for individual blocks would have been more accurate for rainfall analysis but it was not available for longer periods.
The base map layer for mapping the maximum floodwater extent across study villages was generated using the Google Earth Engine (Gorelick et al., 2017) (Figure 2). The Google Earth Engine (GEE) is free access planetary-scale geospatial cloud-computing platform, which is publicly available based on satellite remote sensing datasets. The maximum water extent shown in Figure 2 explains the spatial distribution of floodwater over the years in the study area and it is the accumulated value shown but the water body's extent just tells us about the extent and duration but not the depth of the water, so it might not correlate with the damage done due to flooding.
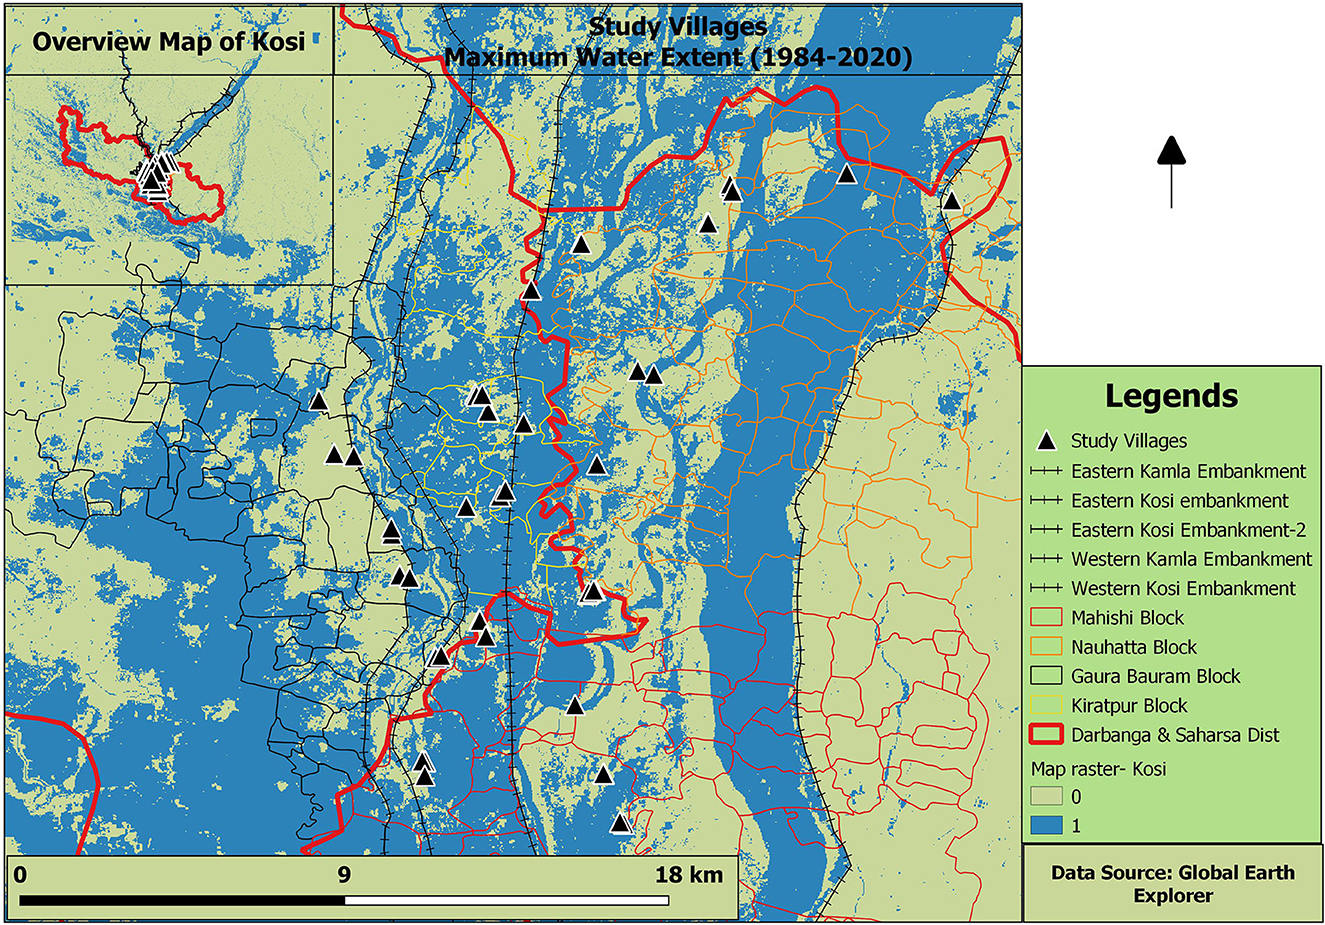
Figure 2. Location of study villages.
2.3. Data analysis
We carried out the mean annual rainfall trend analysis of the Kosi sub-basin from 1951 to 2015 using daily precipitation data. We have used Sen's Innovative Approach to understand the precipitation trend in the Kosi-sub basin and the study districts Darbhanga and Saharsa because it does not need the data to be normally distributed, the independent structure of the time series data and the long length of the data. In this method, the increasing trend could be understood by plotting the total precipitation and the cumulative precipitation and dividing it by a diagonal line making upper and lower triangles, where the area above the diagonal line in the upper triangle indicates an increasing trend while those in the lower triangle indicates decreasing trend (Şen, 2012).
For comparison, we have also carried out the Sequential Mann-Kendall test which has been shown along with Sen's Innovative test trend results (Patakamuri and Das, 2022) (see Supplementary Figures 1, 3). We have used gridded precipitation data from APHRODITE's high temporal resolution (daily) and high spatial resolution (0.25° × 0.25° over Asia; 0.05° × 0.05° over Japan) since it is the only open-source, long-term data set available from 1951 onwards at the continental-scale. The data set is generated using a dense network of daily rain-gauge data for Asia including the Himalayas, South, and Southeast Asia, and mountainous areas in the Middle East (Yatagai et al., 2012). However, due to the non-availability of flood event data for both of our study districts for the period before 1991, we have analyzed precipitation data for the period 1991 to 2015 only. The mean daily, monthly, and monsoon rainfall (JJAS) over the Kosi sub-basin, Darbhanga, and Saharsa districts were calculated in R-Statistics (R Core Team, 2020) using the raster package version 3.4 (Hijmans, 2021).
We have performed a Generalized Linear Model (GLM) on the flood events vs. total rainfall for daily, monthly, and JJAS. The flood events were binary so we selected the GLM family function binomial and their link function logit (MacKenzie et al., 2018). The GLM was performed in R-Statistics using the package rms version 6.2-0 (Hijmans, 2021).
To understand the role of rainfall on flood intensification during the post-embankment period, we assess rainfall distribution in the region during the southwest monsoon. We have used long-term rainfall data and records of flood events along with information collected from household interviews. We have conducted household interviews across sixteen villages of Darbhanga and Saharsa districts, two of the most flood-prone districts in Bihar.
At the same time, the household data collected from sixty-five households located in the sixteen study villages across four community development blocks(CDBs) from the districts of Darbhanga and Saharsa using purposive random sampling were used to triangulate and establish the cost of flooding along with rainfall and flooding events.
3. Results
3.1. Results-rainfall and flooding
We ran the generalized logistic regression model for daily rainfall and flood events for the period 1991–2015 for both districts separately. Most of the rainy days in terms of net daily rainfall were between 0 and 50 mm, which we categorize as low rainfall. The rainfall category of 50 to 100 mm was classified as severe which is expected to have some effect on the flooding events. However, the extreme rainfall events, which accounted for rainfall amounts >100 mm per day, were not many. The low-intensity rainfall events were the highest in number but they were happening for longer periods, hence the effect on floods would be from the cumulative rainfall of the event.
When we examined the rainfall and flood coefficients for Darbhanga, we observed that the odds of having a flood were significant but rainfall depth itself was not sufficient enough to explain the flood events (Table 2), suggesting the upper catchment contribution to the flow must be significant to the river. The z-value in Table 2 is the Wald statistic used for testing the null hypothesis. Here the null hypothesis is that the estimate is normally distributed with zero mean and standard deviation of one. The quoted p-value, P(>|z|), indicates the tail area in a two-tailed test (Wald, 1992). We have carried out the annual, monsoon and non-monsoon rainfall trend analysis for the Kosi-sub basin, Darbhanga and Saharsa districts from 1951 to 2015 and found that annual minimum and maximum rainfall were showing a significant trend with p-values 0.05 and 0.04 with respectively (Bronaugh and Werner, 2019) (see Supplementary Table 1 and Supplementary Figures 1C, E, 3A, 3C, 3E).
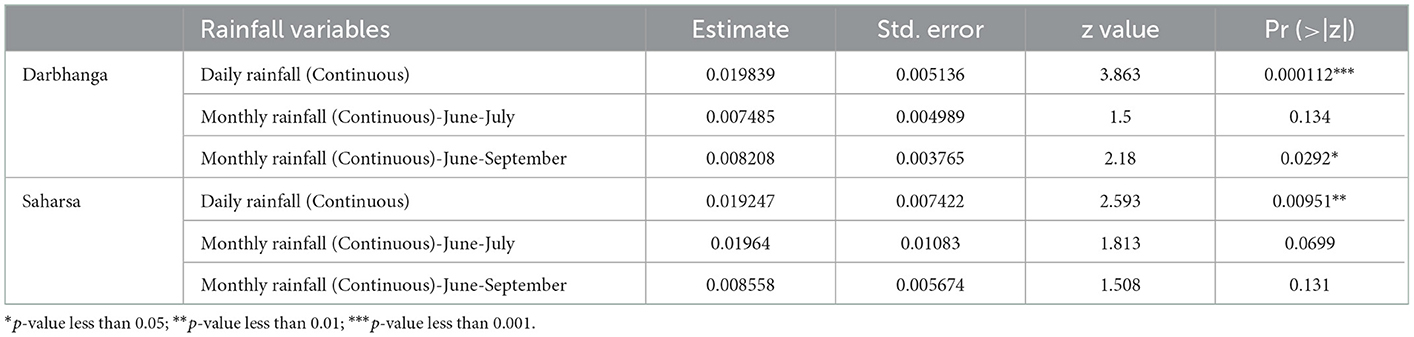
Table 2. GLM_ flood vs. rainfall between 1991 and 2015 for Darbhanga and Saharsa.
At the same time, the non-monsoon mean, minimum and maximum rainfall were significant with p-values of 0.01, 0.00 and 0.02 respectively. The significant increase in annual maximum rainfall indicates an increase in extreme rainfall events in the Kosi sub-basin, which might be affecting the flooding events in the study villages located in Darbhanga and Saharsa downstream.
We have carried out the annual maximum rainfall trend analysis for the Kosi sub-basin, Darbhanga and Saharsa and found that there is no significant trend at a 95% confidence interval. The Sen's slope p-values for the daily annual maximum rainfall are 0.64, 0.87 and 0.67 respectively for the Kosi sub-basin, Darbhanga and Saharsa and are not significant (see Supplementary Table 2 and Supplementary Figures 10A, C, E).
We have used the annual maximum series to understand the relationship between rainfall and flooding events in Darbhanga and Saharsa and found that the annual maximum series is not significant at all three spatial scales-the Kosi sub-basin, Darbhanga and Saharsa (see Supplementary Table 3).
The recent flood events in Bihar even when rainfall was deficient in the region suggest that flood is not entirely dependent on the local rainfall but rainfall in the catchment area located upstream (Palanichamy, 2020). Apart from that, there could be other factors such as an occasional, coincidental breach in the embankments and the release of water from barrages. In addition, there are biophysical factors, such as the level of soil saturation, and floodplain geomorphology including catchment characteristics (Table 1) that could be attributed to flood magnitude.
For the GLM parameters, we used a binomial family and the link function used was logit. Results presented in Table 2 also suggest that the daily mean rainfall over the years alone does not explain sufficiently enough for flood events to occur. However, we found the contribution of the local rainfall was significantly correlated with most of the extreme flood events. The years 1992, 1994, 2008, 2012, and 2013 were exceptions when flooding did not happen even after high rainfall events in the Darbhanga district therefore the factors could be non–local as well (Figure 3). This potentially could be attributed to dry soil conditions wherein a significant portion of the rainfall could have been absorbed for wetting the catchment, which is quite normal during initial rain events during the monsoon. We also tested the relationship between flood events and extreme rainfall events by categorizing the monthly rainfall (summer monsoon or JJAS) as low (0 to 50 mm), severe (between 50 and 100 mm), and extreme rainfall (more than 100 mm).
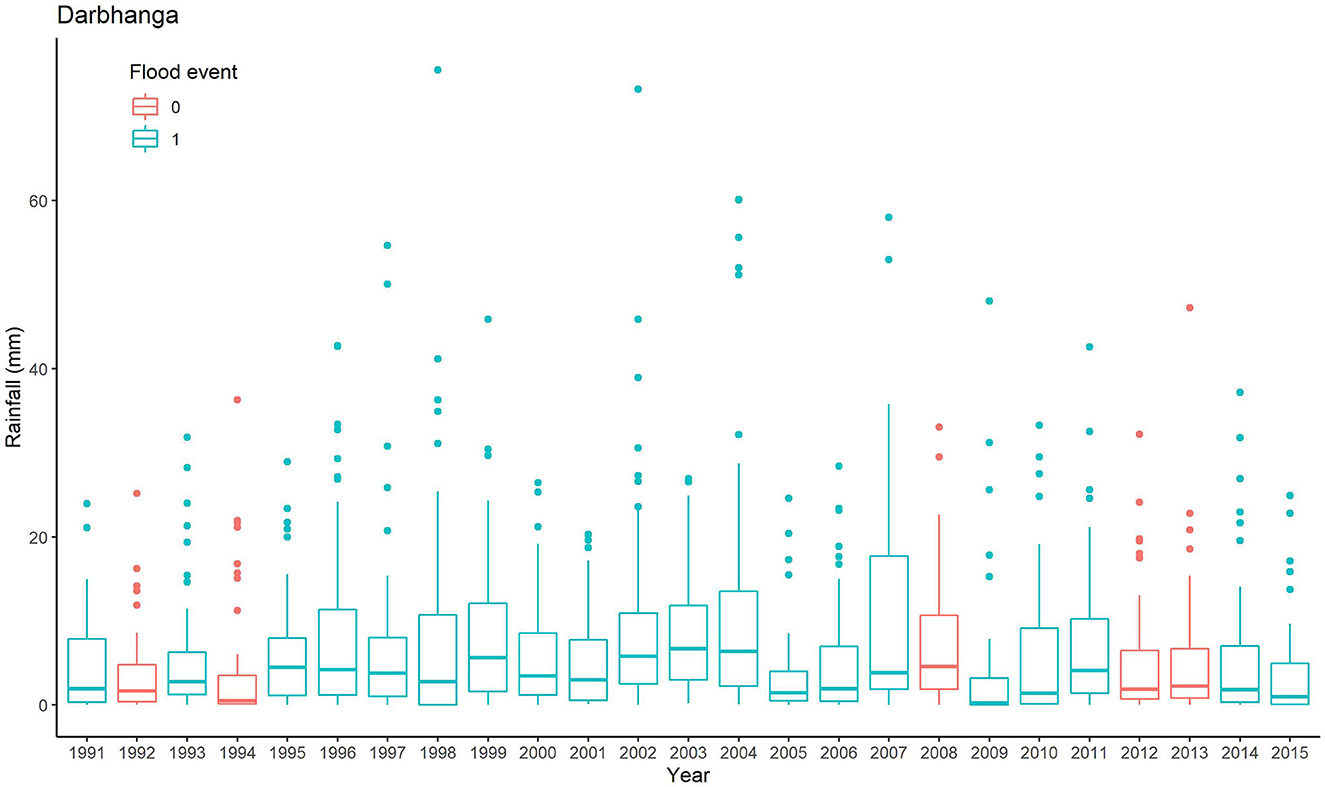
Figure 3. Darbhanga_monthly rainfall _flood events_(June-July).
We ran another generalized logistic model to explore the relationship between extreme rainfall and flood events in the Darbhanga district. For this model, we created two categories, June to July, and June to September, and tested them against the flood events (Figures 3, 4). The June to July rainfall events, all categories, low, severe, and extreme, and flood events were significant but they were not sufficient to establish a direct relationship with flooding events. The odds of having a flood remained more or less similar to the daily and annual rainfall in this category as well. Finally, we have looked at the June to September rainfall in all three categories, the low, severe, and extreme rainfall events. We found that even the June to September, rainfall, and flooding was significant, and hence, the odds of having a flood remained similar, with a weaker correlation (Table 2).
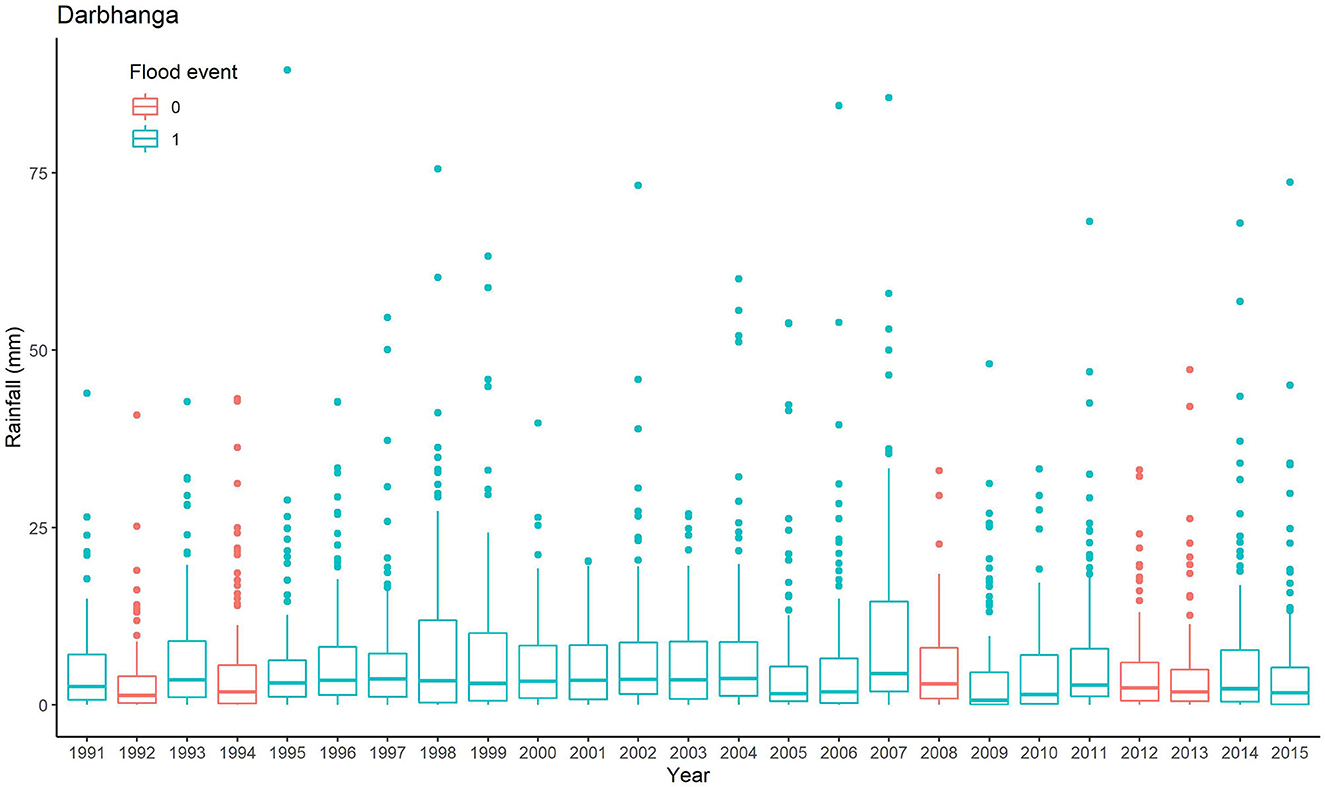
Figure 4. Darbhanga_monthly rainfall_ flood events_(June-September).
The district of Saharsa also shows a similar relationship between rainfall events and flood events. In Saharsa, the odds of having a flood were significant but not entirely responsible for the flood. In the case of the Saharsa district, the daily rainfall and flood events, however, suggest that extreme rainfall events are significantly related to flood events (Figure 5). In Saharsa, the year 1994 and 2006 were exceptions when floods did not occur and we doubt the catchment characteristics (Figure 6). We then tested the relationship between flood events and extreme rainfall events by categorizing the rainfall in summer monsoons as low (0 to 50) mm, severe (50–100) mm, and extreme rainfall (more than 100) mm. We ran a generalized logistic model to test the relationship between extreme rainfall and flood events. For this model, we tested rainfall depths under two categories against the flood events, June to July, and June to September.
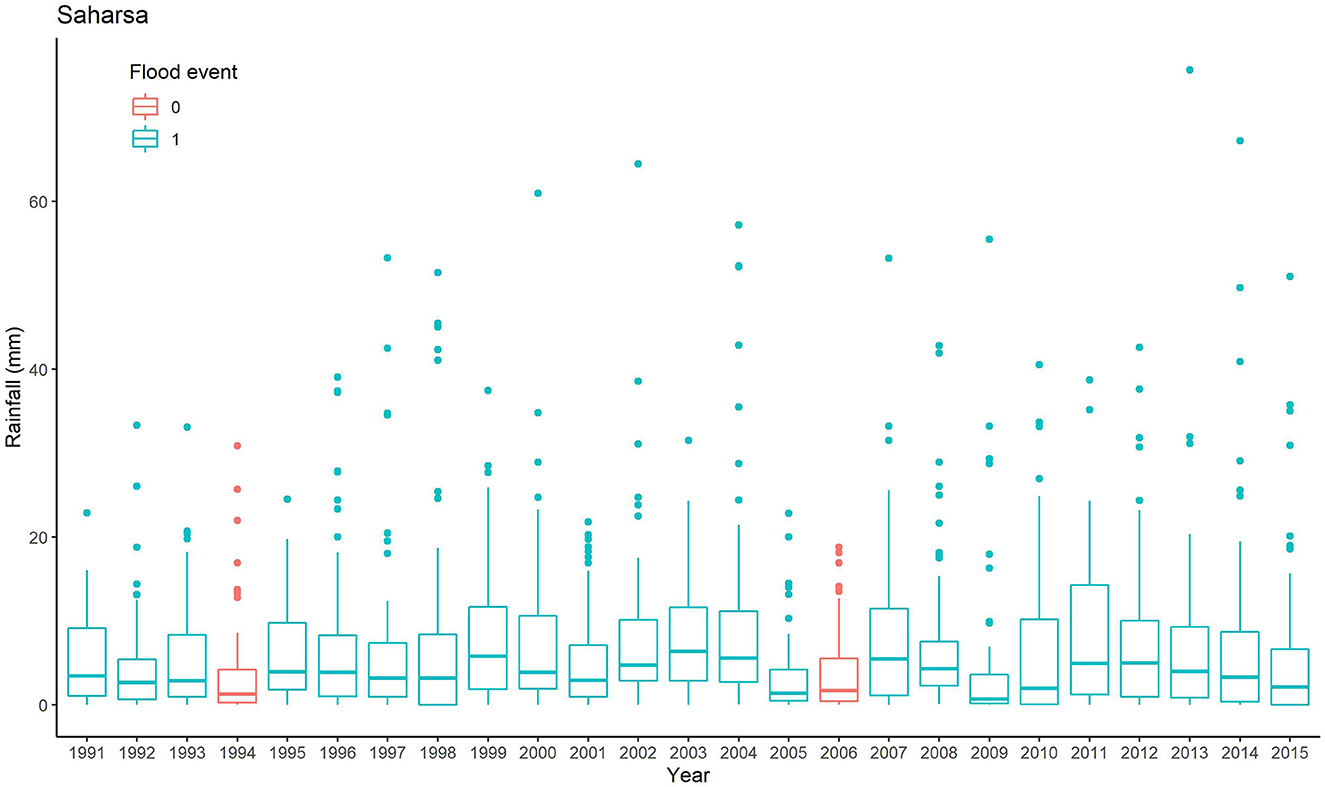
Figure 5. Saharsa_monthly rainfall_flood events_(June-July).
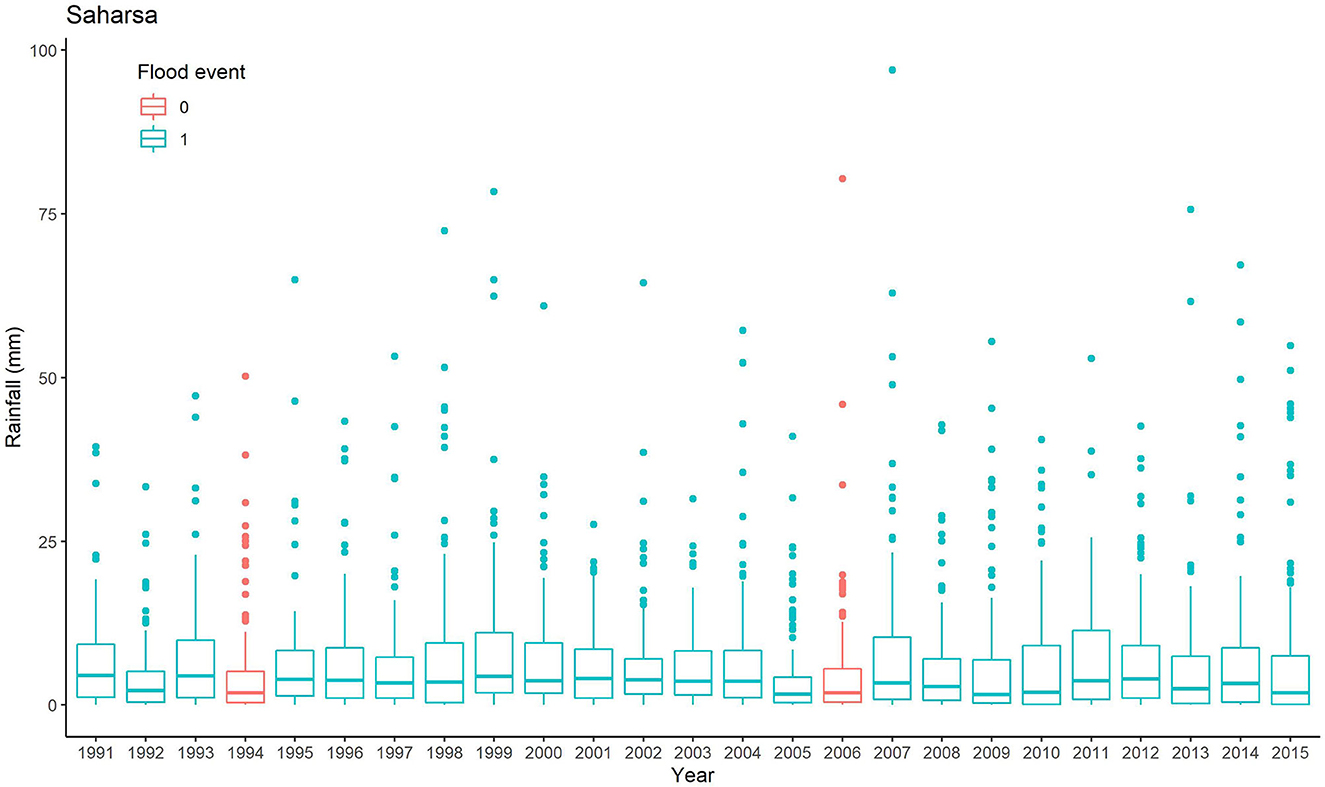
Figure 6. Saharsa_monthly rainfall_flood events_(June-September).
The above set of analyses suggests that the June to July rainfall events, under all categories, low, severe, and extreme, and flood events were significant but they were not sufficient to cause flooding (Figure 6). Therefore, the odds of having a flood remained more or less similar to that of the daily annual rainfall. As shown in Table 2, even when the rainfall lies in the severe and extreme categories in Darbhanga and Saharsa districts, these rainfall events themselves are not entirely responsible for the flooding events. We, therefore, claim that the flooding in both Darbhanga and Saharsa districts is triggered by factors other than the local rainfall such as rainfall in the upper catchment area of river Kosi. In both Darbhanga and Saharsa districts where our study villages are located, we did find a correlation between rainfall depths and the occurrence of flood events, but the relationship was less significant. It is clear that with greater rainfall, flood events are sure to happen but there were 5 years when floods did not happen even when there were extreme rainfall events. Therefore, even if the odds are high that with medium to extreme rainfall there will be a flood, it, however, is not entirely responsible for all the floods.
The flood events data in the district of Darbhanga suggest that during the post-embankment period many flood events occurred due to the breaching of embankments in the Kosi, Kamala, Gandak, and Burhi-Gandak rivers. We also ran a generalized logistic model with the continuous variable, the daily rainfall, and categorical variable presence or absence of the embankments, as shown in Table 3, and found that the odds of flood occurrence reduced in the presence of embankments in the Darbhanga district. Therefore, the embankments are showing a positive intervention in flood control and prevention. However, the perception information collected from household data suggests that the presence of embankments resulted in a high occurrence of floods for those villages, which are inside the embankments. For villages that are outside the embankments, the breaching of these embankments tops the list of factors responsible for recurring floods in their villages both inside and outside of the Kosi embankments.
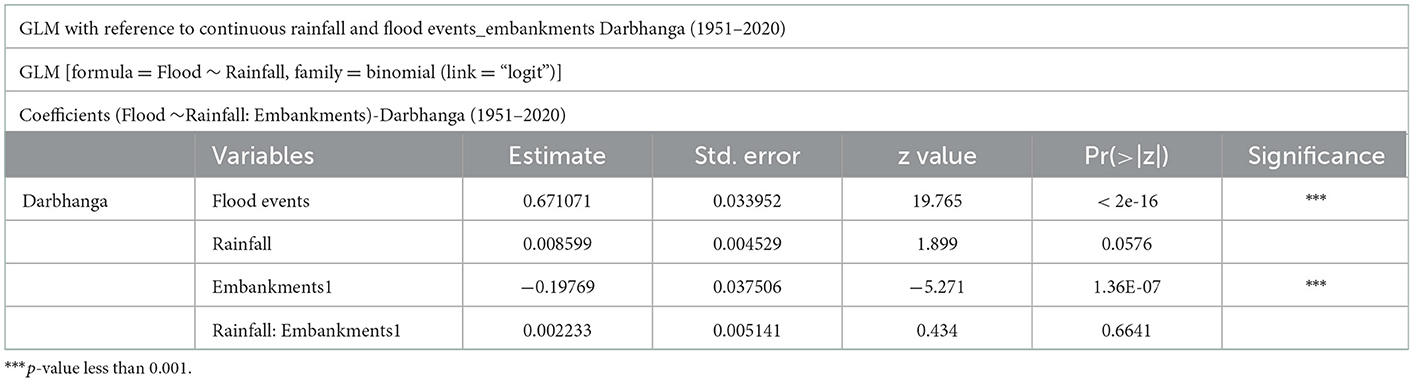
Table 3. GLM_rainfall and flood events_embankments (Darbhanga)-1951 to 2020.
3.2. Results-the socio-economic costs of flooding
Primary data collected using household interviews suggest a different narrative on the causes of floods. Especially in the Kosi region, the district of Darbhanga and Saharsa both are flood-prone. Of the sixty-five households interviewed, forty-three reported that the flood frequency has increased post-embankment (Table 4), whereas fifty-four households confirmed that, the flood intensity has also increased in the post-embankment period (Table 5). The floodwater, which used to inundate fields for a little more than a month, now inundates the entire region for 4–5 months affecting the entire crop cycle and leading at times to crop loss in certain pockets of the lower Kosi region, particularly in the Kiratpur and Gorabauram community development blocks.
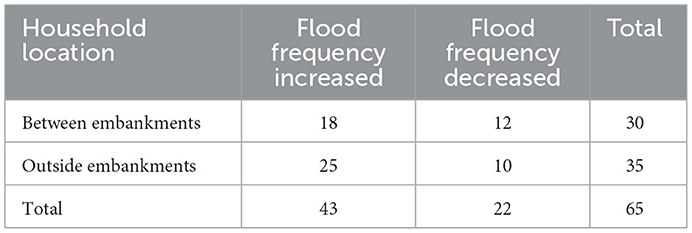
Table 4. Household responses on flood frequency in post embankment period.
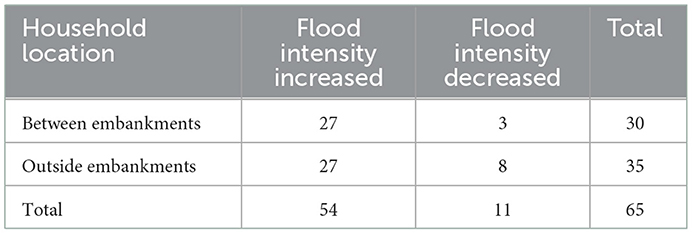
Table 5. Households responses on flood intensity in post embankment period.
Among household respondents, fifty-nine reported that they experience restrictions on their mobility as “routine” difficulties for at least 4 months. These include especially, daily life activities such as going to school, markets, banks and temples, collecting grass and fuelwood, grazing animals, doing agriculture, and attending marriage ceremonies and other auspicious events and rituals. Frequently these visits and commutes are disrupted and postponed or canceled until the floodwater recedes. Visiting toilets is reported as one of the most difficult tasks followed by cooking and finding a dry space to rest and sleep. The fact is that most households do not have toilets and those who have cannot use them because toilets also get flooded. Since there are no dry spaces left during floods apart from houses, going for open defecation outside of the village is also restricted.
Primary data analysis and field observations reveal that breaches in the embankments upstream and the rainfall in other districts located in the north affects flooding events significantly in these two districts. At the same time, rainfall in the upper catchments of Nepal affects the immediate Terai region of both Nepal and North Bihar of which Darbhanga and Saharsa are an integral part. One indicator or proof of increased flood frequency and flood intensity in these two districts is the habitation-related cost of living. The increased and never-ending expenditure on keeping a house safe after a flood is a clear indicator of changing flood regimes in Kosi villages (Table 6).
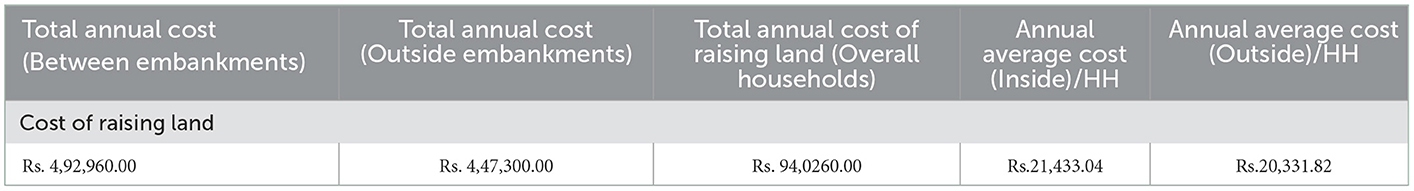
Table 6. The cost of raising land in selected study villages based on their location.
On average, a household located inside the Kosi embankments spends Indian rupees (INR) 21,000 (US Dollar 253.52) every year raising the land to keep the homestead safe until the next flood. It is almost similar for households living outside the embankments as well where the average annual cost is around 20,000 INR (US Dollar 241.45) a year (Table 6). The details on the number of households that were interviewed who have raised their land in 16 study villages and the overall percentage of respondents who reported raising the land to keep their households safe from floods are around 71 % while those who did not raise their land are 29% (Table 7).
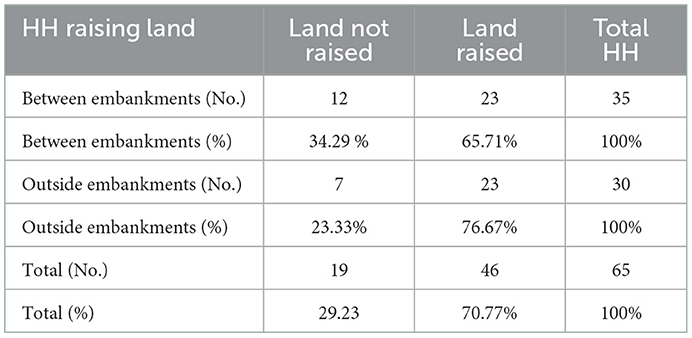
Table 7. Number of households raising land based on location.
We have created the village profiles to highlight the safety of the study villages against flooding based on their location (Table 8). Forty-nine out of sixty-five households responded that their families are safe against flood and only 16 out of 65 responded to being unsafe. However, the 16 study villages located in four CDBs, Kiratpur and Gorabauram from Darbhanga district, and Mahishi and Nauhatta from Saharsa district have similar settlement patterns. The most affluent caste communities in the villages inside Kosi embankments including Muslims and Yadav occupy the center and higher grounds in the villages. The Musahar, Mallah, and other lower-caste marginalized communities live on the periphery of the villages. Similarly, in the villages located outside and adjacent to the embankments, the upper caste Brahmins occupy the center of the villages, which are at higher elevations and less prone to flooding.
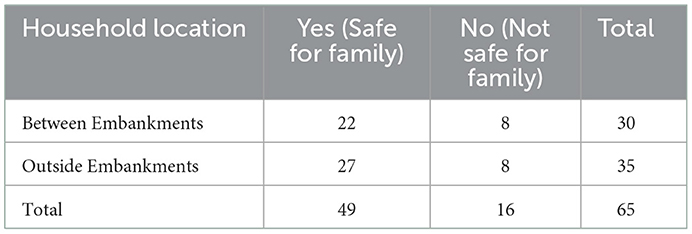
Table 8. Household responses on the safety of their family in their current location.
There are separate settlements in the form of Musahar and Mallah hamlets outside of the main villages such as at Bath Mansara, Rauta of Akhatwara, Bardipur Khainsa of Khainsa, and Jalai Musahari of Jalai, Narkatiya of Jamalpur, Terhi Chauri-Mansara, which are located outside and adjacent to the embankments. These communities earlier used to live in the main village but now live outside in the low-lying areas or on the embankments prone to flooding and under constant fear of eviction.
The Brahmins are the main landholders of cultivable lands, while the Musahar, Mallah, and other lower caste communities work on their land as daily wage laborers. Similarly, there are Musahar and Mallah hamlets inside Kosi embankments at Engineer Tola of Bakonia, Darhaar, Jhara Musahari, and Jharba Musahari, Lilja of Maheshpur that are cut off from the main villages. They are forced to depend on all the provisions and facilities from the main villages. Almost every Yadav and Muslim household has agricultural land except at Jharba where only Mallah has cultivable land. Figure 2 shows the actual geographical locations of the selected study villages in the four community development blocks of the Darbhanga and Saharsa districts.
The legend in the map indicates the different land features such as eastern and western Kosi and Kamala river embankments, the administrative boundaries of the four selected community development blocks, and the district boundaries. The arrow marks indicate the actual location of the study villages in the two districts. The Kosi landscape is very complex and the embankments make it very difficult for the communities, especially those living between them because of the frequent and unpredictable floods, the same has been illustrated in Figure 7.
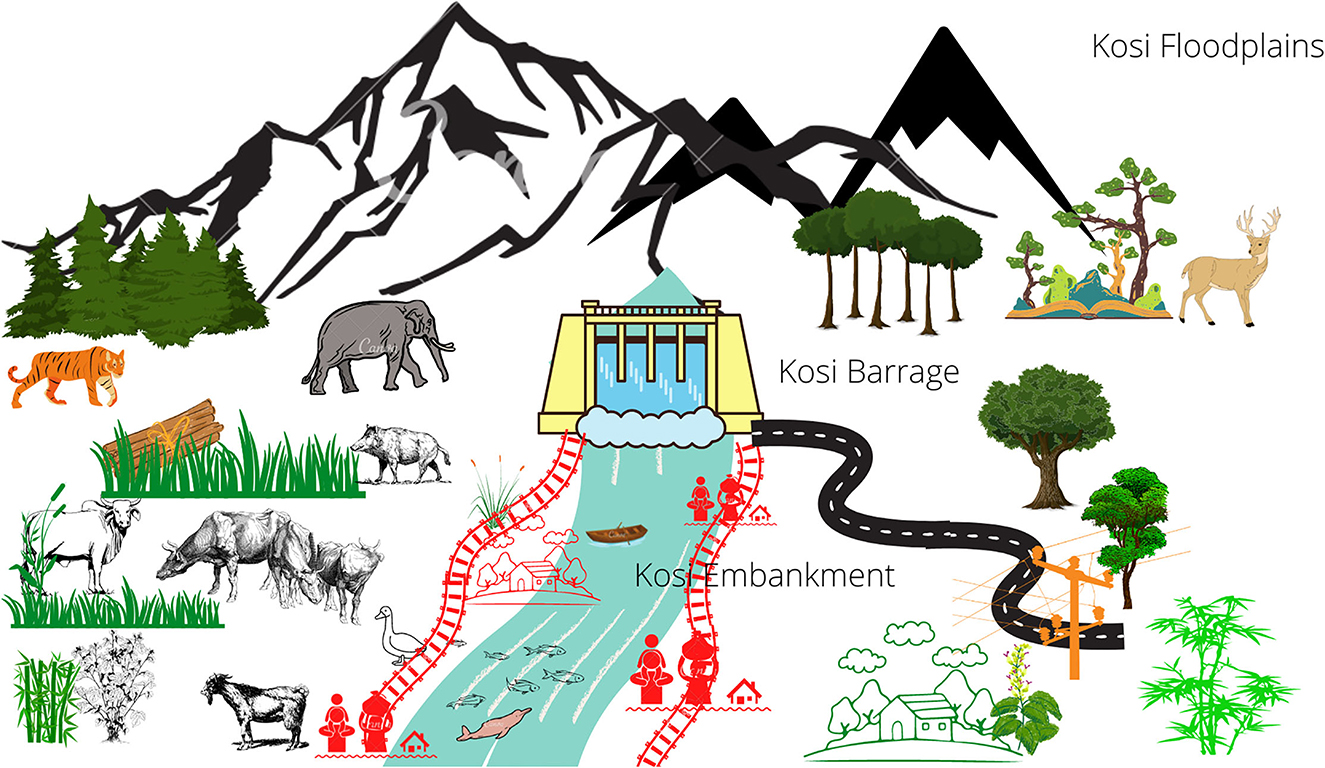
Figure 7. Illustration of Kosi floodplains.
Our research work investigates the causes of the increase in flood intensity and frequency and what are its implications, in particular on the cost of living and changes to their locational vulnerability. We have found that the biophysical factors such as the precipitation in the Kosi catchment are not entirely responsible for the increased flooding. The flood protection structures such as the Kosi barrage and Kosi embankments could be the factors responsible for the changed perception of the communities about flood intensity and frequency since the 1960's.
At the same time, the geographical location of the households and communities in the Kosi floodplains, their caste status, and socioeconomic class affect their flood vulnerability in the Kosi floodplains. Earlier, the location with respect to the embankments was thought to be the main factor responsible for the flood vulnerability of the communities. Our finding suggests that not only location but also contextual factors such as social class-caste and associated economic status are also responsible factors for the increased flood vulnerability of the communities. This is an environmentally unjust circumstance involving disparate risk exposures of marginalized communities like Musahar and Mallah.
4. Discussion
Kosi's communities have accepted embankments as the new normal in the post-embankments period, the 1960's and are trying to cope with the existing challenges. Due to floods, the cost of living has increased, and communities have to look for local adaptation measures to deal with impacts. Marginalized communities have lost faith in getting help from better-off communities and have also started depending heavily on the state and central governments for help.
However, the systematic caste-based exclusion of lower caste communities from relief and rehabilitation funds from the central and state government is pushing them into poverty and flood risk. Therefore, it is important to differentiate flood risks, including regular displacements due to floods, both at the larger community level and even within the same community at the household level to plan any interventions. Community perception of embankments as good or bad is mostly influenced by their location with respect to the embankments and their caste and socio-economic status in the Kosi villages.
This biophysical change in the floodplains has given rise to disproportionate flood risk distribution where the embankments are protecting some while negatively and disproportionately affecting others. This demonstrates a case for regional environmental injustice. Environmental justice, especially the distributional justice framework has been used in this study to establish why the Kosi region as a whole is more vulnerable to flood due to regional injustice wrought by changes to the landscapes' bio-physicality after the construction of embankments. Kosi communities perceive that they have no other option but to live with floods due to irreversible changes brought by the embankments. Their current inability to do anything about the embankments tells that they are contextually vulnerable to floods in this region. This has led to the development of both mental and physical adaptations among the Kosi communities including innovative ones like fuel making, the use of manejara plants to control the weeds, sending children to study outside and accepting the fact that they have to live with the flood. All they need is some help from the government and other organizations to empower themselves so that they earn a living and live with dignity in the safety of their homes and not in the relief camps which according to the communities are the worst place possible during a flood.
The place-based vulnerability prevailing elsewhere is very similar to what we have found in the form of locational vulnerability (Cutter et al., 2000). Socio-economic factors such as landholding, livelihood opportunities, connectivity, main or satellite village, caste, economic class, and gender interact affecting different communities differently, with the marginal communities being the most vulnerable and facing climate-driven displacement (Jayawardhan, 2017).
As the climate is changing and temperature is rising, the precipitation trend in the lower Himalayas is also changing, affecting the flood events in the lower Kosi region (Rajbhandari et al., 2018). The communities and societies living at the highest and lowest elevation in a river basin are the most affected. Those living at the highest elevation suffer due to lack of potable water not in the physical form but because of institutional control of water distribution and disparities based on the socio-economic conditions of the community members while those living at the lowest are suffering because of excess of water (Sahani, 2018; Shah and Badiger, 2020).
Much of the runoff generated from rainfall in the upper catchments flows faster downstream, and the moment it reaches the flatter flood plain, starts overbank flooding, and very quickly the whole area gets flooded (Jaiswal and Vyas, 1969). This has a visible impact on the way people live and thrive in the Kosi villages. The households located inside and adjacent to embankments raise their lands twice a year, while the households located inside the embankments have to raise them at least four times. In addition, the type of houses built in the Kosi villages depends on where the houses are located with respect to the embankments. The houses built inside and adjacent to the embankments are mostly Kutcha (semi-permanent) that can be quickly and easily assembled and dismantled. They use portable cement pillars, detachable rooftops, and sidewalls made up of locally available tall grasses and Manejara.7
The communities living in the Kosi region have to be prepared to move and relocate. The life and livelihood of the people are as dynamic and fluid as the floodwater itself, which comes and goes and thus shapes the landscape and all the activities of communities have to adapt to it. In terms of changes in cultural practices, earlier weddings used to happen between families across the landscape from farther places. Since the construction of the embankments, there are restrictions on movement affecting connectivity and cultural practices and this has brought out major changes in marriage alliances. The communities living outside seek alliance from families from outside embankment villages and not with villages located inside the Kosi embankments. Many parents refuse to accept wedding proposals from the villages located inside the Kosi embankment because of recurring floods and poor connectivity.
The communities living outside seek alliance from families from outside embankment villages and not with villages located inside the Kosi embankments. The Kosi region lacks public infrastructure and utilities due to a lack of investments. The poor housing conditions and non-existent public transport in the flood-prone region of Kosi indicate the marginalization by the state and market (Jaiswal and Vyas, 1969). During short-duration floods, agricultural productivity is quite good and farmers can earn enough income for an entire year. However, since the land holding is much skewed the landowners reap most benefits from agriculture and trickles reach the marginal classes such as the Musahar and Mallah communities (Bharti, 1992).
Both Musahar and Mallah communities, however, perceive that the flood frequency and intensity have increased in the post-embankment period, especially inside the embankments and it has increased the flood duration affecting the number of crops grown and their daily life, education of the children and overall health and wellbeing of the communities living in the flood prone-villages. Sen (1968) argues that “economic growth in itself may be far from “the best contraceptive,” but social development, especially women's education and employment, can be very effective indeed.
The Kosi embankments in North Bihar have created a social-institutional divide along with the physical one affecting the social relations and institutional bindings of the communities living on either side of it. The study on recovery from the cyclone in Bangladesh suggests that social ties and social capital in the form of relationships and networks with other communities do help recover from a disaster (Masud-All-Kamal and Monirul Hassan, 2018). Cash in hand is the biggest savior during floods apart from social networks in the village. Women respondents believe that prior preparation for a flood is not feasible because most often the flood is sudden and unexpected. The quantity and types of flood exposure affect the resilience of the households to flooding, multiple flood exposure do help build resilience but after a few exposures, the negative impacts of flood take a toll and hence make the households very skeptical about flooding (Kuhlicke et al., 2020).
5. Conclusion
The state of Bihar, in particular, the Kosi region of North Bihar is inherently prone to extreme rainfall events and intense flooding due to its geographical location in the Ganga river basin. The geomorphology of the river also makes it highly susceptible to natural hazards including recurring floods. Flood protection structures such as embankments make it worse by jacketing the heavy sediment load of the river Kosi and raising the riverbeds affecting the communities living in the belly of river Kosi, outside and adjacent to the embankments. Our analysis of the rainfall suggests that except for local extreme rainfall events, which are directly responsible for flood events, low and moderate rainfall events do not directly contribute to the flood events, but the rainfall in the upper catchments does. Besides heavy rainfall events, the Kosi river morphology also plays an important role in the frequency, intensity, and duration of the flood.
While the role of embankments is to minimize or prevent communities from getting affected by the flood, our household surveys suggest these embankments exacerbate the intensities and duration of the flood event not just for communities living inside the embankments but that outside and adjacent to the embankments when a breach occurs. Our analysis of primary data analysis from household interviews suggests that the cost of rebuilding houses post-flooding has increased over the years compared to the period before embankments. The communities perceive that the flood frequency and intensity have increased over the years both inside and outside of these embankments. Since the embankments, there has been a shift in the cropping pattern from paddy and wheat, to maize due to changes in the soil composition from clay to loamy sand (Jaiswal and Vyas, 1969).
This has further consequences on the socio-economic conditions of the communities living in the flood-prone villages of Kosi. The standard of living in the Kosi villages has deteriorated due to a lack of roads, educational institutions, and healthcare facilities (Minakshi, 2012). This makes these communities, especially the marginalized Musahar and Mallah more susceptible to flooding and hence more vulnerable to flood risk and loss of livelihood. In the event of extreme rainfall and flooding, the marginal communities are the ones affected the most and take years to recover from it (Wilson et al., 2021).
Our study shows the impact of the flood on marginal communities as a threshold and how that understanding can be used in another context with other communities in case of a climate-driven calamity. With the inherent contextual marginalization, the changing flood frequency and flood intensity in the post-embankment period have made the communities highly susceptible and vulnerable to floods. Our findings also suggest that not only the location of where the communities live, social caste, economic class and associated factors are also responsible for increasing the flood vulnerability of the communities.
Further, the research we communicate through this paper besides disaggregating displacement risks also contributes to displacement literature by demonstrating how displacement is constant with people periodically moving to higher grounds during floods. The paper establishes environmental inequality in Bihar's Kosi region, by demonstrating how flood risks are disproportionately distributed not just between communities, but also amongst them in gender terms.
Data availability statement
The original contributions presented in the study are included in the article/Supplementary material, further inquiries can be directed to the corresponding author.
Ethics statement
Ethical review and approval was not required for the study on human participants in accordance with the local legislation and institutional requirements. Written informed consent for participation was not required for this study in accordance with the national legislation and the institutional requirements.
Author contributions
All authors listed have made a substantial, direct, and intellectual contribution to the work and approved it for publication.
Acknowledgments
I would like to sincerely thank Veena Srinavasan, Senior Fellow (ATREE) for helping me with data analysis. I thank Ashmita Sengupta and Milind Bunyan, Fellow (ATREE) for their guidance in running and interpreting the GLM models in R. I thank Ganesh Shinde and Shashank Palur for their assistance in mapping and data entry. Finally, I would like to thank my colleagues, Anirban Roy for helping me how to address the comments and Anoop, Sriranjni and Amrita for providing their feedback to redesign the abstract.
Conflict of interest
The authors declare that the research was conducted in the absence of any commercial or financial relationships that could be construed as a potential conflict of interest.
Publisher's note
All claims expressed in this article are solely those of the authors and do not necessarily represent those of their affiliated organizations, or those of the publisher, the editors and the reviewers. Any product that may be evaluated in this article, or claim that may be made by its manufacturer, is not guaranteed or endorsed by the publisher.
Supplementary material
The Supplementary Material for this article can be found online at: https://www.frontiersin.org/articles/10.3389/frwa.2023.1017945/full#supplementary-material
Abbreviations
JJAS, June, July, August, and September; CMIP, Coupled Model Intercomparison Project; Dd, Drainage Density; Tr, Drainage Texture; Ff, Form Factor; Re, Elongation Ratio; Rc, Circulatory Ratio; Cc, Compactness Constant; CCM, Constant Channel Maintenance; APHRODITE, Asian Precipitation-Highly Resolved Observational Data Integration Toward Evaluation of the Water Resources; GLM, Generalized Linear Model; CDB, Community Development Block; mm, Millimeter; ATREE, Ashoka Trust for Research in Ecology & the Environment; AMSL, Above Mean Sea Level; DMD, Disaster Management Authority; GEE, Google Earth Engine.
Footnotes
1. ^Elongation ratio is the ratio of diameter of a circle having the same area as of basin to the maximum basin length.
2. ^Circularity ratio is the ratio of area of drainage basin to the area of a circle having the same perimeter as of basin.
3. ^Compactness constant denotes the relationship of circular basin with that of its hydrological characteristics.
4. ^Constant of channel maintenance is the required minimum area for the maintenance and development of a channel. It denotes the basin area needed for a linear length of channel.
5. ^Dissection index is the ratio between relative reliefs to its absolute relief. It indicates the vertical erosion and dissected characteristics of a basin.
6. ^Ruggedness index indicates the stages of landform development as well as instability of the region or basin. The high value of occurs when both drainage density and relative relief are large, and slope is steep.
7. ^A Tall shrub of legume family.
References
Ardiclioglu, M., Hadi, A. M. W. M., Periku, E., and Kuriqi, A. (2022). Experimental and numerical investigation of bridge configuration effect on hydraulic regime. Int. J. Civil Eng. 20, 981–991. doi: 10.1007/s40999-022-00715-2
Avand, M., Kuriqi, A., Khazaei, M., and Ghorbanzadeh, O. (2022). DEM resolution effects on machine learning performance for flood probability mapping. J. Hydro Environ. Res. 40, 1–16. doi: 10.1016/j.jher.2021.10.002
Baghel, R. (2013). Knowledge, power and the transformation of rivers: the spatial, governmental and subjective dimensions of expert discourse on river control in India (Unpublished Doctoral Thesis). Ruprecht-Karls-Universität Heidelberg, Germany.
Basistha, A., Arya, D. S., and Goel, N. K. (2009). Analysis of historical changes in rainfall in the Indian Himalayas. Int. J. Climatol. 29, 555–572. doi: 10.1002/joc.1706
Bharti, I. (1992). Bihar's bane: slow progress on land reforms. Econ. Polit. Wkly. 27, 628–630. doi: 10.2307/4397723
Bisht, D. S., Chatterjee, C., Raghuwanshi, N. S., and Sridhar, V. (2018). Spatio-temporal trends of rainfall across Indian river basins. Theor. Appl. Climatol. 132, 419–436. doi: 10.1007/s00704-017-2095-8
Boyce, J. K. (1990). Birth of a megaproject: political economy of flood control in Bangladesh. Environ. Manage. 14, 419–428. doi: 10.1007/BF02394131
Bronaugh, D., and Werner, A. (2019). zyp: Zhang + Yue-Pilon Trends Package. Pacific Climate Impacts Consortium. Available online at: https://cran.r-project.org/web/packages/zyp/index.html (accessed October 24, 2022).
Central Groundwater Board (2013). Ground Water Information Booklet Darbhanga District, Bihar State. Available online at: https://cgwb.gov.in/District_Profile/Bihar/Darbhanga.pdf
Chakraborty, T., Kar, R., Ghosh, P., and Basu, S. (2010). Kosi megafan: historical records, geomorphology and the recent avulsion of the Kosi River. Quatern. Int. 227, 143–160. doi: 10.1016/j.quaint.2009.12.002
Chen, N. Sh., Hu, G. Sh., Deng, W., Khanal, N., Zhu, Y. H., and Han, D. (2013). On the water hazards in the trans-boundary Kosi River basin. Nat. Hazards Earth Syst. Sci. 13, 795–808. doi: 10.5194/nhess-13-795-2013
Chowdary, V. M., Chandran, R. V., Neeti, N., Bothale, R. V., Srivastava, Y. K., and Ingle, P. (2008). Assessment of surface and sub-surface waterlogged areas in irrigation command areas of Bihar state using remote sensing and GIS. Agric. Water Manag. 95, 754–766. doi: 10.1016/j.agwat.2008.02.009
Cutter, S. L., Mitchell, J. T., and Scott, M. S. (2000). Revealing the vulnerability of people and places: a case study of georgetown county, South Carolina. Ann. Assoc. Am. Geogr. 90, 713–737. doi: 10.1111/0004-5608.00219
Dauji, S. (2021). Sen's innovative method for trend analysis of epidemic: a case study of Covid-19 pandemic in India. Trans. Indian Natl. Acad. Eng. 6, 507–521. doi: 10.1007/s41403-021-00219-w
Deshpande, N. R., Kothawale, D. R., and Kulkarni, A. (2016). Changes in climate extremes over major river basins of India. Int. J. Climatol. 36, 4548–4559. doi: 10.1002/joc.4651
DMD, B. (2020). Disaster Management Department, Disaster Management Department, Bihar. Available online at: https://state.bihar.gov.in/disastermgmt/CitizenHome.html (accessed July 13, 2022).
Dogra, B., Embree, A., and Halliday, F. (2014). More floods with flood control. Econ. Polit. Wkly. 32, 933–934. doi: 10.2307/4405363
D'Souza, R. (2006). Drowned and Dammed: Colonial Capitalism and Flood Control in Eastern India, Drowned and Dammed: Colonial Capitalism and Flood Control in Eastern India. Oxford: Oxford University Press. doi: 10.1093/acprof:oso/9780195682175.001.0001
Eyring, V., Bony, S., Meehl, G. A., Senior, C. A., Stevens, B., Stouffer, R. J., et al. (2016). Overview of the coupled model intercomparison project phase 6 (CMIP6) experimental design and organization. Geosci. Model Dev. 9, 1937–1958. doi: 10.5194/gmd-9-1937-2016
Finance Department (2021). Bihar Economic Survey 2020–21. Available online at: https://drive.google.com/file/d/1jv59R2MUpZa5PkfU1q7SD0_E4fTjHZSD/view (accessed July 20, 2022).
Gädeke, A., Wortmann, M., Menz, C., Saiful Islam, A. K. M., Masood, M., Krysanova, V., et al. (2022). Climate impact emergence and flood peak synchronization projections in the Ganges, Brahmaputra and Meghan basins under CMIP5 and CMIP6 scenarios. Environ. Res. Lett. 17, 15. doi: 10.1088/1748-9326/ac8ca1
Gandhi, K. R. K. (1981). Politics of flood relief vs flood control. Econ. Polit. Wkly. 16, 1889–1891. doi: 10.2307/4370398
Gole, C. V., and Chitale, S. V. (1966). Inland delta building activity of Kosi river. J. Hydraul. Div. 92, 111–126. doi: 10.1061/JYCEAJ.0001406
Gorelick, N., Hancher, M., Dixon, M., Ilyushchenko, S., Thau, D., and Moore, R. (2017). Google Earth Engine: planetary-scale geospatial analysis for everyone. Remote Sens. Environ. 202, 18–27. doi: 10.1016/j.rse.2017.06.031
Government of Bihar World Bank. (2010). Kosi Flood Need Assessment Report (2008). Available online at: https://state.bihar.gov.in/disastermgmt/CitizenHome.html
Government of India (2011). Census 2011 India. Available online at: https://www.census2011.co.in/ (accessed 27 September, 2022).
Guhathakurta, P., Kumar, S., Menon, P., Kumar Prasad, A., Sangwan, N., and Advani, S. C. (2020). Observed Rainfall Variability and Changes over Bihar State. IMD, Ministry of Earth Science, Government of India, ESSO/IMD/H, 28. Available at: ESSO/IMD/HS/Rainfall%0AVariability/16(2020)/40%0AObserved (accessed September 27, 2022).
Halgamuge, M. N., and Nirmalathas, A. (2017). Analysis of large flood events: based on flood data during 1985-2016 in Australia and India. Int. J. Disaster Risk Reduct. 24, 1–11. doi: 10.1016/j.ijdrr.2017.05.011
Hijmans, R. J. (2021). CRAN - Package Raster. Raster: Geographic Data Analysis and Modeling. R package version 3.4-10. Available online at: https://cran.r-project.org/web/packages/raster/index.html (accessed March 10, 2022).
Hossain, M. Z. B., Sakai, T., and Hossain, M. Z. B. (2011). River embankment and bank failure: a study on geotechnical characteristics and stability analysis. Am. J. Environ. Sci. 7, 102–107. doi: 10.3844/ajessp.2011.102.107
Ilderomi, A. R., Vojtek, M., Vojteková, J., Pham, Q., Kuriqi, A., and Sepehri, M. (2022). Flood prioritization integrating picture fuzzy-analytic hierarchy and fuzzy-linear assignment model. Arabian J. Geosci. 15, 1–13. doi: 10.1007/s12517-022-10404-y
Jaiswal, N. K., and Vyas, U. K. (1969). Impact of Kosi embankment: a study of two villages in North Bihar. Econ. Polit. Wkly. 4, 1821–1822. doi: 10.2307/40738115
Jayawardhan, S. (2017). Vulnerability and climate change induced human displacement. Consilience 17, 103–142. doi: 10.7916/D8639VFH
Kaushal, R. K., Sarkar, A., Mishra, K., Sinha, R., Nepal, S., and Jain, V. (2020). Spatio-temporal variability in stream power distribution in the Upper Kosi River basin, Central Himalaya: controls and geomorphic implications. Geomorphology 350, 1–15. doi: 10.1016/j.geomorph.2019.106888
Klipalo, E., Besharat, M., and Kuriqi, A. (2022). Full-scale interface friction testing of geotextile-based flood defence structures. Buildings 12, 1–15. doi: 10.3390/buildings12070990
Krause, F. (2016). “One Man's flood defense is another man's flood”: relating through water flows in Gloucestershire, England. Soc. Nat. Resour. 29, 681–695. doi: 10.1080/08941920.2015.1107787
Kuhlicke, C., Masson, T., Kienzler, S., Sieg, T., Thieken, A. H., and Kreibich, H. (2020). Multiple flood experiences and social resilience: findings from three surveys on households and companies exposed to the 2013 flood in Germany. Weather Clim. Soc. 12, 63–88. doi: 10.1175/WCAS-D-18-0069.1
Kumar Panda, P. (2015). Hydrological and 1 D hydrodynamic modeling of Kosi River Paleochannel, Bihar (India). Int. J. Darshan Inst. Eng. Res. Emerg. Technol. 1, 52–58. doi: 10.1007/s11069-011-9869
Kumar, N., and Bhagat, R. B. (2012). Outmigration from Bihar: causes and Consequences. J. Soc. Econ. Stud. 22, 134–144.
Kumar, V., Jain, S. K., and Singh, Y. (2010). Analyse des tendances pluviométriques de long terme en Inde. Hydrol. Sci. J. 55, 484–496. doi: 10.1080/02626667.2010.481373
Kuriqi, A., and Hysa, A. (2022). “Multidimensional aspects of floods: nature-based mitigation measures from basin to river reach scale,” in Handbook of Environmental Chemistry (Springer Science and Business Media Deutschland, Germany), 11–33.
Liao, K. H., Chan, J. K. H., and Huang, Y. L. (2019). Environmental justice and flood prevention: the moral cost of floodwater redistribution. Landsc. Urban Plan. 189, 36–45. doi: 10.1016/j.landurbplan.2019.04.012
MacKenzie, D. I., Nichols, J. D., Royle, J. A., Pollock, K. H., Bailey, L. L., and Hines, J. E. (2018). “Fundamental principals of statistical inference,” in Occupancy Estimation and Modeling (Academic Press), 71–111. doi: 10.1016/b978-0-12-407197-1.00004-1
Maeda, M., Yasutomi, N., and Yatagai, A., (eds.). (2020). The climate data guide: APHRODITE: Asian Precipitation - Highly-Resolved Observational Data Integration Towards Evaluation of Water Resources. Available online at: https://climatedataguide.ucar.edu/climate-data/aphrodite-asian-precipitation-highly-resolved-observational-data-integration-towards (accessed July 13, 2022).
Mahala, A., and Pathak, V. (2019). Determination of evolution stages of landform: a comparative study of Mountain-Plain (Kosi, Bihar) and Plateau-Plain (Kangsabati, WB) regions of tropical India. J. Geogr. Stud. 2, 30–40. doi: 10.21523/gcj5.18020104
Masud-All-Kamal, M., and Monirul Hassan, S. M. (2018). The link between social capital and disaster recovery: evidence from coastal communities in Bangladesh. Nat. Hazards 93, 1547–1564. doi: 10.1007/s11069-018-3367-z
Mehta, L. (2009). “Displaced by development: confronting marginalisation and gender injustice,” in Displaced by Development: Confronting Marginalisation and Gender Injustice (Sage). doi: 10.4135/9788132100959
Minakshi (2012). Women in Disaster?: Case Study of Kosi Flood in Bihar. University of Delhi. Available online at: http://ir.inflibnet.ac.in:8080/jspui/bitstream/10603/31933/16/abstract.pdf (accessed October 23, 2018).
Mishra, D. K. (2008b). Trapped! Between the Devil and Deep Waters: The Story of Bihar's Kosi River. Dehradun: Peoples' Science Institute.
Modak, S., and Kapuria, P. (2020). From Policy to Practice: Charting a Path for Floodplain Zoning in India. Available online at: https://www.orfonline.org/research/from-policy-to-practice-charting-a-path-for-floodplain-zoning-in-india-66717/ (accessed October 7, 2021).
Mondal, A., Khare, D., and Kundu, S. (2015). Spatial and temporal analysis of rainfall and temperature trend of India. Theor. Appl. Climatol. 122, 143–158. doi: 10.1007/s00704-014-1283-z
Onyutha, C. (2021). Graphical-statistical method to explore variability of hydrological time series. Hydrol. Res. 52, 266–283. doi: 10.2166/nh.2020.111
Palanichamy, R. (2020). A Story in Images: Why Does Bihar's Koshi River Change Course So Often? The Wire. Available online at: https://science.thewire.in/environment/koshi-river-avulsion-sedimentation-embankments-bihar-floods/ (accessed October 3, 2022).
Pandey, A. C., Singh, S. K., and Nathawat, M. S. (2010). Waterlogging and flood hazards vulnerability and risk assessment in Indo Gangetic plain. Nat. Hazards 55, 273–289. doi: 10.1007/s11069-010-9525-6
Patakamuri, S. K., and Das, B. (2022). Trendchange: Innovative Trend Analysis and Time-Series Change Point Analysis. Vienna: The R project for Statistical Computing.
Patwardhan, S., Kulkarni, A., and Krishna Kumar, K. (2014). Impact of climate change on the characteristics of Indian summer monsoon onset. Int. J. Atmos. Sci. 2014, 1–11. doi: 10.1155/2014/201695
Pushyamitra (2021). Limitations in Bihar's Flood Relief Likely Due to Budget Constraints, MONGABAY. Available online at: https://india.mongabay.com/2021/08/limitations-in-bihars-flood-relief-likely-due-to-budget-constraints/ (accessed July 20, 2022).
R Core Team. (2020). R: A Language and Environment for Statistical Computing. Vienna: R Foundation for Statistical Computing. Available online at: https://www.eea.europa.eu/data-and-maps/indicators/oxygen-consuming-substances-in-rivers/r-development-core-team-2006 (accessed March 10, 2022).
Radhakrishnan, K., Iyemperumal, S., Jena, S. K., Sarkar, S., and Adhikari, S. (2017). A climate trend analysis of temperature and rainfall in India. Clim. Change Environ. Sustain. 5, 146. doi: 10.5958/2320-642X.2017.00014.X
Rajbhandari, R., Shrestha, A. B., Nepal, S., and Wahid, S. (2018). Projection of future precipitation and temperature change over the transboundary Koshi River basin using regional climate model PRECIS. Atmos. Clim. Sci. 8, 163–191. doi: 10.4236/acs.2018.82012
Saha, S., Chakraborty, D., Paul, R. K., Samanta, S., and Singh, S. B. (2018). Disparity in rainfall trend and patterns among different regions: analysis of 158 years' time series of rainfall dataset across India. Theor. Appl. Climatol. 134, 381–395. doi: 10.1007/s00704-017-2280-9
Saxena, P. D. (2016). Computation of flood vulnerability index [FVI] for kosi river flood affected samastipur district of north bihar - India, by employing multi-parametric approach of simulation. Int. J. Cont. Theory Appl. 9, 123–134. doi: 10.18090/samriddhi.v6i2.1565
Sen, P. K. (1968). Estimates of the regression coefficient based on Kendall's Tau. J. Am. Stat. Assoc. 63, 1379–1389. doi: 10.1080/01621459.1968.10480934
Şen, Z. (2012). Innovative trend analysis methodology. J. Hydrol. Eng. 17, 1042–1046. doi: 10.1061/(ASCE)HE.1943-5584.0000556
Shah, R., and Badiger, S. (2020). Conundrum or paradox: deconstructing the spurious case of water scarcity in the Himalayan Region through an institutional economics narrative. Water Policy 22, 146–161. doi: 10.2166/wp.2018.115
Shrestha, A. B., Bajracharya, S. R., Sharma, A. R., Duo, C., and Kulkarni, A. (2017). Observed trends and changes in daily temperature and precipitation extremes over the Koshi river basin 1975-2010. Int. J. Climatol. 37, 1066–1083. doi: 10.1002/joc.4761
Singh, D., Ghosh, S., Roxy, M. K., and McDermid, S. (2019). Indian summer monsoon: extreme events, historical changes, and role of anthropogenic forcings. Wiley Interdiscipl. Rev. Climate Change 10, 1–35. doi: 10.1002/wcc.571
Singh, N., and Sontakke, N. A. (2002). On climatic fluctuations and environmental changes of the Indo-Gangetic Plains, India. Clim. Change 52, 287–313. doi: 10.1023/A:1013772505484
Singh, P. (2003). Colonising the Rivers: Colonial Technology, Irrigation and Flood Control in North Bihar, 1850 1950. School Of Social Sciences, JNU, Delhi. Available online at: http://shodhganga.inflibnet.ac.in/handle/10603/29310 (accessed August 10, 2022).
Singh, P. (2008). The colonial state, zamindars and the politics of flood control in north Bihar (1850-1945). Indian Econ. Soc. Hist. Rev. 45, 239–259. doi: 10.1177/001946460804500203
Singh, S. K., Pandey, A. C., and Nathawat, M. S. (2011). Rainfall variability and spatio temporal dynamics of flood inundation during the 2008 Kosi flood in Bihar State, India. Asian J. Earth Sci. 4, 9–19. doi: 10.3923/ajes.2011.9.19
Sinha, R. (2008). Kosi: Rising waters, dynamic channels and human disasters. Econ. Polit. Wkly. 43, 42–46. doi: 10.2307/40278180
Sinha, R. (2016). Geomorphology of the Ganges fluvial system in the Himalayan foreland: an update. Rev. Bras. Geomorfol. 5, 71–83. doi: 10.20502/rbg.v5i1.33
Sinha, R., and Friend, P. F. (1994). River systems and their sediment flux, Indo-Gangetic plains, Northern Bihar, India. Sedimentology 41, 825–845. doi: 10.1111/j.1365-3091.1994.tb01426.x
Sinha, R., Nepal, S., and Uddin, K. (2018). Understanding Sediment Management (February), 5. Available online at: https://www.researchgate.net/publication/322976398_Understanding_Sediment_Management (accessed March 7, 2022).
Spearman, C. (1904). The proof and measurement of association between two things. Am. J. Psychol. 15, 72. doi: 10.2307/1412159
Swarnkar, S., Sinha, R., and Tripathi, S. (2020). Morphometric diversity of supply-limited and transport-limited river systems in the Himalayan foreland. Geomorphology 348, 1–15. doi: 10.1016/j.geomorph.2019.106882
Tingsanchali, T., and Karim, F. (2010). Flood-hazard assessment and risk-based zoning of a tropical flood plain: case study of the Yom River, Thailand. Hydrol. Sci. J. 55, 145–161. doi: 10.1080/02626660903545987
Wald, A. (1992). “Sequential tests of statistical hypotheses,” in Breakthroughs in Statistics. New York, NY: Springer. 256–298.
Weng Chan, N. (1997). Increasing flood risk in Malaysia: causes and solutions. Disaster Prev. Manag. 6, 72–86. doi: 10.1108/09653569710164035
Wilson, B., Tate, E., and Emrich, C. T. (2021). Flood recovery outcomes and disaster assistance barriers for vulnerable populations. Front. Water 159. doi: 10.3389/frwa.2021.752307
Keywords: precipitation, Kosi, embankment, flood, vulnerability, marginalized, communities
Citation: Sahani RK, Badiger S, Samrat A and Krishnan S (2023) Flood frequency and flood intensity changes in the post embankment period in the Kosi sub-basin India: Impact of location, caste, and class on the flood vulnerability of the marginal communities. Front. Water 5:1017945. doi: 10.3389/frwa.2023.1017945
Received: 21 August 2022; Accepted: 03 January 2023;
Published: 26 January 2023.
Edited by:
Charles Onyutha, Kyambogo University, UgandaCopyright © 2023 Sahani, Badiger, Samrat and Krishnan. This is an open-access article distributed under the terms of the Creative Commons Attribution License (CC BY). The use, distribution or reproduction in other forums is permitted, provided the original author(s) and the copyright owner(s) are credited and that the original publication in this journal is cited, in accordance with accepted academic practice. No use, distribution or reproduction is permitted which does not comply with these terms.
*Correspondence: Ranjeet Kumar Sahani,  cmFuamVldC5rc0BhdHJlZS5vcmc=
†ORCID: Abhishek Samrat orcid.org/0000-0003-1943-8574
Siddhartha Krishnan orcid.org/0000-0002-2371-5004