 Amber Baele1†
 Fien Waegenaar2,3†
 Katrien De Maeyer4
 Bart De Gusseme5Han Vervaeren6Pieter Spanoghe1
 Nico Boon2,3*
- 1Department of Plants and Crops, Ghent University, Ghent, Belgium
- 2Center for Microbial Ecology and Technology (CMET), Department of Biotechnology, Ghent University, Ghent, Belgium
- 3Center for Advanced Process Technology for Urban Resource Recovery (CAPTURE), Ghent, Belgium
- 4Pidpa, Laboratory, Antwerp, Belgium
- 5FARYS|TMVW, Department R&D—Innovation Water, Ghent, Belgium
- 6De Watergroep, R&D Department, Brussels, Belgium
Providing safe and qualitative drinking water is becoming increasingly important due to climate change and population growth. Water towers are often used to provide storage and ensure water pressure for drinking water distribution. However, microbial regrowth of water is still a challenge during storage and distribution. Moreover, water towers can be used as an aggregation site by insects, mainly flies (Diptera). In this study, ten water towers in Belgium were monitored for 8 months with sticky traps to evaluate fly species diversity, abundances and activity. The results showed the presence of three fly species: Thaumatomyia notata (yellow swarming fly), Musca autumnalis (face fly) and Pollenia spp. (cluster fly). The flies entered the towers in autumn and took shelter against wintering conditions in cracks and crevices, especially on the highest floors where the water tank is located. In this way, flies can come into contact with the drinking water. Based on the monitoring campaign, a risk assessment matrix was set up to determine risks of possible microbial water contaminations caused by flies in water towers. This was validated by a worst-case experiment in laboratory conditions. Face flies (living and dead) were added to tap water to evaluate their influence on microbial water quality and safety using several techniques such as 16S rRNA amplicon sequencing, flow cytometric cell counts and fingerprinting. Our research showed that flies in drinking water promote bacterial growth and change the phenotypic resident drinking water community. Furthermore, new genera such as Pseudomonas and Acinetobacter as well as the coliforms Serratia fonticola and S. liquefaciens were detected when flies were added to tap water. Hence, prevention and intervention measures are important in water quality management to avoid contact between flies and drinking water in water towers. In this study, several effective prevention methods are discussed, such as sealing ventilation, overflow and weep holes with insect screens with adequate mesh size and covering water tanks.
1. Introduction
Safeguarding drinking water quality remains a challenge for drinking water providers through climate change and population growth that are pressurizing the raw water sources and treatment strategies (European Environment Agency, 2018; Konapala et al., 2020). Nowadays, qualitative and safe tap water is guaranteed after it leaves the treatment centers, but water quality can change during storage and distribution due to microbial and physicochemical interactions (Lautenschlager et al., 2013; Prest et al., 2013, 2016a,b; Nescerecka et al., 2014; El-Chakhtoura et al., 2015). The resident microbial community can reach population densities up to 106 cells/mL during distribution. This community is mostly harmless, but can affect the final aesthetic water quality (i.e., odor, taste and color) (Chowdhury, 2012; Van Nevel et al., 2013; Nescerecka et al., 2014). Therefore, the production of biostable water is important. According to Favere et al. (2021), this approach implements both consistent microbial abundance and composition from source to tap, with a certain degree of acceptable change, depending on water source and treatment. Today, disinfectants, mainly chlorine-containing compounds, are used and residuals are generated to control microbial growth and prevent contamination in distribution networks. However, this induces the formation of toxic disinfection by-products or deviating odor and taste (Li and Mitch, 2018; Li et al., 2018). Furthermore, depletion of residual chlorine during distribution leads to microbial regrowth (Sathasivan and Ohgaki, 1999; Liu et al., 2002; Nescerecka et al., 2014; Li et al., 2018).
Biostability of drinking water is affected by several factors such as the type and concentrations of available organic and inorganic nutrients (van der Kooij, 1992; Sousi et al., 2020). Various studies proved that an assimilable organic carbon concentration (AOC) as low as 1 μg C/L corresponds to 103-104 cells/mL in drinking water (van der Kooij et al., 1982; Vital et al., 2012). Additionally, long hydraulic residence times and fluctuating temperatures (15–25°C, e.g., when surface water is used as a source in summer) will stimulate microbial growth and influence the quantity and composition of present nutrients (Kerneïs et al., 1995; Pinto et al., 2014; Prest et al., 2016b; Nescerecka et al., 2018; Favere et al., 2020). Furthermore, the distribution pipeline materials and age can also influence drinking water biostability (Wang et al., 2014). Consequently, it is obligated to evaluate chemical and microbial parameters frequently. Current legislation focuses amongst others on indicator organisms occurring above a certain detection limit, and abnormal changes in heterotrophic plate counts at 22 and 37°C. Both parameters are used as an indicator for fecal contamination and to control the effectiveness of disinfection processes and the cleanliness and integrity of distribution systems (European Union, 1998; VMM, 2020; World Health Organization, 2022). In Flanders, for example, 4.67% norm exceedances of the coliform indicator parameter are measured in 2020 (VMM, 2020). A recent study showed that in more than 45% of the positive cases, Serratia spp., Enterobacter spp., Citrobacter spp. and Klebsiella spp. are present when coliforms are detected (KWR, 2020a).
Water towers provide storage, ensure constant pressure and buffer daily peak demands (Brandt et al., 2017). Since the design depends on the topography of the location and should meet the requirements of the water supply and planning authorities, water towers differ in architecture but have a similar basic structure consisting of an elevated water tank (Ratnayaka et al., 2009). Consequently, they often form distinct landmarks in the environment and may attract hypsotactic insects. Often, insects are attracted to conspicuous, isolated features that form a contrasting silhouette on the horizon (Fraenkel and Gunn, 1961; Campan, 1997). During autumn and winter, water towers and other tall buildings can experience large invasions of shelter seeking insects such as flies and lady beetles (Hodek et al., 1993; Nalepa et al., 2004, 2005; Wang et al., 2011; Dudek et al., 2015). Aggregations of flies (Diptera) can cause great annoyance to homeowners with their presence and smell. Moreover, caution is needed in buildings where close contact with people, food or water is possible as flies are considered as mechanical vectors of various pathogens such as bacteria, fungi, protozoa and viruses (Food and Drug Administration, 1997; Olsen, 1998). The synanthropic housefly, Musca domestica, for example, is an important contributor to the dispersion of various infectious foodborne diseases such as shigellosis and salmonellosis. This is facilitated by their nature, feeding on feces and other organic matter and the constant back and forth movement between their breeding sites and human dwellings where they come in close contact with humans, animals and/or food (De Jesús et al., 2004; Khamesipour et al., 2018). During winter aggregation however, flies show a very different modus vivendi and are not actively feeding nor breeding. Nonetheless, a study by Faulde et al. (2001) showed the potential of cluster flies to transmit bacterial pathogens during a mass infestation in a German hospital while overwintering. All fly samples carried opportunistic or facultative pathogenic bacterial species such as Pseudomonas aeruginosa and Staphylococcus lugdunensis. To our knowledge, no studies on the mechanical transmission of potential pathogenic microorganisms via flies and water have been performed.
In this study, yellow sticky traps were used to monitor insects in water towers across Flanders. Here, the purpose was to identify which flies are present and to elucidate the timing of flies entering and leaving the water towers. In addition, total coliforms were regularly measured in the water towers and a risk assessment was set up. Finally, the influence of the presence of flies on microbial drinking water quality was determined, using the legal microbial water quality parameters as the benchmark, as well as flow cytometric cell counts, phenotypic fingerprinting and 16S rRNA gene amplicon sequencing to further examine the effect on the biostability of the final drinking water.
2. Materials and methods
2.1. Monitoring campaign
2.1.1. Water tower characteristics
Ten different water towers were monitored in Flanders (Belgium) (Table 1). The towers were chosen so that half of them were towers with previously known fly invasion problems and the other half with no previous observed problems. The towers without problems were selected close to the towers with fly invasion problems (within a radius of 10 km) to ensure that environmental variables did not differ too much between towers. The volume of the water tanks in the towers varied between 500 and 3,000 m3, and the height of the towers varied between 22 and 48 m above ground level.
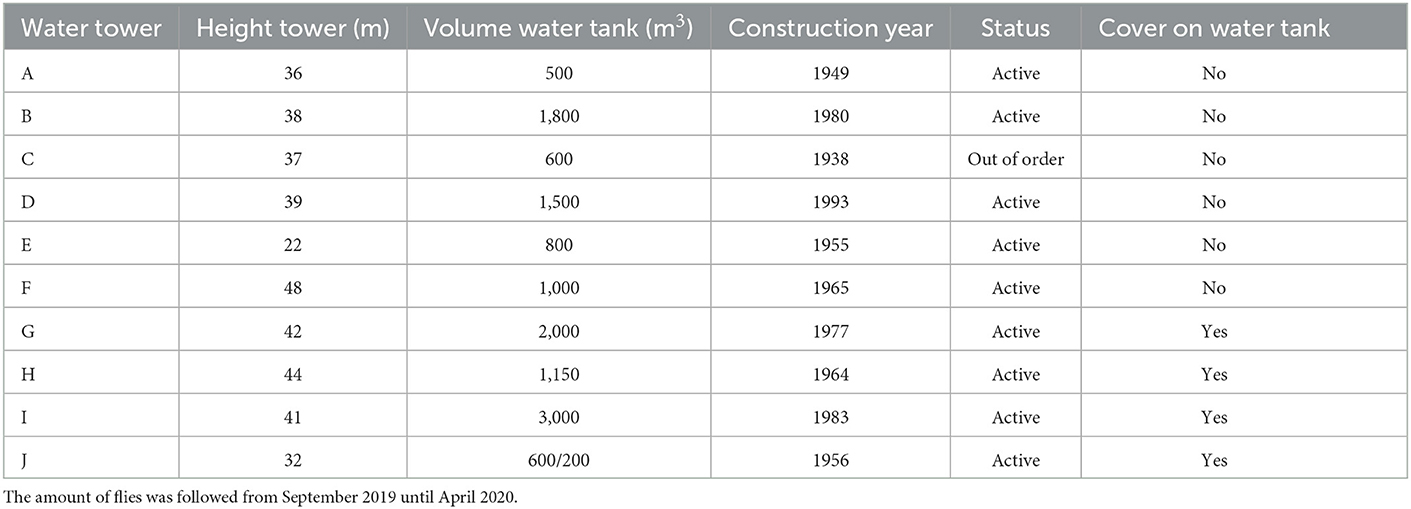
Table 1. Characteristics of the monitored water towers.
2.1.2. Monitoring and identification of flies
Based on the timing of known hibernating insects in Europe such as lady beetles (Coccinellidae), the start date for monitoring was set at the end of summer (September 2019) and terminated at the beginning of spring (last week of April 2020) (Raak-van den Berg et al., 2012). Yellow sticky traps (25 × 10 cm; Biobest, Belgium) were hung with nylon cable ties on the top floor, middle floor and ground floor of each tower. Every week, the sticky plates were collected and wrapped in baking paper to transport to the lab. Flies were counted and identified using forceps, a stereo microscope (Euromex, The Netherlands) and specialized literature. First, species could be identified at family level with Oosterbroek (2015) and finally, flies were identified at species level using specialized morphological keys (D'assis Fonseca, 1968; Jewiss-Gaines et al., 2012; Nartshuk and Andersson, 2013; Gisondi et al., 2020). Temperature and relative humidity (RH) were measured with data loggers (Lascar electronics, United Kingdom) in the water towers. The loggers were placed in proximity of the sticky traps and measured every half hour on the different floors (floor of the water tank, floor just below the water tank and ground floor). When data was available on the entry and exit of the hibernating flies, this was used to elucidate the conditions in which flies can survive during hibernation.
2.1.3. Water quality during monitoring and risk assessment
During monitoring of the flies entering the towers, standard quality parameters were determined on drinking water coming from the water towers by the respective water providers. Water samples were taken from a tap at the base of the towers. Quantification and identification of coliforms and enterococci were performed as described in heterotrophic plate counts (HPC), colilert, enterolert, MALDI-TOF mass spectrometry section. Frequency of sampling differed between water providers (e.g., weekly, biweekly, or more frequently). Based on those measurements and expert judgement, a risk assessment matrix was set up to assess risks of possible microbial water contaminations caused by flies in water towers. To examine the correlation between the presence of flies in the towers and coliforms in the drinking water, the raw data was converted into a binary table. For each tower the total number of flies caught per week at the water tank level was converted to more than one fly present (1) or one or no flies present (0). In the same way, data on the number of coliforms per week detected in the water coming from the towers was converted to binary digits, detected (1) or not detected (0). This led to a classification system where flies were present or absent and coliforms were present or absent. For each tower it was calculated in what proportion the corresponding category occurred. An average was calculated over all water towers and for the towers where a fly invasion problem was identified.
2.2. Batch experiment
2.2.1. Experimental set-up
Face flies (Musca autumnalis) were used to perform a worst-case scenario of the number of flies that can come into contact with drinking water in a water tower. Based on the highest trap count of face flies during one week in the monitoring phase (13 flies on a sticky trap of 200 cm2), a number of 2,600 flies per square meter was considered as a worst-case scenario (13 × 4 = 52 flies per month on a sticky trap of 200 cm2 or 52 × 50 = 2,600 flies/m2). For a tower with a water tank of 12 m diameter and 113.1 m2 surface area, this corresponds to a potential of 3 × 10⁵ flies a month, hoovering or resting above the water surface. In this worst-case scenario it was assumed that no measures were taken to prevent insects from falling into the water. With estimated mortality of 50%, around 1.5 × 10⁵ flies can die and fall into the drinking water when the surface is not covered. The content of the tank of the water source used in this experiment is 500 m3 (water tower A, Table 1). This corresponds to 0.3 flies per liter or a maximum of 3 flies per 10 liters of drinking water.
Water was taken from water tower A in December 2021. The water came from the ingoing tap to avoid possible contamination from the tower and was collected in 10 and 20 L borosilicate glass Schott bottles. The bottles were made AOC-free by rinsing three times with demi water, 0.1 M HCl, TRIS buffer and two times with ultrapure water (Milli-Q, Merck Millipore, Germany) and autoclaved before use. The set-up consisted of six bottles of which two without flies (blanks), two with dead flies and two with living flies. The bottles were kept for seven days at 20°C. Sampling was performed on days 0, 1, 2, 5, and 7.
2.2.2. Fly collection
Flies were collected in water tower A using a homemade insect aspirator Poos (1929) on the same day as the water samples (8th of December 2021) (Supplementary Figure 1). The aspirator was made of a 60 mL polypropylene container with a screw cap (Fisher Scientific, Belgium) in which two holes were drilled. A 50 cm polyvinyl tube (inner diameter 8 mm) was inserted into one of the holes to suck up the insect, while a smaller second tube (40 cm, inner diameter 4 mm) was inserted into the other hole as a mouthpart for sucking in air. A gauze covered the end of the tube to prevent swallowing insects. Before collecting, the aspirator was kept in a freezer (−20°C). Twelve face flies were collected and sedated by putting them in the refrigerator for 5 min to immobilize and separate them. Six flies were killed by shaking them vigorously in the aspirator container.
2.3. Chemical and microbial analyses
2.3.1. Total organic carbon (TOC) analysis
Sievers 900 Portable TOC Analyzer (SUEZ Water Technologies & Solutions, USA) was used for the measurement of total organic carbon. Forty mL Sievers TOC Standard Vials (SUEZ Water Technologies & Solutions, USA) and Open-Top Septa Caps (Fisher Scientific, Belgium) were used. TOC samples were stored no longer than 4 days with the use of Fisherbrand Screw Caps (Fisher Scientific, Belgium). The vials were cleaned to remove AOC according to a previously described method (Charnock and Kjønnø, 2000). Briefly, vials and screw caps were washed once with detergent and once without, rinsed three times with ultrapure water, soaked overnight in 0.2 M HCl and again rinsed three times with ultrapure water. The glass vials were covered with aluminum foil and heated to 550°C in a muffle oven for 6 h to remove all trace organics. The screw caps were soaked in a 10% sodium persulphate solution at 60°C for at least 1 h, rinsed three times with ultrapure water and finally air-dried. TOC was measured in technical quadruplicate.
2.3.2. Adenosine triphosphate (ATP) analysis
The ATP concentration was measured using the BacTiter-Glo™ Microbial Cell Viability Assay (Promega, Belgium). A Greiner white opaque CELLSTAR 96 well plate was used. To make the standard curve, a standard series with a range of 103 to 10 nM ATP was setup in triplicate, using 10 mM rATP(Promega, Madison, Wisconsin). Luminescence was measured with the Infinite M Plex, multimode microplate reader (Tecan, Switzerland).
2.3.3. Flow cytometry
Samples were measured with the Attune NxT BRXX (Thermo Fisher Scientific, USA). It is equipped with a blue laser (488 nm), a red laser (638 nm), eight bandpass filters (530/30, 574/26, 695/40, 780/60, 670/14, 720/30, 780/60 nm) and two scatter detectors. The stability of the instrument was controlled daily using Attune Performance Tracking Beads (Thermo Fisher Scientific, USA). A fixed volume of 75 μL was measured and Attune focusing fluid (Thermo Fisher Scientific, USA) as sheath fluid. Samples were stained with 1 v% of SYBR Green I (SG) solution. SYBR Green I (10,000 × concentrate in DMSO, Invitrogen, Belgium) was diluted 100 times in 0.22 μm-filtered DMSO. Incubation was done at 37°C for 20 min. All samples were measured in technical triplicate.
2.3.4. Heterotrophic plate counts (HPC), Colilert, Enterolert, MALDI-TOF mass spectrometry
HPC were analyzed on yeast extract agar (68 ± 4 h at 22°C). A pour plate method was used in which 15 mL liquid agar was added to 1 mL sample according to WAC/V/A/001 (VITO, 2020). Colilert-18 and Quanti-Tray (IDEXX, Germany) were used to measure total coliforms and Escherichia coli according to WAC/V/A/002 (VITO, 2020). Enterolert (IDEXX, Germany) was used for the detection of enterococci according to WAC/V/A/003 (VITO, 2020). To identify coliforms or enterococci, matrix-assisted laser desorption-ionization–time of flight mass spectrometry (MALDI-TOF MS) was performed using a Vitek MS (bioMérieux, Marcy-l'Étoile, France).
2.3.5. DNA extraction and sequencing
The water samples (2 L) were filtered for 16S rRNA gene amplicon sequencing at the beginning and end of the experiment. A filtration unit consisting of six filtration funnels and a Microsart e.jet vacuum pump (Sartorius, Germany) was used. DNA extraction was performed using the DNeasy PowerWaterKit (Qiagen, Germany), following the manufacturer's protocol. A Polymerase Chain Reaction (PCR) was done on the V3-V4 region of the 16S rRNA gene. Locus-specific PCR primers, 5′TCGTCGGCAGCGTCAGATGTGTATAAGACAGCCTACGGGGCWGCAG and 5′GTCTCGTGCTCGGGCTCGAGATGTATAAGACAGGACTACTAATTATCTAATC were used to amplify the genomic regions of interest to be sequenced on MiSeq. The commercial kit Nextera XT Index Kit v2 Set A (Illumina, San Diego, United States) was used to perform the index PCR. For both PCR reactions, Kappa HiFi HotStart ReadyMix (Roche, Pleasonton, United States) was used as mastermix. The Mag-Bind® RxnPure Plus kit (Omega Bio-Tek, Norcross, United States) was used to perform the PCR clean-up. Quality control was done on a LabChip GX Touch instrument with the DNA 5K Reagent Kit (PerkinElmer, Rotterdam, The Netherlands). The sequencing itself was performed with the MiSeq Reagent Kit v3 with MiSeq system (Illumina, San Diego, United States). The taxonomic identification was done in BaseSpace (Illumina's commercial platform) with the RefSeq RDP 16S v3 May 2018 DADA2 32bp database. The PCR and 16S rRNA gene amplicon sequencing were performed by De Watergroep (Leuven, Belgium).
2.4. Data processing and statistical analysis
Data analysis was done in R (Core Team, 2022) in RStudio version 4.2.0 (RStudio Team, 2020). The xlsx package (v0.6.0) was used to analyze the data from the monitoring experiments, TOC and ATP concentrations (Dragulescu and Arendt, 2020). The Flow Cytometry Standard (.fcs) files were imported using the flowCore package (v1.11.20) (Ellis et al., 2022). The background data was removed by manually drawing a gate on the FL1-H (green) and FL3-H (red) fluorescence channels. Using the Phenoflow package (v1.1.12), the single-cell data was converted into a phenotypic fingerprint to calculate the diversity metrics such as alpha and beta diversity as described in Props et al. (2016). Bray-Curtis dissimilarity calculations and beta diversity analysis were performed using the vegan package (v2.6-2) (Oksanen et al., 2022). The phyloseq package (v1.40.0) was used to analyze the results of the 16S rRNA amplicon sequencing (McMurdie and Holmes, 2013). Alpha diversities were calculated from the OTU abundance matrix using the dplyr package (v1.0.9) (Wickham et al., 2022). The vegan package (v2.6-2) was used to calculate Bray-Curtis dissimilarities and corresponding beta diversity between samples (Oksanen et al., 2022). The data was visualized using the ggplot2 (v3.3.6) and ggpubr (v0.4.0) packages (Wickham, 2016; Kassambara, 2020). The data generated by MALDI-TOF MS was analyzed using the MYLA® software (Pidpa, Antwerp). Statistical analysis was done with the dplyr package (v1.0.9) (Wickham et al., 2022). To determine differences between the cytometric fingerprints the vegan package (v2.6-2) was used (Oksanen et al., 2022).
3. Results
3.1. Identification of flies in water towers
Ten water towers were monitored with sticky traps to identify hibernating fly species. Two different species and one genus of Diptera were dominantly present, all of them are known to hibernate gregariously: Musca autumnalis De Geer, 1776 (Diptera: Muscidae) or face fly, Thaumatomyia notata Meigen, 1830 (Diptera: Chloropidae) or yellow swarming fly and members from the genus Pollenia (Diptera: Calliphoridae) or cluster flies (Figure 1).
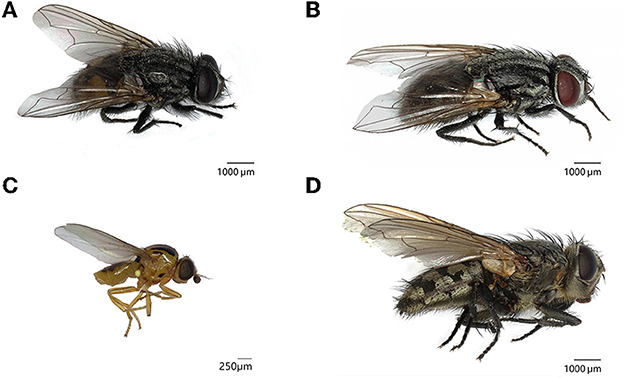
Figure 1. Fly species hibernating in water towers in Flanders, Belgium. (A) Musca autumnalis or face flies (6–10 mm) have a gray to dark gray thorax with four longitudinal thoracic stripes. The compound eyes of the male are close together and the abdomen is black with yellow to orange lateral patches. (B) The female face fly has compound eyes with a wider vertex and the abdomen is mottled black and gray. (C) Thaumatomyia notata or yellow swarming flies are small, yellow flies (2.5–3.5 mm) with dark stripes on the thorax. (D) Cluster flies are members of the genus Pollenia and are characterized by golden brown hairs on the thorax.
3.2. Monitoring of flies in water towers
In the water towers, the sticky traps were counted every week to evaluate the changes in fly abundance. A total of 4,391 flies were caught over all towers during the monitoring period (Figure 2). The majority of flies (92.3%) were yellow swarming flies, followed by face flies (7.0%). Only 0.7% of the flies recorded were cluster flies. Flies were particularly caught on the highest floors, namely the floor of the water tank (90.0%) and the top floor just below the water tank (9.7%). Almost no flies (0.3%) were caught on the ground floor.
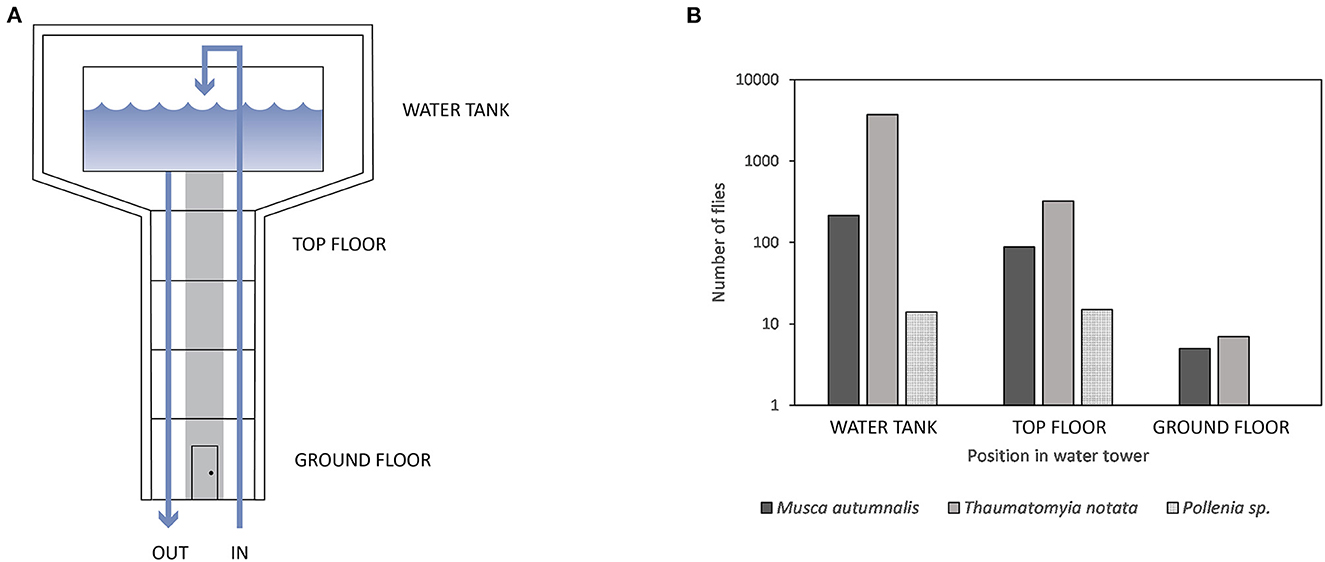
Figure 2. (A) Schematic representation of a water tower with the different levels where monitoring took place. (B) The number of flies caught on sticky traps on the different levels in water towers (n = 10). Monitoring was performed weekly from September 2019 until the end of April 2020. Most flies were caught at the water tank level. No Pollenia species were caught on the ground floor.
The first observations of flies entering the buildings were in September and coincide with the first face flies caught on the sticky traps. One of the monitored towers (water tower A) is shown to illustrate the changes in fly and coliform abundances during the monitoring period (Figure 3). The activity of the flies continued to increase during autumn, which was reflected in a higher catch rate (Figure 3A). Activity decreased in the winter months until March when flies ended their diapause and tried to leave their hibernacula. The last record of flies caught on traps was in April. These observations were in line with the expected lower number of catches during the actual diapause, when flies are much less active and mobile.
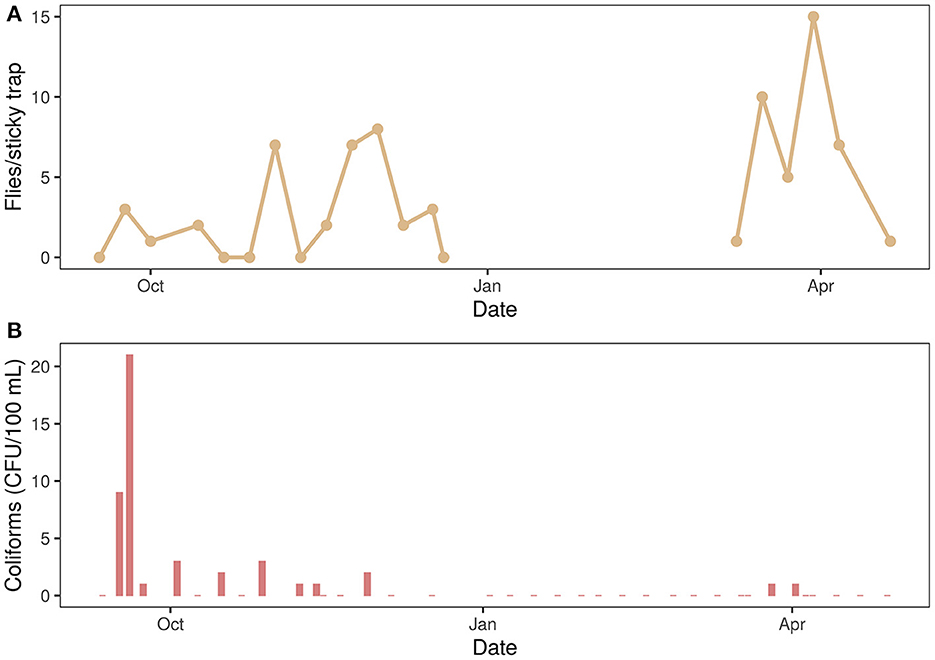
Figure 3. (A) The number of face flies (Musca autumnalis) caught on sticky traps and (B) concentration of coliforms (CFU/100 mL) in drinking water of water tower A. Monitoring was performed weekly from September 2019 until the end of April 2020. From the end of December 2019 until March 2020, flies were in diapause and less measurements were done. A similar seasonal pattern of flies and coliform presences can be observed. Serratia spp. were mainly present when coliforms were detected.
Additionally, the presence of coliforms in drinking water coming from the water towers was registered. Here, the abundance of coliforms in the water of water tower A is plotted over time (Figure 3B). The number of coliforms showed a similar pattern as fly abundances and were found from September until December, with a peak abundance (21 CFU/100 mL) on the 19th of September. No coliforms were detected during the winter months (end of December until mid-March). However, in spring (end of March), coliforms were detected again. With MALDI-TOF MS coliform species were identified and Serratia fonticola, S. liquefaciens and S. marcescens were detected when coliforms were present.
Furthermore, temperature and relative humidity (RH) were measured in all water towers (Supplementary Table 1). The temperatures on the different levels of the water towers fluctuated with prevailing conditions and differed slightly between floors. On the floors where flies were present (highest floors) in towers with fly invasion problems (n = 5), the mean minimum temperature over the five towers was 5.1 ± 2.3°C on the top floor and 3.8 ± 1.8°C at the level of the water tank. The mean maximum temperatures were 21 ± 3.4°C and 22.0 ± 3.7°C, respectively. Relative humidity fluctuated between 22 and 101% (supersaturation) on the top floor and between 24 and 103% on the level of the water tank.
Based on the monitoring data of flies and coliforms and the expert judgement from the Flemish drinking water providers, a risk assessment matrix was developed (Table 2). Risks of microbial contamination of drinking water are estimated to be low when only a few flies are observed in the towers and no more than two face and/or cluster flies or five yellow swarming flies are caught on the sticky traps at the level of the water tank. The risk increases to medium when more flies are caught on the traps and/or more flies occupy the ceiling, walls and windows (5–20%). If more than 20% of that area is occupied with flies, the risk is considered high, regardless of the fly catches. High risk means a high potential of microbial contamination (e.g., coliforms) of the drinking water, so precautions must be taken.
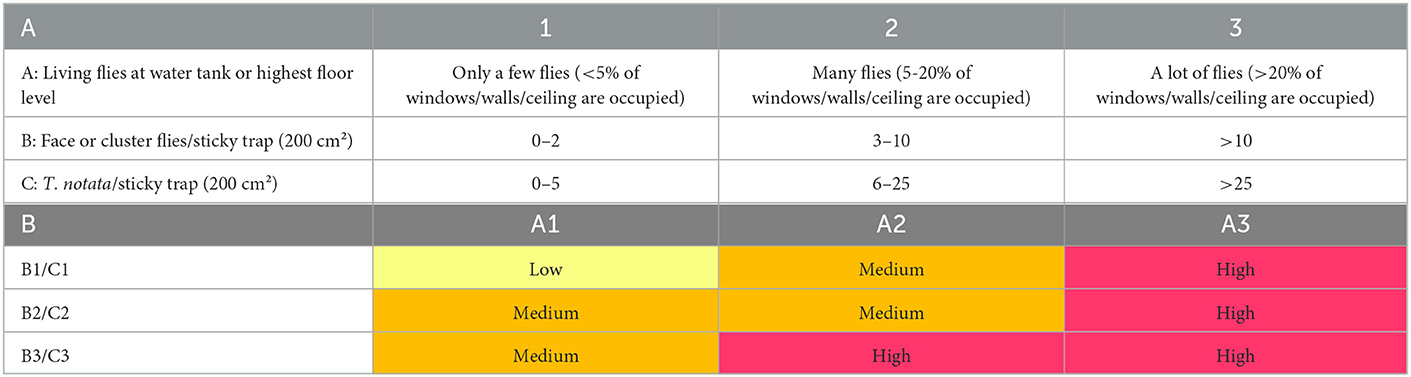
Table 2. (A) Classification of fly presence in water towers based on visual inspection of living flies on walls and ceiling and flies caught on sticky traps on the level of the water, (B) Risk assessment matrix that evaluates the risk of the presence of flies on microbial contamination of drinking water based on the classification system by visual inspection and expert judgement by the Flemish drinking water providers (low risk: yellow, medium risk: orange, high risk: red).
The average percentages of the presence and/or absence of flies and coliforms in nine water towers showed that for the most part (80.20 ± 26.89%), no coliforms were present when flies were absent (Table 3). However, when there were flies in the towers, it did not immediately lead to observations of coliforms in the water (5.04 ± 9.23%). In a few cases (4.47 ± 6.41%), coliforms such as Moellerella wisconsensis and Lelliottia amnigena were also present when no flies were observed (results MALDI-TOF MS, Pidpa, Antwerp). These coliform species are however not directly linked to fly species. If only towers with fly invasion problems were considered, the ratio of flies and coliforms presence increased (11.34 ± 11.47 vs. 5.04 ± 9.23%). Also, coliforms were frequently present even when no flies were caught on a trap (8.93 ± 7.14%), causing the overall proportion at which coliforms were detected in the drinking water considerable. Overall, our results indicate that flies influence microbial water quality in water towers as their presences correlated with the detection of coliforms such as Serratia marcescens and S. fonticola.
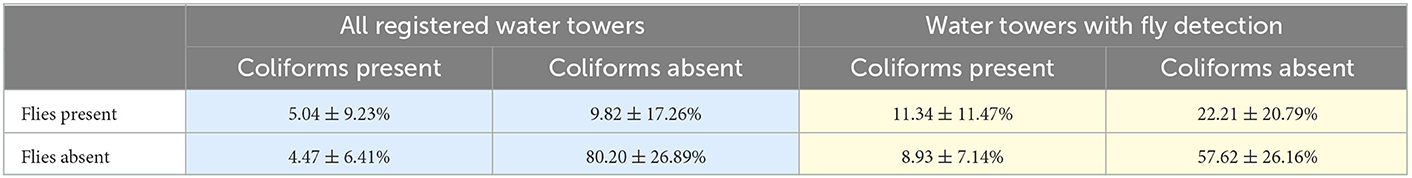
Table 3. Average percentage of presence and absence of flies and coliforms in all registered water towers (n = 9) and in towers where flies were detected (n = 4).
3.3. Effect of flies on microbial drinking water quality
Based on Table 2 a worst-case scenario was set up to examine the influence of flies on microbial water quality and safety. Three conditions were prepared: three dead face flies, three living face flies and no flies (blank condition) were added to 10 liters of tap water. From day five, the initially dead flies sank to the bottom of the bottles and a white, mucous substance was formed that encapsulated the flies. The living flies were circulating above the water until day three and fell onto the water when they died. They stayed on the surface of the water, and from day five, a similar white substance was formed around the bodies. The total cell densities were followed with flow cytometry for seven days (Figure 4A). The microbial start concentration of the water samples was 2.12 ± 0.04 × 10⁴ cells mL−1. After seven days, the cell concentration increased to 2.47 ± 0.43 × 10⁵ cells mL−1 and 7.11 ± 1.03 × 10⁵ cells mL−1 for living and dead flies, respectively. For the blank condition, a small increase was observed to 4.63 ± 0.70 × 10⁴ cells mL−1 on day seven. Until day two, the cell counts of the condition with living flies were similar to the blank. From day five, a remarkable increase in bacterial density was observed since all flies were dead and fell in the water on day three. For the condition with dead face flies, a cell concentration of 4.39 ± 0.34 × 10⁴ cells mL−1 was already reached on day two. Considering flow cytometric cell counts, there was a significant difference between the conditions (ANOVA, p < 0.001). Besides, microbial community changes over time were determined. Here, beta diversity analysis was performed using principal coordinates analysis (PCoA) of the cytometric fingerprints (Figure 4B). This analysis allows visualization of differences between cytometric fingerprints as the proximity of samples. Hence, samples containing similar microbial communities are plotted closer to each other. All blank samples were grouped, whereas the phenotypic community characteristics of the conditions with living and dead flies changed from day five and day two, respectively. In addition, the differences between the phenotypic traits of each condition over time were significantly different (PERMANOVA, p < 0.001). To conclude, flies in drinking water towers promote bacterial growth and change the phenotypic resident drinking water community.
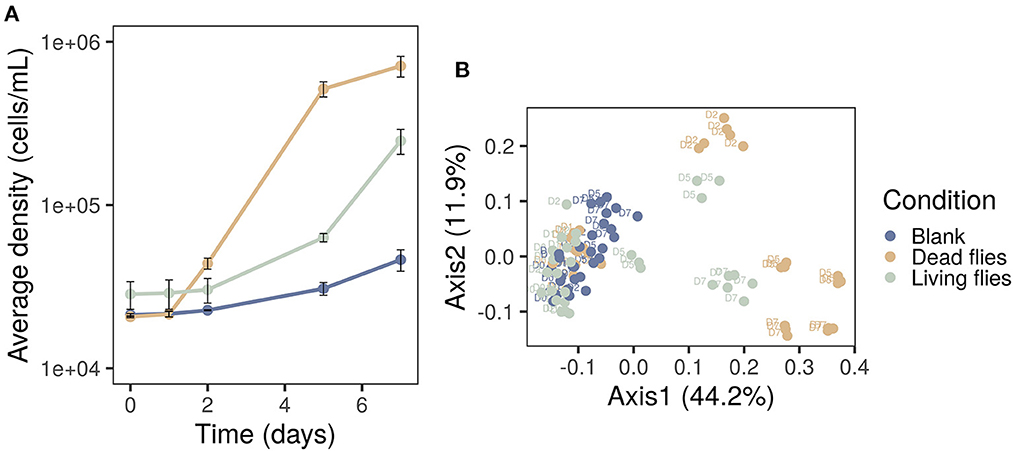
Figure 4. (A) Cell concentrations and (B) PCoA diversity analysis of samples with flies (living, dead) and without flies (blank) acquired with flow cytometry. Both biological (n = 2) and technical (n = 3) were considered. The addition of flies leaded to increased cell densities and phenotypic changes of the indigenous drinking water community.
At the start and end of the experiment, community compositions were evaluated with 16S rRNA amplicon sequencing (Figure 5). Hyphomicrobium and Rhizobium dominated the drinking water start community with a relative abundance of 24 and 25%, respectively. After seven days, these species were still present in high amounts in the blank samples. For the conditions with flies, four new genera appeared as abundant members (Acinetobacter, Chryseobacterium, Flavobacterium, Pseudomonas), while Hyphomicrobium and Rhizobium became rare groups (<1% abundance). Furthermore, a PCoA revealed clustering of on the one hand the start and blank conditions and on the other hand the conditions with flies (Supplementary Figure 3B). However, start and blank conditions were significantly different (Wilcoxon, p < 0.001). The conditions with flies were significantly different from start and blank conditions but not from each other (Wilcoxon, p < 0.001 and p = 1). In addition, alpha diversity was calculated from the cytometric fingerprints and the sequencing data to characterize the richness and evenness of the microbial community composition (Supplementary Figures 2, 3A). At the end of the experiment, lower alpha diversity indices were observed for the conditions with flies, which indicated the presence of more dominant species.
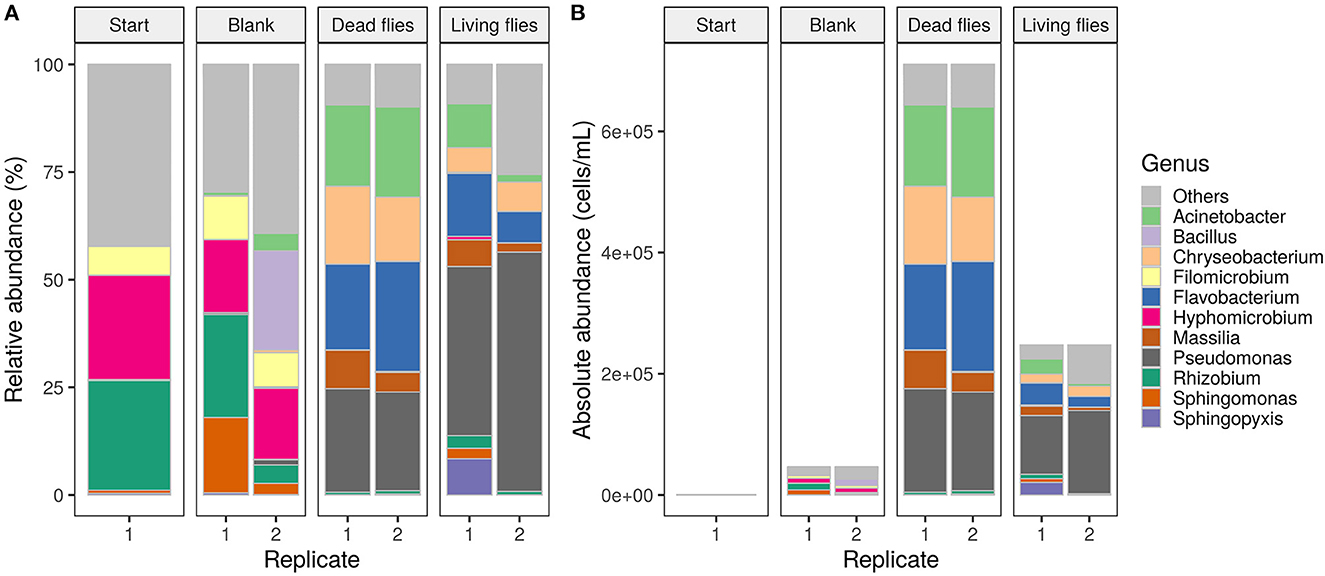
Figure 5. (A) Relative and (B) absolute abundances of the 25 most abundant genera at the start and end of the experiment. The bacterial composition of start and blank conditions were similar. New genera were introduced when flies were added to the water samples.
Microbial sample analysis on coliforms and Escherichia coli on days five and seven showed that coliforms, specifically Serratia fonticola and S. liquefaciens, were introduced into the water when flies were added (Table 4). Furthermore, in terms of community composition, Serratia spp. was measured with an average relative abundance of 1.72% for samples with flies (Figure 5). Also, enterococci were detected and the HPC for the samples with flies was higher than the blank (Supplementary Table 2). On day seven, the ATP of the condition with living flies and the blank was 145.75 ± 26.00 ng ATP L−1 and 22.00 ± 2.00 ng ATP L−1, respectively (Supplementary Figure 4B). However, when dead flies were added to the water, the ATP on day zero was already above 420 ng ATP L−1 due to the ATP of the face flies. Consequently, from this condition, no conclusions can be drawn. The TOC of all samples was comparable during the experiment (2.6–4.0 mg L−1 ppb). Only on day seven, the TOC of the blank condition (i.e., 61.35 ± 1.84 mg L−1) was higher than in the other conditions (Supplementary Figure 4A). However, a high variance was observed between the biological replicates of the blank.
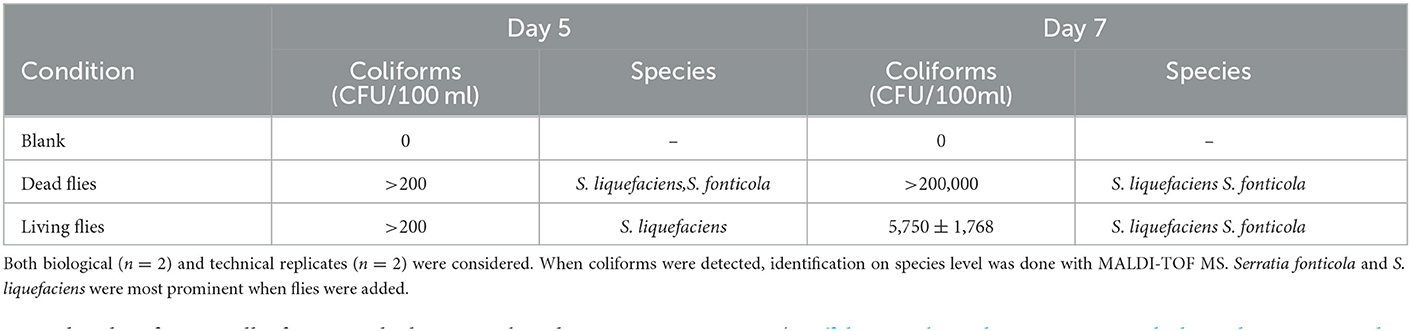
Table 4. The amount (CFU/100 mL) of coliforms on day five and day seven was determined with Colilert.
Overall, the presence of flies resulted in an increase of bacterial cell densities, and the introduction of new genera such as Pseudomonas and Chryseobacterium as well as the coliforms Serratia fonticola and S. liquefaciens.
4. Discussion
4.1. Hibernation of flies in water towers
In the first part of this research, a monitoring campaign was performed to examine the presence of flies in water towers in Flanders, Belgium. Face flies, cluster flies and yellow swarming flies were found to be present in the towers (Figure 1). These species are known for their aggregating behavior during a period called diapause, a state of lower metabolic activity and increased resistance to environmental extremes to survive the winter (Pimentel and Epstein, 1960; Teskey, 1969; Nartshuk and Andersson, 2013; Gill et al., 2017). They can hibernate in nature in old trees under the bark or in sheaths of corn stalks for example, but records in literature are minimal (Kipling, 1995; Vezsenyi et al., 2022). On the other hand, multiple records have been reported on these fly species invading manmade dwellings, perceiving them as a pest (Pimentel and Epstein, 1960; Narchuk Emilia, 2000; Faulde et al., 2001; Trout Fryxell et al., 2021). Hibernating flies have been observed in various buildings such as houses, churches and agricultural buildings. However, no official reports of invasions in water towers were found. That does not imply that this is a new phenomenon. Moreover, the observed fly species are ubiquitous and not the only insect species hibernating as adults in large swarms, suggesting that the presence of hibernating flies and other insects in buildings such as water towers is a widespread phenomenon (Wang et al., 2011; Lidwien Raak-van den Berg et al., 2012; Chambers et al., 2020).
Flies were primarily captured on sticky traps in autumn and spring (Figure 3A). They were active and more easily captured on traps than in winter, when they became sluggish and hid in cracks and crevices of the building. Additionally, in early autumn and spring, flies were seen attracted to light sources such as windows and light bulbs. This behavior corresponds to descriptions of insects in diapause and is well described for face flies which show negative phototactic behavior as winter progresses and conversely, positive phototactic behavior in spring, when they search for a way out to find resources, a partner and mate (Krafsur and Moon, 1997; Krafsur et al., 1999; Chambers et al., 2020; Trout Fryxell et al., 2021).
In addition, temperature and relative humidity were measured from the moment flies entered the towers until they left again (Supplementary Table 1). The conditions in the water towers fluctuated throughout the seasons, with high humidity and low temperatures in the winter and lower humidity and higher temperatures at the end of summer and the beginning of spring which corresponds to prevailing environmental conditions. However, temperatures inside the towers never dropped below zero while subzero temperatures were registered at weather stations near the towers on several dates. This avoids water stress as subzero temperatures cause water scarcity to insects in diapause (Gill et al., 2017). Moreover, the air on the level of the water tank was occasionally supersaturated at low temperatures (winter) by the permanent presence of a large body of water. A more in-depth analysis of the relationship between temperature, humidity, outside temperatures and the presence and/or activity of flies in water towers could be of interest for future research. Overall, water towers seem to buffer sufficiently against harsh winter conditions for flies to use as a shelter.
Nevertheless, it is striking that the flies tend to aggregate in the same towers every year. This behavior has been reported several times in literature for face flies as well as for yellow swarming flies and is therefore expected to be a persistent problem in the coming years (Stoffolano and Matthysse, 1967; Narchuk Emilia, 2000; Kotrba, 2009). Monitoring of the insects inside the buildings coupled with the suggested risk assessment can be used as a tool to implement control measures against emerging insect pests (Table 2).
4.2. Flies in water towers affect microbial quality
In this study, a worst-case scenario was performed based on Table 2 in which three face flies (dead and living) were added to 10 liters of drinking water. Community dynamics were followed for seven days with flow cytometry and 16S rRNA amplicon sequencing. Also, a blank condition was evaluated. Considering flow cytometric cell counts, a significant increase was observed for samples with flies (Figure 4A). Flies can contain microorganisms as well as nutrients due to their behavior. For example, face flies feed around moist, mucus membranes of livestock faces and other body parts whereas bovine feces is the breeding site of their larvae (Teskey, 1969; Krafsur and Moon, 1997; Trout Fryxell et al., 2021). In addition, it was observed that the dead flies were degrading in the water from day two of the experiment. This way, flies have introduced extra nutrients such as organic carbon compounds into the drinking water samples. Several studies showed that AOC and biodegradable dissolved organic carbon (BDOC) are important parameters responsible for regrowth of the resident drinking water community (van der Kooij et al., 1982; van der Kooij, 1992; Liu et al., 2002; Lautenschlager et al., 2013; Prest et al., 2016a). Furthermore, the presence of flies in the water resulted in phenotypic changes of the microbial drinking water community compared to the blank condition (Figure 4B). This can be explained by the extra amount of nutrients available. Buysschaert et al. (2019) showed that cytometric fingerprints of aquatic microbial communities are influenced by the type and concentrations of added nutrients and chemicals. Moreover, in a study by Waegenaar et al. (2021), drinking water dynamics were monitored with online flow cytometry and a contamination of 0.01% groundwater was early detected using Bray-Curtis dissimilarities between flow cytometric fingerprints. Additionally, during distribution, a change in phenotypic treats can be observed due to water stagnation or temperature increases (Prest et al., 2013; Ling et al., 2018; Favere et al., 2020).
These community changes in water samples with flies were also observed with 16S rRNA amplicon sequencing (Figure 5, Supplementary Figure 3B). Hyphomicrobium and Rhizobium were found to be dominant genera in the start water and blank samples. Both bacteria are related to corrosion processes of cast iron pipelines and are commonly found in bulk as well as biofilm phases of chlorinated water (Zhu et al., 2014; Bal Krishna et al., 2020). High abundances of Acinetobacter, Chryseobacterium, Flavobacterium and Pseudomonas species were detected in samples with flies after seven days (Figure 5). Even though no pathogens such as Escherichia coli and Salmonella spp. were detected, some introduced species are opportunistic pathogens that may be of concern for immunosuppressed persons (Rusin et al., 1997; World Health Organization, 2022). For example, Acinetobacter baumannii, associated with hospital-acquired infections, was detected in low concentrations (Microbial Contaminants in Drinking Water, 2014; Carvalheira et al., 2021). Furthermore, the found genera are often found in biofilms or attached to loose deposits in drinking water distribution systems. Pseudomonas spp. can be considered as primary colonizers of water biofilms (Douterelo et al., 2014; Liu et al., 2014; Wang et al., 2014; Thom et al., 2022). Their occurrence in samples with flies can therefore be related to their need for nutrients. In addition, coliforms, more specifically Serratia fonticola and S. liquefaciens, were detected with both Colilert and sequencing in samples with flies (Figure 5, Table 4). Both species are seen as opportunistic pathogens responsible for human infections of immunosuppressed persons (Chowdhury, 2012; Tasic et al., 2013; Rafii, 2014). However, a recent study by KWR (2020) showed that the risk for human health is very rare and still unknown.
It has already been reported previously that flies are considered as vectors for bacteria and foodborne pathogens such as Escherichia coli (Blazar et al., 2011; Junqueira et al., 2017; Moon, 2019). In this research, we showed that they can also introduce opportunistic pathogens such as Serratia spp., Pseudomonas spp. and Acinetobacter spp. in water (Figure 5, Table 4). Moreover, biostability of water is affected when flies fall into the water of the water towers (Figures 4, 5). Though, the correlation between flies and coliforms was only 5.04% considering the monitoring data of the water towers (Figure 3, Table 3), there is still an indication that the occurrence of Serratia fonticola and S. liquefaciens was correlated with fly presences in towers when the water tank is not covered. However, the implementation of the results of the batch experiment should be handled with care, as they represent a worst-case scenario based on Table 2. The microbial load of flies will also change depending on their summer habitat and geographical location (Park et al., 2019). Less coliforms were measured in the water basin in April as the microbial load of the flies will be lower with time away from their summer habitat (Figure 3). Furthermore, the design of a water tower (e.g., the physical shape of the water compartments and the arrangements of inlet and outlet pipes) is developed to minimize stagnant zones and residence times (Figure 2A) (KWR, 2020b). We have based our experimental set-up on a worst-case scenario without refreshing and a maximal residence time of seven days (Timmer et al., 2009). Furthermore, the microbial parameters of water towers with fly invasion problems are analyzed more frequently and additional chlorination is performed when parameters are increased. Several authors have already showed that the introduced genera such as Pseudomonas spp. are sensitive toward chlorine (Bal Krishna et al., 2020). Additionally, since they are biofilm bacteria, they will easily attach to pipes and water basins instead of popping up in the bulk phase (Douterelo et al., 2014; Liu et al., 2014; Wang et al., 2014; Thom et al., 2022).
Therefore, it is confirmed that the proposed risk assessment, based on visual inspection and the use of sticky traps, can help to evaluate the potential risks of microbial drinking water contaminations (Table 2). In any way, the presence of one fly in a water tower is no reason to panic but should increase vigilance. If numbers increase to a considerable amount of flies caught on the traps (>2 or 5, depending on the species; Table 2) and observed on walls, windows and ceilings (>5% of the surface), it can lead to action being taken. Actions can range from extra chlorination, overflowing the water tank to sanitation and possibly putting the tower temporarily out of service. However, from our study, it is recommended to prevent fly presences in water towers as they could affect microbial water quality and safety.
4.3. Prevention methods
Water towers and other environments with food and people are considered as sensitive sites where it is not desirable to control insect pests with chemicals. Fly management strategies in sensitive environments include exclusion, indoor management, sanitation and source reduction (Hinkle and Hogsette, 2021). As mentioned above, diapausing flies do not feed or breed after entering their hibernaculae, but only seek shelter and hide in dark corners as winter proceeds (Trout Fryxell et al., 2021). Pest management strategies should be adapted to this specific behavior.
The first step is to avoid flies from entering buildings. Professional pest control services (Pest Defence Ltd, 2022; Rentokil, 2022; Terminix, 2022) point out windows, doors and all types of vents as main entry points for flies. This is consistent with observations in multiple water towers where flies entered through air vents and/or overflow pipes without adequate filter or mesh and through weep holes in walls, windows and doors. Several providers offer weep hole protectors and screens that prevent pests from entering. Mesh size should be adapted to the smallest intruders (here yellow swarming flies). Commonly used commercial fly screen with a wire diameter of 0.28 mm has an aperture of 1.13 × 1.30 mm, which is sufficient for the smallest flies to enter (personal observations) (Hinkle and Hogsette, 2021). It is suggested to use a smaller mesh size (<32 mesh size or 0.5 × 0.5 mm aperture) to provide a more effective exclusion of flying insects, including smaller species such as the yellow swarming fly. Similar measures need to be taken to the piping connected to the outside atmosphere such as the vent pipe or overflow pipe of the water tower. It is also better to use reinforced screens in stainless steel when in contact with the outside atmosphere and all weather conditions. In any way, our study showed that the focus should be on the top floors, as these are the places where most flies enter and reside (Figure 2).
Secondly, intervention steps must be implemented in case flies still managed to enter the buildings. Insect light traps (ILT) can be a good solution in places where there is little natural lighting. However, ILT's using electrocution have to be avoided since bacteria and other microorganisms carried by flies (on the exoskeleton and/or internal) can be spread during electrocution. Light traps that use a glue pad are less likely to scatter fly particles and associated potential pathogens around (Ananth et al., 1992; Urban and Broce, 2000). The efficiency of light traps will depend on the timing of use. The highest abundance of flies is expected starting from the transition from summer to autumn until the end of autumn, and again around the first weeks of spring (Figure 3A). In these periods, it is recommended to change glue pads regularly and remove any dead flies. Additionally, light traps should be placed in dark areas to reduce competing ambient light (McDermott and Mullens, 2018). If windows are present, blackening or covering windows to keep sunlight out can offer a solution. If the latter is not possible, window stickers, sticky tubes and ribbons are an inexpensive, easy-to-use and pesticide-free way of trapping flies close to windows or other light sources. Again, traps will have a higher catch rate if flies are active (autumn and spring) and traps should be replaced regularly in those periods (Figure 3A).
Finally, our results showed that flies can introduce unwanted microorganisms to drinking water. Hence, contact should be avoided between water and flies. In some towers, however, the water tank is still uncovered and flies can easily access the water, intentionally or unintentionally by falling into the tank after they die. This can be avoided by constructing a cover which allows pressure change but is inaccessible for flies and other pests.
5. Conclusions
Water towers seem to be an attractive overwintering site to certain insects due to higher (and positive) temperatures, the higher humidity in wintertime and the ubiquitous availability of fresh water. In this research, the number of flies was monitored with yellow sticky traps in ten water towers across Flanders (Belgium). Face flies, yellow swarming flies and cluster flies were the most prominent fly species. An increase in the abundance of flies was observed in September and March, which corresponded with their entrance and exit in the water towers. During winter, the flies are less active because they are in diapause. In addition, a correlation was found between the presence of coliforms such as Serratia fonticola and the number of flies in water towers that were not covered. Based on the monitoring data, a risk assessment for microbial water contamination was proposed. Besides, a batch test was performed to examine the effect of flies on microbial drinking water quality. After seven days, opportunistic pathogens such as Acinetobacter baumannii and coliforms such as Serratia fonticola and S. liquefaciens were detected in samples with flies. Furthermore, the overall water microbiology was affected. Increased cell densities and a phenotypic change in the indigenous microbial drinking water community were observed, meaning that flies impact water biostability. The main message of this study is that flies should be excluded from water towers and tanks. This can be achieved by covering the water tank and proper closing the piping connected to the atmosphere with decent insect screens with a small mesh size.
Data availability statement
The datasets presented in this study can be found in online repositories. The names of the repository/repositories and accession number(s) can be found below: https://www.ncbi.nlm.nih.gov/bioproject/PRJNA876825, https://github.com/waegenaarfien/2022_Insects-in-water-towers-hibernating-flies-could-compromise-microbial-drinking-water-quality.
Author contributions
AB and FW designed and performed the experiments, prepared the manuscript, and edits. AB performed the entomological data analysis. FW performed the microbial data analysis. All authors contributed to the article and approved the submitted version.
Funding
AB is supported by the Research Foundation—Flanders, financed by de Watergroep and Pidpa. FW is supported by the Research Foundation—Flanders (FWO) (grant number 1S02022N) and contributes to the FWO-SBO Biostable project (grant number S006221N). The work is part of the Ghent University-Aquaflanders Chair for Sustainable Drinking Water.
Acknowledgments
We would like to thank all colleagues of Pidpa and De Watergroep who were involved in this project. Special acknowledgments go to Jerom Vranken and the lab of bacteriology (Pidpa) for their technical assistance during the study. Furthermore, we would like to thank Laura Ginneberge for her graphical help and Cristina García Timermans, Koen Huysman, Koen Joris and Karel Goos for their feedback on the manuscript.
Conflict of interest
KD is employed by Pidpa. BDG is employed by FARYS|TMVW. HV is employed by De Watergroep.
The remaining authors declare that the research was conducted in the absence of any commercial or financial relationships that could be construed as a potential conflict of interest.
Publisher's note
All claims expressed in this article are solely those of the authors and do not necessarily represent those of their affiliated organizations, or those of the publisher, the editors and the reviewers. Any product that may be evaluated in this article, or claim that may be made by its manufacturer, is not guaranteed or endorsed by the publisher.
Supplementary material
The Supplementary Material for this article can be found online at: https://www.frontiersin.org/articles/10.3389/frwa.2023.1022271/full#supplementary-material
References
Ananth, G. P., Bronson, D. C., and Brown, J. K. (1992). Generation of airborne fly body particles by four electrocution fly traps and an electronic fly trap. Int. J. Environ. Health Res. 2, 106–113. doi: 10.1080/09603129209356738
Bal Krishna, K. C., Sathasivan, A., Cox, P., and Doolan, C. (2020). Bacterial community including opportunistic pathogens dynamics in a chlorine tablet-dosed chloraminated service reservoir and reticulation pipes. Int. Biodeterior. Biodegrad. 153, 105032. doi: 10.1016/j.ibiod.2020.105032
Blazar, J., Allard, M., and Lienau, E. K. (2011). Insects as vectors of foodborne pathogenic bacteria. Terr. Arthropod Rev. 4, 5–16. doi: 10.1163/187498311X543989
Brandt, M. J., Johnson, K. M., Elphinston, A. J., and Ratnayaka, D. D. (2017). “Treated water storage,” in Twort's Water Supply (Oxford: Butterworth-Heinemann). p. 829–863. doi: 10.1016/B978-0-08-100025-0.00020-X
Buysschaert, B., Favere, J., Vermijs, L., Baetens, V., Naka, A., Boon, N., et al. (2019). Flow cytometric fingerprinting to assess the microbial community response to changing water quality and additives. Environ. Sci. Water Res. Technol. 5, 1672–1682. doi: 10.1039/C9EW00283A
Campan, R. (1997). Tactic components in orientation. Orientat. Commun. Arthropods 84, 1–40. doi: 10.1007/978-3-0348-8878-3_1
Carvalheira, A., Silva, J., and Teixeira, P. (2021). Acinetobacter spp. in food and drinking water—A review. Food Microbiol. 95, 103675. doi: 10.1016/j.fm.2020.103675
Chambers, B. D., Leskey, T. C., Cullum, J. P., Pearce, A. R., and Kuhar, T. P. (2020). Cavity tightness preferences of overwintering Halyomorpha halys (Hemiptera: Pentatomidae). J. Econ. Entomol. 113, 1572–1575. doi: 10.1093/jee/toaa036
Charnock, C., and Kjønnø, O. (2000). Assimilable organic carbon and biodegradable dissolved organic carbon in Norwegian raw and drinking waters. Water Res. 34, 2629–2642. doi: 10.1016/S0043-1354(00)00007-5
Chowdhury, S. (2012). Heterotrophic bacteria in drinking water distribution system: a review. Environ. Monit. Assess. 184, 6087–6137. doi: 10.1007/s10661-011-2407-x
Core Team, R. (2022). R: A Language and Environment for Statistical Computing. R Foundation for Statistical Computing, Vienna, Austria.
D'assis Fonseca, E.C.M. (1968). “Diptera Cyclorrhapha Calyptrata: section (b) Muscidae,” in Handbooks for the Identification of British Insects (London: The Society). p. 124.
De Jesús, A. J., Olsen, A. R., Bryce, J. R., and Whiting, R. C. (2004). Quantitative contamination and transfer of Escherichia coli from foods by houseflies, Musca domestica L. (Diptera: Muscidae). Int. J. Food Microbiol. 93, 259–262. doi: 10.1016/j.ijfoodmicro.2003.12.003
Douterelo, I., Sharpe, R., and Boxall, J. (2014). Bacterial community dynamics during the early stages of biofilm formation in a chlorinated experimental drinking water distribution system: implications for drinking water discolouration. J. Appl. Microbiol. 117, 286–301. doi: 10.1111/jam.12516
Dragulescu, A., and Arendt, C. (2020). xlsx: Read, Write, Format Excel 2007 and Excel 97/2000/XP/2003 Files.
Dudek, K., Dudek, M., and Tryjanowski, P. (2015). Wind turbines as overwintering sites attractive to an invasive lady beetle, harmonia axyridis pallas (Coleoptera: Coccinellidae). Coleopt. Bull. 69, 665–669. doi: 10.1649/0010-065X-69.4.665
El-Chakhtoura, J., Prest, E., Saikaly, P., van Loosdrecht, M., Hammes, F., Vrouwenvelder, H., et al. (2015). Dynamics of bacterial communities before and after distribution in a full-scale drinking water network. Water Res. 74, 180–190. doi: 10.1016/j.watres.2015.02.015
Ellis, B., Haaland, P., Hahne, F., Meur, N. L., Gopalakrishnan, N., Spidlen, J., et al. (2022). flowCore: flowCore: Basic structures for flow cytometry data.
European Environment Agency. (2018). European waters: assessment of status and pressures 2018. Publications Office, LU.
European Union. (1998). 98./83/EC on the quality of water intended for human consumption. J. Eur. Commun. 41, 32–54.
Faulde, M., Sobe, D., Burghardt, H., and Wermter, R. (2001). Hospital infestation by the cluster fly, pollenia rudis sensu stricto fabricius 1794 (diptera: Calliphoridae), and its possible role in transmission of bacterial pathogens in germany. Int. J. Hyg. Environ. Health 203, 201–204. doi: 10.1078/S1438-4639(04)70029-2
Favere, J., Barbosa, R. G., Sleutels, T., Verstraete, W., De Gusseme, B., Boon, N., et al. (2021). Safeguarding the microbial water quality from source to tap. Npj Clean Water 4, 1–6. doi: 10.1038/s41545-021-00118-1
Favere, J., Buysschaert, B., Boon, N., and De Gusseme, B. (2020). Online microbial fingerprinting for quality management of drinking water: full-scale event detection. Water Res. 170, 115353. doi: 10.1016/j.watres.2019.115353
Food and Drug Administration. (1997). Hazard analysis and critical control point (HACCP) plan., Title 21, Code of Federal Regulations.
Fraenkel, G. S., and Gunn, D. L. (1961). The Orientation of Animals : Kineses, Taxes and Compass Reactions. Dover Publications, New York.
Gill, H. K., Goyal, G., and Chahil, G. (2017). Insect diapause: a review. J. Agric. Sci. Technol. 454–473.
Gisondi, S., Rognes, K., Badano, D., Pape, T., and Cerretti, P. (2020). The world polleniidae (Diptera, oestroidea): key to genera and checklist of species. ZooKeys 2020, 105–155. doi: 10.3897/zookeys.971.51283
Hinkle, N. C., and Hogsette, J. A. (2021). A review of alternative controls for house flies. Insects 12, 1042. doi: 10.3390/insects12111042
Hodek, I., Iperti, G., and Hodková, M. (1993). Long-distance flights in Coccinellidae (Coleoptera). Eur. J. Entomol. 90, 403–414.
Jewiss-Gaines, A., Marshall, S. A., and Whitworth, T. L. (2012). Cluster flies (Calliphoridae: Polleniinae: Pollenia) of North America. Can. J. Arthropod Identif. 19, 1–22.
Junqueira, A. C. M., Ratan, A., Acerbi, E., Drautz-Moses, D. I., Premkrishnan, B. N. V., Costea, P. I., et al. (2017). The microbiomes of blowflies and houseflies as bacterial transmission reservoirs. Sci. Rep. 7, 16324. doi: 10.1038/s41598-017-16353-x
Kerneïs, A., Nakache, F., Deguin, A., and Feinberg, M. (1995). The effects of water residence time on the biological quality in a distribution network. Water Res. 29, 1719–1727. doi: 10.1016/0043-1354(94)00323-Y
Khamesipour, F., Lankarani, K. B., Honarvar, B., and Kwenti, T. E. n.d. (2018). A systematic review of human pathogens carried by the housefly (Musca domestica L.).
Kipling, W. (1995). Overwintering of Pollenia rudis (Diptera: Calliphoridae). Entomol. News 106, 177.
Konapala, G., Mishra, A. K., Wada, Y., and Mann, M. E. (2020). Climate change will affect global water availability through compounding changes in seasonal precipitation and evaporation. Nat. Commun. 11, 3044. doi: 10.1038/s41467-020-16757-w
Kotrba, M. (2009). Male flies with yellow balls—New observations on the eversible vesicles on the postadbomen of male Thaumatomyia notata (Diptera: Chloropidae). Eur. J. Entomol. 106, 57–62. doi: 10.14411/eje.2009.009
Krafsur, E. S., and Moon, R. D. (1997). Bionomics of the face fly, Musca autumnalis. Annu. Rev. Entomol. 42, 503–523. doi: 10.1146/annurev.ento.42.1.503
Krafsur, E. S., Moon, R. D., Kim, Y., and Rosales, A. L. (1999). Dynamics of diapause recruitment in populations of the face fly, Musca autumnalis. Med. Vet. Entomol. 13, 337–348. doi: 10.1046/j.1365-2915.1999.00150.x
Lautenschlager, K., Hwang, C., Liu, W-. T., Boon, N., Köster, O., Vrouwenvelder, H., et al. (2013). A microbiology-based multi-parametric approach toward assessing biological stability in drinking water distribution networks. Water Res. 47, 3015–3025. doi: 10.1016/j.watres.2013.03.002
Li, W., Zhang, J., Wang, F., Qian, L., Zhou, Y., Qi, W., et al. (2018). Effect of disinfectant residual on the interaction between bacterial growth and assimilable organic carbon in a drinking water distribution system. Chemosphere 202, 586–597. doi: 10.1016/j.chemosphere.2018.03.056
Li, X-. F., and Mitch, W. A. (2018). Drinking water disinfection byproducts (DBPs) and Human health effects: multidisciplinary challenges and opportunities. Environ. Sci. Technol. 52, 1681–1689. doi: 10.1021/acs.est.7b05440
Lidwien Raak-van den Berg, C., Stam, J.M., De Jong, P.W., Hemerik, L., and van Lenteren, J.C. (2012). Winter survival of Harmonia axyridis in The Netherlands. Biol. Control 60, 68–76. doi: 10.1016/j.biocontrol.2011.10.001
Ling, F., Whitaker, R., LeChevallier, M.W., and Liu, W.-T. (2018). Drinking water microbiome assembly induced by water stagnation. ISME J. 12, 1520–1531. doi: 10.1038/s41396-018-0101-5
Liu, G., Bakker, G. L., Li, S., Vreeburg, J. H. G., Verberk, J. Q. J. C., Medema, G. J., et al. (2014). Pyrosequencing reveals bacterial communities in unchlorinated drinking water distribution system: an integral study of bulk water, suspended solids, loose deposits, and pipe wall biofilm. Environ. Sci. Technol. 48, 5467–5476. doi: 10.1021/es5009467
Liu, W., Wu, H., Wang, Z., Ong, S. L., Hu, J. Y., Ng, W. J., et al. (2002). Investigation of assimilable organic carbon (AOC) and bacterial regrowth in drinking water distribution system. Water Res. 36, 891–898. doi: 10.1016/S0043-1354(01)00296-2
McDermott, E. G., and Mullens, B. A. (2018). The dark side of light traps. J. Med. Entomol. 55(2), 251–261. doi: 10.1093/jme/tjx207
McMurdie, P. J., and Holmes, S. (2013). phyloseq: an R package for reproducible interactive analysis and graphics of microbiome census data. PLoS ONE 8, e61217. doi: 10.1371/journal.pone.0061217
Microbial Contaminants in Drinking Water (2014). Microbiology of Drinking Water. John Wiley and Sons, Inc., Hoboken, NJ, USA. p. 1–28. doi: 10.1002/9781118743942.ch1
Moon, R. D. (2019). “Muscid Flies (Muscidae),” in Medical and Veterinary Entomology (Elsevier). p. 345–368. doi: 10.1016/B978-0-12-814043-7.00017-0
Nalepa, C. A., Kennedy, G. G., and Brownie, C. (2004). Orientation of multicolored asian lady beetles to buildings. Am. Entomol. 50, 165–166.
Nalepa, C. A., Kennedy, G. G., and Brownie, C. (2005). Role of visual contrast in the alighting behavior of Harmonia axyridis (Coleoptera: Coccinellidae) at overwintering sites. Environ. Entomol. 34, 425–431. doi: 10.1603/0046-225X-34.2.425
Narchuk Emilia, P. (2000). Outbreaks of carnivorous fly Thaumatomyia notata Meigen (Diptera: Chloropidae) and their periodicity. Annu. Rep. Zool. Inst. Available online at: https://www.zin.ru/publications/sessions/annrep/2000/16.html
Nartshuk, E., and Andersson, H. (2013). The Frit Flies (Chloropidae, Diptera) of Fennoscandia and Denmark. Frit Flies Chloropidae Diptera Fennosc. Den. doi: 10.1163/9789004190665
Nescerecka, A., Juhna, T., and Hammes, F. (2018). Identifying the underlying causes of biological instability in a full-scale drinking water supply system. Water Res. 135, 11–21. doi: 10.1016/j.watres.2018.02.006
Nescerecka, A., Rubulis, J., Vital, M., Juhna, T., and Hammes, F. (2014). Biological instability in a chlorinated drinking water distribution network. PLOS ONE 9, e96354. doi: 10.1371/journal.pone.0096354
Oksanen, J., Simpson, G. L., Blanchet, F. G., Kindt, R., Legendre, P., and Minchin, P. R. (2022) Vegan: Community Ecology Package.
Olsen, A. R. (1998). Regulatory action criteria for filth and other extraneous materials. Regul. Toxicol. Pharmacol. 28, 199–211. doi: 10.1006/rtph.1998.1271
Park, R., Dzialo, M. C., Spaepen, S., Nsabimana, D., Gielens, K., Devriese, H., et al. (2019). Microbial communities of the house fly Musca domestica vary with geographical location and habitat. Microbiome 7, 112. doi: 10.1186/s40168-019-0748-9
Pest Defence Ltd. (2022) What are cluster flies and how do you get rid of a cluster fly infestation. Available online at: https://www.pestdefence.co.uk/news/what-are-cluster-flies-and-how-do-you-get-rid-of-a-cluster-fly-infestation/ (accessed December 22 2022)
Pimentel, D., and Epstein, B. (1960). The cluster fly, Pollenia rudis (Diptera: Calliphoridae). Ann. Entomol. Soc. Am. 53, 553–554. doi: 10.1093/aesa/53.4.553
Pinto, A. J., Schroeder, J., Lunn, M., Sloan, W., and Raskin, L. (2014). Spatial-temporal survey and occupancy-abundance modeling to predict bacterial community dynamics in the drinking water microbiome. mBio 5, e01135–14. doi: 10.1128/mBio.01135-14
Poos, F. W. (1929). Leafhopper injury to legumes. J. Econ. Entomol. 22, 146–153. doi: 10.1093/jee/22.1.146
Prest, E. I., Hammes, F., Kötzsch, S., van Loosdrecht, M. C. M., and Vrouwenvelder, J. S. (2013). Monitoring microbiological changes in drinking water systems using a fast and reproducible flow cytometric method. Water Res. Microbial Ecol Drinking Water Wastewater Treatment 47, 7131–7142. doi: 10.1016/j.watres.2013.07.051
Prest, E. I., Hammes, F., van Loosdrecht, M. C. M., and Vrouwenvelder, J. S. (2016a). Biological stability of drinking water: controlling factors, methods, and challenges. Front. Microbiol. 7, 45. doi: 10.3389/fmicb.2016.00045
Prest, E. I., Weissbrodt, D. G., Hammes, F., Loosdrecht, M. C. M., and van Vrouwenvelder, J. S. (2016b). Long-term bacterial dynamics in a full-scale drinking water distribution system. PLoS ONE 11, e0164445. doi: 10.1371/journal.pone.0164445
Props, R., Monsieurs, P., Mysara, M., Clement, L., and Boon, N. (2016). Measuring the biodiversity of microbial communities by flow cytometry. Methods Ecol. E7, 1376–1385. doi: 10.1111/2041-210X.12607
Raak-van den Berg, C. L., Hemerik, L., de Jong, P. W., and van Lenteren, J. C. (2012). Mode of overwintering of invasive Harmonia axyridis in the Netherlands. BioControl 57, 71–84. doi: 10.1007/s10526-011-9394-2
Rafii, F. (2014). “Serratia,” in Encyclopedia of Food Microbiology (Elsevier). p. 371–375. doi: 10.1016/B978-0-12-384730-0.00304-9
Ratnayaka, D. D., Brandt, M. J., and Johnson, K. M. (2009). “Treated Water Storage,” in Water Supply. Oxford: Butterworth-Heinema. p. 671–698. doi: 10.1016/B978-0-7506-6843-9.00026-3
Rentokil. (2022). Fly Prevention. Available online at: https://www.rentokil.co.uk/flies/deterrent/ (accessed December 22, 2022).
Rusin, P. A., Rose, J. B., and Gerba, C. P. (1997). Health significance of pigmented bacteria in drinking water. Wat. Sci. Tech. 35, 21–27. doi: 10.2166/wst.1997.0704
Sathasivan, A., and Ohgaki, S. (1999). Application of new bacterial regrowth potential method for water distribution system—a clear evidence of phosphorus limitation. Water Res. 33, 137–144. doi: 10.1016/S0043-1354(98)00158-4
Sousi, M., Salinas-Rodriguez, S. G., Liu, G., Schippers, J. C., Kennedy, M. D., van der Meer, W., et al. (2020). Measuring bacterial growth potential of ultra-low nutrient drinking water produced by reverse osmosis: effect of sample pre-treatment and bacterial inoculum. Front. Microbiol. 11, 791. doi: 10.3389/fmicb.2020.00791
Stoffolano, J. G., and Matthysse, J. G. (1967). Influence of photoperiod and temperature on diapause in the face fly, musca autumnalis (Diptera: Muscidae). Ann. Entomol. Soc. Am. 60, 1242–1246. doi: 10.1093/aesa/60.6.1242
Tasic, S., Obradovic, D., and Tasic, I. (2013). Characterization of Serratia fonticola, an opportunistic pathogen isolated from drinking water. Arch. Biol. Sci. 65, 899–904. doi: 10.2298/ABS1303899T
Terminix. (2022). Face Fly Control: Facts and Information. Available online at: https://www.terminix.com/other/flies/face-fly/ (accessed December 22, 2022).
Teskey, H. J. (1969). The Canadian entomologist can. Entomol. 101, 561–576. doi: 10.4039/Ent101561-6
Thom, C., Smith, C. J., Moore, G., Weir, P., and Ijaz, U. Z. (2022). Microbiomes in drinking water treatment and distribution: a meta-analysis from source to tap. Water Res. 212, 118106. doi: 10.1016/j.watres.2022.118106
Timmer, H., Magda, L., Wols, B., and Rietveld, L. (2009). CFD-modellering: spreiding verblijftijd in reservoir ongevoelig voor ontwerp. H2O. 42, 32.
Trout Fryxell, R. T., Moon, R. D., Boxler, D. J., and Watson, D. W. (2021). Face fly (Diptera: Muscidae)—biology, pest status, current management prospects, and research needs. J. Integr. Pest Manag. 12, 5. doi: 10.1093/jipm/pmaa020
Urban, J. E., and Broce, A. (2000). Killing of flies in electrocuting insect traps releases bacteria and viruses. Curr. Microbiol. 41, 267–270. doi: 10.1007/s002840010132
van der Kooij, D. (1992). Assimilable organic carbon as an indicator of bacterial regrowth. J. Am. Water Works Assoc. 84, 57–65. doi: 10.1002/j.1551-8833.1992.tb07305.x
van der Kooij, D., Visser, A., and Hijnen, W. (1982). Determining the concentration of easily assimilable organic carbon in drinking water. J. AWWA 74, 540–545. doi: 10.1002/j.1551-8833.1982.tb05000.x
Van Nevel, S., de Roy, D., and Boon, K. N. (2013). Bacterial invasion potential in water is determined by nutrient availability and the indigenous community. FEMS Microbiol. Ecol. 85, 593–603. doi: 10.1111/1574-6941.12145
Vezsenyi, K. A., Langer, S. V., Samkari, B. A., and Beresford, D. V. (2022). The history and current state of cluster flies (Diptera: Polleniidae: Pollenia) in North America, with new Canadian provincial records. Can. Entomol. 154, 1–17. doi: 10.4039/tce.2022.11
Vital, M., Hammes, F., and Egli, T. (2012). Competition of Escherichia coli O157 with a drinking water bacterial community at low nutrient concentrations. Water Res. 46, 6279–6290. doi: 10.1016/j.watres.2012.08.043
VITO. (2020). Compendium voor de monsterneming, meting en analyse van water (WAC) | EMIS [WWW Document]. Available online at: https://emis.vito.be/nl/erkende-laboratoria/water-gop/compendium-wac (accessed May 5, 2022).
Waegenaar, F., Favere, J., Boon, N., and de Gusseme, B. (2021). Online microbial monitoring of drinking water: how do different techniques respond to contaminations in practice? Water Res. 202, 117387. doi: 10.1016/j.watres.2021.117387
Wang, H., Masters, S., Edwards, M. A., Falkinham, J. O., and Pruden, A. (2014). Effect of disinfectant, water age, and pipe materials on bacterial and eukaryotic community structure in drinking water biofilm. Environ. Sci. Technol. 48, 1426–1435. doi: 10.1021/es402636u
Wang, S., Michaud, J. P., Tan, X. L., Zhang, F., and Guo, X. J. (2011). The aggregation behavior of Harmonia axyridis in its native range in Northeast China. BioControl 56, 193–206. doi: 10.1007/s10526-010-9325-7
Wickham, H. (2016). ggplot2: Elegant Graphics for Data Analysis. New York: Springer. doi: 10.1007/978-3-319-24277-4
World Health Organization (2022). Guidelines for drinking-water quality: fourth edition incorporating the first and second addenda, 4th ed + 1st add + 2nd add. ed. World Health Organization, Geneva.
Keywords: drinking water, water towers, overwintering flies, microbial quality, management strategies
Citation: Baele A, Waegenaar F, De Maeyer K, De Gusseme B, Vervaeren H, Spanoghe P and Boon N (2023) Insects in water towers: Hibernating flies could compromise microbial drinking water quality. Front. Water 5:1022271. doi: 10.3389/frwa.2023.1022271
Received: 18 August 2022; Accepted: 25 January 2023;
Published: 14 February 2023.
Edited by:
William Rhoads, Swiss Federal Institute of Aquatic Science and Technology, SwitzerlandReviewed by:
Sihem JEBRI, National Center for Nuclear Science and Technology, TunisiaBenjamin Horemans, KU Leuven, Belgium
Copyright © 2023 Baele, Waegenaar, De Maeyer, De Gusseme, Vervaeren, Spanoghe and Boon. This is an open-access article distributed under the terms of the Creative Commons Attribution License (CC BY). The use, distribution or reproduction in other forums is permitted, provided the original author(s) and the copyright owner(s) are credited and that the original publication in this journal is cited, in accordance with accepted academic practice. No use, distribution or reproduction is permitted which does not comply with these terms.
*Correspondence: Nico Boon,  bmljby5ib29uQHVnZW50LmJl
†These authors have contributed equally to this work and share first authorship