 Luiz Felipe Rezende1*
 Lincoln Alves1Alexandre Augusto Barbosa1Aldo Torres Sales2George Ulguim Pedra1Rômulo Simões Cézar Menezes2Gustavo Felipe Arcoverde1
 Jean Pierre Ometto1
- 1General Coordination of Earth Sciences, National Institute for Space Research (INPE), São José dos Campos, Brazil
- 2Nuclear Energy Department, Federal University of Pernambuco (UFPE), Recife, Brazil
A discussion that has occurred in the scientific community is that despite the increase in the frequency of droughts, the semi-arid world may be increasing the density of vegetation due to fertilization by the increase in atmospheric CO2, a phenomenon called “greening.” Through this study, we sought to evaluate and discuss whether this “greening” would also be occurring in the Brazilian semiarid and what would be its contribution or counterpoint about droughts. Another topic covered was Water Use Efficiency (WUE), about its contribution to mitigating droughts. We chose eight study areas in which the native vegetation was preserved for periods of around 20 years or more. We used data from the Leaf Area Index (LAI), Gross Primary Productivity (GPP), precipitation, evaporation, transpiration, and soil moisture. We divided into two distinct periods to calculate the means of these variables. We applied the Standardized Precipitation Index (SPI) to identify the frequency of droughts for the period from 1961 to 2020. It was observed that between 2001 and 2020, there was an increase in the relative frequency of extreme and exceptional droughts around 19 and 11%, respectively. Our results showed evidence of “greening” for only two sites that were less impacted by droughts, and it seems that the CO2 fertilizer effect could not compensate for the scarcity of water in the other locations of our study. However, WUE was present in almost all sites, which may be a factor in mitigating the impacts of the high frequency of droughts.
1 Introduction
1.1 The Brazilian semi-arid
The Brazilian semiarid region is one of the most populated in the world, with 27 million people (urban and rural population) living in the region, most of them needy and dependent on natural resources and agropastoral activities to survive (MMA, 2010, 2014) (Figure 1A). These activities depend highly on rain and suffer severe setbacks due to climatic adversities and severe drought cycles. The Brazilian semiarid is affected by strong insolation and relatively high temperatures occur (annual averages between 23 and 27°C), rainfall regime marked by scarcity (maximum annual precipitation of 800 mm), average evaporation of 2,000 mm. year−1 and relative humidity of the air around 50% (MMA, 2010), and the average ranges from 54.5 to 60.8% (Moura, 2019). The semi-arid region is crossed by the São Francisco River (Figure 1B), which is used to capture water to supply cities and irrigate crops in an important agricultural production and export hub (grapes, wine, and mango) in Petrolina and surrounding cities (Silva et al., 2022; Souza et al., 2022). The Brazilian Semi-arid has undergone desertification due to the increase of prolonged droughts and uncontrolled burning that favors soil erosion and increases river sediment loads and sedimentation (Swanson, 1981; Pompeu, 2022). As a result, the chemical, physical, and biological characteristics of the soil are altered, further favoring soil erosion, compaction, and loss (Redin et al., 2011), and accelerating soil degradation and the desertification process (Tomasella et al., 2018; Vieira et al., 2023). Based on information from AdaptaBrasil, a platform focused on managing climate change risks and adaptations in Brazil (AdpataBrasil, 2023), the semi-arid region faces significant threats from droughts both currently and in the future decades of 2030s and 2050s. Along with the North region, this area is highly vulnerable in terms of water resource access, while it shares the greatest risks to energy security with the Southern region. Additionally, the Semi-arid region has the country's highest food security risk. In the semi-arid region of northeastern Brazil is located the Caatinga biome which covers 844,453 km2, and this represents 84.44% of the Brazilian semi-arid region than 1.03 million km2 (MMA, 2014). Caatinga biome is extremely important from a biological point of view and its resilience is highlighted: native species lose their leaves during the dry season as a strategy to cope with water loss and they have tolerance to reduced water potential. In relation to atmospheric CO2, the Caatinga acts as a sink, and the native vegetation sequesters around 282 gCm−2 year−1 (Silva et al., 2017).
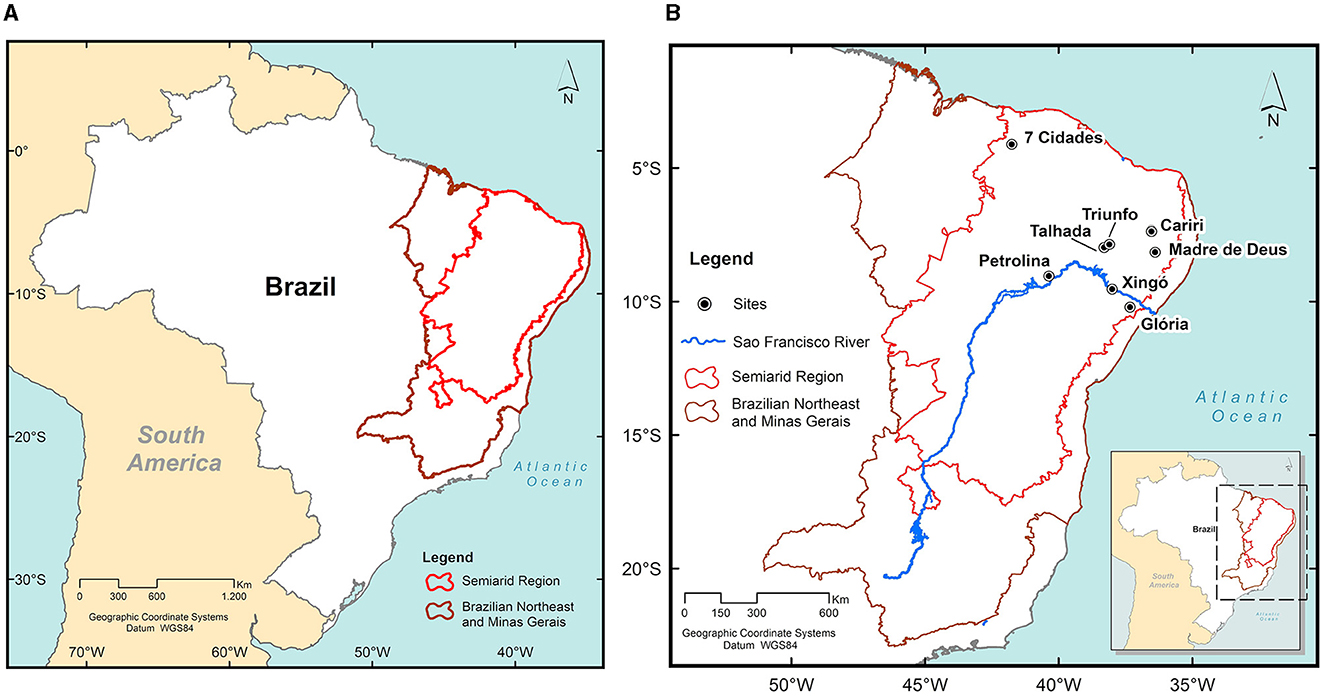
Figure 1. (A) Map of the Brazil, Northeast, and semi-arid regions; (B) Localization of the sites of this study.
1.2 Semi-arid responses to elevated CO2 or greening process
Despite arid regions are expected to be increasing due to global changes, mainly due to decreased precipitation and increased evaporation, some publications have questioned whether this is in fact, occurring in the face of atmospheric CO2 fertilization (Sheffield et al., 2012; Donohue et al., 2013; Santos et al., 2014). An increase in green areas in arid and semi-arid regions on different continents is confirmed by the analysis of satellite images related to the period from 1982 to 2010, despite more prolonged droughts (Donohue et al., 2013). Also, according to Donohue et al. (2013), this can be attributed to the increase in atmospheric CO2 concentration, enabling greater carbon sequestration by plants and less water loss due to the closure of the stomata, thus resulting a greater Water Efficiency Use (WUE). Ponce-Campos et al. (2013) also found higher WUE in drier periods for all biomes studied; and yet, this discovery will imply a conceptual change in the models in the prediction of the limits of resilience of ecosystems. In this way, the models project in this century an increase from arid regions and permanent droughts to most of Africa, southern Europe and the Middle East, the Americas, Australia, and Southeast Asia. The models also predict changes in vegetation productivity, and this should affect food security (related to temperature) (Ponce-Campos et al., 2013).
Another example of increased green areas caused by the fertilizing effect of atmospheric CO2 is reported by Buitenwerf et al. (2012) who showed that tree density doubled over a period from the mid-1990s to 2010 in a semi-arid savanna in South Africa. Lu et al. (2016) relied on 1705 field measurements from 21 distinct locations in the world, a consistent and statistically significant increase in soil water availability (11%) was further observed under elevated CO2 treatments in both dry and non-dry lands, with a stronger response over drylands (17 vs. 9%). Lu et al. (2016) attribute this factor to the efficiency of water use by vegetation at a concentration of elevated atmospheric CO2. Still Gonsamo et al. (2021) emphasize the importance of soil moisture in drylands that become a natural experimental environment to detect the effect of CO2 fertilization on plant growth and the amount of foliage, and photosynthesis is strongly coupled to the limitation of water in the ecosystem. Gonsamo et al. (2021) used 34 years of Leaf Area Index (LAI) and soil moisture (SM) satellite observations over tropical and subtropical regions, identifying that a 1% increase in SM led to 0.15% (±0.008, 95% confidence interval) and 0.51% increments (±0.01, 95% confidence interval) in LAI during 1982–1998 and 1999 to 2015, respectively. The increasing LAI response to SM contributed 7.2% (±3.0%, 95% confidence interval) to total dryland greening during 1999–2015 compared to 1982–1998. Rifai et al. (2021) analyzed 38 years of satellite remote sensing estimates of vegetation greening (normalized difference vegetation index, NDVI) and using multiple techniques to separate the effects of CO2 from others such as water, found that between 1982 and 2019, was an increase in NDVI (median 11.3%) in 90.5% of the woody regions of semi-arid lands in Australia.
However, there are still disagreements among groups discussing carbon sequestration in tropical dry forests (Prince et al., 2007). Rotenberg and Yakir (2010) considered that vegetation in arid areas is unable to mitigate the effect of greenhouse gases. Increased mortality of tree species around the world, especially in moist forests but also occurring in dry forests has been reported by Phillips et al. (2010). The causes of these situations have been discussed, but there is no consensus that can be attributed to the different methodologies applied in experiments and studies (Büntgen and Schweingruber, 2010; Santos et al., 2014). The analysis through the models is not yet robust, because they do not reproduce well the impacts of droughts in semi-arid due to the lack of representation of the processes involved such as the ability of plants to decrease water loss (reducing the opening of the stomata) and increase the efficiency of water use (De Kauwe et al., 2016).
Santos et al. (2014) comment that due to high resilience, the native vegetation of the Caatinga is able to withstand long drought events and high temperatures. They observed this during the drought of 2012–2013 (the most severe in the last 50 years) in which soil moisture in 2012 was close to 0%, and some species such as Poincianela pyramidalis still assimilated around 5 μmol CO2 m−2 s−1 in the morning. The rapid response of this species was recorded in April 2013, after heavy rain, assimilation rose around 32 μmol CO2 m−2 s−1. According to Santos et al. (2014), some species in the Caatinga are capable of enduring long periods of drought due to their ecophysiology.
We think that all the methods and analyses that we have mentioned, with the idea of generalizing as a response that greening is occurring, do not address the edaphoclimatic differences that can occur in regions within the semi-arid region. Thus, regional differences in climate, relief, lithology, temperature, air humidity, radiation, soil type, wind, atmospheric composition, and precipitation are also determinants in ecophysiological processes, and therefore in some points, greening may be observed due to favorable conditions for photosynthetic production, and in others, in totally adverse conditions it will not be observed, even if WUE occurs.
Given these discussions, our question is whether this greening could also be occurring in the Brazilian semi-arid region, even in the face of the increase in the frequency of droughts. Thus, our objectives were to analyze the history of droughts (1961–2020), and we chose some sites that had the native forest preserved for around 20 years to analyze some variables such as Leaf Area Index (LAI) and Water Use Efficiency (WUE) to try to answer this question.
2 Material and methods
2.1 Areas of study
We selected sites based on the preservation of native vegetation for at least the past 20 years. Our choices included areas of environmental preservation, ecological parks, research areas on university campuses, experimental stations, and fields (as shown in Figure 1B and Table 1). Due to this selection criterion, the chosen sites vary significantly in size, and we cannot avoid this difference.
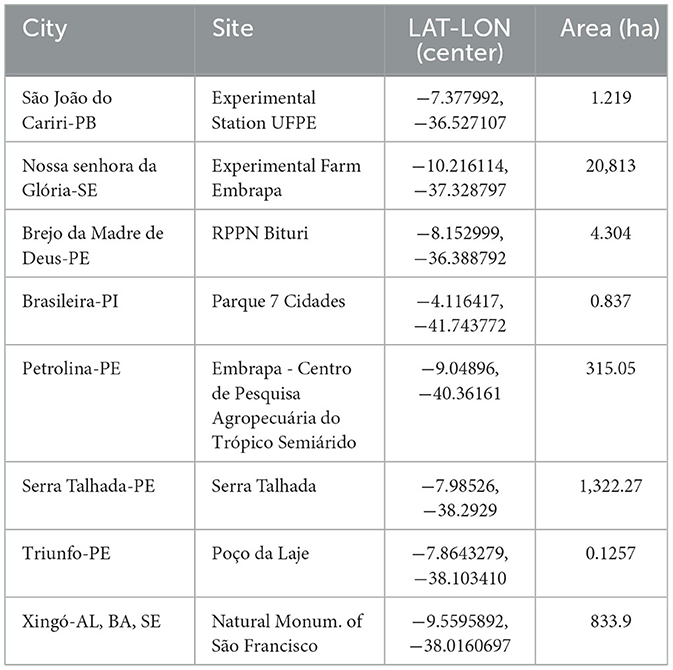
Table 1. Chosen sites.
2.1.1 São João do Cariri – PB – Experimental Station UFPE
The Experimental Station of São João do Cariri is part of the Universidade Federal da Paraíba has ~200 hectares of preserved Caatinga, is located in the driest portion of the Brazilian semi-arid. The site has gently undulating topography with an altitude varying between 400 and 600 m and is located in the physiographic zone of the Borborema Plateau, in the Borborema mesoregion and the Cariri Oriental microregion. The region has a semi-arid climate with summer rains (Köppen classification: Bsh) and a 2b ecoclimate with 9 to 11 dry months predominate, classified as subdesert with a tropical tendency, according to Gaussen's classification. The temperature varies from 27.2°C in November-March to 23.1°C in July (Gomes et al., 2021).
2.1.2 Nossa Senhora da Glória —SE – Experimental Farm EMBRAPA
The Experimental Field of Nossa Senhora da Glória, which is part of the Brazilian Agricultural Research Corporation (EMBRAPA), is situated in the city of Nossa Senhora da Glória in the state of Sergipe. The area spans approximately 266 hectares, with 88 hectares being dedicated to preserving Caatinga. The climate is characterized by dry, hot summers and savanna vegetation (Köppen classification: As), with a flat terrain and an average altitude of 241 meters. The average annual temperature is 24.8°C (EMBRAPA, 2023).
2.1.3 Brejo da Madre de Deus – PE –RPPN Bituri
The Private Reserve of Natural Heritage (RPPN) Farm Bituri is located in the city of Belo Jardim, near the border with the municipality of Brejo da Madre de Deus, both members of the Capibaribe River Basin. The total area is 110.21 ha. The Bituri Farm is inserted in an area of significant forest that deserves highlights: biodiversity, historical heritage, and the presence of a special ecosystem found in the “agreste” and “sertão” of Pernambuco: the swamp of altitude (Bituri, 2023). This site is located in the Agreste physiographic zone of the state of Pernambuco. The relief and vegetation range from depressions, slopes, and steep slopes with altitudes ranging from 438 m in the valleys to 630 m in the mountains. The climate is wet mesothermal, with microclimate restricted to mountains (Köppen classification: Csa). The temperatures range between 31 (in November to December) to 16o C (July to August) (Queiroz et al., 2022).
2.1.4 Brasileira-PI - Parque 7 Cidades
The Sete Cidades National Park is located within the limits of the municipalities of Piracuruca and Brasileira in the state of Piauí and covers an area of 6,221.48 ha. The climate is dry sub-humid, where the relative humidity oscillates between 20 to 50.0% with a short wet and a longer dry season. The annual temperature is above 26oC with an annual amplitude between 2 to 4oC. The vegetation is dominated by a large Cerrado cover, presenting a high and dense shrubby physiognomy accompanied by some arboreal individuals. The herbaceous stratum is abundant both in the dry season and in the rainy season. There are also patches of “cerradão,” floodable open fields, and riparian forests. In addition to cerrado species, there are species of Caatinga and deciduous forest (Mesquita, 2003). The climate is warm and humid (Köppen classification: Aw).
2.1.5 Petrolina-PE – EMBRAPA – Agricultural Research Center of the Semi-arid Tropics
This chosen forest is located at the headquarters of the Brazilian Agricultural Research Corporation (EMBRAPA) - Agricultural Research Center of the Semi-arid Tropics - CPATSA, in Petrolina, Pernambuco. It is an area of around 600 ha of preserved forest that has recovered from degradation that occurred 45 years ago in the Caatinga, whose vegetation is classified as hyperxerophilic Caatinga (EMBRAPA, 2023). The site has a semi-arid climate (Köppen classification: Bsh).
2.1.6 Serra Talhada-PE - Serra Talhada
Serra Talhada is a municipality situated in Pernambuco, with an elevation of 429 meters. Its vegetation comprises hyperxerophilous Caatinga, interspersed with Deciduous Forest areas, and a variety of herbaceous and woody plants, mostly featuring spines, such as cacti and bromeliads (Barbosa et al., 2022). This site is located in the Pajeú River watershed, which is in the center of the state of Pernambuco. The climate is characterized as hot and semi-arid, with summer rains concentrated between December and May (85%) (Köppen classification: BSwh). The average annual precipitation is ~640 mm and the average monthly air temperature varies between 23.1 and 26.7oC, with an annual average of 25.2oC.
2.1.7 Triunfo – PE - Poço da Laje
Poço da Laje is located in the municipality of Triunfo in the state of Pernambuco and its vegetation is Subdeciduous Forest. The site climate is wet mesothermal, microclimate restricted to mountains (Köppen classification: Csa). Relief is mainly undulating and marked by expressive slopes, mostly shallow and blended with rocky conglomerates. On this site, the relief affects the vegetation landscape, which can vary from dense areas to sparser vegetation. The average annual temperature is 25 ± 13.7°C (mean ± standard deviation).
2.1.8 Xingó AL, BA, SE - Natural Monument of the São Francisco
The São Francisco Natural Monument that is located on the borders of the states of Alagoas, Bahia, and Sergipe comprises 26,736 hectares and the vegetation consists of arboreal, shrubby, and rupestrian Caatinga. According to the Köppen classification, the regional climate is BSh, typically semi-arid (Alvares et al., 2013). The annual precipitation pattern is irregular, characterized by years of extreme drought, followed by an occasional year of torrential rains. The mean temperature varies between 23 to 27oC, the mean relative humidity is around 50%. The vegetation of the site is patchy with clumps of woody shrubs and trees with a herbaceous layer beneath.
2.2 Standardized Precipitation Index
We applied the Standardized Precipitation Index (SPI) (McKee et al., 1993; Keyantash and NCAR, 2023). Precipitation-based drought indices, such as the SPI, are based on the following assumptions: precipitation variability is much greater than that of other variables, such as temperature and potential evapotranspiration (PET); and the other variables are stationary (Vicente-Serrano et al., 2010). In the region where we focus our study, the importance of these other variables is of little relevance and droughts are controlled by the temporal variability of precipitation. SPI offers great temporal flexibility. We used a 12-month frequency for 1961–1980, 1981–2000, and 2001–2020 periods. For drought classification by intensity, we adopted the values in Table 2.
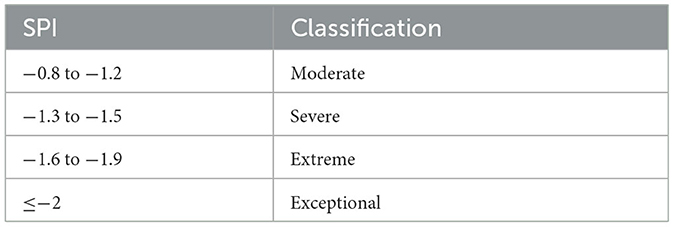
Table 2. Drought classification according to intensity.
The sum (event count) was made, and the relative frequency was calculated (FR):
However, for this work, we used only the extreme and exceptional classifications.
2.3 Variables and tools
We used data from Gross Primary Productivity (GPP), Leaf Area Index (LAI), precipitation (PREC), evaporation (E), transpiration (Et), and soil moisture (SM). We did the format conversion (geotiff to netcdf), data preparation, and calculations of the seasonal averages of the variables (except for precipitation that in addition to the mean was calculated as the sum) for all regions (defined in Table 1). Scripts were developed for the Google Engine Earth (GEE), R, Climate Data Operators (CDO), and Grid Analysis and Display System (GrADS) applications; and for the elaboration of the graphs were used the applications R and Octave.
2.3.1 Gross Primary Productivity and Leaf Area Index
Gross Primary Productivity (GPP) and Leaf Area Index (LAI) were obtained by Google Engine Earth (GEE). GPP is a cumulative 8-day composite with a 500m resolution for the period of 2004–2022; The product is based on the radiation-use efficiency concept and can be potentially used as inputs to data models to calculate terrestrial energy, carbon, water cycle processes, and biogeochemistry of vegetation (Guide Google Engine Earth, 2023).
LAI was obtained from Google Earth Engine (GEE) calculated with the MOD15 algorithm. The 8-day MO[Y]D15A2H compositing algorithm uses a simple selection rule whereby the maximum FPAR, the fraction of incident PAR absorbed by the surface (across the 8 days) is chosen for the inclusion as the output pixel. The same day chosen to represent the FPAR measure also contributes the current pixel's LAI value. This means that although primary productivity is calculated daily, the MOD17 algorithm necessarily assumes that leaf area and FPAR do not vary during a given 8-day period (Guide Google Engine Earth, 2023).
2.3.2 Climatology
We calculated the climatology (precipitation) for the sites of our study (Table 1) using data from the New Improved Brazilian Daily Weather Gridded Data (2000–2020) (Xavier et al., 2016, 2022, in preparation). The calculation was performed by the average of the monthly sums during the entire period (1961–2022). We selected the 3 months of lowest precipitation and the 3 months of highest precipitation for each site in order to define the dry and rainy seasons, respectively.
2.3.3 Evaporation, transpiration, and soil moisture
Evaporation, transpiration, and soil moisture, were obtained by Global Land Evaporation Amsterdam Model 1.2 (GLEAM) which is a set of algorithms that separately estimate the different components of terrestrial evaporation (i.e., “evapotranspiration”) based on satellite observations: transpiration, soil moisture and other evaporation terms that constitute important parts of the hydrological balance in forested regions (Miralles et al., 2010). GLEAM v3.6a: a global dataset spanning the 41 years from 1980 (January 1st) to 2020 (December 31st) available in: https://www.gleam.eu/, accessed in March 24, 2021. The dataset is based on satellite and reanalysis data (ERA5 net radiation and air temperature) (Miralles et al., 2010, 2011a,b; Martens et al., 2016, 2017).
2.3.4 Water Use Efficiency
We calculated Water Use Efficiency (WUE) which can be defined as the gross amount of carbon gained per unit of water lost at the ecosystem level that we made through the equation:
Where GPP is Gross Primary Productivity and Et is vegetation transpiration, WUE (kg C/m2 d−1 mm−1).
As GPP and Et variables from MOD15 and GLEAM3.6, respectively, are in different spatial resolutions, we calculated the mean value of each variable within their respective areas due to their small size (Table 1).
2.3.5 Division of data periods
One of the approaches in our analysis was to divide the series into Period 1: 2005–2013 and Period 2: 2014–2022, thus forming a two-time series of 9 years each. We calculated the average of each of the periods for the variables: LAI, GPP, precipitation (PREC), evaporation (E), transpiration (Et), and soil moisture (SM), and SM was the sum of surface and root soil moisture.
3 Results
In the time frame of 2001–2020, the Brazilian Semi-arid region experienced a notable rise in extreme and exceptional droughts, as indicated by the most relevant findings. Additionally, LAI demonstrated a negative pattern over the years, except for at the Parque 7 Cidades and Triunfo locations where LAI showed an upward trend, despite decreased precipitation. Water Use Efficiency (WUE) consistently exhibited a favorable trend, except for Cariri and Petrolina regions which suffered significant droughts and only saw notable WUE improvements in isolated instances.
3.1 Frequency of droughts
The increase in the frequency of extreme and exceptional droughts for the period 2001–2020, compared to the previous periods: 1961–1980 and 1981–2000 was quite evident in the results in Figure 2. In addition to the increase in the relative frequency of extreme droughts, they also cover a larger region, especially in the states of Pernambuco and Bahia (red square) (Figures 2A–D). The same occurred for the exceptional droughts that reached more intensely the region of the São Francisco River, between the states of Pernambuco and Bahia (red square) (Figures 2E–H). These results strongly suggest that over the years (1961–2020) the increase in the frequency of droughts has occurred quite significantly. One of the most affected localities was Petrolina (number 5 in Figure 2), wherein the period 1961–1980, extreme droughts could have a frequency between 7 and 9% (Figure 2A), in the period 2001–2020, reached between 17 and 19% (Figure 2C); the increase in exceptional droughts also had a significant increase between the two periods, as in 1961–1980, there was no record of exceptional droughts in Petrolina (Figure 2E), and in 2001–2020, the increase between 7 and 9% (Figure 2G). The other sites also affected (although lower in intensity than Petrolina) were Cariri and Glória. Cariri has always had a significant frequency of extreme droughts, between 9 and 11% in the three periods analyzed: 1961–1980, 1981–2000, and 2001–2020. Gloria, however, occurred an increase over time, and in the period 1961–1980, the frequency of droughts was around 3% (Figure 2A), in the period 2001–2020, it reached between 9 and 11%. Regarding exceptional droughts, Petrolina did not record in the period 1961–1980 (Figure 2E); and there is an increase between 5 and 7% in the period 1981–2000 (Figure 2F), and in the period 2001–2020 it reaches between 9 and 11% (Figure 2G). Nor does Gloria record exceptional droughts in the period 1961–1980 (Figure 2E); there is an increase in the period 1981–2000 that is between 1 and 3% (Figure 2F); and in the period 2001–2020, it reaches between 5 and 7% (Figure 2G).
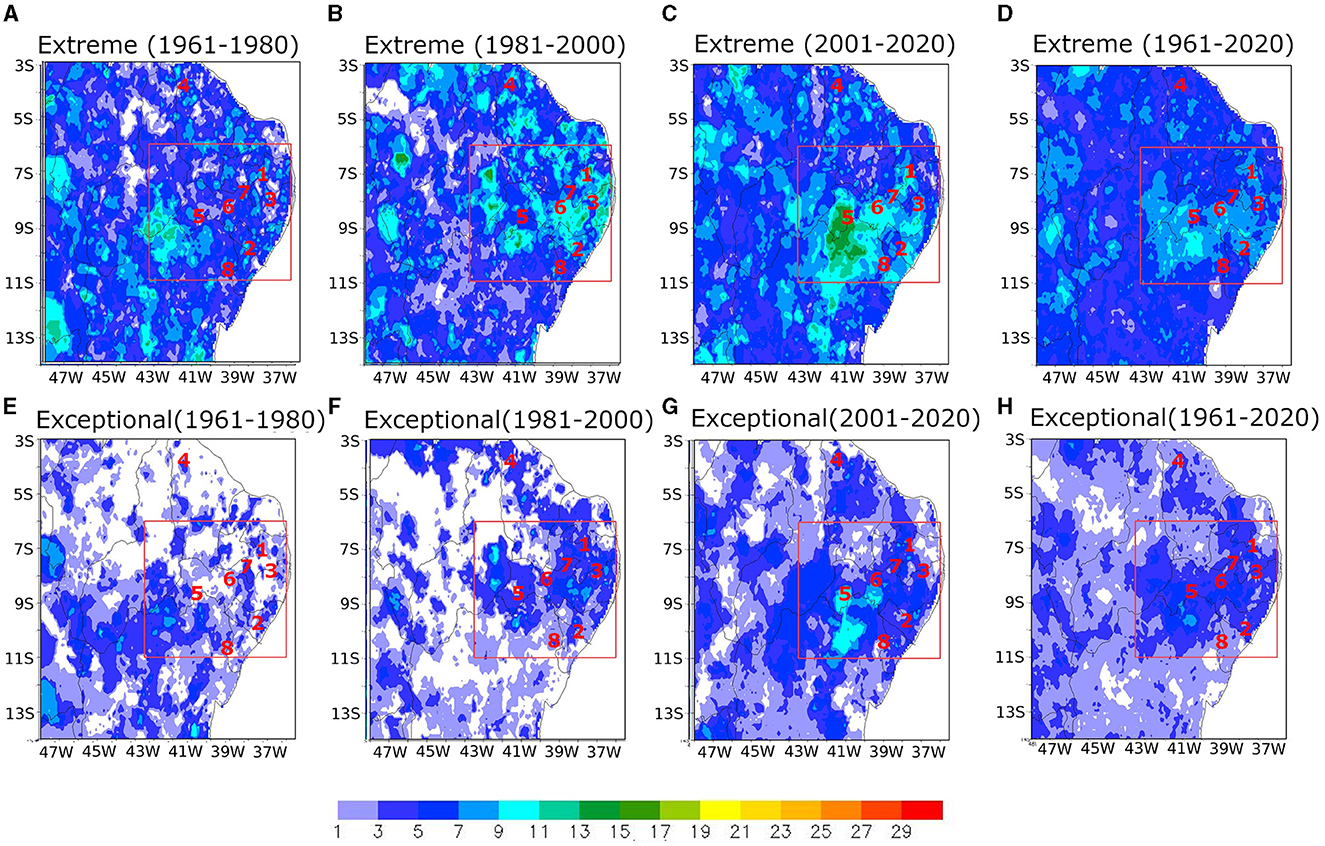
Figure 2. Relative frequencies (%) of extreme and exceptional droughts for the periods 1961–1980, 1981–2000, 2001–2020, and 1961–2020; (A) Extreme (1961–1980), (B) Extreme (1981–2000), (C) Extreme (2001–2020); (D) Extreme (1961–2020); (E) Exceptional (1961–1980); (F) Exceptional (1981–2000); (G) Exceptional (2001–2020); (H) Exceptional (1961–2020); sites: 1. Cariri; 2. Glória; 3. Madre de Deus; 4. Parque 7 Cidades; 5. Petrolina; 6. Serra Talhada; 7. Triunfo, and 8. Xingó – red rectangle: region most affected by droughts that cover the borders between Bahia and Pernambuco.
3.2 Climatology
The results of the calculation of the averages of the monthly sums throughout the period (1961–2022) allowed us to define the dry and rainy seasons for the sites chosen for this work (Figure 3). The site that had the highest rainfall values was Parque 7 Cidades in the months of February-March-April (FMA), and the one that had the lowest precipitation was Cariri in the months of September-October-November (SON). The synthesis of the definitions of the dry and rainy seasons for each site is in Table 3.
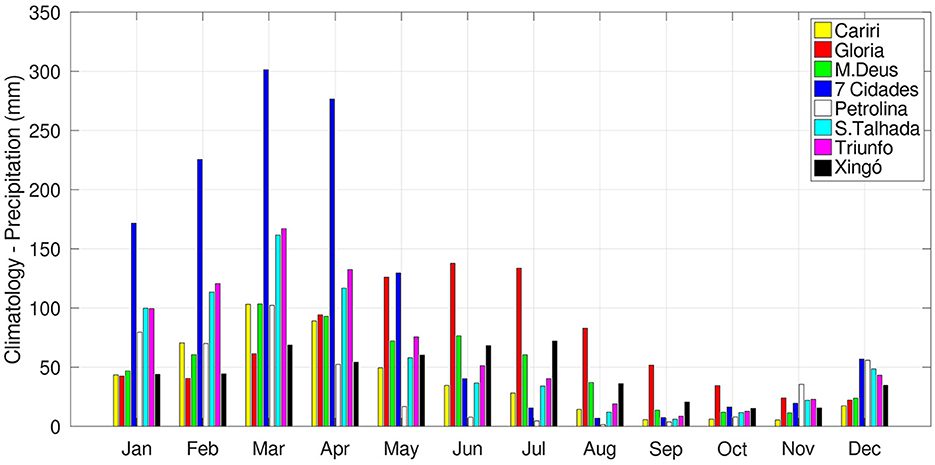
Figure 3. Climatology – precipitation (mm) averages of monthly sums throughout the period (1961–2022).
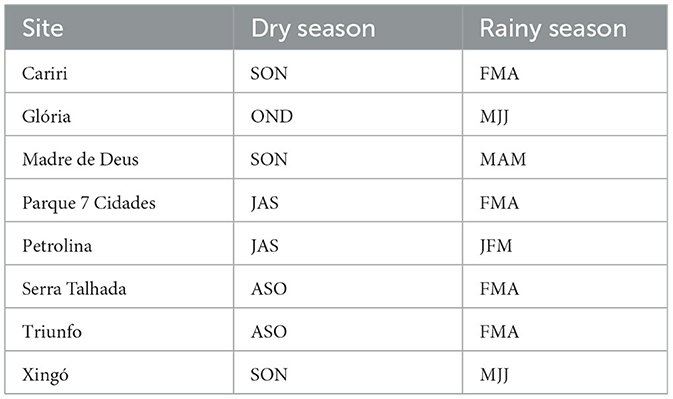
Table 3. Season of the sites – the initial letter of the months.
3.3 Leaf Area Index
We observed a positive trend between LAI x CO2 only for the sites of Parque 7 Cidades in (R2: 0.35 and 0.1, dry and rainy season, respectively) (Figures 4g, h) and Triunfo (R2: 0.50, rainy season) (Figure 4n). We describe it as a positive trend when we observed that there was a higher, which seems to be associated with an increase in the concentration of atmospheric CO2. In the other sites, the trend was negative of LAI in almost all sites and the anti-correlation was more pronounced in Gloria (R2: −0.43, rainy season) (Figure 4d) and Cariri (R2:−0.40, rainy season) (Figure 4b), and Petrolina (R2: −0.33, rainy season).
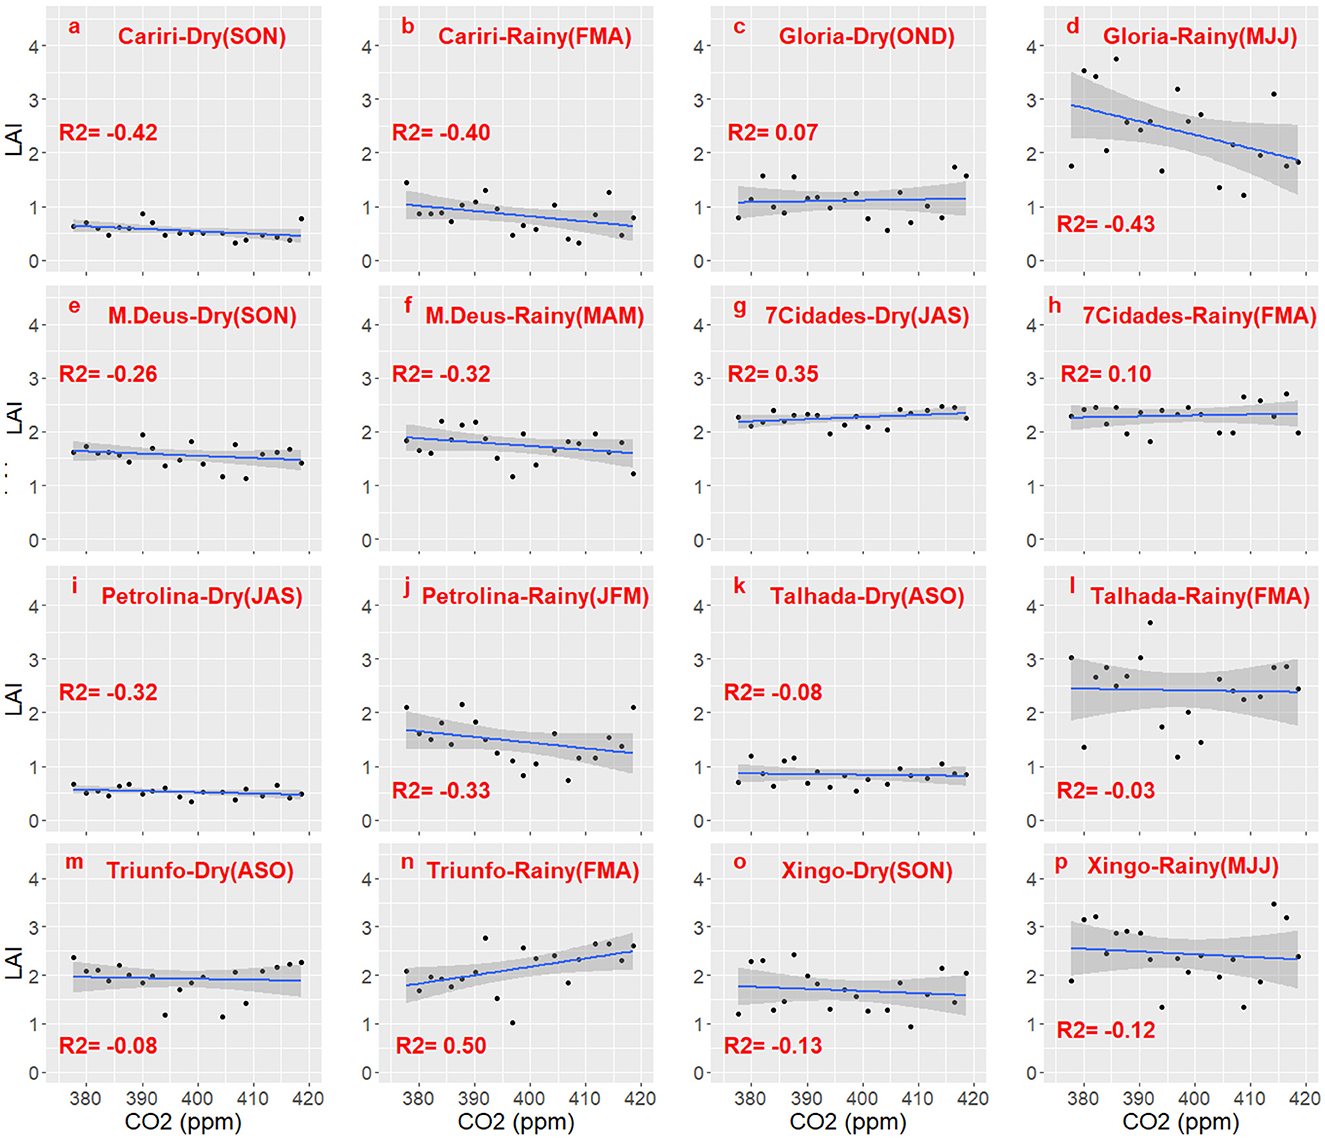
Figure 4. LAI × CO2, LAI (m2 leaf m−2), CO2 (ppm)–shaded area represents the confidence interval (ci = 95%); (a) Cariri–dry season (SON); (b) Cariri–rainy season (FMA); (c) Gloria–dry season (OND); (d) Gloria–rainy season (MJJ); (e) M. Deus–dry season (SON); (f) M. Deus–rainy season (MAM); (g) 7 Cidades–dry season (JAS); (h) 7 Cidades–rainy season (FMA); (i) Petrolina–dry season (JAS); (j) Petrolina–rainy season (JFM); (k) Talhada–dry season (ASO); (l) Talhada–rainy season (FMA); (m) Triunfo–dry season (ASO); (n) Triunfo–rainy season (FMA); (o) Xingó–dry season (SON); (p) Xingó–rainy season (MJJ).
3.4 LAI and precipitation – period 1: 2005–2013, period 2: 2014–2022
After dividing the data into two series defined as period 1 (2005–2013) and period 2 (2014–2022) as described in Section 2.3.5, we calculated the means of LAI and precipitation for each of the periods. We observed that LAI was higher for period 2 (green bar) than for period 1 (blue bar) for the sites of Parque 7 Cidades (dry and rainy seasons) and Triunfo (dry and rainy seasons) (Figure 5A). On the other hand, we found that there was a decrease in precipitation in these two places, there was a decrease (~30 mm) of precipitation in Parque 7 Cidades, in the rainy season; and in Triunfo, there was also a decrease in the dry and rainy seasons (Figure 5B). This result suggests that greening may have occurred in these two sites: Parque 7 Cidades and Triunfo. These results also show that except Petrolina and Xingó (both in the dry season), there was a decrease in precipitation in almost all sites, the most pronounced being in Madre de Deus, in the rainy season, around 50 mm; then Park 7 Cities, in the rainy season, around 30 mm; and in Glória, also in the rainy season, around 25 mm (Figure 5B).
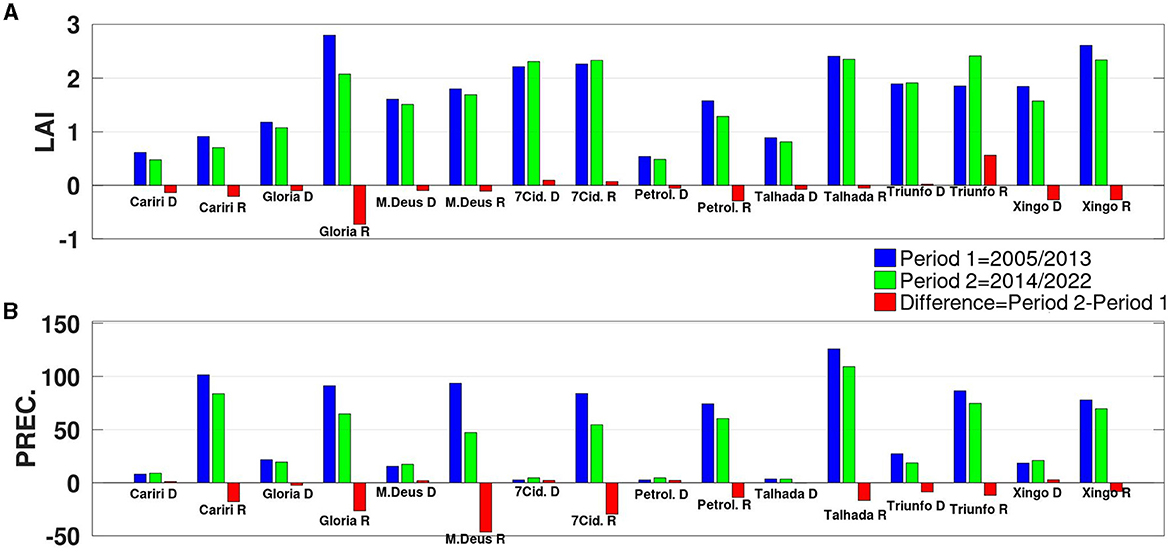
Figure 5. (A) LAI (m2 leaf m−2) and (B) precipitation (mm) for each site by period and difference from periods. D, dry season; R, rainy season.
3.5 Water Use Efficiency
Water Use Efficiency (WUE) had a positive trend in Glória (R2: 0.14; rainy season), Madre de Deus (R2: 0.20 and 0.11; dry and rainy season, respectively), Parque 7 Cidades (R2: 0.20 and 0.24; dry and rainy season, respectively), Petrolina (R2: 0.19; dry season), Serra Talhada (R2: 0.2 and 0.2; dry and rainy season, respectively), Triunfo (R2: 0.20 and 0.29; dry and rainy season, respectively), Xingó (R2: 0.36). There was no positive WUE trend in Cariri (R2: −0.02 and−0.28; dry and rainy season, respectively), and Petrolina (R2: −0.12; rainy season) (Figure 6). However, WUE occurred at several scattered points in Cariri, in the dry season (Figure 6a) and in Petrolina, also in the dry season (Figure 6i).
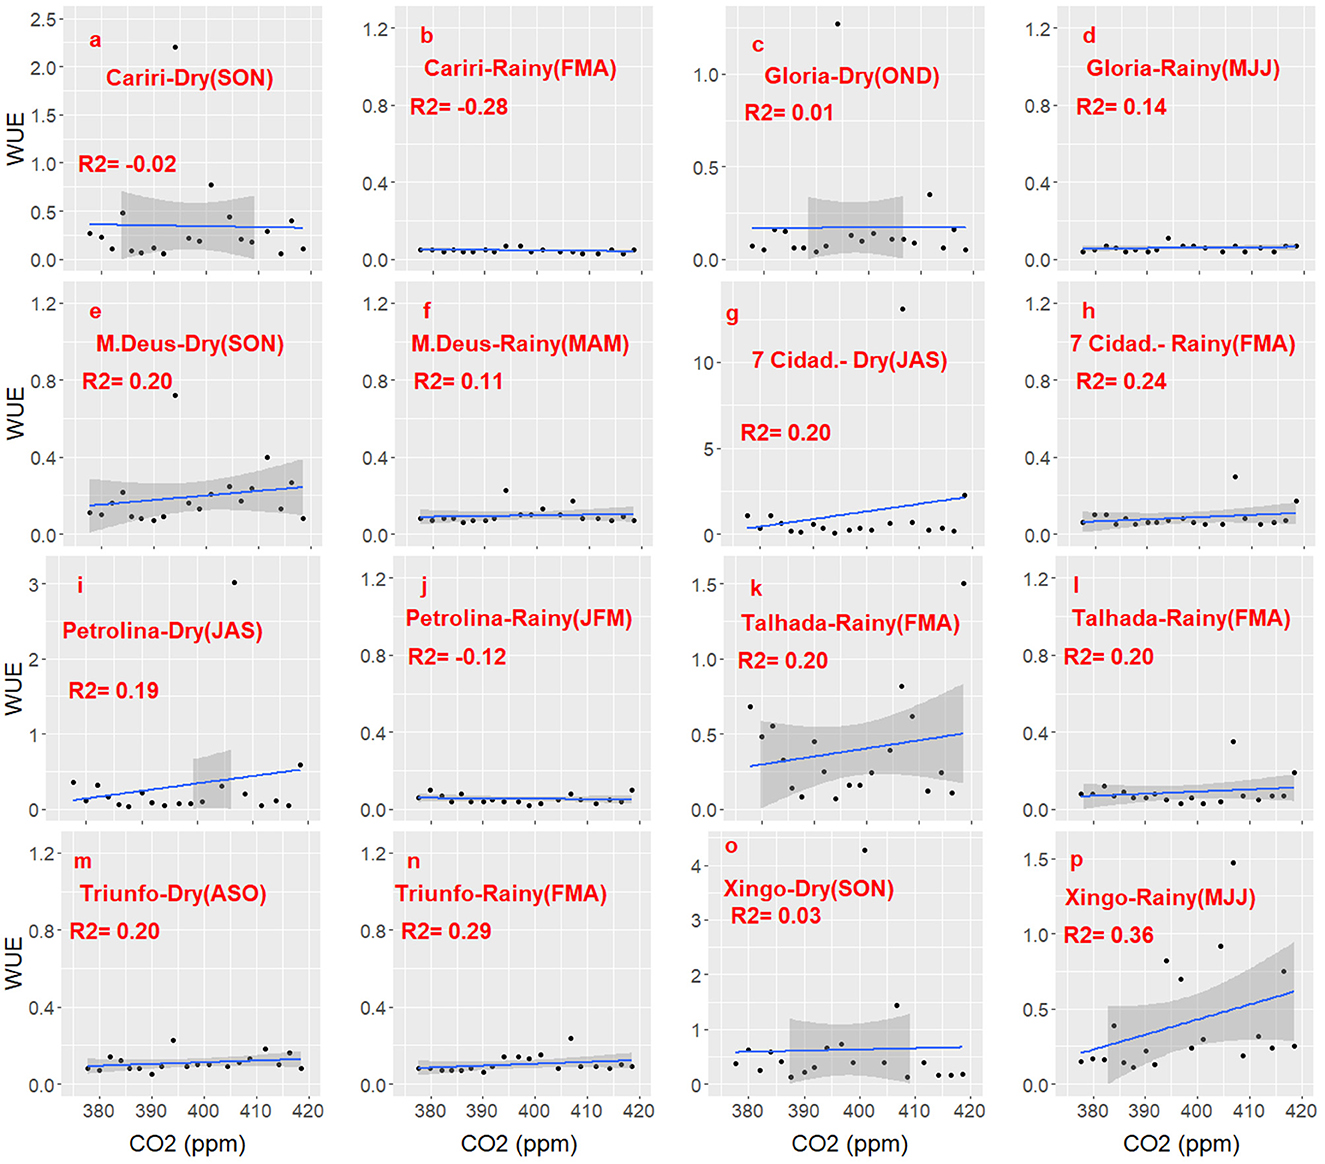
Figure 6. Water Use Efficiency (WUE) (kg C/m2 d−1 mm−1) multiplied by 100, CO2 (ppm) shaded area represents the confidence interval (ci = 95%); (a) Cariri–dry season (SON); (b) Cariri–rainy season (FMA); (c) Gloria–dry season (OND); (d) Gloria–rainy season (MJJ); (e) M. Deus–dry season (SON); (f) M. Deus–rainy season (MAM); (g) 7 Cidades–dry season (JAS); (h) 7 Cidades–rainy season (FMA); (i) Petrolina–dry season (JAS); (j) Petrolina–rainy season (JFM); (k) Talhada–dry season (ASO); (l) Talhada–rainy season (FMA); (m) Triunfo–dry season (ASO); (n) Triunfo–rainy season (FMA); (o) Xingó–dry season (SON); (p) Xingó–rainy season (MJJ).
3.6 Gross Primary Productivity, evaporation, evapotranspiration, and soil moisture
We analyzed the other variables: Gross Primary Productivity (GPP), evaporation (E), transpiration (Et), and soil moisture (SM). The information that stands out is that the highest LAI was observed in the sites Parque 7 Cidades and Triunfo (Figure 4), and in these same sites was observed higher GPP (Figure 7A). In Parque 7 Cidades, in the dry season, GPP is practically the same in periods 1 and 2; whereas in the rainy season, GPP is higher. In Triunfo, in the dry season, the GPP is lower in period 2 compared to period 1, and in the rainy season, the GPP becomes higher in period 2. Regarding evaporation, in Cariri, in the rainy season, period 2 is slightly higher than period 1. Soil moisture was quite low in Parque das 7 Cidades in the dry season (Figure 7D), however, there was still significant productivity (Figure 7A).
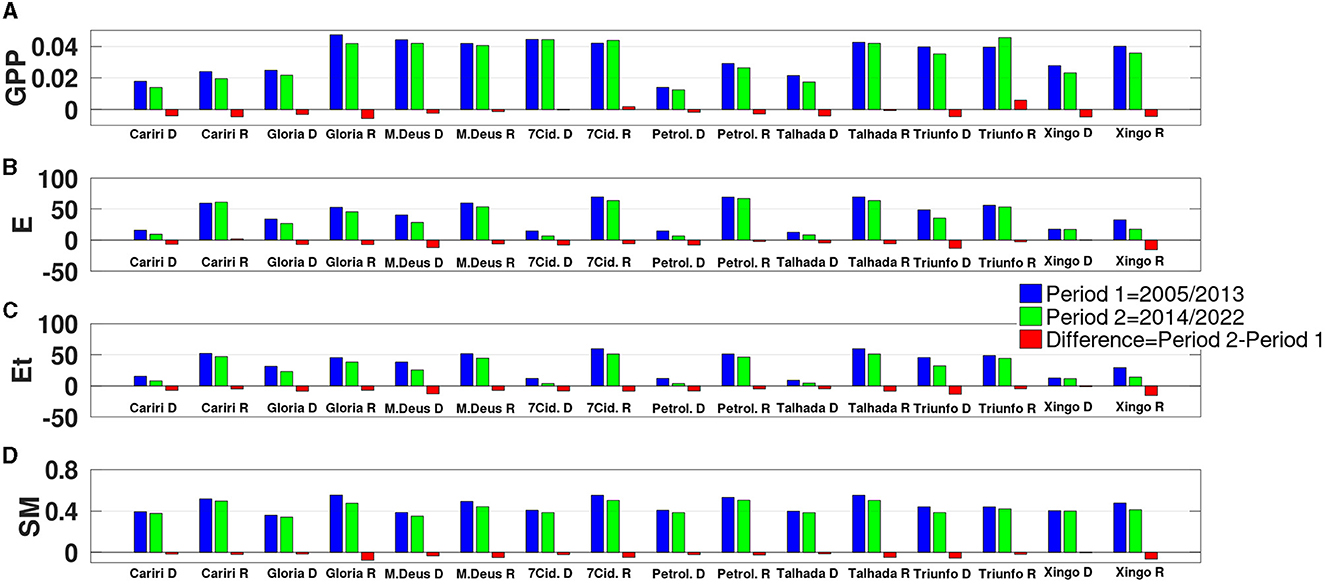
Figure 7. (A) GPP (kg C/m2 d−1); (B) evaporation (E) (mm); (C) transpiration (Et) (mm), and (D) soil moisture (SM) (mm) (sum of surface and root soil moisture). D, dry season; R, rainy season.
In the synthesis of the results (Table 4), we recorded the evidence of greening for the Park of the 7 Cities for the dry and rainy seasons; and also to Triumph in the rainy season. WUE occurred at all sites in the dry season, except for Cariri. In the rainy season, WUE occurred in all sites except Cariri and Petrolina. We observed a decrease in precipitation for the rainy season in all places, and we also observed an increase in precipitation in the dry season for all sites in the dry season, except for Cariri, Xingó. The increase in precipitation in the dry season, with a small difference, occurred in Cariri, Madre de Deus, Parque das 7 Cidades, Petrolina, and Xingó, and in Serra Talhada, there was a balance between the two periods, having a value that approaches zero.
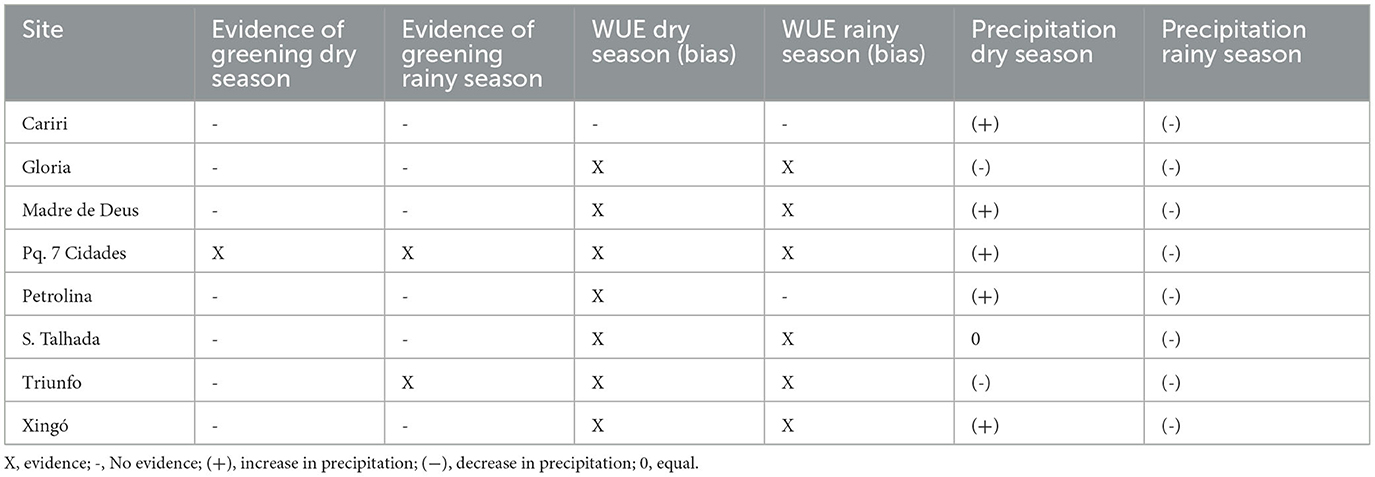
Table 4. Greening, WUE, and precipitation (synthesis).
4 Discussion
The results showed that the last period (2001–2020) was strongly marked by an increase in the frequency of extreme and exceptional droughts in the Brazilian semi-arid region (Figure 2). By verifying that evidence of greening was observed in only two sites, we interpreted that the impact of prolonged and recurrent droughts in this period (2001–2020) did not allow vegetation restoration to previous states, and CO2 fertilization could not add leaf area. What may explain the decrease in vegetation cover may be the high mortality of individuals and this has been observed in other arid and semi-arid regions of the world such as large areas of the southwestern United States, southern Argentina, Kazakhstan, Mongolia, Afghanistan, and regions of Australia (Wang et al., 2022; Wright et al., 2023). Thus, with the occurrence of high mortality rates, there is also a reduction in vegetation production (Brandt et al., 2016; Ma et al., 2016; Fernández-Martínez et al., 2019; Maurer et al., 2020; IPCC AR-6, 2021). In an informal communication from colleagues in fieldwork, they reported a high mortality of individuals in the droughts of 2013 and 2014, at the Embrapa experimental site, in Petrolina-PE. In our results, the LAI decrease trend was significant in four sites: Glória (R2: −0.43, rainy season), Cariri (R2: −0.40, rainy season), Petrolina (R2: −0.33 and −0.32, dry and rainy season, respectively) and Madre de Deus (R2: −0.32 and −0.26, dry and rainy season, respectively) (Figure 4). In addition to atmospheric CO2 fertilization, greening is associated with climate warming and increased Water Use Efficiency (WUE) (Lu et al., 2016; Venter et al., 2018; Gonsamo et al., 2021). In other semi-arid regions in the world, greening has been observed, and these three components were present (IPCC AR-6, 2021). It was not the case in the Brazilian semi-arid region, where in the period 2001–2020, the non-occurrence of greening can be attributed to the increase in the frequency of extreme and exceptional droughts. Despite this, WUE was observed in all sites, except for Cariri, which was most affected by droughts and has the driest climate (Köppen classification: Bsh) among the other sites in our study. This ability to optimize WUE according to environmental variations is a physiological strategy of plants in which they seek to maximize the relationship between the rate of carbon assimilation and the rate of transpiration in the photosynthetic process, i.e., a production with less water loss (regulated by stomatal conductance) (Tonello and Teixeira Filho, 2011). This trait is commonly found in plants that grow in semi-arid regions (Santos et al., 2014). We understand that the WUE has certainly helped mitigate the impact of droughts. However, the current trend is that this resilience may gradually weaken over time, leading to increased soil degradation and accelerated desertification in the already observed Brazilian semi-arid region (Tomasella et al., 2018; Vieira et al., 2023). Also, the sites that had a positive trend in the increase of LAI, such as Parque Sete Cidades and Triunfo have more favorable climatic conditions: warm and humid (Köppen classification: Aw) and wet mesothermal, microclimate restricted to mountains (Köppen classification: Csa), respectively.
Regarding productivity, in the division between the periods (2005–2012, 2014–2022), GPP was slightly higher in the sites of Parque 7 Cidades and Triunfo, which is consistent and favorable to our interpretation of the results that greening was observed in these sites (Figure 7). During the second period (2014–2022), transpiration and soil moisture levels were lower in all sites. However, we cannot solely attribute this to WUE, as it is more likely associated with decreased precipitation in all sites, as shown in Figure 5.
Thus, we observed that only in two sites was greening observed and this is concerning because semi-arid ecosystems are highly sensitive to annual precipitation and play a relevant role in the global carbon cycle, driving trends and interannual variability of the global carbon sink (Poulter et al., 2014; Ahlström et al., 2015; IPCC AR-6, 2021).
5 Conclusion
We found that since 1961, there has never been such a high frequency of droughts in the Brazilian Semi-arid region and a decrease in precipitation as in the last period of our study (2001–2020). We interpret that CO2 fertilization could not compensate for the scarcity of water, however, the trend of increase of LAI was observed in the Parque das 7 Cidades and Triunfo that having occurred a decrease in precipitation in these two localities reinforces the evidence of greening, because the increase could be attributed to CO2 that had a significant increase in this period, in contrast to the decrease in rainfall. We interpret that the increase in the frequency of extreme and exceptional droughts did not allow the Brazilian semi-arid region to follow the greening effects observed in other regions of the world. The Petrolina and Cariri sites that were most affected by the high frequency of droughts, had Water Use Efficiency (WUE) only in a punctual way but did not have a trend of increase in WUE as was observed in the other sites. The observation of WUE in the Brazilian Semi-arid region suggests a relative mitigation of the impact of droughts.
Data availability statement
The raw data supporting the conclusions of this article will be made available by the authors, without undue reservation.
Author contributions
LR: Conceptualization, Data curation, Formal analysis, Investigation, Methodology, Software, Validation, Visualization, Writing – original draft, Writing – review & editing. LA: Conceptualization, Formal Analysis, Methodology, Writing – review & editing. AB: Methodology, Software, Visualization, Writing – review & editing. AS: Conceptualization, Methodology, Writing – review & editing. GP: Software, Validation, Writing – review & editing. RM: Conceptualization, Methodology, Writing – review & editing. GA: Writing – review & editing. JO: Conceptualization, Funding acquisition, Supervision, Writing – review & editing.
Funding
The author(s) declare financial support was received for the research, authorship, and/or publication of this article. JO is grateful to FAPESP-Process: 2017/22269-2 - Nexus Project and CNPq INCT-Process: 444327/2018-5 AdaptaBrasil Project; LR is grateful to CNPq INCT-Process: 300799/2023-3 AdaptaBrasil Project; LA is grateful to FAPESP Process: 2022/08622-0; RM is grateful to CNPq INCT Process: 465764/2014-2, Process: 406202/2022-2, and Facepe APQ-0498-3.07/17 INCT 2014.
Conflict of interest
The authors declare that the research was conducted in the absence of any commercial or financial relationships that could be construed as a potential conflict of interest.
Publisher's note
All claims expressed in this article are solely those of the authors and do not necessarily represent those of their affiliated organizations, or those of the publisher, the editors and the reviewers. Any product that may be evaluated in this article, or claim that may be made by its manufacturer, is not guaranteed or endorsed by the publisher.
References
AdpataBrasil (2023). Ministério de Cência, Tecnologia e Inovação (MCTI), Instittuto Nacional de Pesquisas Espaciais (INPE), Rede Nacional de Ensino e Pesquisa (RNP). AdaptaBrasil MCTI. Available online at: https://adaptabrasil.mcti.gov.br/ (accessed September 15, 2023).
Ahlström, A., Raupach, M. R., Schurgers, G., Smith, B., Arneth, A., Jung, M., et al. (2015). The dominant role of semi-arid ecosystems in the trend and variability of the land CO2 sink. Science 348, 895–899. doi: 10.1126/science.aaa1668
Alvares, C. A., Stape, J. L., Sentelhas, P. C., Gonçalves, J. D. M., and Sparovek, G. (2013). Köppen's climate classification map for Brazil. Meteorol. Zeitschrift 22, 711–728. doi: 10.1127/0941-2948/2013/0507
Barbosa, Â. M. R., de Medeiros, D., da Silva, A. A. V. A., and Júnior, P. P. G. (2022). Levantamento etnobotânico de plantas utilizadas como medicinais por parteiras no município de Serra Talhada–PE. Res. Soc. Dev. 11, e176111334720. doi: 10.33448/rsd-v11i13.34720
Bituri (2023). Available online at: https://www2.cprh.pe.gov.br/wp-content/uploads/2021/02/Plano_manejo_Fazenda_Bituri.pdf (accessed August 21, 2023).
Brandt, M., Hiernaux, P., Rasmussen, K., Mbow, C., Kergoat, L., Tagesson, T., et al. (2016). Assessing woody vegetation trends in Sahelian drylands using MODIS based seasonal metrics. Remote Sens. Environ. 183, 215–225. doi: 10.1016/j.rse.2016.05.027
Buitenwerf, R., Bond, W. J., Stevens, N., and Trollope, W. (2012). Increased tree densities in South African savannas: >50 years of data suggests CO2 as a driver. Global Change Biol. 18, 675–684. doi: 10.1111/j.1365-2486.2011.02561.x
Büntgen, U., and Schweingruber, F. H. (2010). Environmental change without climate change? New Phytol. 188, 646–651. doi: 10.1111/j.1469-8137.2010.03342.x
De Kauwe, D. S., Lin, M. G., Wright, Y. S., Medlyn, I. J., Crous, B. E., Ellsworth, K. Y., et al. (2016). A test of the ‘one-point method'for estimating maximum carboxylation capacity from field-measured, light-saturated photosynthesis. New Phytol. 210, 1130–1144. doi: 10.1111/nph.13815
Donohue, R. J., Roderick, M. L., McVicar, T. R., and Farquhar, G. D. (2013). Impact of CO2 fertilization on maximum foliage cover across the globe's warm, arid environments. Geophys. Res. Letters 40, 3031–3035. doi: 10.1002/grl.50563
EMBRAPA (2023). Available online at: https://www.embrapa.br/semiarido/campos-experimentais (accessed August 21, 2023).
Fernández-Martínez, M., Sardans, J., Chevallier, F., Ciais, P., Obersteiner, M., Vicca, S., et al. (2019). Global trends in carbon sinks and their relationships with CO2 and temperature. Nat. Clim. Change 9, 73–79. doi: 10.1038/s41558-018-0367-7
Gomes, A. C., Andrade, F. H. D. D., Lacerda, A. V. D., and Macêdo, R. O. (2021). Contributions of annual phenological intensity to the production of tannins in sideroxylon obtusifolium in Brazilian semi-arid. Floresta e Amb. 28, e20210027. doi: 10.1590/2179-8087-floram-2021-0027
Gonsamo, A., Ciais, P., Miralles, D. G., Sitch, S., Dorigo, W., Lombardozzi, D., et al. (2021). Greening drylands despite warming consistent with carbon dioxide fertilization effect. Global Change Biol. 27, 3336–3349. doi: 10.1111/gcb.15658
Guide Google Engine Earth (2023). Available online at: https://lpdaac.usgs.gov/documents/495/MOD17_User_Guide_V6.pdf (accessed March 21, 2023).
IPCC AR-6 (2021). Intergovernmental Panel on Climate Change (IPCC) Sixth Assessment Report (AR) Cross-Chapter Paper 3 (CCP3) - Deserts, Semiarid Areas and Desertification, 2021. Geneva: IPCC.
Keyantash, J., and NCAR. (2023). Modified 2023-08-19 “The Climate Data Guide: Standardized Precipitation Index (SPI).” Available online at: https://climatedataguide.ucar.edu/climate-data/standardized-precipitation-index-spi%20on%202023-08-22on2023-08-22 (accessed August 22, 2023).
Lu, X., Wang, L., and McCabe, M. F. (2016). Elevated CO2 as a driver of global dryland greening. Sci. Rep. 6, 20716. doi: 10.1038/srep20716
Ma, J., Hung, H., and Macdonald, R. W. (2016). The influence of global climate change on the environmental fate of persistent organic pollutants: a review with emphasis on the Northern Hemisphere and the Arctic as a receptor. Global Planetar. Change 146, 89–108. doi: 10.1016/j.gloplacha.2016.09.011
Martens, B., Miralles, D. G., Lievens, H., Fernández-Prieto, D., and Verhoest, N. E. C. (2016). Improving terrestrial evaporation estimates over continental Australia through assimilation of SMOS soil moisture. Int. J. Appl. Earth Obs. Geoinf. 48, 146–162.
Martens, B., Miralles, D. G., Lievens, H., van der Schalie, R., de Jeu, R. A. M., Fernández-Prieto, D., et al. (2017). GLEAM v3: satellite-based land evaporation and root-zone soil moisture. Geosci. Model Dev. 10, 1903–1925.
Maurer, G. E., Hallmark, A. J., Brown, R. F., Sala, O. E., and Collins, S. L. (2020). Sensitivity of primary production to precipitation across the United States. Ecol. Lett. 23, 527–536. doi: 10.1111/ele.13455
McKee, T. B., Doesken, N. J., and Kleist, J. (1993). The relationship of drought frequency and duration to time scales. Am. Meteorol. Soc. Boston 17, 179–184.
Mesquita, M. R. (2003). Florística e fitossociologia de uma área de Cerrado Marginal (Cerrado baixo) do Parque Nacional de Sete Cidades, Piauí. Dissertação apresentada ao Programa de Pós–Graduação em Biologia Vegetal da Universidade Federal de Pernambuco. Available online at: https://repositorio.ufpe.br/bitstream/123456789/704/1/arquivo4497_1.pdf (accessed August 21, 2023).
Miralles, D. G., Gash, J. H., Holmes, T. R., De Jeu, R. A. M., and Dolman, A. J. (2010). Global canopy interception from satellite observations. J. Geophys. Res. Atmosphere. 115, D16. doi: 10.1029/2009JD013530
Miralles, D. G., Holmes, T. R. H., De Jeu, R. A. M., Gash, J. H., Meesters, A. G. C. A., and Dolman, A. J. (2011a). Global land-surface evaporation estimated from satellite-based observations. Hydrol. Earth Syst. Sci. 15, 453–469. doi: 10.5194/hess-15-453-2011
Miralles, D. G., Holmes, T. R. H., De Jeu, R. A. M., Gash, J. H., Meesters, A. G. C. A., and Dolman, A. J. (2011b). Magnitude and variability of land evaporation and its components at the global scale. Hydrol. Earth Syst. Sci. 15, 967–981. doi: 10.5194/hess-15-967-2011
MMA (2010). Uso sustentável e conservação dos recursos florestais da CAATINGA. Santaré: Serviço Florestal Brasileiro
MMA (2014). Available online at: http://www.mma.gov.br/biomas/caatinga (accessed June 16, 2023).
Moura, M. S. B. (2019). Aspectos Meteorológicos do Semiárido Brasileiro. Capítulo em Livro Técnico-Científico. Available online at: https://ainfo.cnptia.embrapa.br/digital/bitstream/item/209739/1/Aspectos-meteorologicos-do-Semiarido-brasileiro-2019.pdf (accessed October 24, 2023).
Phillips, O. L., Van Der Heijden, G., Lewis, S. L., López-González, G., Aragão, L. E., Lloyd, J., and Vilanova, E. (2010). Drought–mortality relationships for tropical forests. New Phytol. 187, 631–646. doi: 10.1111/j.1469-8137.2010.03359.x
Pompeu, J. (2022). Performance of an automated conservation status assessment for the megadiverse vascular flora of Brazil. J. Nat. Conserv. 70, 126272. doi: 10.1016/j.jnc.2022.126272
Ponce-Campos, G. E., Moran, M. S., Huete, A., Zhang, Y., Bresloff, C., Huxman, T. E., et al. (2013). Ecosystem resilience despite large-scale altered hydroclimatic conditions. Nature 494, 349–352. doi: 10.1038/nature11836
Poulter, B., Frank, D., Ciais, P., Myneni, R. B., Andela, N., Bi, J., et al. (2014). Contribution of semi-arid ecosystems to interannual variability of the global carbon cycle. Nature 509, 600–603. doi: 10.1038/nature13376
Prince, S. D., Wessels, K. J., Tucker, C. J., and Nicholson, S. E. (2007). Desertification in the Sahel: a reinterpretation of a reinterpretation. Global Change Biol. 13, 1308–1313. doi: 10.1111/j.1365-2486.2007.01356.x
Queiroz, A. N., de Carvalho, O. A., and Pinto, R. R. (2022). 7 nonhuman primates in the archaeological record of northeastern Brazil. World Archaeoprimatol. Interconnections Hum. Nonhum. Primat. Past 90, 172 doi: 10.1017/9781108766500.010
Redin, M., Santos, G. D. F. D., Miguel, P., Denega, G. L., Lupatini, M., Doneda, A., et al. (2011). Impactos da queima sobre atributos químicos, físicos e biológicos do solo. Ciência Florestal 21, 381–392. doi: 10.5902/198050983243
Rifai, S. W., De Kauwe, M. G., Ukkola, A. M., Cernusak, L. A., Meir, P., Medlyn, B. E., and Pitman, A. J. (2021). Thirty-eight years of CO2 fertilization have outpaced growing aridity to drive greening of Australian woody ecosystems. Biogeosciences 19, 491–515. doi: 10.5194/bg-19-491-2022
Rotenberg, E., and Yakir, D. (2010). Contribution of semi-arid forests to the climate system. Science 327, 451–454. doi: 10.1126/science.1179998
Santos, M. G., Oliveira, M. T., Figueiredo, K. V., Falcao, H. M., Arruda, E. C., Almeida-Cortez, J., et al. (2014). Caatinga, the Brazilian dry tropical forest: can it tolerate climate changes?. Theor. Exp. Plant Physiol. 26, 83–99. doi: 10.1007/s40626-014-0008-0
Sheffield, J., Wood, E. F., and Roderick, M. L. (2012). Little change in global drought over the past 60 years. Nature 491, 435–438. doi: 10.1038/nature11575
Silva, J. L. B., Bezerra, A. C., de Albuquerque Moura, G. B., Jardim, A. M. D. R. F., Batista, P. H. D., and de Jesus, F. L. F. (2022). Spatiotemporal dynamics of agricultural areas with central pivot using orbital remote sensing in the Brazilian semiarid. Smart Agric. Technol. 2, 100052. doi: 10.2139/ssrn.4001351
Silva, P. F., de Sousa Lima, J. R., Antonino, A. C. D., Souza, R., de Souza, E. S., Silva, J. R. I., and Alves, E. M. (2017). Seasonal patterns of carbon dioxide, water and energy fluxes over the Caatinga and grassland in the semi-arid region of Brazil. J. Arid Environ. 147, 71–82. doi: 10.1016/j.jaridenv.2017.09.003
Souza, C. G. P., Rodrigues, M. S., da Silva, K. A., Lira, A. L. F., Moreira, F. B. R., and Lima, A. M. N. (2022). Precision agriculture tools for liming management in mango orchards in the Brazilian semiarid region. Comun. Sci. 13, e3630. doi: 10.14295/cs.v13.3630
Tomasella, J., Vieira, R. M. S. P., Barbosa, A. A., Rodriguez, D. A., de Oliveira Santana, M., and Sestini, M. F. (2018). Desertification trends in the Northeast of Brazil over the period 2000–2016. Inte. J. Appl. Earth Obs. Geoinf. 73, 197–206. doi: 10.1016/j.jag.2018.06.012
Tonello, K. C., and Teixeira Filho, J. (2011). Environmental variables effects in ecophysiological behavior of two clones of Eucalyptus grandis× Eucalyptus urophylla: field conditions. Sci. Forestalis 39, 419–431. doi: 10.13140/2.1.4913.7283
Venter, Z. S., Cramer, M. D., and Hawkins, H. J. (2018). Drivers of woody plant encroachment over Africa. Nat. Commun. 9, 2272. doi: 10.1038/s41467-018-04616-8
Vicente-Serrano, S. M., Beguería, S., and López-Moreno, J. I. (2010). A multiscalar drought index sensitive to global warming: the standardized precipitation evapotranspiration index. J. Clim. 23, 1696–1718. doi: 10.1175/2009JCLI2909.1
Vieira, R. M. D. S. P., Tomasella, J., Cunha, A. P. M. D. A., Barbosa, A. A., Pompeu, J., Ferreira, Y., et al. (2023). Socio-environmental vulnerability to drought conditions and land degradation: an assessment in two northeastern brazilian river basins. Sustainability 15, 8029. doi: 10.3390/su15108029
Wang, L., Jiao, W., MacBean, N., Rulli, M. C., Manzoni, S., Vico, G., et al. (2022). Dryland productivity under a changing climate. Nat. Clim. Change 12, 981–994. doi: 10.1038/s41558-022-01499-y
Wright, B. R., Nipper, M., Nipper, N., Merson, S. D., and Guest, T. (2023). Mortality rates of desert vegetation during high-intensity drought at Ulu ru-Kata Tju ta National Park, Central Australia. Austr. Ecol. 2023, 1–20. doi: 10.1111/aec.13290
Xavier, A. C., King, C. W., and Scanlon, B. R. (2016). Daily gridded meteorological variables in Brazil (1980–2013). Int. J. Climatol. 36, 2644–2659. doi: 10.1002/joc.4518
Keywords: Leaf Area Index (LAI), Gross Primary Productivity (GPP), Standardized Precipitation Index (SPI), carbon sink, Caatinga, Water Use Efficiency (WUE), greening, semi-arid
Citation: Rezende LF, Alves L, Barbosa AA, Sales AT, Pedra GU, Menezes RSC, Arcoverde GF and Ometto JP (2023) Greening and Water Use Efficiency during a period of high frequency of droughts in the Brazilian semi-arid. Front. Water 5:1295286. doi: 10.3389/frwa.2023.1295286
Received: 15 September 2023; Accepted: 14 November 2023;
Published: 21 December 2023.
Edited by:
André Rodrigues, Federal University of Minas Gerais, BrazilReviewed by:
Kelly Cristina Tonello, Federal University of São Carlos, BrazilLisheng Song, Anhui Normal University, China
Copyright © 2023 Rezende, Alves, Barbosa, Sales, Pedra, Menezes, Arcoverde and Ometto. This is an open-access article distributed under the terms of the Creative Commons Attribution License (CC BY). The use, distribution or reproduction in other forums is permitted, provided the original author(s) and the copyright owner(s) are credited and that the original publication in this journal is cited, in accordance with accepted academic practice. No use, distribution or reproduction is permitted which does not comply with these terms.
*Correspondence: Luiz Felipe Rezende, bHVpemZlbGlwZXJlemVuZGVAZ21haWwuY29t